

Abstract
Background:
Organophosphate esters (OPEs) are used as flame retardants and plasticizers in various consumer products. Limited prior research suggests sex-specific effects of prenatal OPE exposures on fetal development. We evaluated overall and sex-specific associations between prenatal OPE exposures and gestational age (GA) at birth and birthweight for gestational age (BW for GA) z-scores among the predominately low-income, Hispanic MADRES cohort.
Methods:
Nine OPE metabolite concentrations were measured in 421 maternal urine samples collected during a third trimester visit (GA=31.5±2.0 weeks). We examined associations between single urinary OPE metabolites and GA at birth and BW for GA z-scores using linear regression models and Generalized Additive Models (GAMs) and effects from OPE mixtures using Bayesian Kernel Machine Regression (BKMR). We also assessed sex-specific differences in single metabolite analyses by evaluating statistical interactions and stratifying by sex.
Results:
We did not find significant associations between individual OPE metabolites and birth outcomes in the full infant sample; however, we found that higher bis(1,3-dichloro-2-propyl) phosphate (BDCIPP) was associated with earlier GA at birth among male infants (p=0.04), and a nonlinear, inverted U-shape association between the sum of dibutyl phosphate and di-isobutyl phosphate (DNBP+DIBP) and GA at birth among female infants (p=0.03). In mixtures analysis, higher OPE metabolite mixture exposures was associated with lower GA at birth, which was primarily driven by female infants. No associations were observed between OPE mixtures and BW for GA z-scores.
Conclusion:
Higher BDCIPP and DNBP+DIBP concentrations were associated with earlier GA at birth among male and female infants, respectively. Higher exposure to OPE mixtures was associated with earlier GA at birth, particularly among female infants. However, we saw no associations between prenatal OPEs and BW for GA. Our results suggest sex-specific impacts of prenatal OPE exposures on GA at birth.
Keywords: Mixtures, OPEs, OPFRs, Birth Outcomes, BKMR
1. Introduction
Infant birth outcomes, such as gestational age (GA) at birth and birthweight, are important indicators of infant health and strong predictors of child neurodevelopment, obesity, and other cardiometabolic conditions.1–5 Adverse birth outcomes, including preterm birth and low birthweight, disproportionately impact communities of color who are also more likely to experience a higher burden of environmental chemical exposures.6–8 Accumulating epidemiological evidence stresses the potential for in utero environmental endocrine disrupting chemicals to adversely impact infant birth outcomes.9–11 Emerging literature suggests that organophosphate esters (OPEs) are a class of endocrine disrupting chemicals.12–14
OPEs have increased in use as alternative flame-retardants to replace polybrominated diphenyl ethers (PBDEs) which were phased out due to bioaccumulation and neurotoxicity concerns.15 However, OPEs are also commonly used as plasticizers and lubricants, contributing to their environmental ubiquity.16,17 OPEs are found in a variety of consumer, industrial, and electronic products, including clothing, polyurethane foams, textiles, and building materials.15,18,19 Since OPEs are physically bound with a product matrix rather than chemically bound, they easily volatize and leach into surrounding environments during product use, settling into numerous environmental matrices (i.e., soil, surface water, sediment, and agricultural products) and dust particles in indoor environments, and enter the body through inhalation, dermal contact, and ingestion via dietary intake of OPE-contaminated food and drinking water.20–26 Emerging literature indicates widespread exposure to OPEs among the general population, with high detection (>95%) of metabolites such as diphenyl phosphate (DPHP; parent compound= triphenyl phosphate (TPHP)) and bis(1,3-dichloro-2-propyl) phosphate (BDCIPP; parent compound= tris(1,3-dichloropropyl) (TDCIPP)) in urine.18,27 Widespread OPE metabolite concentrations have also recently been observed among vulnerable populations, including pregnant women.27–32 Since OPEs have been found in the chorionic villi and uterine decidua of the placenta and amniotic fluid, suggesting in utero transfer of OPEs to the fetus,33–36 there is a growing concern regarding exposures to these substances during critical periods of development.
Animal and in-vitro toxicological studies have reported adverse reproductive outcomes and early growth and development effects, including decreased birthweight, from OPE exposures.37–42 However, no toxicological research has been conducted on the effects of OPEs on gestational duration and preterm birth. Hypothesized biological mechanisms include endocrine disruption, oxidative stress, and placental alterations.34,38,39,43–51
Limited epidemiological studies have explored the potential impacts of prenatal exposures to OPEs on infant birth outcomes, but the small number of studies that have been conducted have reported sex-specific effects on pre-term birth and low birthweight.52,53 Additionally, most of the epidemiological literature on OPEs and infant birth outcomes has evaluated the effects of two OPE metabolites, DPHP and BDCIPP, in single chemical analyses, resulting in a limited understanding of the impacts of other OPEs on birth outcomes and their joint health effects. Furthermore, impacts of OPEs among structurally marginalized populations, such as Hispanic pregnant women, have been understudied.18 This is of concern given the increasing use of OPEs and the ubiquity of exposures.27
In this study, we evaluated the prenatal impacts of nine OPE metabolites individually and in mixtures on infant GA at birth and BW for GA among 421 mother-infant dyads participating in the Maternal And Developmental Risks from Environmental and Social Stressors (MADRES) cohort study. Given prior toxicological and epidemiological evidence suggesting adverse OPE impacts on birth outcomes, with more pronounced impacts among female infants,38,52,53 we hypothesized that higher exposure to both single OPE metabolites and mixtures would result in earlier GA at birth and lower BW for GA, particularly among female infants.
2. Materials and Methods
2.1. Study Sample
The MADRES study is an ongoing prospective pregnancy cohort of predominately low-income Hispanic/Latina women living in urban Los Angeles. A detailed description of the MADRES study population and protocol has been previously described.54 In brief, participants were recruited into the study at three partner community health clinics, one private obstetrics and gynecology practice in Los Angeles, and through limited self-referrals from community meetings and local advertisements. Eligible participants at the time of recruitment were: (1) less than 30 weeks’ gestation, (2) over 18 years of age or older, and (3) fluent speaker of English or Spanish. Exclusion criteria included: (1) multiple gestation, (2) having a physical, mental, or cognitive disability that prevented participation or ability to provide consent, (3) current incarceration, and (4) HIV positive status. Written informed consent was obtained at study entry for each participant and the study was approved by the University of Southern California’s Institutional Review Board.
Participants included in this analysis were recruited from November 2015 to October 2019. OPE metabolite concentrations were measured in all available MADRES participants’ spot urine specimens collected during the third trimester study visit (N=426, mean ± SD gestational age at collection: 31.5 weeks±2.0 weeks). Five mother-infant dyads with missing information on key covariates or birth outcomes were excluded from the final analysis. A total of 421 mother-infant dyads with OPE metabolite concentrations, birth outcomes data, and information on key covariates were analyzed in this study. This subset of 421 participants from the MADRES cohort was similar to the full cohort on key demographic characteristics.
2.2. OPE Metabolite Analysis
Maternal single spot urine samples were collected in 90 mL sterile specimen containers. Urine specimens were aliquoted into 1.5 mL aliquot cryovials and stored at −80 °C prior to shipment. Specific gravity was measured in urine samples prior to flash freezing using a digital handheld refractometer (ATAGO PAL-10s pocket refractometer). Frozen samples were sent to the Wadsworth Center Human Health Exposure Analysis Resource (HHEAR) for the analysis of the following nine OPE metabolites: diphenyl phosphate (DPHP), sum of dibutyl phosphate and di-isobutyl phosphate (DNBP + DIBP), bis(1,3,-dichloro-2-propyl) phosphate (BDCIPP), bis(2-chloroethyl) phosphate (BCEP), bis(butoxethyl) phosphate (BBOEP), bis(1-chloro-2-propyl) phosphate (BCIPP), bis(2-ethylhexyl) phosphate (BEHP), bis(2-methylphenyl) phosphate (BMPP), and dipropyl phosphate (DPRP). Additional information on the analyzed metabolites, their corresponding parent compounds, and common applications are described in Table S1.
The nine OPE metabolites were analyzed following methods similar to those described elsewhere with some modifications.26 Briefly, urine samples (0.5 mL) were aliquoted into pre-baked glass tubes and spiked with 1 ng of deuterated internal standard (IS) mixtures of OPEs and 1 mL of 10 mM ammonium acetate buffer (pH 5). The samples were passed through solid phase extraction (SPE) cartridges (STRATA-X-AW: 60 mg, 3cc, Phenomenex, Torrance, CA, USA) which were conditioned by successive passage with 2 mL of 5% (v/v) ammonia/methanol, 2 mL of methanol, and 2 mL of water. The samples were loaded with the valves partially opened. The SPE cartridges were then dried under vacuum for 3 min after washing with 1.0 mL of water. Analytes were eluted with 2 times 0.5 mL of 5% (v/v) ammonia/methanol, concentrated under a gentle stream of nitrogen at 37 °C to near dryness, and reconstituted with 0.1 mL of acetonitrile.
High-performance liquid chromatography (HPLC, ExionLC™ system; SCIEX, Redwood City, CA, USA), coupled with an AB SCIEX QTRAP 5500+ triple quadrupole mass spectrometer (Applied Biosystems, Foster City, CA, USA), was used in the identification and quantification of target compounds. Nine OPE diester metabolites and corresponding 9 internal standards were separated by a Kinetex HILIC column (100 mm × 2.1 mm, 2.6 μm particle size; Phenomenex) serially connected to a Betasil C18 guard column (20 mm × 2.1 mm, 5 μm particle size; Thermo Scientific). The analytes were quantified by isotopic dilution method and an 11-point calibration curve (at concentrations ranging from 0.02 to 50 ng/mL) with the regression coefficient ≥ 0.998. Matrix spikes (synthetic and urine pool spiked with 1 ng of native standards and 1 ng of internal standards) were analyzed with real samples as quality control (QC) samples. For each batch of samples, replicates of reagent blanks, matrix blanks, and matrix spiked samples were processed. Replicates of HHEAR Urine Quality Control (QC) Pools Standard Reference Materials (SRM3672 and SRM3673, NIST, Gaithersburg, MD, USA) were analyzed with every batch of samples. Trace levels of all OPE diester metabolites were found in procedural blanks. OPE diester metabolite concentrations in samples were subtracted from their respective blank values. Matrix spiked samples had average recoveries of 70.4–133% (CV: ±9–19%). Repeated analysis of HHEAR Urine QC Pools A and B among batches showed coefficients of variation of ±12–31% and ±12–30% respectively. SRM3672 and SRM3673 had coefficients of variation of ±12–40% and ±12–27% respectively. The limit of detection (LOD) of target analytes ranged from 0.012 to 0.0441 ng/mL. Of note, due to the poor chromatographic separation and co-elution of peaks accompanying a similar mass transition for DNBP and DIBP in our mass spectrometer, a sum concentration for the metabolites of dibutyl phosphate and di-isobutyl phosphate (DNBP + DIBP) was analyzed in this study.
OPE metabolites with levels below the LOD were imputed using the LOD/√2.55 Metabolites were then specific gravity (SG) adjusted using the following standardization formula similarly used in prior OPE literature among other pregnancy cohorts: Pc=P[(SGm-1)/(SG-1)], where Pc is the specific gravity corrected toxicant concentration (ng/mL), P is the observed toxicant concentration (ng/mL), SGm is the median SG value among the subset of participants analyzed in this study (median=1.016), and SG=the SG value of the sample.56
2.3. Birth Outcomes
Infant GA at birth was calculated using an accepted hierarchy of the following methods based on available data, in order of preference: (1) first trimester (<14 weeks gestation) ultrasound measurement of crown-rump-length (n=251, 59.6%), (2) second trimester (<28 weeks gestation) ultrasound measurement of fetal biparietal diameter (n=118, 28.0%), (3) physician’s best clinical estimate from electronic medical records (n=51, 12.1%), and (4) estimated from last menstrual period (n=1, 0.2%).57 Many participants had multiple estimates of GA available (79%), with estimates generally highly correlated with one another across methods (Spearman ρ=0.52–0.91), but higher order preference was placed on methods suggested to provide more accurate estimates of GA at birth.57–59 Infant birthweight for all participants was directly abstracted from electronic medical records. Sex-specific BW for GA z-scores were calculated for each participant using a nationally representative U.S. sample.60 Infant sex was primarily abstracted from electronic medical records (n=410, 97.4%), followed by maternal-reported infant sex (n=11, 2.6%) for cases in which abstracted sex could not be obtained.
2.4. Covariates
Potential study covariates for GA at birth and birthweight models were identified a priori based on previous literature28,32,52,53 and visualized using Directed Acyclic Graphs (DAGs) on DAGitty (see Supplemental Figure 1a and 1b).61 All models were adjusted for all study design and sample collection variables and variables selected in the DAG minimal sufficient adjustment sets, barring some of the exceptions discussed below.
Maternal demographic and pregnancy-related covariates identified in prior literature and considered in DAGs included maternal age at study enrollment (years), income (<$30,000, ≥ $30,000, don’t know), education (≤12th Grade, some college or technical school or completed 4 years of college, some graduate training after college), race/ethnicity (White non-Hispanic, Black non-Hispanic, Hispanic, Multiracial non-Hispanic, Other non-Hispanic), pre-pregnancy BMI (kg/m2), parity (first born, ≥ second born, missing), maternal hypertensive disorders of pregnancy (hypertensive [defined as having one or more of the following: preeclampsia-eclampsia, chronic hypertension, chronic hypertension with pre-eclampsia superimposed, gestational hypertension] or non-hypertensive), and infant sex (female, male). Minimal sufficient adjustment sets identified in DAGs for both GA at birth and birthweight included maternal age, pre-pregnancy BMI, parity, race/ethnicity, smoking during pregnancy, maternal hypertensive disorders of pregnancy, and socioeconomic status (i.e., income, education). Infant sex was additionally adjusted for in all full GA at birth models since it is an important predictor of GA at birth; however, since BW for GA z-scores were sex-specific, BW for GA z-score models did not include infant sex as a covariate. Pre-pregnancy BMI was calculated using participant reported pre-pregnancy weight and standing height measured by study staff in the first study visit using a commercial stadiometer (Perspectives Enterprises model P-AIM-101). Maternal age, income, education, race/ethnicity, and parity were collected via interviewer administered questionnaires in the participant’s preferred language (English and/or Spanish). Maternal hypertensive disorders of pregnancy were abstracted from maternal prenatal records from health care providers. Sample collection variables, including season at sample collection (winter [December-February], spring [March-May], summer [June-August], autumn [September-November]) and gestational age at sample collection (in weeks), were collected at the time of urine sample collection. Maternal smoking during pregnancy was also considered as a potential covariate; however, given the low frequency of smoking reported among participants (~1.9%), prenatal smoking was not adjusted for in models. However, sensitivity analyses were performed excluding maternal participants who smoked during pregnancy. Although not identified as a potential covariate a priori based on previous literature, other sensitivity analyses included additionally adjusting for gestational diabetes and delivery method to assess the robustness of our results. Gestational diabetes diagnoses and delivery method were abstracted from maternal prenatal records from health care providers.
2.5. Statistical Analysis
Descriptive characteristics were calculated using means and frequencies. OPE metabolite distributions were explored using boxplots, geometric means, medians, percentile distributions, and metabolite detect frequencies. Since OPE metabolite distributions were right skewed, Kruskal Wallis tests were conducted to evaluate univariate associations between categorical covariates (i.e., education, income, race/ethnicity, parity, maternal hypertensive disorders during pregnancy, infant sex, season of sample collection) and OPE concentrations. Spearman correlations were performed to evaluate associations between continuous covariates (maternal age, pre-pregnancy BMI, and gestational age at sample collection) and OPEs as well as correlations between OPE metabolites.
Given that OPE concentrations were right skewed,18 continuous OPE metabolites were natural log transformed prior to modeling. Unadjusted and adjusted linear regressions were performed to assess the relationship between individual prenatal OPEs and infant gestational age at birth and BW for GA z-scores. OPE metabolites with detect frequencies >60% were analyzed continuously (DPHP, DNBP+DIBP, BDCIPP, BCEP, BBOEP) and those with a detect frequency <60% were analyzed dichotomously as detect versus non-detect (BCIPP, BEHP, BMPP, DPRP), consistent with prior literature.62–64 Model parameter estimates were back transformed and scaled to a doubling in OPE metabolite exposure. Modeling assumptions for all linear regressions, including linearity, homoscedasticity, and normality, were examined (and met) using scatterplots and histograms of model residuals, and all models assessed for influential outliers. A statistical interaction between each OPE metabolite and infant sex was also tested within independent models, with a p-value<0.05 defined as a statistically significant interaction. Regardless of whether statistical interaction terms were significant, all models were stratified by infant sex, given prior evidence of sex-specific effects of OPE metabolites on birth outcomes. Generalized Additive Models (GAMs) with a smoothing term for exposure variables were also performed to evaluate possible non-linear associations between continuously analyzed OPE metabolites and birth outcomes using the R package “mgcv.” All GAM models were also stratified by infant sex.
Bayesian Kernel Machine Regression (BKMR) using the Gaussian predictive process (GPP) set at 100 knots was performed to evaluate the associations between the OPE mixture and infant birth outcomes. Only metabolites with a detect frequency >60% were included in BKMR models (n=5 metabolites; DPHP, DNBP+DIBP, BDCIPP, BCEP, BBOEP). BKMR is an advanced semi-parametric method that utilizes Gaussian kernel machine regression to estimate the effects of a high-dimensional matrix of predictors (e.g., interrelated environmental exposures) on a health outcome of interest.65 Advantages of BKMR include the ability to estimate flexible exposure-response functions which may include non-linear effects and correlated exposures, thus accounting for potential confounding from co-exposures. Additionally, BKMR can evaluate all possible synergistic and antagonistic relationships between mixtures components without prior specification. In brief, the BKMR model for the current study is represented by the following equation:
where Yί represents our health outcome of interest (i.e., infant birth outcome) for participant i, h(.) denotes the exposure-response function; β represents the vector of coefficients for model covariates (Xί), which are modeled parametrically; and ɛ represents residuals assumed to be independent, normally distributed, with a common variance. BKMR models for each outcome were stratified by sex to assess possible sex differences in the association between OPE mixtures and infant birth outcomes. Additionally, all OPE metabolites and infant GA at birth were natural log transformed, mean-centered, and standard deviation scaled prior to BKMR modelling. All continuous covariates were mean centered and scaled to one standard deviation.
Individual mixture component associations for GA at birth and BW for GA z-scores were ranked using posterior inclusion probabilities (PIPs) to assess the importance of each mixture component exposure in defining the exposure-outcome association. Exposure-response functions for each OPE holding all other exposures constant at their 50th percentiles were evaluated to assess the associations of individual OPEs, accounting for the rest of the mixture, with infant birth outcomes. The overall effect of simultaneously increasing all exposures in the mixtures was additionally evaluated to assess the relationship between the overall OPE mixture and infant GA at birth and BW for GA z-scores. Since BKMR is a Bayesian approach, common frequentist approaches, such as evaluation of statistical significance and the use of 95% Confidence Intervals, are not applicable. We used 95% credible intervals to determine the uncertainty in each exposure–outcome association; if the 95% credible interval did not span 0, we considered the metabolite or mixture to be associated with the outcome. Possible pairwise interactions between OPE metabolites were also investigated visually for each birth outcome by assessing the association between each OPE metabolite and birth outcome when varying a second OPE metabolite to its 25th, 50th, and 75th percentile (holding all other OPE metabolites at their 50th percentile) with non-parallel lines indicating possible pairwise interactions.
The “bkmr” package in R was used for the BKMR analysis.66 The Markov Chain Monte Carlo (MCMC) sampler was used to obtain 100,000 posterior samples of model parameters, with the first half of iterations used as burn-in and chains thinned to every 10th iteration to reduce potential autocorrelation. Trace plots were visually inspected to assess model convergence, with all models indicating occurrence of convergence. BKMR models were assumed to have non-informative prior distributions in primary models, the default specified in the R package. However, since BKMR can be sensitive to the choice of model priors, sensitivity analyses were conducted to evaluate whether results from the primary model were robust to alternative prior assumptions. The parameter b, which controls the smoothness of the exposure-outcome relationship, was varied to a lower degree of smoothness (b=50) and to a higher degree of smoothness (b=1000).
Data were managed and linear regression models were analyzed using SAS v9.4 (SAS Institute, Inc., Cary, NC, USA). GAMs and BKMR models were performed using R (v 4.1.0). The significance level for single chemical metabolite models was set at an alpha of 0.05.
3. Results
3.1. Participant Characteristics
Maternal and infant characteristics of the study population are shown in Table 1. Maternal participants were on average 28.9±6.1 years old at study recruitment, had a pre-pregnancy BMI of 28.6±6.7 kg/m2, and were predominantly Hispanic (77.9%). More than half of participants had at most a high school education (57.0%) and 47.5% of participants had an annual household income of <$30,000. Very few (1.9%) maternal participants smoked during pregnancy; however, 21.1% had one or more hypertensive disorders of pregnancy. Infants were primarily second born or more (62.0%), with 9.3% born preterm (<37 weeks) and 3.8% born with a low birth weight (≤2,500 grams). Infants were born at an average gestational age of 39.1±1.5 weeks. This subset of the MADRES cohort was similar to the full cohort on key demographic characteristics including income, ethnicity, maternal age, education, infant sex, and recruitment site.
Table 1:
Participant Characteristics (N=421)
| Mean (SD)/Freq(%) | |
|---|---|
| Maternal Characteristics | |
| Age (years) | 28.9 (6.1) |
| Education | |
| ≤High School | 240 (57.0%) |
| Some College or College Graduate | 152 (36.1%) |
| Graduate School | 29 (6.9%) |
| Income | |
| Don’t Know | 121 (28.7%) |
| Less than $30,000 | 200 (47.5%) |
| $30,000 or more | 100 (23.8%) |
| Race and Ethnicity | |
| White, non-Hispanic | 29 (6.9%) |
| Black, non-Hispanic | 49 (11.6%) |
| Hispanic | 328 (77.9%) |
| Multiracial, non-Hispanic | 5 (1.2%) |
| Other, non-Hispanic | 10 (2.4%) |
| Personal Smoking During Pregnancy | |
| No | 413 (98.1%) |
| Yes | 8 (1.9%) |
| Hypertensive | |
| Non-Hypertensive | 332 (78.9%) |
| Hypertensive | 89 (21.1%) |
| Pre-eclampsia | 39 (9.3%) |
| Chronic Hypertension | 10 (2.4%) |
| Chronic Hypertension and Pre-eclampsia | 12 (2.9%) |
| Gestational Hypertension | 28 (6.7%) |
| Pre-Pregnancy BMI (kg/m2) | 28.6 (6.7) |
| Infant Characteristics | Mean (SD)/Freq(%) |
| Sex | |
| Female | 215 (51.1%) |
| Male | 206 (48.9%) |
| Birth Order | |
| First Born | 146 (34.7%) |
| Second or more | 261 (62.0%) |
| Missing | 14 (3.3%) |
| Gestational Age at Birth (weeks) | 39.1 (1.5) |
| Birthweight (grams) | 3302.9 (475.4) |
| BW for GA z-score | −0.1 (1.0) |
| Preterm Birth (<37 weeks) | |
| Yes | 39 (9.3%) |
| No | 382 (90.7%) |
| Low Birthweight (<2500 grams) | |
| Yes | 16 (3.8%) |
| No | 405 (96.2%) |
Distributions for all measured OPE metabolites in urine are shown in Table 2. Five metabolites had detection frequencies ≥ 60% (DPHP, DNBP+DIBP, BDCIPP, BCEP, BBOEP) and four metabolites had detection frequencies between 23.8% and 53.9% (BCIPP, BEHP, BMPP, DPRP). OPE concentrations ranged from 0.004 ng/mL to 168.00 ng/mL. BDCIPP had the highest median metabolite concentration (1.29 ng/mL) across all OPE metabolites measured in this sample. Figure 1 illustrates Spearman correlations between all measured OPE metabolites in the full sample and stratified by sex. In general, most OPE metabolites were significantly correlated with one another, although correlations were generally weak, with the highest correlations observed between BDCIPP and DPHP in both the full sample (ρ= 0.31, p<0.01) and sex-stratified Spearman correlations (female ρ= 0.35, p<0.01; male ρ= 0.26, p<0.01). Compared to a representative US sample of National Health and Nutrition Examination Survey (NHANES) participants (Table S2), MADRES participants’ median BDCIPP concentrations (1.29 ng/mL) and BCEP concentrations (0.53 ng/mL) were higher than NHANES participants’ median BDCIPP (0.87 ng/mL) and BCEP concentrations (0.39 ng/mL). However, MADRES participants’ median DPHP metabolite concentrations (0.77 ng/mL) and BCIPP concentrations (0.18 ng/mL) were similar to NHANES participants’ median DPHP concentrations (0.79 ng/mL) and BCIPP concentrations (0.19 ng/mL).
Table 2:
Distribution of Specific Gravity Adjusted OPE Concentrations (ng/mL) in Maternal Urine (N=421)a
| Percentiles | Distributions | ||||||
|---|---|---|---|---|---|---|---|
| Metabolite | 25th | 50th | 75th | Min-Max | Geometric Mean | Detect Frequency | LOD (ng/mL) |
| DPHP | 0.47 | 0.77 | 1.46 | 0.12–25.59 | 0.88 | 99.76% | 0.0281 |
| DNBP+DIBP | 0.12 | 0.17 | 0.26 | ND-3.01 | 0.19 | 97.62% | 0.0441 |
| BDCIPP | 0.61 | 1.29 | 2.29 | ND-68.00 | 1.08 | 94.77% | 0.0174 |
| BCEP | 0.03 | 0.53 | 1.62 | ND-168.00 | 0.31 | 68.41% | 0.0200 |
| BBOEP | 0.02 | 0.04 | 0.07 | ND-1.17 | 0.04 | 64.85% | 0.0199 |
| BCIPP | ND | 0.18 | 0.77 | ND-40.56 | 0.13 | 53.92% | 0.0204 |
| BMPP | ND | 0.01 | 0.04 | ND-0.69 | 0.02 | 38.72% | 0.0115 |
| BEHP | ND | ND | 0.04 | ND-4.42 | 0.03 | 25.42% | 0.0170 |
| DPRP | ND | ND | 0.05 | ND-2.85 | 0.03 | 23.75% | 0.0278 |
Metabolite concentrations below the LOD have been imputed (LOD/√2) and specific gravity adjusted.
Note: OPE, Organophosphate Ester; DPHP, Diphenyl phosphate; DNBP+DIBP, Sum of Dibutyl phosphate and Diisobutyl phosphate; BDCIPP, Bis(1,3-dichloro-2-propyl) phosphate; BCEP, Bis(2- chloroethyl) phosphate; BBOEP, Bis(butoxethyl) phosphate; BCIPP, Bis(1-chloro-2-propyl) phosphate; BMPP, Bis(2-methylphenyl) phosphate; BEHP, Bis(2-ethylhexyl) phosphate; DPRP, Dipropyl phosphate; LOD, Limit of Detection; ND, Not Detected.
Figure 1:
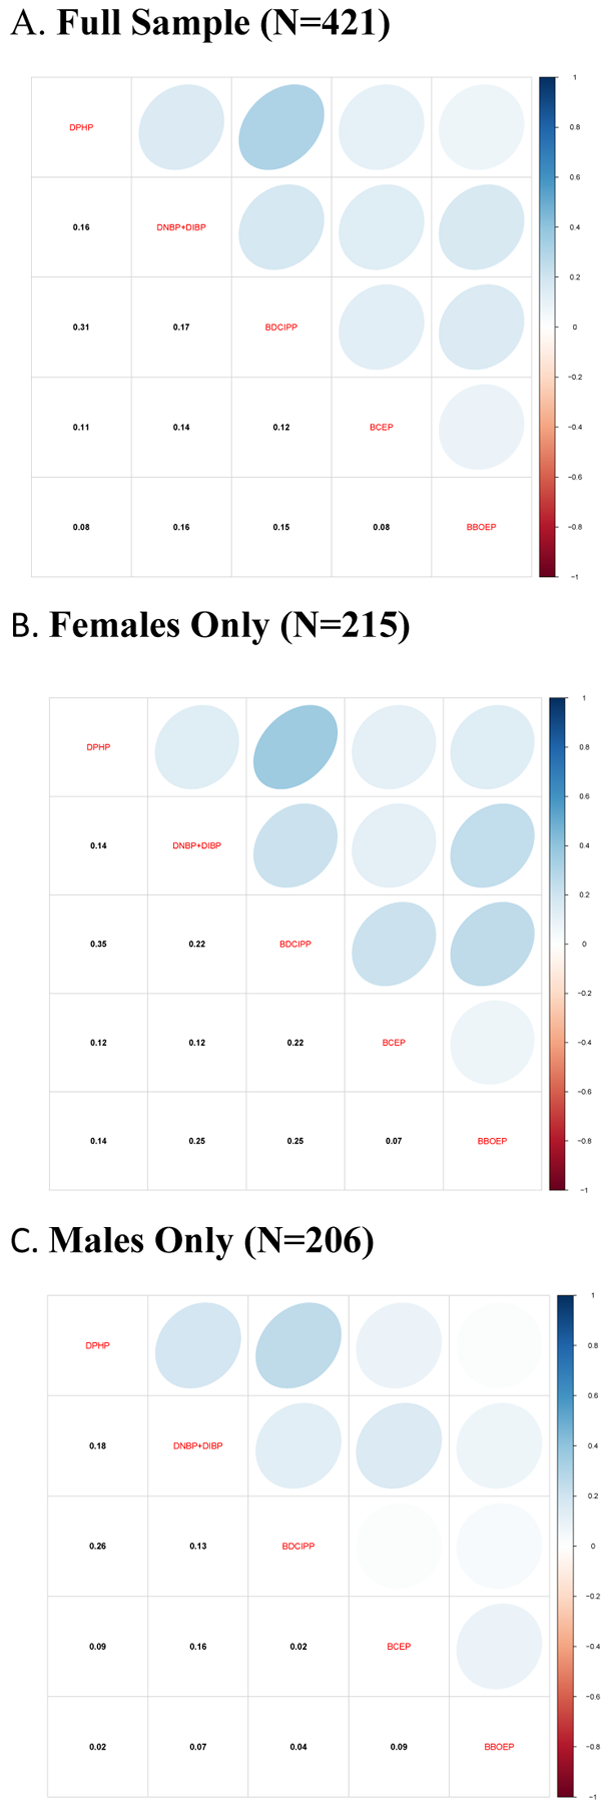
Spearman Correlations of Organophosphate Ester Metabolites (ng/mL) in Third Trimester Maternal Urine
Univariate associations between OPE metabolite concentrations and covariates are shown in Supplemental Tables 3a, 3b, and 3c. Participants whose 3rd trimester urinary specimens were collected during the summer had higher median concentrations of DPHP (0.88 ng/mL) and BDCIPP (1.99 ng/mL) when compared to samples collected from participants in the winter (median DPHP= 0.63 ng/mL; median BDCIPP=0.99 ng/mL), spring (median DPHP=0.73 ng/mL; median BDCIPP= 0.92 ng/mL), and autumn (median DPHP=0.86 ng/mL; median BDCIPP=1.36 ng/mL) seasons. Additionally, specimens collected during the summer and autumn had higher median concentrations of BCEP (summer=0.62 ng/mL; autumn=0.62 ng/mL) when compared to those collected in the winter (median BCEP=0.36 ng/mL) and spring (median BCEP=0.49 ng/mL) seasons. Participants who were underweight prior to the pregnancy had higher median concentrations of BCEP (0.79 ng/mL) when compared to normal weight (0.42 ng/mL), overweight (0.70 ng/mL), and obese (0.40 ng/mL) participants. Participants who reported not knowing their annual household income had lower median DPHP levels (0.67 ng/mL) compared to those reporting an annual household income of <$30,000 (0.85 ng/mL) and ≥$30,000 (0.85 ng/mL). Maternal participants with any hypertensive disorder of pregnancy had significantly higher median BDCIPP metabolite concentrations (1.49 ng/mL) than those with no hypertensive disorders of pregnancy (1.18 ng/mL). Significant differences were observed between income levels and the detection of BEHP, with higher detect frequencies of BEHP among participants with an annual household income <$30,000 (31.50%) when compared to those with an income of ≥$30,000 (22.00%) and those who reported not knowing their income (18.18%). Higher detect frequencies of BMPP were observed in mothers who had male infants (44.66%) compared to female infants (33.02%).
3.2. Individual Metabolite Associations with Birthweight and Gestational Age at Birth
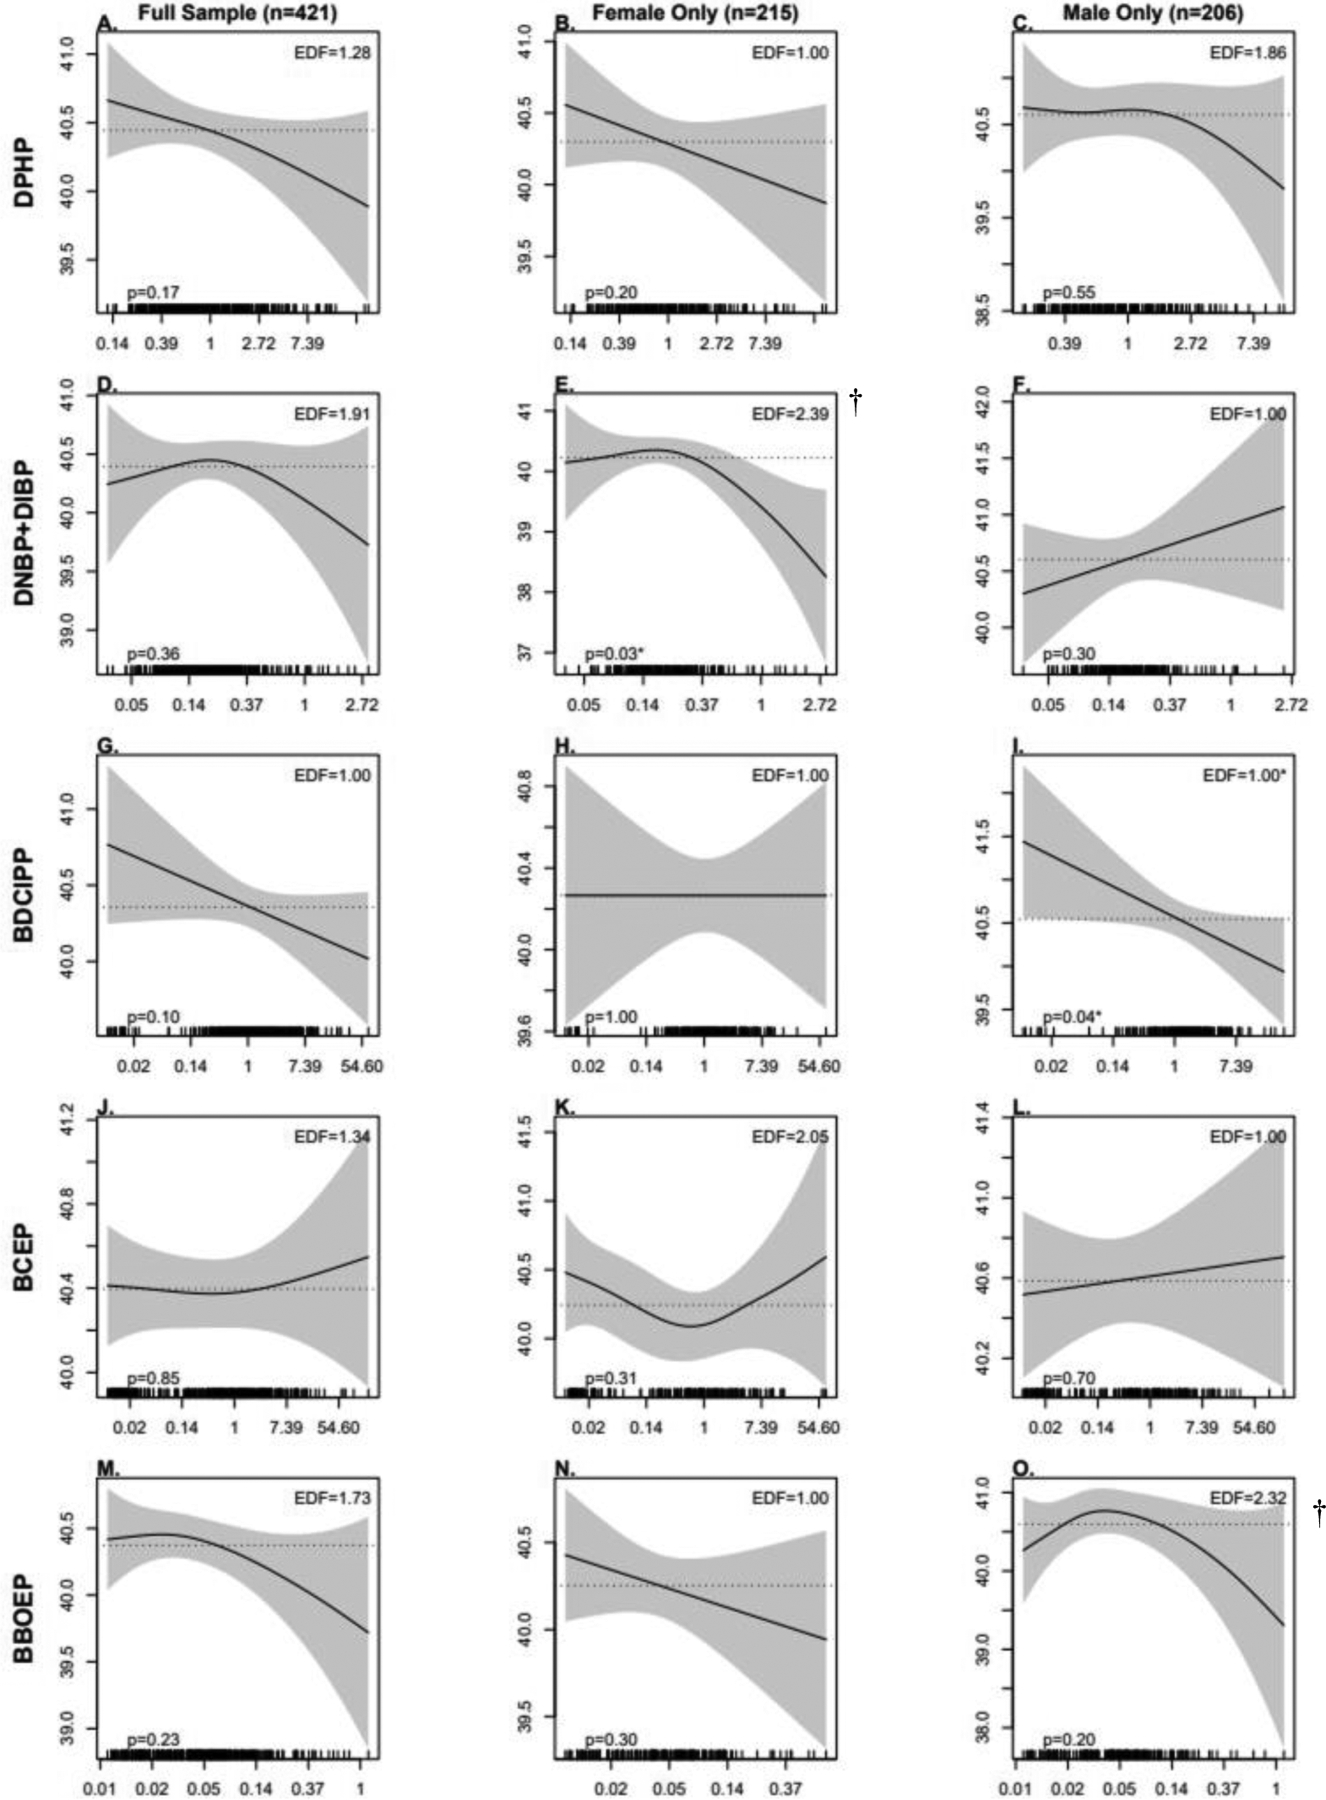
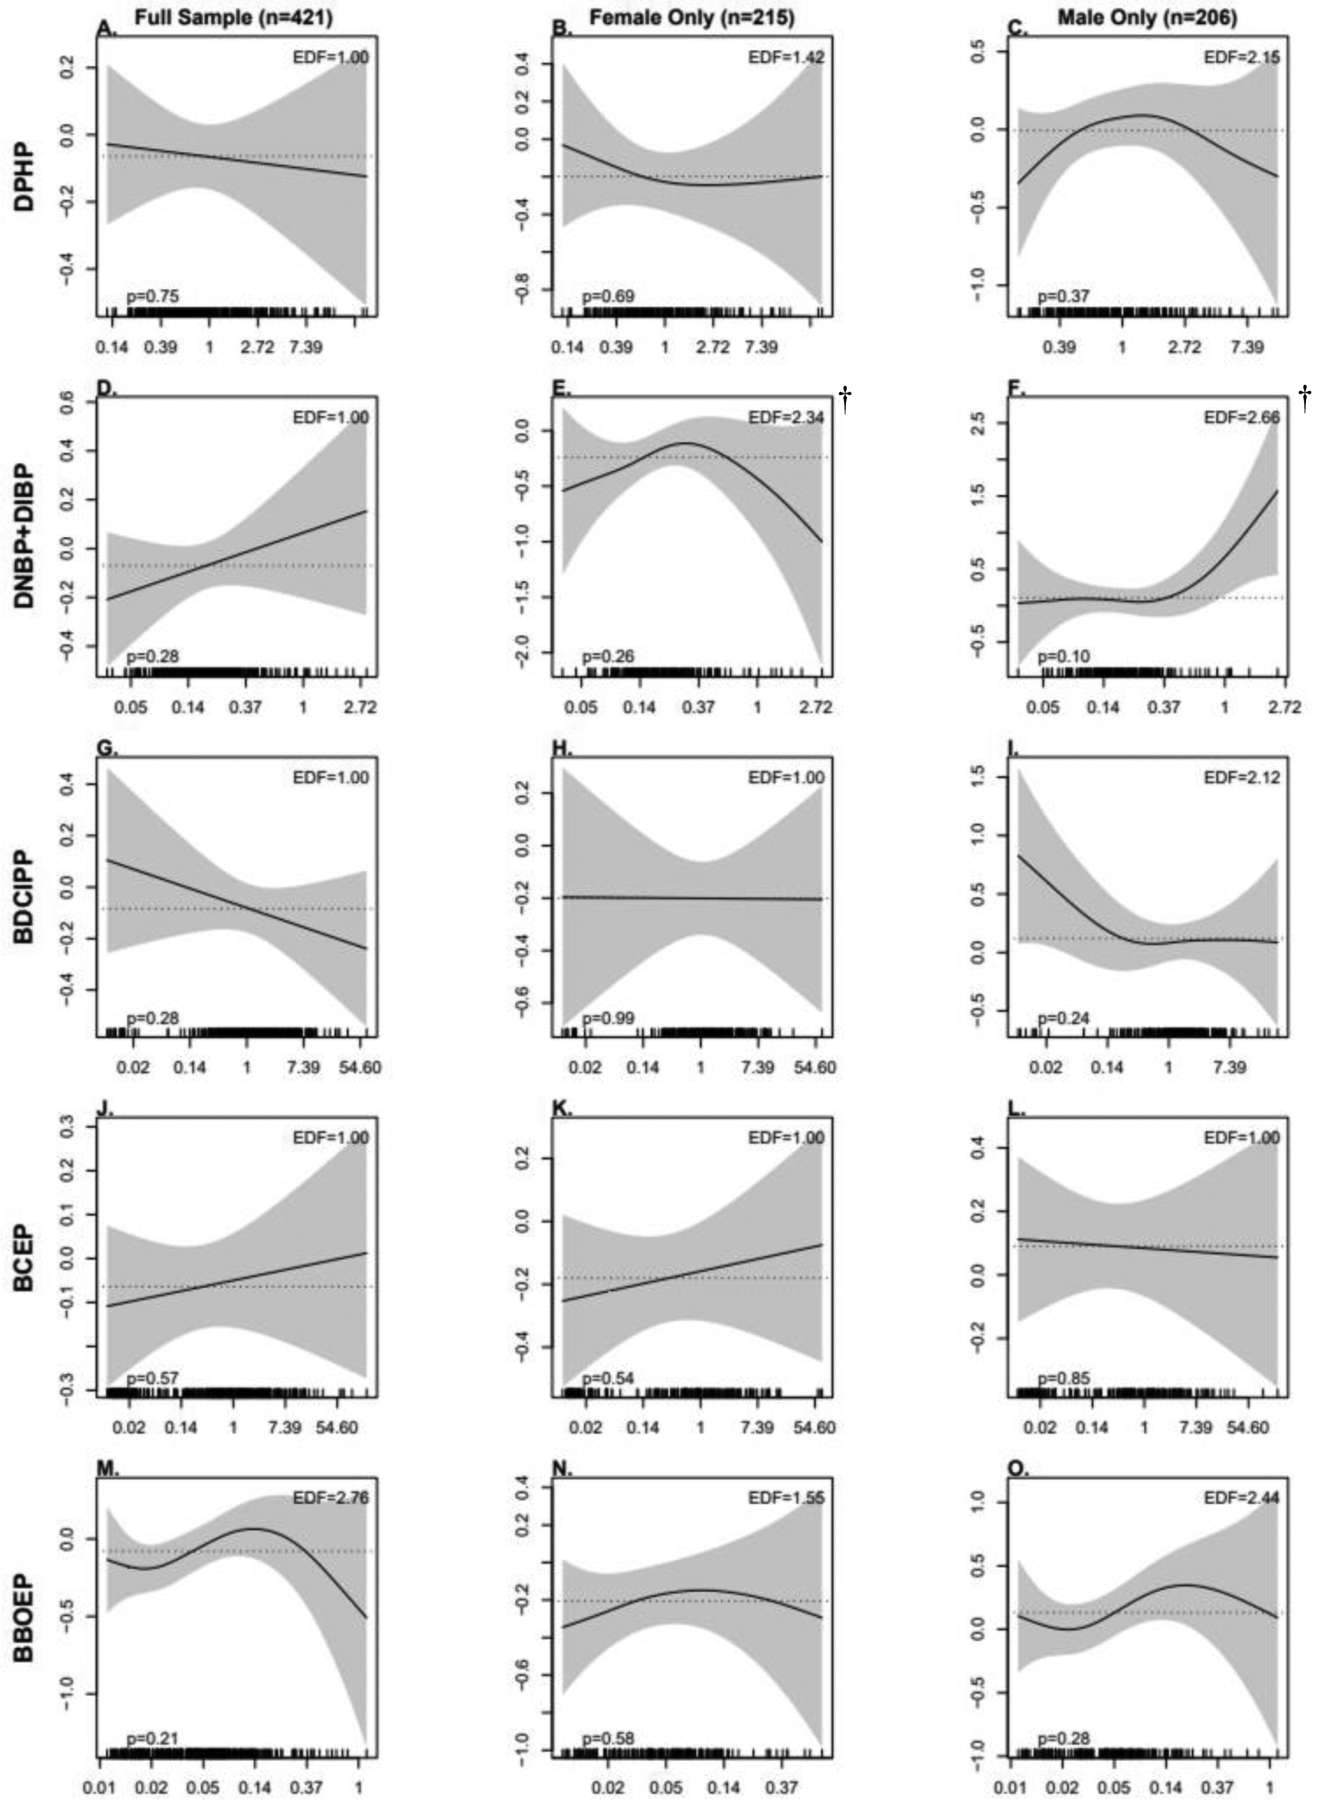
As shown in Tables 3 and 4, no significant associations were observed between maternal OPE metabolites and infant birth outcomes in either unadjusted or covariate-adjusted linear regression models for the full sample. Similarly, there were no significant associations between OPEs and infant birth outcomes when using GAMs, but there was some evidence of non-linear patterns (Figure 2 and Figure 3). In particular, the pattern between DNBP+DIBP and GA at birth and BBOEP and GA at birth and BW for GA had an inverted U-shape.
Table 3:
Associations Between Individual OPE Urinary Metabolites (ng/mL) and Gestational Age at Birth (weeks)
| Full Unadjusted Models β (95% CI) (N=421) | Full Adjusted Modelsa β (95% CI) (N=421) | Metabolite and Infant Sex Interaction P-value (N=421) | Female Only Adjusted Modelsb β (95% CI) (N=215) | Male Only Adjusted Modelsb β (95% CI) (N=206) | |
|---|---|---|---|---|---|
| DPHP† | −0.09 (−0.20, 0.02) | −0.09 (−0.20, 0.02) | 0.97 | −0.09 (−0.23, 0.05) | −0.07 (−0.26, 0.12) |
| DNBP+DIBP† | −0.04 (−0.19, 0.10) | −0.05 (−0.19, 0.10) | 0.10 | −0.20 (−0.40, 0.00) | 0.12 (−0.11, 0.36) |
| BDCIPP† | −0.06 (−0.13, 0.01) | −0.06 (−0.13, 0.01) | 0.04* | −0.00 (−0.09, 0.09) | −0.12 (−0.24, −0.01)* |
| BCEP† | −0.00 (−0.04, 0.04) | 0.00 (−0.04, 0.04) | 0.32 | −0.02 (−0.08, 0.03) | 0.01 (−0.05, 0.08) |
| BBOEP† | −0.07 (−0.18, 0.03) | −0.07 (−0.17, 0.03) | 0.87 | −0.08 (−0.22, 0.07) | −0.04 (−0.20, 0.12) |
| BCIPP | 0.32 | ||||
| Non-detect | REF | REF | REF | REF | |
| Detect | 0.18 (−0.11, 0.46) | 0.14 (−0.14, 0.41) | −0.01 (−0.38, 0.36) | 0.25 (−0.18, 0.68) | |
| BMPP | 0.85 | ||||
| Non-detect | REF | REF | REF | REF | |
| Detect | −0.17 (−0.46, 0.12) | −0.12 (−0.41, 0.16) | −0.11 (−0.50, 0.27) | −0.09 (−0.53, 0.35) | |
| BEHP | 0.78 | ||||
| Non-detect | REF | REF | REF | REF | |
| Detect | −0.04 (−0.36, 0.29) | 0.04 (−0.28, 0.36) | 0.06 (−0.38, 0.50) | 0.02 (−0.47, 0.52) | |
| DPRP | 0.40 | ||||
| Non-detect | REF | REF | REF | REF | |
| Detect | −0.00 (−0.34, 0.33) | −0.00 (−0.33, 0.32) | −0.13 (−0.57, 0.31) | 0.22 (−0.30, 0.73) |
Model adjusted for recruitment site, maternal age, season of sample collection, gestational age at sample collection, race/ethnicity, pre-pregnancy BMI, income, education, infant birth order, infant sex, maternal hypertensive disorders during pregnancy
Model adjusted for recruitment site, maternal age, season of sample collection, gestational age at sample collection, race/ethnicity, pre-pregnancy BMI, income, education, infant birth order, maternal hypertensive disorders of pregnancy
Beta estimate back transformed to a doubling in exposure.
Note: OPE, Organophosphate Ester; CI, Confidence Interval; DPHP, Diphenyl phosphate; DNBP+DIBP, Sum of Dibutyl phosphate and Di-isobutyl phosphate; BDCIPP, Bis(1,3-dichloro-2-propyl) phosphate; BCEP, Bis(2- chloroethyl) phosphate; BBOEP, Bis(butoxethyl) phosphate; BCIPP, Bis(1-chloro-2-propyl) phosphate; BMPP, Bis(2-methylphenyl) phosphate; BEHP, Bis(2-ethylhexyl) phosphate; DPRP, Dipropyl phosphate.
Table 4:
Associations Between Individual OPE Urinary Metabolites (ng/mL) and Birthweight for Gestational Age (BW for GA) Z-scores
| Full Unadjusted Models β (95% CI) (N=421) | Full Adjusted Modelsa β (95% CI) (N=421) | Metabolite and Infant Sex Interaction P-value (N=421) | Female Only Adjusted Modelsa β (95% CI) (N=215) | Male Only Adjusted Modelsa β (95% CI) (N=206) | |
|---|---|---|---|---|---|
| DPHP† | 0.01 (−0.07, 0.08) | −0.01 (−0.09, 0.06) | 0.40 | −0.03 (−0.13, 0.08) | 0.03 (−0.09, 0.15) |
| DNBP+DIBP† | 0.04 (−0.06, 0.15) | 0.06 (−0.05, 0.16) | 0.62 | 0.01 (−0.15, 0.17) | 0.10 (−0.04, 0.25) |
| BDCIPP† | −0.03 (−0.08, 0.02) | −0.03 (−0.07, 0.02) | 0.48 | −0.00 (−0.07, 0.07) | −0.05 (−0.12, 0.03) |
| BCEP† | 0.00 (−0.03, 0.03) | 0.01 (−0.02, 0.04) | 0.79 | 0.01 (−0.03, 0.06) | −0.00 (−0.05, 0.04) |
| BBOEP† | 0.06 (−0.02, 0.13) | 0.04 (−0.03, 0.11) | 0.69 | 0.03 (−0.08, 0.14) | 0.07 (−0.03, 0.17) |
| BCIPP | 0.28 | ||||
| Non-detect | REF | REF | REF | REF | |
| Detect | 0.00 (−0.19, 0.20) | −0.02 (−0.22, 0.17) | 0.11 (−0.17, 0.40) | −0.15 (−0.42, 0.12) | |
| BMPP | 0.19 | ||||
| Non-detect | REF | REF | REF | REF | |
| Detect | 0.10 (−0.10, 0.30) | 0.06 (−0.13, 0.26) | 0.22 (−0.07, 0.52) | −0.05 (−0.33, 0.22) | |
| BEHP | 0.30 | ||||
| Non-detect | REF | REF | REF | REF | |
| Detect | −0.06 (−0.29, 0.16) | −0.09 (−0.32, 0.13) | −0.24 (−0.58, 0.10) | 0.02 (−0.29, 0.33) | |
| DPRP | 0.65 | ||||
| Non-detect | REF | REF | REF | REF | |
| Detect | 0.11 (−0.12, 0.34) | 0.10 (−0.13, 0.32) | 0.04 (−0.30, 0.38) | 0.16 (−0.17, 0.48) |
Model adjusted for recruitment site, maternal age, season of sample collection, gestational age at sample collection, race/ethnicity, pre-pregnancy BMI, income, education, infant birth order, maternal hypertensive disorders of pregnancy.
Beta estimate back transformed to a doubling in exposure
Note: OPE, Organophosphate Ester; DPHP, Diphenyl phosphate; DNBP+DIBP, Sum of Dibutyl phosphate and Di-isobutyl phosphate; BDCIPP, Bis(1,3-dichloro-2-propyl) phosphate; BCEP, Bis(2- chloroethyl) phosphate; BBOEP, Bis(butoxethyl) phosphate; BCIPP, Bis(1-chloro-2-propyl) phosphate; BMPP, Bis(2-methylphenyl) phosphate; BEHP, Bis(2-ethylhexyl) phosphate; DPRP, Dipropyl phosphate.
Figure 2:
Associations Between Prenatal OPE Urinary Metabolite Concentrations (ng/mL) and Gestational Age at Birth, Using Generalized Additive Models (GAMs)
Models adjusted for recruitment site, maternal age, season of sample collection, gestational age at sample collection, race/ethnicity, pre-pregnancy BMI, income, education, infant birth order, infant sex, and maternal hypertensive disorders of pregnancy. Note: OPE, Organophosphate Ester; DPHP, Diphenyl phosphate; DNBP+DIBP, Sum of Dibutyl phosphate and Di-isobutyl phosphate; BDCIPP, Bis(1,3-dichloro-2-propyl) phosphate; BCEP, Bis(2- chloroethyl) phosphate; BBOEP, Bis(butoxethyl) phosphate.
*Significant association between metabolite and GA at birth; † Significant non-linearity.
Figure 3:
Associations Between Prenatal OPE Metabolite Concentrations (ng/mL) and Birthweight for Gestational Age (BW for GA) Z-scores, Using Generalized Additive Models (GAMs)
Models adjusted for recruitment site, maternal age, season of sample collection, gestational age at sample collection, race/ethnicity, pre-pregnancy BMI, income, education, infant birth order, and maternal hypertensive disorders of pregnancy. Note: OPE, Organophosphate Ester; DPHP, Diphenyl phosphate; DNBP+DIBP, Sum of Dibutyl phosphate and Di-isobutyl phosphate; BDCIPP, Bis(1,3-dichloro-2-propyl) phosphate; BCEP, Bis(2- chloroethyl) phosphate; BBOEP, Bis(butoxethyl) phosphate.
*Significant association between metabolite and GA at birth; †Significant non-linearity.
When we examined sex-specific associations using linear regression models, we found a significant interaction between prenatal BDCIPP concentrations and infant sex on GA at birth (p=0.04). In stratified models, a significant inverse association between BDCIPP and GA at birth was observed among males (β=−0.12; 95% CI: −0.24, −0.01) but not among females (β = −0.00001; 95% CI: −0.09, 0.09). Although the interaction between DNBP+DIBP and sex was not statistically significant (p=0.10), there was a marginally significant inverse association observed between DNBP+DIBP and GA at birth among female infants (β=−0.20; 95% CI: −0.40, 0.00). The associations observed in linear regression models between BDCIPP and GA at birth were consistent to those observed in sex-stratified GAMs (Figure 2), with a significant and linear inverse association between higher BDCIPP concentrations and earlier GA at birth among males (p=0.04). However, there was evidence of a non-linear and inverted U-shape association between DNBP+DIBP and GA at birth among female infants (p= 0.01), with a significantly earlier GA at birth at higher concentrations of DNBP+DIBP (p=0.03). There was also some evidence of non-linear patterns between BBOEP and GA at birth among males (p= 0.03) and DNBP+DIBP and BW for GA z-scores among females (p=0.03) and males (p=0.03), although the associations between each metabolite and infant birth outcome in both models were not statistically significant.
In sensitivity analyses excluding participants who smoked during pregnancy (n=8) and models additionally adjusting for gestational diabetes (n= 37; 8.8%), exposure effect estimates in linear regression models (Table S4–S7) and associations observed using GAMs (Figure S2–S5) were not meaningfully changed for either outcome (GA at birth and BW for GA z-scores). Similarly, models additionally adjusting for delivery method yielded similar effect estimates to the primary results in both linear regression models (Table S8–S9) and associations when using GAMs (Figure S6–S7).
3.3. Associations of OPE mixtures with BW for GA z-scores and Gestational Age at Birth
Table 5 shows PIP ranks for both the full sample and sex-stratified mixtures models to quantify the importance of each OPE metabolite in the joint mixture effects on each birth outcome. In the overall sample, DNBP+DIBP had the highest PIP for GA at birth while BBOEP had the highest PIP for BW for GA z-scores. In models stratified by infant sex, among female infants, DNBP+DIBP had the highest PIP for the GA at birth and BW for GA z-score models. Among male infants, BDCIPP had the highest PIP for the GA at birth model and DNBP+DIBP had the highest PIP for the BW for GA z-score model.
Table 5:
Posterior Inclusion Probabilities (PIPs) for OPE Urinary Metabolites and Gestational Age at Birth and Birthweight for Gestational Age (BW for GA) Z-scores Across Full and Sex-Stratified BKMR Mixture Models
| Full Model (N=421) | Sex-Stratified Models | |||||
|---|---|---|---|---|---|---|
| GA at Birth | BW for GA Z Score | GA at Birth | BW for GA Z Score | |||
| Female (N=215) | Male (N=206) | Female (N=215) | Male (N=206) | |||
| DPHP | 0.37 | 0.26 | 0.23 | 0.37 | 0.26 | 0.37 |
| DNBP+DIBP | 0.41 a | 0.32 | 0.82 a | 0.39 | 0.33 a | 0.42 a |
| BDCIPP | 0.33 | 0.34 | 0.14 | 0.54 a | 0.25 | 0.41 |
| BCEP | 0.16 | 0.28 | 0.20 | 0.26 | 0.26 | 0.25 |
| BBOEP | 0.38 | 0.40 a | 0.20 | 0.46 | 0.29 | 0.41 |
Highest value.
Note: OPE, Organophosphate Ester; Bayesian Kernel Machine Regression (BKMR); DPHP, Diphenyl phosphate; DNBP+DIBP, Sum of Dibutyl phosphate and Di-isobutyl phosphate; BDCIPP, Bis(1,3-dichloro-2-propyl) phosphate; BCEP, Bis(2- chloroethyl) phosphate; BBOEP, Bis(butoxethyl) phosphate.
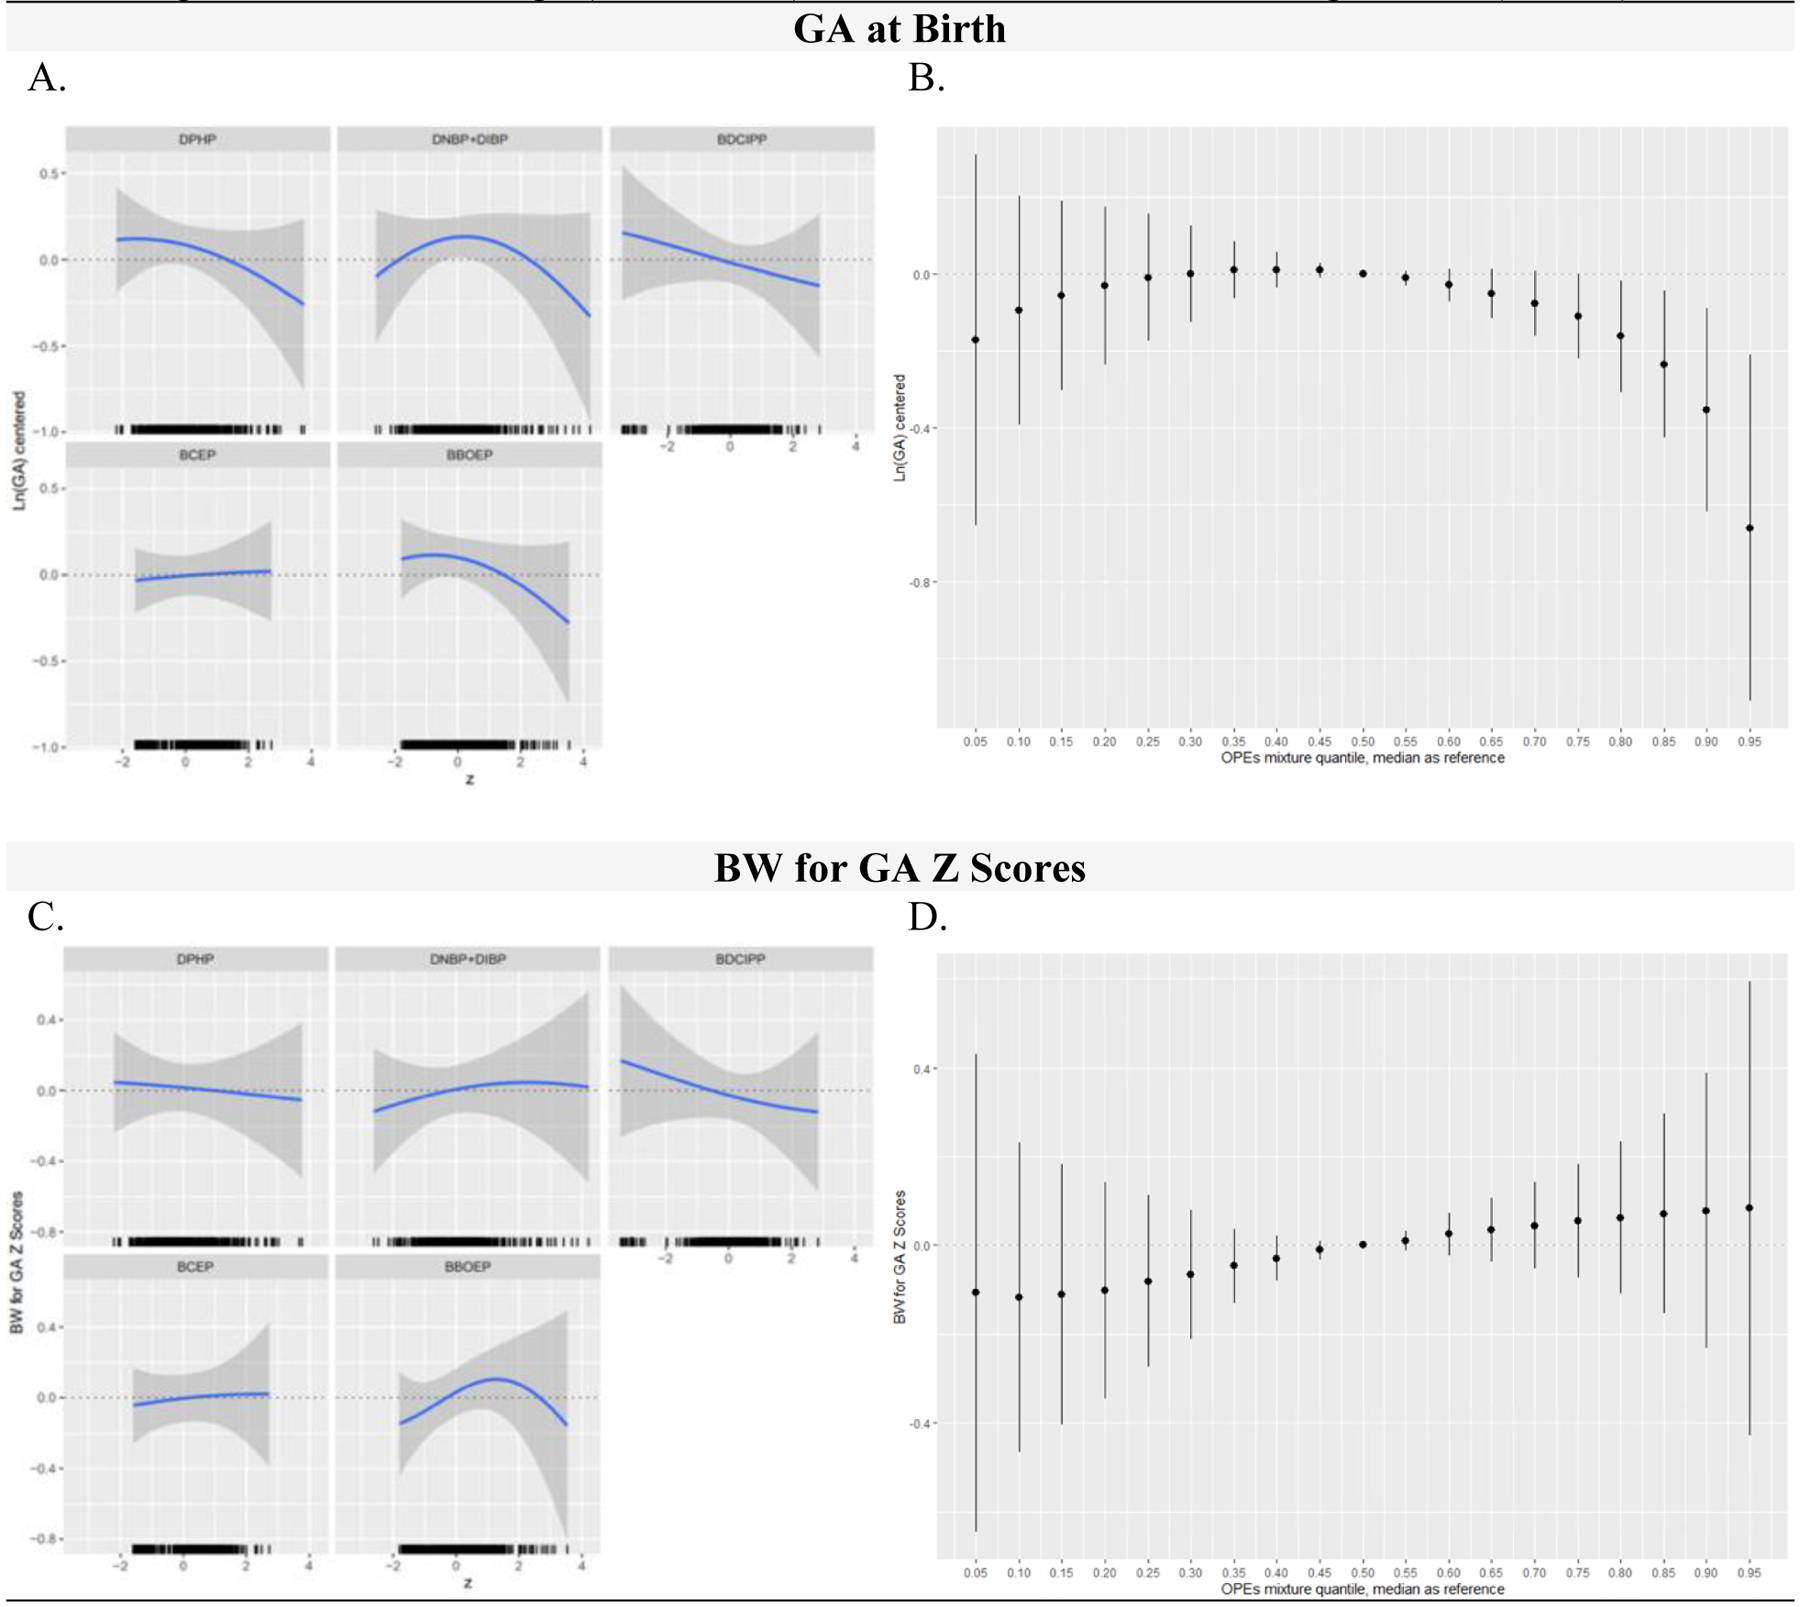
Relationships between each metabolite and GA at birth, fixing other metabolites at their median values and adjusting for key covariates, are shown in Figure 4A. We found an inverse linear association between BDCIPP and GA at birth and an inverse, somewhat linear association between DPHP and BBOEP and GA at birth, with a slight increase in GA at birth at moderate concentrations of this metabolite. For DNBP+DIBP and GA at birth, there was an inverted U-shaped association, consistent with the non-linear pattern observed between DNBP+DIBP and GA at birth when using GAMs. However, effect estimates evaluating the difference in GA at birth for a change in the specified metabolite from the 25th to the 75th percentile, holding all other metabolites in the mixture at their median and adjusting for key covariates, had 95% Credible Intervals that spanned 0 (Table S10). The cumulative association between the overall metabolite mixture and GA at birth had a non-monotonic inverted U-shaped association, with lower GA at birth at higher metabolite levels when compared to their median values, and 95% Credible Intervals which did not cross 0 from the 80th to the 95th percentile (Figure 4B).
Figure 4:
OPE Metabolite Mixtures (ng/mL) and Infant Gestational Age at Birth (weeks) and Birthweight for Gestational Age (BW for GA) Z Scores in Full Models, Using BKMR (N=421)
Figure 4 includes the univariate relationship between each metabolite and birth outcome, while other metabolites are fixed at their medians, and a rug plot showing the distribution of the specified metabolite along the x-axis of each panel (column 1) and the cumulative metabolite mixture results showing the estimated difference in the birth outcome when setting all metabolites to the percentile specified on the x-axis compared with setting all metabolites to their median values (column 2). All GA at birth outcome models were adjusted for recruitment site, maternal age, season of sample collection, gestational age at sample collection, race/ethnicity, pre-pregnancy BMI, income, education, infant birth order, infant sex, and maternal hypertensive disorders of pregnancy. All BW for GA z score outcome models were adjusted for recruitment site, maternal age, season of sample collection, gestational age at sample collection, race/ethnicity, pre-pregnancy BMI, income, education, infant birth order, and maternal hypertensive disorders of pregnancy. OPE metabolites and GA at birth were natural log-transformed, mean centered, and standard deviation scaled. Continuous covariates were mean-centered and standard deviation scaled. Note: BKMR, Bayesian Kernel Machine Regression; OPE, Organophosphate Ester; DPHP, Diphenyl phosphate; DNBP+DIBP, Sum of Dibutyl phosphate and Di-isobutyl phosphate; BDCIPP, Bis(1,3-dichloro-2-propyl) phosphate; BCEP, Bis(2- chloroethyl) phosphate; BBOEP, Bis(butoxethyl) phosphate.
The relationship between the OPE mixture and GA at birth varied by infant sex (Figure 5 and 6). In models for female infants, the exposure-response function for DPHP appeared to be inverse and linear whereas the exposure-response function for BDCIPP appeared to be positive and linear (Figure 5A). The association between DNBP+DIBP and GA at birth followed an inverted U-shape, with higher GA at birth values observed for moderate DNBP+DIBP concentrations. However, all effect estimates evaluating the difference in GA at birth for a change in the specified metabolite from the 25th to the 75th percentile, holding all other metabolites in the mixture at their median and adjusting for key covariates, had 95% Credible Intervals that spanned 0 (Table S10). At high concentrations, the overall metabolite mixture was associated with a lower GA at birth, with 95% Credible Intervals not crossing 0 when metabolites were set to their 90th and 95th percentile when compared to their median values (Figure 5B).
Figure 5:
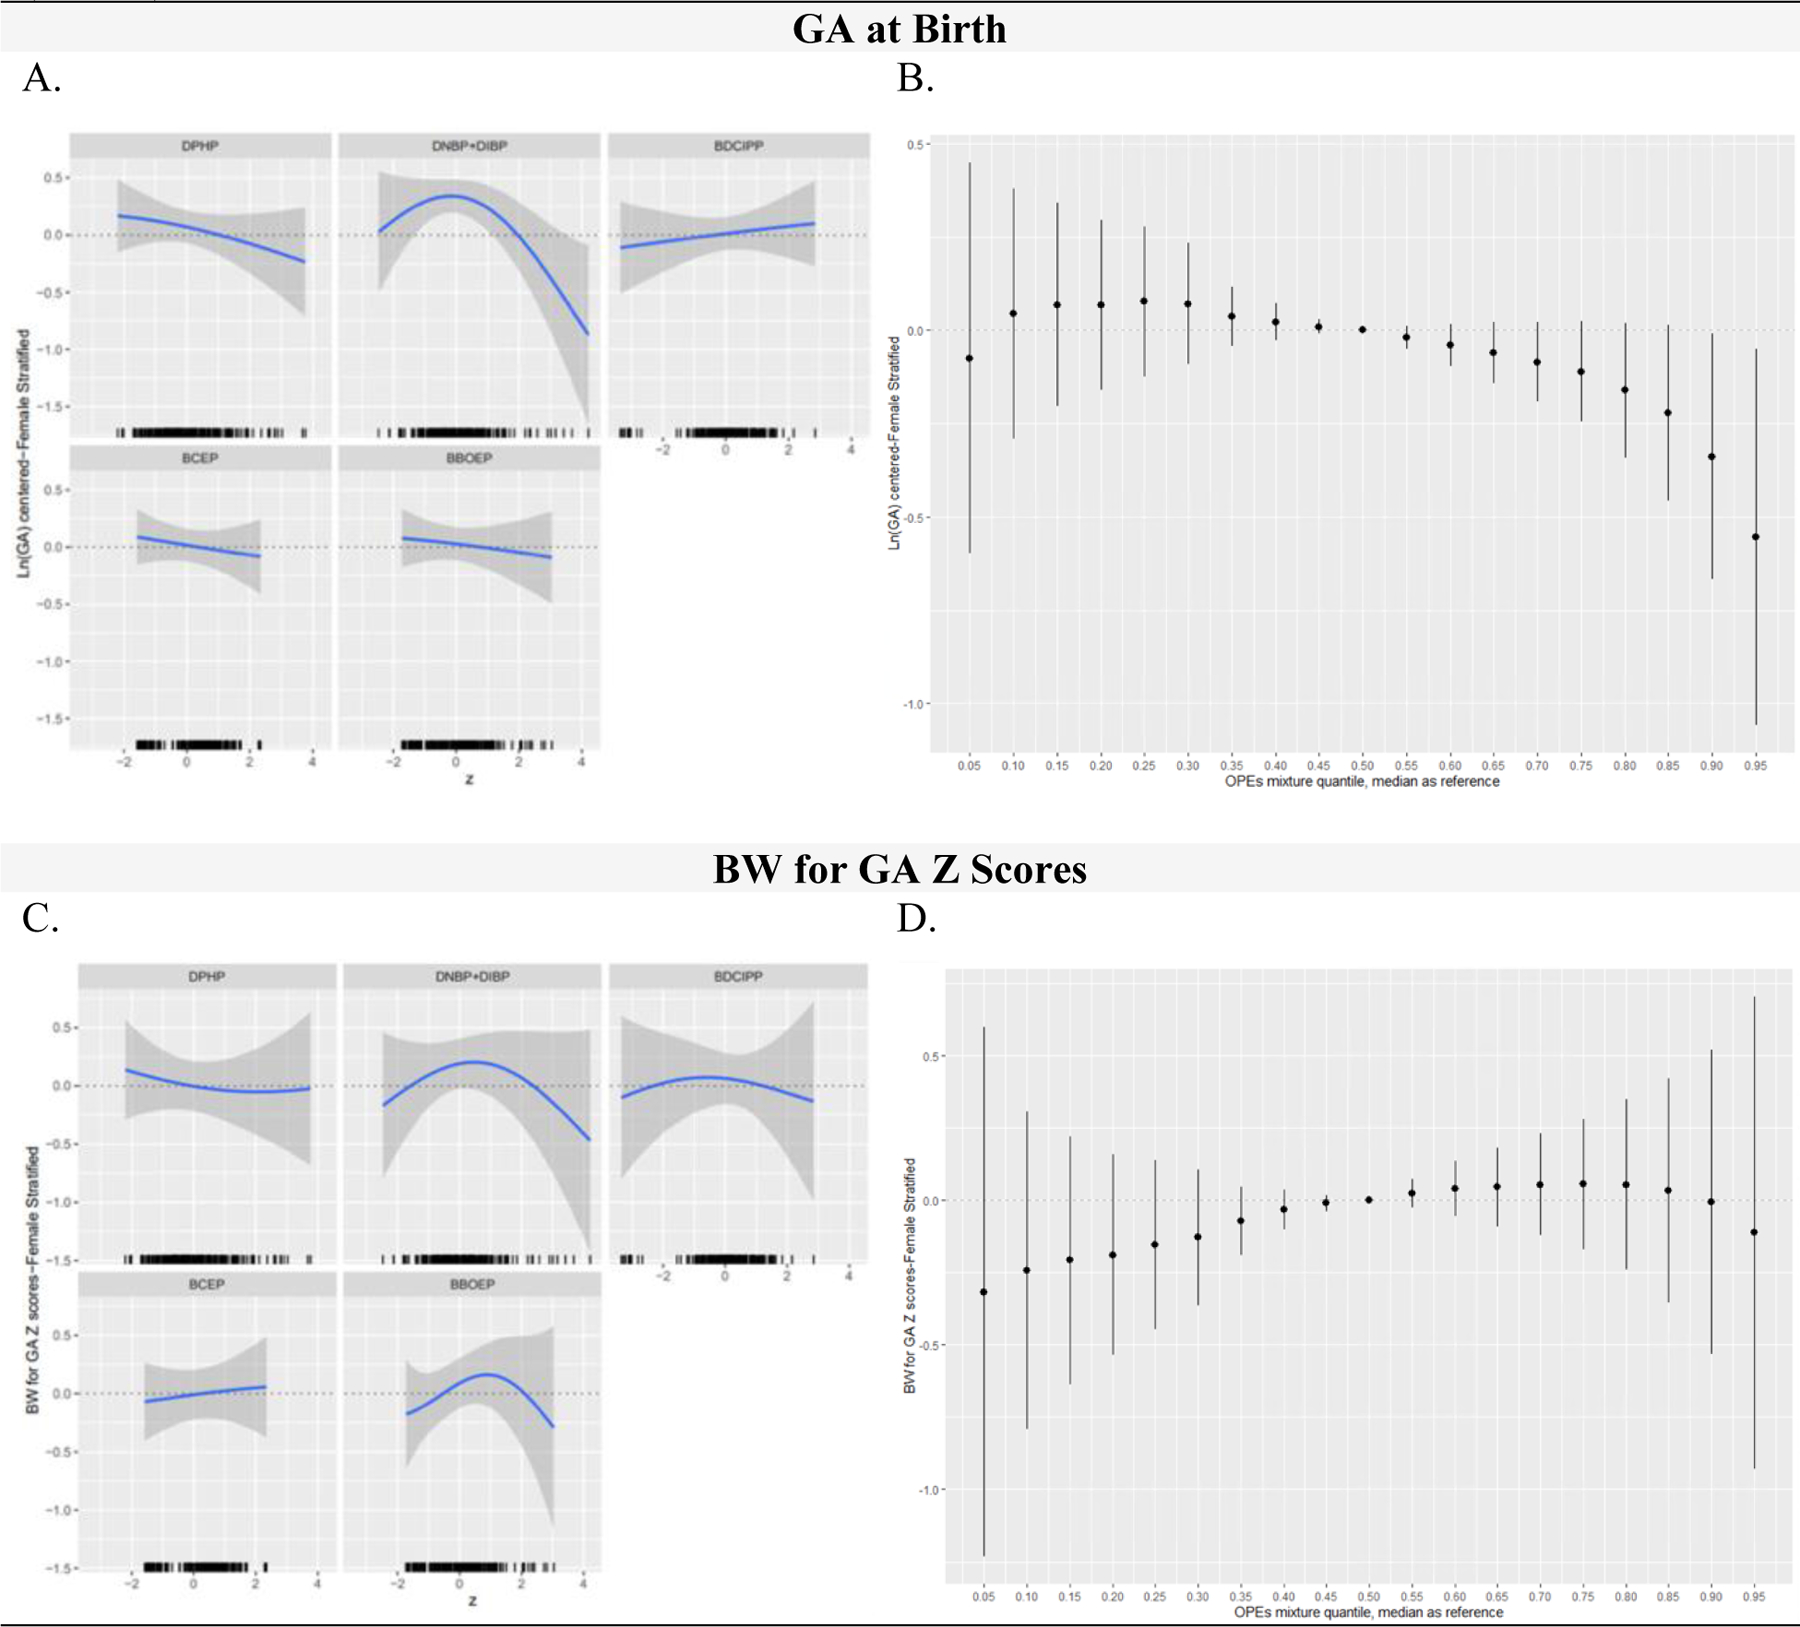
OPE Metabolite Mixtures (ng/mL) and Infant Gestational Age at Birth (weeks) and Birthweight for Gestational Age (BW for GA) Z Scores in Female Stratified Models, Using BKMR (N=215)
Figure 5 includes the univariate relationship between each metabolite and birth outcome, while other metabolites are fixed at their medians, and a rug plot showing the distribution of the specified metabolite along the x-axis of each panel (column 1) and the cumulative metabolite mixture results showing the estimated difference in the birth outcome when setting all metabolites to the percentile specified on the x-axis compared with setting all metabolites to their median values (column 2). All GA at birth outcome models were adjusted for recruitment site, maternal age, season of sample collection, gestational age at sample collection, race/ethnicity, pre-pregnancy BMI, income, education, infant birth order, infant sex, and maternal hypertensive disorders of pregnancy. All BW for GA z score outcome models were adjusted for recruitment site, maternal age, season of sample collection, gestational age at sample collection, race/ethnicity, pre-pregnancy BMI, income, education, infant birth order, and maternal hypertensive disorders of pregnancy. OPE metabolites and GA at birth were natural log-transformed, mean centered, and standard deviation scaled. Continuous covariates were mean-centered and standard deviation scaled. Note: BKMR, Bayesian Kernel Machine Regression; OPE, Organophosphate Ester; DPHP, Diphenyl phosphate; DNBP+DIBP, Sum of Dibutyl phosphate and Di-isobutyl phosphate; BDCIPP, Bis(1,3-dichloro-2-propyl) phosphate; BCEP, Bis(2- chloroethyl) phosphate; BBOEP, Bis(butoxethyl) phosphate.
Figure 6:
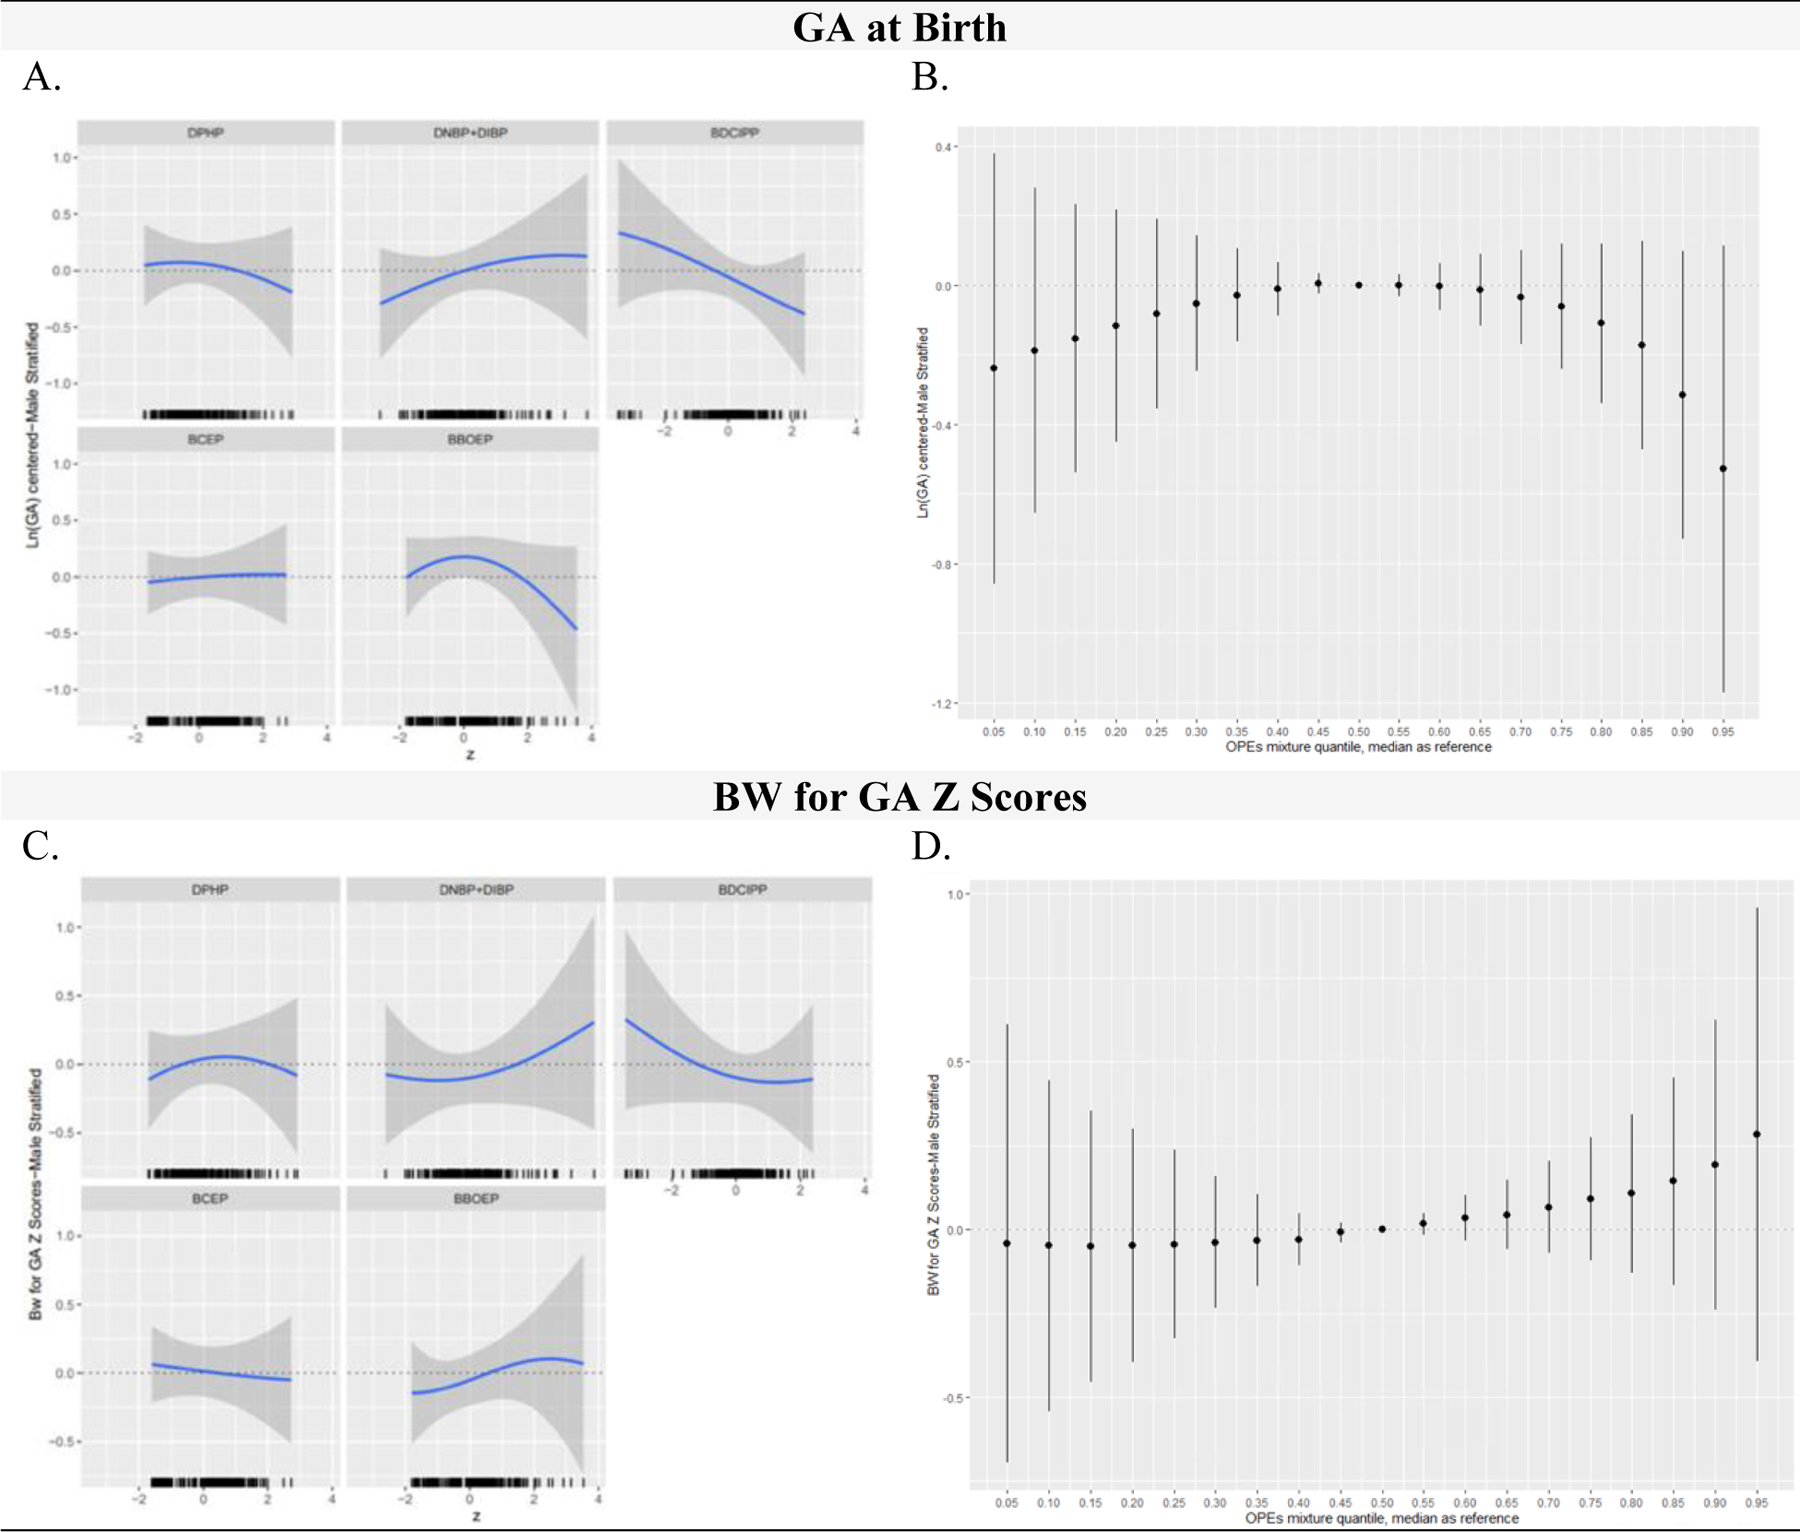
OPE Metabolite Mixtures (ng/mL) and Infant Gestational Age at Birth (weeks) and Birthweight for Gestational Age (BW for GA) Z Scores in Male Stratified Models, Using BKMR (N=206)
Figure 6 includes the univariate relationship between each metabolite and birth outcome, while other metabolites are fixed at the median, and a rug plot showing the distribution of the specified metabolite along the x-axis of each panel (column 1) and the cumulative metabolite mixture results showing the estimated difference in the birth outcome when setting all metabolites to the percentile specified on the x-axis compared with setting all metabolites to their median values (column 2). All GA at birth outcome models were adjusted for recruitment site, maternal age, season of sample collection, gestational age at sample collection, race/ethnicity, pre-pregnancy BMI, income, education, infant birth order, infant sex, and maternal hypertensive disorders of pregnancy. All BW for GA z score outcome models were adjusted for recruitment site, maternal age, season of sample collection, gestational age at sample collection, race/ethnicity, pre-pregnancy BMI, income, education, infant birth order, and maternal hypertensive disorders of pregnancy. OPE metabolites were natural log-transformed, mean centered, and standard deviation scaled. Continuous covariates were mean centered and standard deviation scaled. Note: BKMR, Bayesian Kernel Machine Regression; OPE, Organophosphate Ester; DPHP, Diphenyl phosphate; DNBP+DIBP, Sum of Dibutyl phosphate and Di-isobutyl phosphate; BDCIPP, Bis(1,3-dichloro-2-propyl) phosphate; BCEP, Bis(2- chloroethyl) phosphate; BBOEP, Bis(butoxethyl) phosphate.
Similar to results for female infants, the univariate exposure-response association between BCEP and GA at birth was null for male infants (Figure 6A). However, in contrast to findings for female infants, a marginal inverse association was identified between BDCIPP and GA at birth for males, with a change in log BDCIPP from the 25th to the 75th percentile when all other metabolites were set at the median associated with a decrease in GA at birth of −0.11 (−0.26, 0.03) standard deviations (Table S10). A positive association was identified between DNBP+DIBP and GA at birth at low to moderate concentrations and DPHP and BBOEP had an inverse, non-linear association with GA at birth. However, similar to the full sample and female stratified analysis, all metabolite single effect estimates had 95% Credible Intervals that crossed 0 (Table S10). Compared to the overall model, the male stratified cumulative association between the overall metabolite mixture and GA at birth had a similar non-monotonic inverted U-shape, but all 95% Credible Intervals spanned 0 (Figure 6B).
For both the full and sex-stratified BW for GA z-score models (Figure 4C, 5C, 6C), the univariate exposure-response association between BCEP and BW for GA at birth was null. In models for female infants, DPHP and BW for GA z-scores had a slight non-linear, inverse association which was similar to the linear inverse association observed among all infants but varied from the inverted U-shape association observed for males. In models for all infants, associations between DNBP+DIBP and BW for GA z-scores and BBOEP and BW for GA z-scores had an inverted U-shape, with a more pronounced shape among females but a U-shape association between DNBP+DIBP and BW for GA z-scores among males and a J shaped association between BBOEP and BW for GA z-scores. Among male models, an inverse, non-linear association was identified between BDCIPP and BW for GA z-scores; however, an inverted U-shape association was observed among females. All individual metabolite associations (holding the rest of the metabolites constant at their median values) had single effect estimates with 95% Credible Intervals that spanned the null when the specified metabolite was changed from the 25th to the 75th percentile (Table S11). Similarly, there was no evidence for a cumulative association between the full and sex-stratified metabolite mixtures and BW for GA z-scores (Figure 4D, 5D, 6D).
Pairwise interactions between OPE metabolites and birth outcomes were visually explored and several potential interactions were identified (Figure S8). In the full sample, for the GA at birth model, possible interactions were visually identified between BDCIPP and DNBP+DIBP, such that the inverse association between BDCIPP and GA at birth appeared to be stronger at higher levels of DNBP+DIBP (Figure S8A). Additional possible interactions visually identified between metabolites and GA at birth models included BBOEP and DNBP+DIBP, and DPHP and DNBP+DIBP. No pairwise interactions were visually identified for GA at birth in models for female infants (Figure S8C). In models for male infants, a potential pairwise interaction between BDCIPP and DPHP was visually observed, with the inverse association between BDCIPP and GA at birth being stronger at higher levels of DPHP (Figure S8E). The positive association between DNBP+DIBP and GA at birth also appeared to vary by levels of DPHP, such that the association was slightly attenuated at higher levels of DPHP. In the full sample, the inverse association between BDCIPP and BW for GA z-scores was stronger at lower quantiles of BCEP (Figure S8B). The inverse association between BDCIPP and BW for GA z-scores was stronger at higher quantiles of DNBP+DIBP. In models for female infants, the association between BDCIPP and BW for GA z-score varied by levels of DNBP+DIBP (Figure S8D). In models for male infants, the positive association between BBOEP and BW for GA z-score was stronger at higher levels of DPHP and a stronger inverse association between BCEP and BW for GA z-score was observed higher levels of DPHP (Figure S8F). Additionally, the association between BBOEP and BW for GA z-scores among males was stronger at higher quantiles of DNBP+DIBP and DPHP but attenuated at higher quantiles of BDCIPP.
Results from sensitivity analyses excluding mothers who reported smoking during pregnancy (N=8), were consistent with the primary analysis, with a slight attenuation in associations (Figure S9–S10). Alternative prior assumptions were also explored at lower (b=50) and higher (b=1000) degrees of smoothness. Results from models assuming a lower degree of smoothness were very similar to primary results and results were inversely linear for models assuming a higher degree of smoothness (Figure S11–S16). These results were consistent with the expected results when relaxing and constricting degrees of smoothness, suggesting our results were robust. Sensitivity analyses additionally adjusting for gestational diabetes (Figure S17–S18) and delivery method (Figure S19–S20) were similarly consistent with the primary analysis, with some stronger associations observed between higher OPE mixtures and earlier GA at birth in males when adjusting for delivery method.
4. Discussion
We found evidence that prenatal OPE exposures adversely impact infant GA at birth in sex specific ways when using both traditional single exposure models and a flexible environmental mixture modeling approach, among a sample of predominately low-income, Hispanic participants. Specifically, we found that higher prenatal BDCIPP concentrations were associated with an earlier GA at birth among males in single exposure models. This metabolite also ranked as the highest predictor for GA at birth among males when using a mixture modeling approach. Among female infants, higher exposures to prenatal DNBP+DIBP concentrations were associated with earlier GA at birth when using flexible single exposure models, and DNBP+DIBP similarly ranked as the most important predictor for GA at birth in mixture models, with a possible non-linear association identified. Additionally, higher cumulative OPE metabolite concentrations were associated with an earlier GA at birth, both in the full sample and among females only. There was no evidence of an association between OPEs and BW for GA. Overall, our results stress the importance of considering sex specific impacts of prenatal OPE exposures on children’s health and additionally underline the importance of evaluating the impacts of OPE exposures as a mixture on birth outcomes.
The few epidemiological studies that have evaluated sex specific effects on associations between prenatal OPE exposures and infant birth outcomes have shown conflicting results. A case-control study published by Luo et al. in 2020 among women in Wuhan, China found that third trimester DPHP levels were associated with significantly increased risk of low birthweight which, after stratification by sex, only remained significant among females.53 However, median DPHP concentrations among the Wuhan Maternal and Child Healthcare Hospital prospective birth cohort (Table S2) were substantially lower across both cases (0.06 ng/mL) and controls (0.05 ng/mL) when compared to DPHP concentrations in the MADRES sample (0.77 ng/mL), suggesting possible differences in exposure distributions which may result from a variety of factors, including varying sources of exposure, potentially contributing to the discrepancies in results. A similar study by Hoffman et al. published in 2018 conducted in the Pregnancy Infection and Nutrition Study (PIN), a pregnancy cohort of predominately white (79.7%) and college educated (69.6%) women in North Carolina, found that higher prenatal exposure to BDCIPP was associated with increased odds of preterm delivery among female infants.52 Another study by Crawford et al. published in 2020 on 56 primarily college educated (45.0%) and non-Hispanic white (64.0%) women found that BDCIPP was associated with increased infant length at birth and birthweight in males but DPHP was negatively associated with abdominal circumference at birth in infants overall and female weight.67 Median BDCIPP concentrations among participants in the Women and Infants Hospital of Rhode Island cohort (1.18 ng/mL) were slightly lower than concentrations in the MADRES cohort (1.29 ng/mL), but were fairly comparable overall; however, these slight differences, along with other demographic and exposure collection differences, may have contributed to the discrepancies in results. A small study published by Kuiper et al. in 2020 among predominately white (53%) and college educated women (60%) enrolled in the Origins of Child Health and Resilience in Development (ORCHARD) pregnancy cohort (n=76) found no significant associations between OPE metabolites collected throughout pregnancy and infant BW for GA z-scores or GA at delivery, although inverse patterns observed between BDCIPP and DPHP and BW for GA z-scores and GA at delivery were similar to our results.31 Median BDCIPP concentrations among the MADRES study were two-fold higher than concentrations among ORCHARD participants (0.51 ng/mL) but DPHP concentrations were lower among MADRES participants compared to concentrations among ORCHARD participants (1.12 ng/mL). Another study on 340 mother-infant dyads participating in the Health Outcomes and Measures of the Environment (HOME) cohort located in Cincinnati, Ohio found positive associations between 16-week BCEP and 26-week DPHP with gestational age, but inverse associations between BCEP at 16 weeks and birthweight among female newborns and 26 week DNBP and ponderal index at birth among male newborns.68 Geometric mean concentrations of DPHP (1.82 ng/mL) and BCEP (0.60 ng/mL) among HOME participants were generally higher than geometric mean concentrations observed among MADRES participants but BDCIPP concentrations (0.80 ng/mL) were relatively lower.
Our study found sex-specific adverse impacts of prenatal BDCIPP on male GA at birth and DNBP+DIBP on female GA at birth in individual metabolite models. OPE mixtures analyses similarly indicated the strongest influence of BDCIPP on male GA at birth and DNBP+DIBP on female GA at birth. Our mixtures analysis overall showed that higher exposure to the overall OPE mixture (i.e., higher percentiles of exposures) was associated with adverse impacts on infant GA at birth, with more pronounced associations on female infants. Discrepancies in findings across each of these studies may be driven by multiple factors, including the previously discussed differences in exposure distributions across studies, along with varying geographic characteristics, underpowered samples to detect associations, and varying exposure measurement methods (i.e., number of measurements, GA at collection, and varying years of collection) which may contribute to exposure misclassification. For instance, while OPEs were measured at a single timepoint in pregnancy in our study (~ 31.5 weeks), the PIN study (~27 weeks), and the Wuhan Maternal and Child Healthcare Hospital prospective birth cohort (third trimester), OPEs were measured multiple times throughout pregnancy in the Women and Infants Hospital of Rhode Island cohort (~12, 28, 35 weeks), the HOME study (~16 and 26 weeks), and the ORCHARD study (~ 15.3, 22.3, 30.9 weeks), with more exposure misclassification likely in studies with a single timepoint. Additionally, variability in the geographical location and the years samples were collected may further contribute to differences in exposure distributions, given increasing OPE use in previous decades and state/country specific regulations which may impact OPE usage.32
Although the biological mechanisms that contribute to OPE impacts on birth outcomes are largely unknown, several hypothesized sex-specific mechanisms have been proposed.18,69 One of the primary underlying mechanisms suggested by growing literature is the sex-specific impacts of OPE disruptions on the endocrine system, particularly thyroid hormones, which play a critical role in fetal development.14,70,71 Previous epidemiological literature has found positive associations between prenatal DBUP and thyroid stimulating hormone (TSH) in newborns, specifically female infants, with results suggesting partial mediation by oxidative stress on DNA damage and lipid peroxidation.14 Associations between BDCIPP and lower levels of newborn triiodothyronine and thyroxine have also been observed, with marginal associations between DPHP and DNBP and lower triiodothyronine and thyroxine levels, but no observed sex-specific interactions.72 However, animal studies in male zebrafish have observed non-monotonic associations between TDCIPP and testosterone, hypothesized to occur via impacts on estrogenic and antiandrogenic activity on zebrafish.73,74 Observational studies have also observed associations between concentrations of TDCIPP in dust and BDCIPP in urine with altered hormone levels in adult men.75,76 Additionally, OPE metabolites may also disrupt the hypothalamic pituitary-adrenal (HPA), hypothalamic-pituitary-thyroid (HPT), and hypothalamic pituitary-gonadal (HPG) axes along with nuclear receptors of the endocrine system, including estrogen receptors, androgen receptors, and glucocorticoid receptors, which are involved in important regulatory mechanisms for fetal development and metabolism.12,77–79 There are biological indications that these effects may be sex specific given the sex differences in infants’ estrogen receptor expression and the estrogen-like effects of OPEs acting on various hormone related pathways.80,81
The adverse effects of OPEs on placental development is another hypothesized underlying mechanism for the observed sex-specific association between OPEs and birth outcomes.33 Prior epidemiological studies have found associations between higher OPEs and increased oxidative stress and reduced immunoreactivity of integrin alpha-1 (ITGA1) and vascular endothelial-cadherin (CDH5) in uterine-invading cytotrophoblast (CTB) cells which may result in placental disruptions and pregnancy complications.33 Although there is limited literature on the sex-specific effects of OPEs on placentation, some studies suggest sex-specific fetal placentation, with varying responses to environmental insults by fetal sex.82 For example, a study evaluating brominated flame retardants found that placenta samples of male infants had higher concentrations of PBDEs and thyroid levels despite similar maternal serum concentrations across sex.83 These sex-specific findings were hypothesized to have resulted from sex differences in the chemical uptake of thyroid hormone transporting membrane proteins in placental tissue, impacting maternal supply of thyroid hormones to support fetal growth.83 Since placental disruptions and pregnancy complications have been associated with adverse birth outcomes, the possible sex-specific impacts of OPEs on placental functioning may contribute to the sex-specific differences in birth outcomes.82,84 Given the observed non-monotonic shape between the OPE mixture and infant GA at birth and sex differences in our results, further research evaluating endocrine disruption as a possible underlying mechanism is warranted.
Different OPEs are applied to a variety of consumer products as flame retardants and plasticizers, resulting in concurrent exposures to multiple OPEs.19 Mixtures modeling approaches, such as BKMR, provide us with the opportunity to evaluate the co-occurring impacts of multiple OPEs on infant birth outcomes. For instance, we observed various possible pairwise interactions, suggesting possible synergistic associations between different OPE metabolites and infant birth outcomes which merit further research. Although we observed similar associations between sex-specific single exposure models and mixtures models, there were some minor differences in our results in models evaluating all infants. For example, even though we saw possible inverse patterns, we did not observe significant associations between the individual effects of OPE metabolites on GA at birth among all infants in single metabolite models while we observed lower GA at birth among all infants with a higher cumulative OPE metabolite exposure in mixtures models. This slight difference between the individual chemical and the mixture approach highlights the value of using mixtures methods to get a comprehensive understanding of the impacts of OPEs on infant health, as most individuals are exposed simultaneously to multiple OPE metabolites which may be correlated and may interact with one another.27
The present study has many important strengths. For one, this study was based on a prospective pregnancy cohort with urine specimens collected before the outcomes of interest. Secondly, measures of urinary OPE metabolites were used to assess exposures and are generally considered reliable indicators of OPE exposures.19 Additionally, the population evaluated in this study is comprised largely of women originating from Latin America, who are historically underrepresented in U.S. biomedical and population health research, therefore advancing opportunities to address environmental health disparities and inform solutions for environmental justice. We also evaluated various OPE metabolites which are understudied, such as DNBP+DIBP, BCEP, and BBOEP, which advances opportunities for risk assessment and subsequent regulations and interventions. An additional strength was the use of a flexible environmental mixture modeling approach to assess the association between mixtures of OPE metabolites and birth outcomes.
This study also has some limitations. For one, only single spot urine samples collected during the third trimester were measured to assess OPE exposures throughout pregnancy which might have led to some exposure misclassification given the relatively short half-life of OPEs.85–88 However, previous studies indicate moderate to good reproducibility for DPHP and BDCIPP levels throughout pregnancy, although literature on the reproducibility of the remaining metabolites is limited.28,56 Additionally, despite adjusting for many key covariates identified in the literature, residual confounding could still be present, especially for covariates such as secondhand smoke. We were further underpowered to evaluate clinically relevant cut-offs of our birth outcomes dichotomously, such as preterm birth (≤ 37 weeks) and low birthweight (≤ 2500 grams) as the number of babies born with these conditions was relatively small. Although a big strength of our cohort’s demographic characteristics is the ability to elucidate possible disparities in the impacts of OPEs on early health outcomes, this may limit the generalizability of our results. The timing of OPE collection (mean GA at collection: 31.5 weeks) was an additional limitation of this study given that it may have resulted in survival bias through the exclusion of some extremely preterm (<28 weeks) and very preterm (28–32 weeks) births, since they would not have reached this sample collection timepoint prior to delivery. However, it is important to note that extremely preterm births and very preterm births are particularly rare among the full MADRES cohort (extremely preterm=0.3%; very preterm= 0.9%), minimizing some of our concerns regarding the potential impacts of survival bias on our results. Additionally, if higher exposures to OPEs truly result in adverse impacts on GA at birth, the timing of OPE collection would have likely biased results towards the null since infants most impacted would have been excluded from the analysis.
5. Conclusions
Our results suggest sex-specific adverse effects of exposure to OPEs on infant GA at birth. Since infant GA at birth is an important predictor of lifelong health, this study highlights the potential for longlasting health implications of toxic environmental exposures during pregnancy and the importance of chemical reduction strategies to support healthy fetal development. Future research aimed at investigating the underlying mechanisms between OPE exposures and GA at birth is warranted.
Supplementary Material
Highlights.
Early GA at birth was associated with organophosphate esters in sex-specific ways.
Higher BDCIPP was associated with earlier GA at birth among male infants.
Higher DNBP+DIBP was associated with earlier GA at birth among female infants.
Higher organophosphate ester mixtures were associated with earlier GA at birth.
Individual OPE metabolites and mixtures were not associated with BW-for-GA.
Acknowledgements
We are indebted to the MADRES study families, nurses, midwives, physicians, and staff at each of our study sites for their cooperation and participation and especially to the members of the MADRES study team for their efforts to improve the health of underserved communities.
Funding:
This work was supported by the Maternal and Developmental Risks from Environmental and Social Stressors (MADRES) Center (grant #s P50ES026086, 83615801, P50MD015705) funded by the National Institute of Environmental Health Sciences, the National Institute for Minority Health and Health Disparities and the Environmental Protection Agency; the Southern California Environmental Health Sciences Center (grant # 5P30ES007048) funded by the National Institute of Environmental Health Sciences, and the Life course Approach to Developmental Repercussions of Environmental Agents on Metabolic and Respiratory health (LA DREAMERs) (grant #s UH3OD023287) funded by the National Institutes of Health Office of the Director ECHO Program. Research reported in this publication was supported by the National Institute of Environmental Health Sciences Award Number U2CES026542. Dr. Howe is supported by an NIH Pathway to Independence Award (R00 ES030400).
Role of Funder:
The funding agencies had no role in the design of the study, the collection, analysis, or interpretation of data or in the writing of the manuscript.
Abbreviations:
- BBOEP
bis(butoxethyl) phosphate
- BCEP
bis(2- chloroethyl) phosphate
- BCIPP
bis(1-chloro-2-propyl) phosphate
- BDCIPP
bis(1,3-dichloro-2-propyl) phosphate
- BEHP
bis(2-ethylhexyl) phosphate
- BKMR
Bayesian Kernel Machine Regression
- BMPP
bis(2-methylphenyl) phosphate
- BW
birthweight
- CrI
Credible Interval
- DPHP
diphenyl phosphate
- DPRP
dipropyl phosphate
- DNBP+DIBP
sum of dibutyl phosphate and di-isobutyl phosphate
- GA
gestational age
- HHEAR
Human Health Exposure Analysis Resource
- LOD
limit of detection
- MADRES
Maternal And Developmental Risks from Environmental and Social Stressors
- ND
not detected
- OPEs
organophosphate esters
- PIPs
posterior inclusion probability
- SG
specific gravity
Footnotes
Publisher's Disclaimer: This is a PDF file of an unedited manuscript that has been accepted for publication. As a service to our customers we are providing this early version of the manuscript. The manuscript will undergo copyediting, typesetting, and review of the resulting proof before it is published in its final form. Please note that during the production process errors may be discovered which could affect the content, and all legal disclaimers that apply to the journal pertain.
Ethics approval and consent to participate: The full study protocol was approved by the University of Southern California Institutional Review Board (ethics approval number=HS-15–00498) and written informed consent and HIPAA authorization for medical records abstraction were obtained prior to participation by bilingual MADRES staff members.
Declaration of interests
The authors declare that they have no known competing financial interests or personal relationships that could have appeared to influence the work reported in this paper.
CRediT authorship contribution statement
Ixel Hernandez-Castro: Conceptualization; Methodology; Formal Analysis; Investigation; Writing–Original Draft. Sandrah P Eckel: Conceptualization; Methodology; Investigation; Writing–Review & Editing; Caitlin G. Howe: Conceptualization; Methodology; Investigation; Writing–Review & Editing; Zhongzheng Niu: Investigation; Writing–Review & Editing. Kurunthachalam Kannan: Investigation; Writing–Review & Editing. Morgan Robinson: Investigation; Writing–Review & Editing. Helen B. Foley: Investigation; Writing–Review & Editing. Brendan Grubbs: Conceptualization; Writing–Review & Editing. Laila Al-Marayati: Conceptualization; Writing–Review & Editing. Deborah Lerner: Conceptualization; Writing–Review & Editing. Nathana Lurvey: Conceptualization; Writing–Review & Editing. Max T Aung: Conceptualization; Writing–Review & Editing. Rima Habre: Conceptualization; Funding Acquisition; Writing–Review & Editing. Genevieve F Dunton: Conceptualization; Funding Acquisition; Writing–Review & Editing. Shohreh F Farzan: Conceptualization; Funding Acquisition; Writing–Review & Editing. Carrie V Breton: Conceptualization; Funding Acquisition; Writing–Review & Editing. Theresa M. Bastain: Supervision; Investigation; Conceptualization; Funding Acquisition; Writing–Review & Editing.
Data Availability Statement
The datasets used and/or analyzed during the current study are available from the corresponding author on reasonable request and after approval by the USC Institutional Review Board.
References
- 1.Upadhyay RP, Naik G, Choudhary TS, et al. Cognitive and motor outcomes in children born low birth weight: a systematic review and meta-analysis of studies from South Asia. BMC Pediatrics 2019; 19: 35. DOI: 10.1186/s12887-019-1408-8. [DOI] [PMC free article] [PubMed] [Google Scholar]
- 2.Whitaker AH, Feldman JF, Lorenz JM, et al. Motor and Cognitive Outcomes in Nondisabled Low-Birth-Weight Adolescents: Early Determinants. Archives of Pediatrics & Adolescent Medicine 2006; 160: 1040–1046. DOI: 10.1001/archpedi.160.10.1040. [DOI] [PubMed] [Google Scholar]
- 3.Smith CJ, Ryckman KK, Barnabei VM, et al. The impact of birth weight on cardiovascular disease risk in the Women’s Health Initiative. Nutr Metab Cardiovasc Dis 2016; 26: 239–245. 2015/12/29. DOI: 10.1016/j.numecd.2015.10.015. [DOI] [PMC free article] [PubMed] [Google Scholar]
- 4.Jornayvaz FR, Vollenweider P, Bochud M, et al. Low birth weight leads to obesity, diabetes and increased leptin levels in adults: the CoLaus study. Cardiovasc Diabetol 2016; 15: 73. 2016/05/05. DOI: 10.1186/s12933-016-0389-2. [DOI] [PMC free article] [PubMed] [Google Scholar]
- 5.Schieve LA, Tian LH, Rankin K, et al. Population impact of preterm birth and low birth weight on developmental disabilities in US children. Ann Epidemiol 2016; 26: 267–274. 2016/03/22. DOI: 10.1016/j.annepidem.2016.02.012. [DOI] [PMC free article] [PubMed] [Google Scholar]
- 6.Mehra R, Keene DE, Kershaw TS, et al. Racial and ethnic disparities in adverse birth outcomes: Differences by racial residential segregation. SSM Popul Health 2019; 8: 100417–100417. DOI: 10.1016/j.ssmph.2019.100417. [DOI] [PMC free article] [PubMed] [Google Scholar]
- 7.Su D, Samson K, Hanson C, et al. Racial and ethnic disparities in birth Outcomes: A decomposition analysis of contributing factors. Prev Med Rep 2021; 23: 101456–101456. DOI: 10.1016/j.pmedr.2021.101456. [DOI] [PMC free article] [PubMed] [Google Scholar]
- 8.Burris HH, Lorch SA, Kirpalani H, et al. Racial disparities in preterm birth in USA: a biosensor of physical and social environmental exposures. Arch Dis Child 2019; 104: 931–935. 2019/03/08. DOI: 10.1136/archdischild-2018-316486. [DOI] [PMC free article] [PubMed] [Google Scholar]
- 9.Padula AM, Huang H, Baer RJ, et al. Environmental pollution and social factors as contributors to preterm birth in Fresno County. Environmental health : a global access science source 2018; 17: 7070. DOI: 10.1186/s12940-018-0414-x. [DOI] [PMC free article] [PubMed] [Google Scholar]
- 10.Huo W, Xia W, Wan Y, et al. Maternal urinary bisphenol A levels and infant low birth weight: A nested case-control study of the Health Baby Cohort in China. Environ Int 2015; 85: 96–103. 2015/09/19. DOI: 10.1016/j.envint.2015.09.005. [DOI] [PubMed] [Google Scholar]
- 11.Li X, Huang S, Jiao A, et al. Association between ambient fine particulate matter and preterm birth or term low birth weight: An updated systematic review and meta-analysis. Environ Pollut 2017; 227: 596–605. 2017/05/02. DOI: 10.1016/j.envpol.2017.03.055. [DOI] [PubMed] [Google Scholar]
- 12.Kojima H, Takeuchi S, Itoh T, et al. In vitro endocrine disruption potential of organophosphate flame retardants via human nuclear receptors. Toxicology 2013; 314: 76–83. [DOI] [PubMed] [Google Scholar]
- 13.Trowbridge J, Gerona R, McMaster M, et al. Organophosphate and Organohalogen Flame-Retardant Exposure and Thyroid Hormone Disruption in a Cross-Sectional Study of Female Firefighters and Office Workers from San Francisco. Environmental Science & Technology 2022; 56: 440–450. DOI: 10.1021/acs.est.1c05140. [DOI] [PMC free article] [PubMed] [Google Scholar]
- 14.Yao Y, Li M, Pan L, et al. Exposure to organophosphate ester flame retardants and plasticizers during pregnancy: Thyroid endocrine disruption and mediation role of oxidative stress. Environ Int 2021; 146: 106215. 2020/10/29. DOI: 10.1016/j.envint.2020.106215. [DOI] [PubMed] [Google Scholar]
- 15.Blum A, Behl M, Birnbaum L, et al. Organophosphate Ester Flame Retardants: Are They a Regrettable Substitution for Polybrominated Diphenyl Ethers? Environ Sci Technol Lett 2019; 6: 638649. 2020/06/05. DOI: 10.1021/acs.estlett.9b00582. [DOI] [PMC free article] [PubMed] [Google Scholar]
- 16.Li M, Yao Y, Wang Y, et al. Organophosphate ester flame retardants and plasticizers in a Chinese population: Significance of hydroxylated metabolites and implication for human exposure. Environ Pollut 2020; 257: 113633. 2019/11/26. DOI: 10.1016/j.envpol.2019.113633. [DOI] [PubMed] [Google Scholar]
- 17.Patisaul HB, Behl M, Birnbaum LS, et al. Beyond Cholinesterase Inhibition: Developmental Neurotoxicity of Organophosphate Ester Flame Retardants and Plasticizers. Environ Health Perspect 2021; 129: 105001. 2021/10/07. DOI: 10.1289/ehp9285. [DOI] [PMC free article] [PubMed] [Google Scholar]
- 18.Yang J, Zhao Y, Li M, et al. A Review of a Class of Emerging Contaminants: The Classification, Distribution, Intensity of Consumption, Synthesis Routes, Environmental Effects and Expectation of Pollution Abatement to Organophosphate Flame Retardants (OPFRs). Int J Mol Sci 2019; 20 2019/06/20. DOI: 10.3390/ijms20122874. [DOI] [PMC free article] [PubMed] [Google Scholar]
- 19.Hou R, Xu Y and Wang Z. Review of OPFRs in animals and humans: Absorption, bioaccumulation, metabolism, and internal exposure research. Chemosphere 2016; 153: 78–90. DOI: 10.1016/j.chemosphere.2016.03.003. [DOI] [PubMed] [Google Scholar]
- 20.Stapleton HM, Klosterhaus S, Eagle S, et al. Detection of organophosphate flame retardants in furniture foam and U.S. house dust. Environ Sci Technol 2009; 43: 7490–7495. 2009/10/24. DOI: 10.1021/es9014019. [DOI] [PMC free article] [PubMed] [Google Scholar]
- 21.Du J, Li H, Xu S, et al. A review of organophosphorus flame retardants (OPFRs): occurrence, bioaccumulation, toxicity, and organism exposure. Environ Sci Pollut Res Int 2019; 26: 22126–22136. 2019/06/28. DOI: 10.1007/s11356-019-05669-y. [DOI] [PubMed] [Google Scholar]
- 22.He R, Li Y, Xiang P, et al. Organophosphorus flame retardants and phthalate esters in indoor dust from different microenvironments: Bioaccessibility and risk assessment. Chemosphere 2016; 150: 528535. 2015/11/21. DOI: 10.1016/j.chemosphere.2015.10.087. [DOI] [PubMed] [Google Scholar]
- 23.Pantelaki I and Voutsa D. Organophosphate flame retardants (OPFRs): A review on analytical methods and occurrence in wastewater and aquatic environment. Sci Total Environ 2019; 649: 247–263. 2018/09/03. DOI: 10.1016/j.scitotenv.2018.08.286. [DOI] [PubMed] [Google Scholar]
- 24.Thomas MB, Stapleton HM, Dills RL, et al. Demographic and dietary risk factors in relation to urinary metabolites of organophosphate flame retardants in toddlers. Chemosphere 2017; 185: 918–925. 2017/08/03. DOI: 10.1016/j.chemosphere.2017.07.015. [DOI] [PubMed] [Google Scholar]
- 25.Wang X, Zhu Q, Yan X, et al. A review of organophosphate flame retardants and plasticizers in the environment: Analysis, occurrence and risk assessment. Sci Total Environ 2020; 731: 139071. 2020/05/22. DOI: 10.1016/j.scitotenv.2020.139071. [DOI] [PubMed] [Google Scholar]
- 26.Wang Y, Li W, Martínez-Moral MP, et al. Metabolites of organophosphate esters in urine from the United States: Concentrations, temporal variability, and exposure assessment. Environ Int 2019; 122: 213–221. 2018/11/20. DOI: 10.1016/j.envint.2018.11.007. [DOI] [PMC free article] [PubMed] [Google Scholar]
- 27.Ospina M, Jayatilaka NK, Wong LY, et al. Exposure to organophosphate flame retardant chemicals in the U.S. general population: Data from the 2013–2014 National Health and Nutrition Examination Survey. Environ Int 2018; 110: 32–41. 2017/11/06. DOI: 10.1016/j.envint.2017.10.001. [DOI] [PMC free article] [PubMed] [Google Scholar]
- 28.Hoffman K, Daniels JL and Stapleton HM. Urinary metabolites of organophosphate flame retardants and their variability in pregnant women. Environ Int 2014; 63: 169–172. 2013/12/10. DOI: 10.1016/j.envint.2013.11.013. [DOI] [PMC free article] [PubMed] [Google Scholar]
- 29.Castorina R, Butt C, Stapleton HM, et al. Flame retardants and their metabolites in the homes and urine of pregnant women residing in California (the CHAMACOS cohort). Chemosphere 2017; 179: 159166. 2017/03/22. DOI: 10.1016/j.chemosphere.2017.03.076. [DOI] [PMC free article] [PubMed] [Google Scholar]
- 30.Doherty BT, Hoffman K, Keil AP, et al. Prenatal exposure to organophosphate esters and cognitive development in young children in the Pregnancy, Infection, and Nutrition Study. Environ Res 2019; 169: 33–40. 2018/11/09. DOI: 10.1016/j.envres.2018.10.033. [DOI] [PMC free article] [PubMed] [Google Scholar]
- 31.Kuiper JR, Stapleton HM, Wills-Karp M, et al. Predictors and reproducibility of urinary organophosphate ester metabolite concentrations during pregnancy and associations with birth outcomes in an urban population. Environ Health 2020; 19: 55. 2020/05/26. DOI: 10.1186/s12940-020-00610-0. [DOI] [PMC free article] [PubMed] [Google Scholar]
- 32.Hoffman K, Butt CM, Webster TF, et al. Temporal Trends in Exposure to Organophosphate Flame Retardants in the United States. Environmental Science & Technology Letters 2017; 4: 112–118. DOI: 10.1021/acs.estlett.6b00475. [DOI] [PMC free article] [PubMed] [Google Scholar]
- 33.Varshavsky JR, Robinson JF, Zhou Y, et al. Organophosphate Flame Retardants, Highly Fluorinated Chemicals, and Biomarkers of Placental Development and Disease During Mid-Gestation. Toxicol Sci 2021; 181: 215–228. 2021/03/08. DOI: 10.1093/toxsci/kfab028. [DOI] [PMC free article] [PubMed] [Google Scholar]
- 34.Ding J, Xu Z, Huang W, et al. Organophosphate ester flame retardants and plasticizers in human placenta in Eastern China. Sci Total Environ 2016; 554-555: 211–217. 2016/03/08. DOI: 10.1016/j.scitotenv.2016.02.171. [DOI] [PubMed] [Google Scholar]
- 35.Zhao F, Chen M, Gao F, et al. Organophosphorus Flame Retardants in Pregnant Women and Their Transfer to Chorionic Villi. Environ Sci Technol 2017; 51: 6489–6497. 2017/05/19. DOI: 10.1021/acs.est.7b01122. [DOI] [PubMed] [Google Scholar]
- 36.Bai XY, Lu SY, Xie L, et al. A pilot study of metabolites of organophosphorus flame retardants in paired maternal urine and amniotic fluid samples: potential exposure risks of tributyl phosphate to pregnant women. Environ Sci Process Impacts 2019; 21: 124–132. 2018/11/15. DOI: 10.1039/c8em00389k. [DOI] [PubMed] [Google Scholar]
- 37.Li H, Su G, Zou M, et al. Effects of Tris(1,3-dichloro-2-propyl) Phosphate on Growth, Reproduction, and Gene Transcription of Daphnia magna at Environmentally Relevant Concentrations. Environmental Science & Technology 2015; 49: 12975–12983. DOI: 10.1021/acs.est.5b03294. [DOI] [PubMed] [Google Scholar]
- 38.Farhat A, Crump D, Chiu S, et al. In ovo effects of two organophosphate flame retardants—TCPP and TDCPP—on pipping success, development, mRNA expression, and thyroid hormone levels in chicken embryos. toxicological sciences 2013; 134: 92–102. [DOI] [PubMed] [Google Scholar]
- 39.Chen G, Jin Y, Wu Y, et al. Exposure of male mice to two kinds of organophosphate flame retardants (OPFRs) induced oxidative stress and endocrine disruption. Environ Toxicol Pharmacol 2015; 40: 310–318. 2015/07/18. DOI: 10.1016/j.etap.2015.06.021. [DOI] [PubMed] [Google Scholar]
- 40.Yu L, Jia Y, Su G, et al. Parental transfer of tris(1,3-dichloro-2-propyl) phosphate and transgenerational inhibition of growth of zebrafish exposed to environmentally relevant concentrations. Environ Pollut 2017; 220: 196–203. 2016/09/21. DOI: 10.1016/j.envpol.2016.09.039. [DOI] [PubMed] [Google Scholar]
- 41.Sun L, Tan H, Peng T, et al. Developmental neurotoxicity of organophosphate flame retardants in early life stages of Japanese medaka (Oryzias latipes). Environ Toxicol Chem 2016; 35: 2931–2940. 2016/05/06. DOI: 10.1002/etc.3477. [DOI] [PubMed] [Google Scholar]
- 42.Zhu Y, Ma X, Su G, et al. Environmentally Relevant Concentrations of the Flame Retardant Tris(1,3-dichloro-2-propyl) Phosphate Inhibit Growth of Female Zebrafish and Decrease Fecundity. Environ Sci Technol 2015; 49: 14579–14587. 2015/10/30. DOI: 10.1021/acs.est.5b03849. [DOI] [PubMed] [Google Scholar]
- 43.Wang Q, Liang K, Liu J, et al. Exposure of zebrafish embryos/larvae to TDCPP alters concentrations of thyroid hormones and transcriptions of genes involved in the hypothalamic–pituitary–thyroid axis. Aquatic toxicology 2013; 126: 207–213. [DOI] [PubMed] [Google Scholar]
- 44.Zhong X, Wu J, Ke W, et al. Neonatal exposure to organophosphorus flame retardant TDCPP elicits neurotoxicity in mouse hippocampus via microglia-mediated inflammation in vivo and in vitro. Arch Toxicol 2020; 94: 541–552. 2020/01/03. DOI: 10.1007/s00204-019-02635-y. [DOI] [PubMed] [Google Scholar]
- 45.Zhong X, Yu Y, Wang C, et al. Hippocampal proteomic analysis reveals the disturbance of synaptogenesis and neurotransmission induced by developmental exposure to organophosphate flame retardant triphenyl phosphate. J Hazard Mater 2021; 404: 124111. 2020/11/15. DOI: 10.1016/j.jhazmat.2020.124111. [DOI] [PubMed] [Google Scholar]
- 46.Ferrante J Toxicity review of aromatic phosphate plasticizers. Bethesda, MD 1999; 20814. [Google Scholar]
- 47.Dishaw LV, Powers CM, Ryde IT, et al. Is the PentaBDE replacement, tris (1,3-dichloro-2-propyl) phosphate (TDCPP), a developmental neurotoxicant? Studies in PC12 cells. Toxicol Appl Pharmacol 2011; 256: 281–289. 2011/01/19. DOI: 10.1016/j.taap.2011.01.005. [DOI] [PMC free article] [PubMed] [Google Scholar]
- 48.Fu J, Han J, Zhou B, et al. Toxicogenomic responses of zebrafish embryos/larvae to tris (1, 3-dichloro-2-propyl) phosphate (TDCPP) reveal possible molecular mechanisms of developmental toxicity. Environmental science & technology 2013; 47: 10574–10582. [DOI] [PubMed] [Google Scholar]
- 49.Shi Q, Tsui MMP, Hu C, et al. Acute exposure to triphenyl phosphate (TPhP) disturbs ocular development and muscular organization in zebrafish larvae. Ecotoxicol Environ Saf 2019; 179: 119–126. 2019/04/30. DOI: 10.1016/j.ecoenv.2019.04.056. [DOI] [PubMed] [Google Scholar]
- 50.Chen H, Wang P, Du Z, et al. Oxidative stress, cell cycle arrest, DNA damage and apoptosis in adult zebrafish (Danio rerio) induced by tris(1,3-dichloro-2-propyl) phosphate. Aquat Toxicol 2018; 194: 37–45. 2017/11/18. DOI: 10.1016/j.aquatox.2017.11.001. [DOI] [PubMed] [Google Scholar]
- 51.Rock KD, St Armour G, Horman B, et al. Effects of Prenatal Exposure to a Mixture of Organophosphate Flame Retardants on Placental Gene Expression and Serotonergic Innervation in the Fetal Rat Brain. Toxicol Sci 2020; 176: 203–223. 2020/04/04. DOI: 10.1093/toxsci/kfaa046. [DOI] [PMC free article] [PubMed] [Google Scholar]
- 52.Hoffman K, Stapleton HM, Lorenzo A, et al. Prenatal exposure to organophosphates and associations with birthweight and gestational length. Environ Int 2018; 116: 248–254. 2018/04/27. DOI: 10.1016/j.envint.2018.04.016. [DOI] [PMC free article] [PubMed] [Google Scholar]
- 53.Luo D, Liu W, Tao Y, et al. Prenatal Exposure to Organophosphate Flame Retardants and the Risk of Low Birth Weight: A Nested Case-Control Study in China. Environ Sci Technol 2020; 54: 33753385. 2020/02/29. DOI: 10.1021/acs.est.9b06026. [DOI] [PubMed] [Google Scholar]
- 54.Bastain TM, Chavez T, Habre R, et al. Study Design, Protocol and Profile of the Maternal And Developmental Risks from Environmental and Social Stressors (MADRES) Pregnancy Cohort: a Prospective Cohort Study in Predominantly Low-Income Hispanic Women in Urban Los Angeles. BMC Pregnancy Childbirth 2019; 19: 189–189. DOI: 10.1186/s12884-019-2330-7. [DOI] [PMC free article] [PubMed] [Google Scholar]
- 55.Hornung RW and Reed LD. Estimation of Average Concentration in the Presence of Nondetectable Values. Applied Occupational and Environmental Hygiene 1990; 5: 46–51. DOI: 10.1080/1047322X.1990.10389587. [DOI] [Google Scholar]
- 56.Romano ME, Hawley NL, Eliot M, et al. Variability and predictors of urinary concentrations of organophosphate flame retardant metabolites among pregnant women in Rhode Island. Environmental Health 2017; 16: 1–11. [DOI] [PMC free article] [PubMed] [Google Scholar]
- 57.Dunlop AL, Essalmi AG, Alvalos L, et al. Racial and geographic variation in effects of maternal education and neighborhood-level measures of socioeconomic status on gestational age at birth: Findings from the ECHO cohorts. PLoS One 2021; 16: e0245064. 2021/01/09. DOI: 10.1371/journal.pone.0245064. [DOI] [PMC free article] [PubMed] [Google Scholar]
- 58.Lourenço BH, Lima DL, Vivanco E, et al. Agreement between antenatal gestational age by ultrasound and clinical records at birth: A prospective cohort in the Brazilian Amazon. PLoS One 2020; 15: e0236055. 2020/07/15. DOI: 10.1371/journal.pone.0236055. [DOI] [PMC free article] [PubMed] [Google Scholar]
- 59.Obstetricians ACo and Gynecologists. Methods for estimating the due date. Committee Opinion No. 700. Obstet Gynecol 2017; 129: e150–e154. [DOI] [PubMed] [Google Scholar]
- 60.Aris IM, Kleinman KP, Belfort MB, et al. A 2017 US Reference for Singleton Birth Weight Percentiles Using Obstetric Estimates of Gestation. Pediatrics 2019; 144 2019/06/16. DOI: 10.1542/peds.2019-0076. [DOI] [PMC free article] [PubMed] [Google Scholar]
- 61.Textor J, van der Zander B, Gilthorpe MS, et al. Robust causal inference using directed acyclic graphs: the R package ‘dagitty’. Int J Epidemiol 2016; 45: 1887–1894. 2017/01/17. DOI: 10.1093/ije/dyw341. [DOI] [PubMed] [Google Scholar]
- 62.Howe CG, Claus Henn B, Eckel SP, et al. Prenatal Metal Mixtures and Birth Weight for Gestational Age in a Predominately Lower-Income Hispanic Pregnancy Cohort in Los Angeles. Environ Health Perspect 2020; 128: 117001. 2020/11/04. DOI: 10.1289/ehp7201. [DOI] [PMC free article] [PubMed] [Google Scholar]
- 63.Howe CG, Claus Henn B, Farzan SF, et al. Prenatal metal mixtures and fetal size in midpregnancy in the MADRES study. Environmental Research 2021; 196: 110388. DOI: 10.1016/j.envres.2020.110388. [DOI] [PMC free article] [PubMed] [Google Scholar]
- 64.Liu W, Luo D, Xia W, et al. Prenatal exposure to halogenated, aryl, and alkyl organophosphate esters and child neurodevelopment at two years of age. Journal of Hazardous Materials 2021; 408: 124856. DOI: 10.1016/j.jhazmat.2020.124856. [DOI] [PubMed] [Google Scholar]
- 65.Bobb JF, Valeri L, Claus Henn B, et al. Bayesian kernel machine regression for estimating the health effects of multi-pollutant mixtures. Biostatistics 2015; 16: 493–508. 2014/12/24. DOI: 10.1093/biostatistics/kxu058. [DOI] [PMC free article] [PubMed] [Google Scholar]
- 66.Bobb JF, Claus Henn B, Valeri L, et al. Statistical software for analyzing the health effects of multiple concurrent exposures via Bayesian kernel machine regression. Environmental Health 2018; 17: DOI: 10.1186/s12940-018-0413-y. [DOI] [PMC free article] [PubMed] [Google Scholar]
- 67.Crawford KA, Hawley N, Calafat AM, et al. Maternal urinary concentrations of organophosphate ester metabolites: associations with gestational weight gain, early life anthropometry, and infant eating behaviors among mothers-infant pairs in Rhode Island. Environmental Health 2020; 19: 97. DOI: 10.1186/s12940-020-00648-0. [DOI] [PMC free article] [PubMed] [Google Scholar]
- 68.Yang W, Braun JM, Vuong AM, et al. Associations of gestational exposure to organophosphate esters with gestational age and neonatal anthropometric measures: The HOME study. Environ Pollut 2023; 316: 120516. 2022/11/08. DOI: 10.1016/j.envpol.2022.120516. [DOI] [PMC free article] [PubMed] [Google Scholar]
- 69.Doherty BT, Hammel SC, Daniels JL, et al. Organophosphate Esters: Are These Flame Retardants and Plasticizers Affecting Children’s Health? Curr Environ Health Rep 2019; 6: 201–213. 2019/11/23. DOI: 10.1007/s40572-019-00258-0. [DOI] [PMC free article] [PubMed] [Google Scholar]
- 70.Xu T, Wang Q, Shi Q, et al. Bioconcentration, metabolism and alterations of thyroid hormones of Tris (1, 3-dichloro-2-propyl) phosphate (TDCPP) in Zebrafish. Environmental toxicology and pharmacology 2015; 40: 581–586. [DOI] [PubMed] [Google Scholar]
- 71.Williams GR. Neurodevelopmental and neurophysiological actions of thyroid hormone. J Neuroendocrinol 2008; 20: 784–794. 2008/07/08. DOI: 10.1111/j.1365-2826.2008.01733.x. [DOI] [PubMed] [Google Scholar]
- 72.Percy Z, Vuong AM, Xu Y, et al. Maternal Urinary Organophosphate Esters and Alterations in Maternal and Neonatal Thyroid Hormones. Am J Epidemiol 2021; 190: 1793–1802. 2021/03/30. DOI: 10.1093/aje/kwab086. [DOI] [PMC free article] [PubMed] [Google Scholar]
- 73.Liu X, Ji K, Jo A, et al. Effects of TDCPP or TPP on gene transcriptions and hormones of HPG axis, and their consequences on reproduction in adult zebrafish (Danio rerio). Aquatic toxicology 2013; 134: 104–111. [DOI] [PubMed] [Google Scholar]
- 74.Liu X, Ji K and Choi K. Endocrine disruption potentials of organophosphate flame retardants and related mechanisms in H295R and MVLN cell lines and in zebrafish. Aquatic toxicology 2012; 114: 173181. [DOI] [PubMed] [Google Scholar]
- 75.Meeker JD and Stapleton HM. House Dust Concentrations of Organophosphate Flame Retardants in Relation to Hormone Levels and Semen Quality Parameters. Environmental Health Perspectives 2010; 118: 318–323. DOI: doi: 10.1289/ehp.0901332. [DOI] [PMC free article] [PubMed] [Google Scholar]
- 76.Carignan CC, Mínguez-Alarcón L, Williams PL, et al. Paternal urinary concentrations of organophosphate flame retardant metabolites, fertility measures, and pregnancy outcomes among couples undergoing in vitro fertilization. Environ Int 2018; 111: 232–238. 2017/12/15. DOI: 10.1016/j.envint.2017.12.005. [DOI] [PMC free article] [PubMed] [Google Scholar]
- 77.Kojima H, Takeuchi S, Van den Eede N, et al. Effects of primary metabolites of organophosphate flame retardants on transcriptional activity via human nuclear receptors. Toxicology Letters 2016; 245: 31–39. DOI: 10.1016/j.toxlet.2016.01.004. [DOI] [PubMed] [Google Scholar]
- 78.Liu X, Jung D, Jo A, et al. Long-term exposure to triphenylphosphate alters hormone balance and HPG, HPI, and HPT gene expression in zebrafish (Danio rerio). Environ Toxicol Chem 2016; 35: 22882296. 2016/02/13. DOI: 10.1002/etc.3395. [DOI] [PubMed] [Google Scholar]
- 79.Ma Z, Tang S, Su G, et al. Effects of tris (2-butoxyethyl) phosphate (TBOEP) on endocrine axes during development of early life stages of zebrafish (Danio rerio). Chemosphere 2016; 144: 1920–1927. 2015/11/08. DOI: 10.1016/j.chemosphere.2015.10.049. [DOI] [PubMed] [Google Scholar]
- 80.Davis LK, Pierce AL, Hiramatsu N, et al. Gender-specific expression of multiple estrogen receptors, growth hormone receptors, insulin-like growth factors and vitellogenins, and effects of 17β-estradiol in the male tilapia (Oreochromis mossambicus). General and Comparative Endocrinology 2008; 156: 544–551. DOI: 10.1016/j.ygcen.2008.03.002. [DOI] [PubMed] [Google Scholar]
- 81.Guan R, Li N, Wang W, et al. The adverse outcome pathway (AOP) of estrogen interference effect induced by triphenyl phosphate (TPP): Integrated multi-omics and molecular dynamics approaches. Ecotoxicology and Environmental Safety 2022; 234: 113387. DOI: 10.1016/j.ecoenv.2022.113387. [DOI] [PubMed] [Google Scholar]
- 82.Brown ZA, Schalekamp-Timmermans S, Tiemeier HW, et al. Fetal sex specific differences in human placentation: A prospective cohort study. Placenta 2014; 35: 359–364. DOI: 10.1016/j.placenta.2014.03.014. [DOI] [PubMed] [Google Scholar]
- 83.Leonetti C, Butt CM, Hoffman K, et al. Brominated flame retardants in placental tissues: associations with infant sex and thyroid hormone endpoints. Environmental Health 2016; 15: 113. DOI: 10.1186/s12940-016-0199-8. [DOI] [PMC free article] [PubMed] [Google Scholar]
- 84.Lapehn S and Paquette AG. The Placental Epigenome as a Molecular Link Between Prenatal Exposures and Fetal Health Outcomes Through the DOHaD Hypothesis. Curr Environ Health Rep 2022; 9: 490–501. 2022/04/30. DOI: 10.1007/s40572-022-00354-8. [DOI] [PMC free article] [PubMed] [Google Scholar]
- 85.Lynn R, Wong K, Garvie-Gould C, et al. Disposition of the flame retardant, tris (1, 3-dichloro-2-propyl) phosphate, in the rat. Drug metabolism and Disposition 1981; 9: 434–441. [PubMed] [Google Scholar]
- 86.Nomeir A, Kato S and Matthews H. The metabolism and disposition of tris (1, 3-dichloro-2-propyl) phosphate (Fyrol FR-2) in the rat. Toxicol Appl Pharmacol 1981; 57: 401–413. [DOI] [PubMed] [Google Scholar]
- 87.MINEGISHI K, KUREBAYASHI H, NAMBARU S, et al. Comparative studies on absorption, distribution, and excretion of flame retardants halogenated alkyl phosphate in rats. Eisei kagaku 1988; 34: 102–114. [Google Scholar]
- 88.Sasaki K, Takeda M and Uchiyama M. Toxicity, absorption and elimination of phosphoric acid triesters by killifish and goldfish. Bull Environ Contam Toxicol 1981; 27: 775–782. [DOI] [PubMed] [Google Scholar]
Associated Data
This section collects any data citations, data availability statements, or supplementary materials included in this article.
Supplementary Materials
Data Availability Statement
The datasets used and/or analyzed during the current study are available from the corresponding author on reasonable request and after approval by the USC Institutional Review Board.