

Summary
Background
The extent of food deprivation and insecurity among infants and young children—a critical phase for children's current and future health and well-being—in India is unknown. We estimate the prevalence of food deprivation among infants and young children in India and describe its evolution over time at sub-national levels.
Methods
Data from five National Family Health Surveys (NFHS) conducted in 1993, 1999, 2006, 2016 and 2021 for the 36 states/Union Territories (UTs) of India were used. The study population consisted of the most recent children (6–23 months) born to mothers (aged 15–49 years), who were alive and living with the mother at the time of survey (n = 175,614 after excluding observations that had no responses to the food question). Food deprivation was defined based on the mother's reporting of the child having not eaten any food of substantial calorific content (i.e., any solid/semi-solid/soft/mushy food types, infant formula and powdered/tinned/fresh milk) in the past 24 hours (h), which we labelled as “Zero-Food”. In this study, we analyzed Zero-Food in terms of percent prevalence as well as population headcount burden. We calculated the Absolute Change (AC) to quantify the change in the percentage points of Zero-Food across time periods for all-India and by states/UTs.
Findings
The prevalence of Zero-Food in India marginally declined from 20.0% (95% CI: 19.3%–20.7%) in 1993 to 17.8% (95% CI: 17.5%–18.1%) in 2021. There were considerable differences in the trajectories of change in the prevalence of Zero-Food across states. Chhattisgarh, Mizoram, and Jammu and Kashmir experienced high increase in the prevalence of Zero-Food over this time period, while Nagaland, Odisha, Rajasthan and Madhya Pradesh witnessed a significant decline. In 2021, Uttar Pradesh (27.4%), Chhattisgarh (24.6%), Jharkhand (21%), Rajasthan (19.8%) and Assam (19.4%) were states with the highest prevalence of Zero-Food. As of 2021, the estimated number of Zero-Food children in India was 5,998,138, with the states of Uttar Pradesh (28.4%), Bihar (14.2%), Maharashtra (7.1%), Rajasthan (6.5%), and Madhya Pradesh (6%) accounting for nearly two-thirds of the total Zero-Food children in India. Zero-Food in 2021 was concerningly high among children aged 6–11 months (30.6%) and substantial even among children aged 18–23 months (8.5%). Overall, socioeconomically advantaged groups had lower prevalence of Zero-Food than disadvantaged groups.
Interpretation
Concerted efforts at the national and state levels are required to further strengthen existing policies, and design and develop new ones to provide affordable food to children in a timely and equitable manner to ensure food security among infants and young children.
Funding
This study was supported by a grant from the Bill & Melinda Gates Foundation INV-002992.
Keywords: Food deprivation, Food insecurity, Zero-Food, Food policy, Sustainable development goals (SDGs), Zero hunger, Social determinants of health, Children, States/Union Territories, India
Research in context.
Evidence before this study
We searched PubMed and Web of Science to identify empirical studies with a quantitative analysis on the prevalence of food insecurity and deprivation in India. We used structured combinations of keywords: “Food Insecurity” OR “Food Deprivation” OR “Food Poverty” OR “Hunger” OR “Starvation” AND (“India” or “India + Children”) with no restriction on date and language. The search yielded 1118 studies. After removing duplicates and screening the titles and abstracts of each of these papers, 50 articles were considered as relevant for the scope of our study. We reviewed these articles for the following: national representativeness, definition of food insecurity/deprivation based on food consumption, whether the measurement was at individual (including children or not) or at household level, and source of the data. Majority of the studies (n = 37) were local non-representative studies. Eight studies entailed a definition of food insecurity/deprivation based on actual consumption (self-reported or measured) of food at the individual level, and of these, three were on children, with one reporting severe food insecurity among children aged 5–8 years. However, none of the studies reviewed reported nationally representative estimates of food insecurity among infants and young children in India using a public data set.
Added value of this study
Our study provides the first systematic assessment of severe food insecurity among infants and young children in India. The study is comprehensive in that we assessed the evolution of food insecurity over the last 30 years (1993–2021) and for each of the 36 States and Union Territories (UT) of India. The study also introduces a new metric, referred to as “Zero-Food” (i.e., children who did not eat any food of calorific significance for at least one day). Lastly, we developed an online interactive dashboard to visualize the evolution of the prevalence of Zero-Food across the states/UTs of India. Almost one out of every five children in India is at the risk of not being able to eat any food every day, with not much decline in the prevalence of Zero-Food over time. Inequalities in the prevalence of Zero-Food between states/UTs also have remained largely unchanged.
Implications of all the available evidence
The existing framework of National Food Security Act (along with other food-related policies and programs) needs to be examined for its design, implementation—and most importantly, to ensure identification of the population that needs the most assistance. Bringing precision to existing food policies, should be urgently considered if India aims to realize the Sustainable Development Goal related to ending hunger and ensuring access to safe, nutritious, and sufficient food all year-round by 2030.
Introduction
Safe and nutritious food is the basic essence of human survival, growth, and development, especially for infants and young children.1,2 Newborn infants rely on breastmilk (or animal milk for non-breastfed infants) for their source of food.1 By 6 months, infants also require external forms of foods to ensure a healthy physical and cognitive growth and introduction of the external food in a timely, safe, adequate, and appropriate manner is critical.3,4
The Sustainable Development Goal (SDG) 2 seeks to end hunger and ensure access to safe, nutritious, and sufficient food year-round by 2030.5 To ascertain the progress of SDG2 there is a need to identify a metric for monitoring hunger and food security. The Food and Agriculture Organization (FAO) uses Prevalence of Undernourishment (PoU) to monitor the number of people in a population who are experiencing hunger, defined as the consumption of too few calories to meet the minimum amount of energy required to live a healthy and productive life in accordance with his or her age, sex, and activity level.6,7 Meanwhile, the FAO defines being food-insecure as state where a person lacks access to safe and nutritious food, either due to lack of availability or lack of resources.7 The Food Insecurity Experience Scale (FIES) developed by the FAO provides definition of “moderate” and “severe” food insecurity.7 Moderate food insecurity is identified as a state whereby a person has reduced the quality and/or quantity of their food and is uncertain about their ability to obtain food due to lack of money or other resources, while severe food insecurity reflects a state where a person has had no food for a day or more, has run out of food, or has gone an entire day without eating at times during the year.7
In the context of infants and young children, the commonly used food-related measure is the “minimum dietary diversity”, that measures whether a child consumed foods and beverages from at least five out of eight defined food groups during the previous day.1 The prevalence of children not meeting the minimum dietary diversity across Low- and Middle-Income Countries (LMICs) is about 80%.8 Infants and young children also have a very low consumption of food items that are protein-rich and contain essential micronutrients.9
The average energy required by an infant aged 6–8 months is 600 Kcal/day, at 9–11 months of age is 700 Kcal/day and increases to 900 Kcal/day for children 12–23 months of age.10 For on-demand breastfed children aged 12–23 months, food consumed needs to meet about 61% of energy, 45% of protein and about 95% of iron requirements over and above the breastmilk. The share of food contributing to calorific requirements is about 50% for children aged 9–11 months (i.e., 300 out of 700 Kcal/day), and the share of breastmilk is greater than the food when it comes to children aged 6–8 months (i.e., 400 out of 600 Kcal/day). The consequences of malnutrition due to food deprivation, especially for infants and young children, are well-known.11,12 There has been a growing recognition in the literature on the intrinsic importance of food-based measures for assessing child nutritional status as opposed to the current practice of solely relying on children's anthropometric status.13,14
India is estimated to have 224 million people who experience hunger, accounting for nearly one-third of the global burden of hunger.15 Further, nearly 80% of infants and young children in India do not meet the minimum dietary diversity,16 with significantly low consumption of protein-rich food.13 However, to our knowledge, no study has proposed a measure of absolute deprivation of food among children. The progress and success of the world in meeting SDG 2, thus, is contingent on India's progress and success in measuring and eliminating food deprivation and ensuring food security among its population, especially among infants and young children.17
In this study, we present an up-to-date, comprehensive and systematic description of the trends in absolute or extreme food deprivation among infants and young children in India and its 36 states and Union Territories (UTs) between 1993 and 2021. We operationalized the concept of extreme food deprivation by identifying the children who did not eat any food of calorific significance for an entire day, which we refer to as Zero-Food. From a policy perspective, it is not only important to understand the prevalence which provides information on the current and prospective risk of a child not being able to eat for an entire day, but also the absolute burden (i.e., the current headcount of at-risk children who need immediate intervention).18 We therefore also estimated the population headcount burden of Zero-Food children for 2021 for all-India and for each of the states/UTs. Finally, we also assessed the patterning in the prevalence of Zero-Food in 2021 across basic demographic and socioeconomic characteristics.
India is a federation of 28 States and 8 UTs.19 States are administrative and legislative geographic units that fall in jurisdiction of the respective state governments. The UTs are geographical areas that fall under the governance and jurisdiction of the central government and may or may not have their own legislatures. States vary with regards to their natural resources, as well as in terms of differences in development histories.20,21 There are large differences between states on indicators related to population health and well-being,22,23 and states oversee policy development for social sectors including those related to nutrition. Thus, a substantial component of state differences in India can be linked to policy processes that operate uniquely at the state level.
Methods
Data
The study used repeated cross-sections of five waves of the National Family Health Survey (NFHS) covering all states and UTs in India.24, 25, 26, 27, 28 The five surveys were conducted in 1992–93, 1998–99, 2005–06, 2015–16 and 2019–21, hereafter identified with the end year of each survey. All rounds of the NFHS employ a multistage stratified cluster sampling design and use the latest available Census of India at the time of the survey as their sampling frame (Appendix S1).
Study population
The study population were infants and young children who were the most recent born in the past two years prior to the survey, aged 6–23 months, alive and living with their mother (aged 15–49 years) at the time of the survey. Food-related information was not ascertained for children younger than six months or above 2 years. Observations for which any food-related questions were reported as “don't know” or were missing (unreported) were excluded. With the exception of the 1993 survey where non-response was 15.8%, the percentage of non-responses was less than 1% across the remaining four surveys (Table 1). The final analytic sample was 14,043 (1993), 14,624 (1999), 13,667 (2006), 71,271 (2016) and 62,009 (2021).
Table 1.
Study sample size selection from the five National Family Health Surveys, 1993–2021.
| Survey round (year) | Sample size based on inclusion criteria (n) | Non-responses on food-related questions (n) | Percentage of cases with non-responses on food-related questions to total sample size (n) | Final study sample Size (n) |
|---|---|---|---|---|
| NFHS-1 (1992–93) | 16,687 | 2644 | 15.8 | 14,043 |
| NFHS-2 (1998–99) | 14,716 | 92 | 0.6 | 14,624 |
| NFHS-3 (2005–06) | 13,879 | 112 | 0.8 | 13,667 |
| NFHS-4 (2015–16) | 71,538 | 267 | 0.4 | 71,271 |
| NFHS-5 (2019–21) | 62,167 | 158 | 0.3 | 62,009 |
| All waves | 178,987 | 3273 | 1.8 | 175,614 |
Bold values represent the "overall" or "pooled".
Outcome
We used the food consumption questions across the surveys to define Zero-Food (Table 2). Food-related questions of the following nature were asked of the mothers: “Did [Child's NAME] drink/eat [specific food items] anytime during the day (yesterday) or night (last) 24 h prior to the survey?” The mothers were asked to report the consumption of any food item even if it was consumed mixed with other item/s. To construct a comparable metric of Zero-Food across all surveys, an answer of “No” to all the food questions for a particular child in a particular survey meant the child received no food in the past 24 hours. In NFHS-1, this meant an answer of “No” to 4 questions, in NFHS-2 it was 5 questions, in NFHS-3 it was 20 questions, and in both NFHS-4 and NFHS-5 it was 18 questions all under the heading of “Food (Including Milk)” in Table 2. Despite differences in food-related questions across surveys, there are questions that consistently ask whether the child consumed “any or any other solid/semi-solid/soft/mushy” food in addition to the other food-specific questions. This ensures a reliable assessment of whether the child has eaten any food whatsoever in the past 24 h.
Table 2.
Sample size (n) and prevalence (%) of food items not consumed in the last 24 hours by children (6 to 23 months) from the five National Family Health Surveys, 1993-2021
| Food (Including Milk) | NFHS-1 (1992-93) | NFHS-2 (1998-99) | NFHS-3 (2005-06) | NFHS-4 (2015-16) | NFHS-5 (2019-21) |
|---|---|---|---|---|---|
| Any Solid or Mushy Food | 4861 (34.6%) | - | - | - | - |
| Any other Solid or Mushy Food | - | 5,169 (35.4%) | - | - | - |
| Any other Solid or Semi-Solid Food | - | - | 10,875 (79.6%) | - | - |
| Any other Solid, Semi-Solid, or Soft Food | - | - | - | 55,707 (78.2%) | 46,696 (75.4%) |
| Fruits and Vegetables | |||||
| Green, Leafy Vegetables | - | 10,401 (71.2%) | - | - | - |
| Any Dark Green, Leafy Vegetables | - | - | 10,294 (75.4%) | 49,693 (69.8%) | 41,042 (66.2%) |
| Any Pumpkin, Carrots or Sweet Potatoes that are Yellow or Orange inside | - | - | 11,809 (86.5%) | - | - |
| Any Pumpkin, Carrots, Squash or Sweet Potatoes that are Yellow or Orange inside | - | - | - | 56,501 (79.3%) | 47,131 (76.1%) |
| Fruits | - | 10,778 (73.7%) | - | - | - |
| Any Ripe Mangoes, Papayas, Cantaloupe, or Jackfruit | - | - | 11,808 (86.4%) | 57,828 (81.2%) | 51,730 (83.5%) |
| Any other Fruits or Vegetables | - | - | 11,150 (81.2%) | 53,931 (75.7%) | 43,795 (70.7%) |
| Grains, Roots, and Tubers | |||||
| Any Porridge or Gruel | - | - | 10,194 (74.6%) | - | - |
| Any Bread, Roti, Chapati, Rice, Noodles, Biscuits, Idli or Any other Foods made from Grains | - | - | 3,732 (27.4%) | 24,946 (35%) | 24,614 (39.7%) |
| Any White Potatoes, White Yams, Cassava, or Any other Foods made from Roots | - | - | 10,754 (78.7%) | - | - |
| Any White Potatoes, White Yams, Manioc, Cassava, or Any other Foods made from Roots | - | - | - | 55,010 (77.2%) | 45,188 (72.9%) |
| Any Foods made from Beans, Peas, Lentils | - | - | 12,058 (88.3%) | - | - |
| Any Foods made from Beans, Peas, Lentils, or Nuts | - | - | - | 60,980 (85.6%) | 50,405 (81.3%) |
| Any Nuts | - | - | 12,749 (93.3%) | - | - |
| Meat/Non-Vegetarian | |||||
| Any Liver, Kidney, Heart or other Organ Meats | - | - | 13,364 (97.8%) | 66,908 (93.9%) | 57,544 (92.8%) |
| Any other Meat | - | - | 13,222 (96.8%) | 67,678 (95.0%) | 58,330 (94.1%) |
| Any Chicken, Duck or other Birds | - | - | 13,387 (98%) | 66,726 (93.7%) | 57,117 (92.2%) |
| Any Eggs | - | - | 12,561 (92%) | 60,765 (85.3%) | 50,705 (81.8%) |
| Any Fresh or Dried Fish or Shellfish | - | - | 12,754 (93.4%) | 67,287 (94.5%) | 58,029 (93.6%) |
| Dairy Products | |||||
| Any other Milk such as Tinned, Powdered, or Fresh Animal Milk | - | - | 6,910 (50.6%) | 43,302 (60.8%) | 37,136 (59.9%) |
| Yogurt | - | - | - | 65,236 (91.6%) | 56,000 (90.4%) |
| Any Cheese or other Food made from Milk | - | - | - | 63,981 (89.8%) | 53,763 (86.7%) |
| Any Cheese, Yogurt or other Milk Products | - | - | 11,902 (87.1%) | - | - |
| Any Food made with Oil, Fat, Ghee or Butter | - | - | 11,679 (85.5%) | - | - |
| Tinned/Powdered Milk | 13,292 (94.6%) | - | - | - | - |
| Fresh Milk | 7,484 (53.3%) | - | - | - | - |
| Powdered Milk | - | 13,648 (93.3%) | - | - | - |
| Any other Milk (other than Breast Milk) | - | 7,222 (49.4%) | - | - | - |
| Formula Food | |||||
| Baby Formula | 12,778 (91%) | - | - | - | - |
| Commercially Produced Infant Formula | - | - | 11,873 (86.9%) | - | - |
| Infant Formula | - | - | - | 64,242 (90.2%) | 54,527 (88%) |
| Any Commercially Fortified Baby Food such as Cerelac or Farex | - | - | 11,150 (81.6%) | 60,486 (84.9%) | 51,821 (83.6%) |
| Liquid Food (Excluding Milk) | |||||
| Any other Liquids | 8,249 (58.8%) | 8,473 (58%) | 11,185 (81.9%) | 55,970 (78.5%) | 47,867 (77.2%) |
| Juice or Juice Drinks | - | - | - | 57,287 (80.3%) | 48,085 (77.6%) |
| Juice | 12,757 (90.9%) | - | - | - | - |
| Fruit Juice | - | - | 12,205 (89.3%) | - | - |
| Clear Broth | - | - | - | 58,933 (82.6%) | 49,468 (79.8%) |
| Sugar/Honey Water | 12,451 (88.7%) | - | - | - | - |
| Tea | 8,695 (62.0%) | - | - | - | - |
| Tea or Coffee | - | - | 8,282 (60.8%) | - | - |
Note: “-” represents food items not asked in the respective survey. For each survey, Zero-Food was calculated separately based on the food items asked under the "Food (Including Milk)” and includes children who did not have any of the listed food categories. Calculation of Zero-Food* also included items asked under the heading, “Liquid Food (Excluding Milk)”.
Based on these responses, we defined the prevalence of Zero-Food in children as:
where, Zero-Food children represents the number of children who did not consume any food of calorific significance in the past 24 h. The prevalence of Zero-Food estimates the percentage of children in a population who did not eat every day, thus aligned with the overall concept of severe food insecurity.7,15
To be comprehensive, we also present estimates under a definition whereby the child has not had anything, including food items listed under the heading “Liquid Food (Excluding Milk)” in Table 2, labeled as Zero-Food∗”.
Constructing comparable state estimates
While currently there are 28 states and 8 UTs, the geometry of states/UTs in India have evolved over the years, with many states/UTs experiencing change in their geometry and by extension their population jurisdiction. For instance, in 1993 there were 25 states and 7 UTs. These changes mean that creating a repeated cross-sectional panel of states/UTs across the years is not straightforward. The conventional approach is to collapse the more recent state-geometry into an older state-geometry by merging the states that were involved in the change. For example, representing 2021 data for the current two states of Uttarakhand and Uttar Pradesh, as an average of the two states, because, they comprised a single state (Uttar Pradesh) in 1993 and 1999. However, presenting recent data on an older state-geometry does not accurately reflect current estimates and is not meaningful for current policy deliberations at the state-level. We solved this problem by assigning surveyed districts in older survey years to states in their current geometry (see Appendix S2).
Demographic and socioeconomic correlates
We also considered demographic and socioeconomic characteristics to assess any systematic patterning of the 2021 prevalence of Zero-Food. These included age (6–11/12–17/18–23 months), sex (Female/Male) of the child, place of residence (Rural/Urban), social caste of the mother (Other/Other Backward Classes/Scheduled Caste/Scheduled Tribe), educational attainment of the mother (no Formal Schooling/Primary Schooling (1–5 years)/Secondary Schooling (6–10 years)/Senior Secondary (11–12 years), and College Education (more than 12 years)), and a household measure of wealth based on an asset index categorized as quintiles (Poorest, Poor, Middle, Rich and Richest).
Analysis
To estimate trends over time for all-India and states/UTs, we calculated the percentage (and 95% Confidence Interval) of Zero-Food children for India at each of the five time periods. The prevalence estimates used the survey weights to account for the multi-stage stratified cluster sampling design. We calculated the Absolute Change (AC) to quantify the change (in percentage points) in prevalence of Zero-Food across time periods: ; where, refers to percentage at recent year (e.g., 2021), represents percentage at a previous year in consideration (e.g., 1993). A negative AC value indicates a decline in the prevalence of Zero-Food (i.e., an improving change), whereas a positive AC value indicates an increase in the prevalence of Zero-Food (i.e., a worsening change).
We used box plots and line plots to assess the extent to which state-inequalities in the prevalence of Zero-Food have increased/decreased over time. Descriptive assessments of the state-level patterns over time were made using scatterplots and correlations. Specifically, we examined the extent to which state/UT ordering with regards to the prevalence of Zero-Food is correlated across various years. We also assessed whether the magnitude and patterns of change since 1993 are correlated with the prevalence of Zero-Food in 1993 (considered as a baseline). We visualized the changing geographic distribution of the prevalence of Zero-Food using choropleth maps and also created an interactive dashboard (Appendix S3, https://geographicinsights.iq.harvard.edu/State-Zero-Food).
We estimated the current absolute burden of food deprivation among children (i.e., population headcounts of Zero-Food children) for all India and for the states/UTs in 2021 using the microdata and Census of India Population Projections.29 We used the methodology provided by Integrated Public Use Microdata Series (IPUMS)30 with appropriate modifications for our purposes (Appendix S4). We also provide a visual and quantitative assessment of whether states/UTs with higher prevalence of Zero-Food are correlated with the absolute headcount burden.
We assessed the demographic and socioeconomic patterning in the prevalence of Zero-Food across age and sex of the children, place of residence, social caste, educational attainment of mother, and household wealth quintile.
The software STATA 15.0,31 ArcGIS Pro,32 and Microsoft Power BI33 were used for computations and visualization. Lastly, we have outlined major food related policies of the national and state governments of India to draw a contextual picture for the Zero-Food measure. This list is illustrative and at best exhaustive with respect to central government programs.
Ethics statement
The National Family Health Survey (NFHS) data were collected using informed consent and the protocol for the NFHS survey, including the content of all the survey questionnaires, was approved by the International Institute for Population Studies Institutional Review Board and the ICF Institutional Review Board.25,34 For the analysis presented in this study using the NFHS data, the Harvard Longwood Campus Institutional Review Board (IRB) allows researchers to self-determine whether their research meets the requirements of IRB oversight using the IRB Decision Tool. These activities did not meet the regulatory definition of human participant research, and our study was determined to be exempt from a full institutional review.
Role of funding
This study was supported by a grant from the Bill & Melinda Gates Foundation INV-002992. The funders had no role in study design, data collection and analysis, decision to publish or preparation of the manuscript. All authors had access to the data. Akhil Kumar, Mayanka Ambade and Rockli Kim accessed and verified the sample survey data for the analysis.
Results
Sample characteristics
We estimated that roughly 33,623,000 children were aged 6–23 months in India in 2021. Amongst these infants and young children aged 6–23 months, the sample distribution was more or less similar across the three age categories of 6–11, 12–17 and 18–23 months and gender categories (Table S1). Nearly three-fourths of the children were from rural areas and over half of the mothers had completed secondary school education. These characteristics were largely consistent across the five surveys with the percentage share of children becoming more urban and having mothers with higher levels of education over time. For the 1993 survey year that had about 15% observations not reporting food-related questions, the characteristics between those who reported and did not report were largely similar with the exception of age as non-response rates were greater among children aged 12–17 and 18–23 months (Table S2).
Patterns of change in the prevalence of Zero-Food
The all-India prevalence of Zero-Food decreased from 20.0% (95% CI: 19.3%, 20.7%) in 1993 to 17.8% (95% CI: 17.5%, 18.1%) in 2021 (Table 3); an absolute change of −2.2 percentage points over nearly 3 decades (28 years) (Table 4). There was a marked decline in the prevalence of Zero-Food between 1999 and 2006 (absolute change: −7.6%). Between 2006 and 2016, the prevalence of Zero-Food increased by 6.6 percentage points, and marginally by 0.6 percentage points between 2016 and 2021.
Table 3.
The prevalence of Zero-Food and 95% confidence interval (CI) for India and 36 States/Union Territories, 1993-2021.
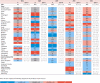 |
Table 4.
Absolute change (percentage points) in the prevalence of Zero-Food across States/Union Territories of India between 1993–1999, 1999–2006, 2006–2016, 2016–2021 and 1993–2021.
| 1993–2021 | 1993–1999 | 1999–2006 | 2006–2016 | 2016–2021 | |
|---|---|---|---|---|---|
| India | −2.2 | −1.8 | −7.6 | 6.6 | 0.6 |
| States | |||||
| Andhra Pradesh | 2.8 | −3.9 | −1.2 | 5.8 | 2.1 |
| Arunachal Pradesh | −0.8 | −7 | −2.7 | 9.5 | −0.6 |
| Assam | 5.5 | 1.1 | −3.7 | 5.4 | 2.7 |
| Bihar | −7.9 | −0.7 | −18 | 15.8 | −5 |
| Chhattisgarh | 12.5 | 11.5 | −11.9 | 0 | 12.9 |
| Goa | −5.2 | −8.6 | 0.8 | 16.4 | −13.8 |
| Gujarat | −6.5 | −6.3 | −7.2 | 9.9 | −2.9 |
| Haryana | 6.1 | −3.7 | 9 | 5.3 | −4.5 |
| Himachal Pradesh | −2.2 | −8.6 | 3.2 | 5 | −1.8 |
| Jharkhand | 1 | 3.1 | −11.8 | 4.8 | 4.9 |
| Karnataka | −1.3 | 4.3 | −15.1 | 13.2 | −3.7 |
| Kerala | −0.9 | −1.6 | −6.4 | 8.3 | −1.2 |
| Madhya Pradesh | −11.7 | −3.1 | −12.9 | 7.3 | −3 |
| Maharashtra | −2.1 | 0.9 | −1.9 | −0.1 | −1 |
| Manipur | −8 | −11.3 | 3.5 | −0.2 | 0 |
| Meghalaya | 3.8 | 1.6 | −4.4 | 3.5 | 3.1 |
| Mizoram | 9 | −1.6 | −3.3 | 5.6 | 8.3 |
| Nagaland | −19.7 | −21.4 | 5.2 | −0.5 | −3 |
| Odisha | −18.5 | −2.4 | −13.5 | 1.4 | −4 |
| Punjab | 6.5 | −3.9 | 2.4 | 7 | 1 |
| Rajasthan | −18.6 | −13 | −8.5 | 3.1 | −0.2 |
| Sikkim | 2.7 | 4.8 | 8.7 | ||
| Tamil Nadu | −1.2 | −5.7 | −1.2 | 6.5 | −0.8 |
| Telangana | −6.2 | −13.9 | 0.1 | 5.1 | 2.5 |
| Tripura | 5.1 | −0.2 | −2.5 | 27.1 | −19.3 |
| Uttar Pradesh | 7.2 | 3 | −12.8 | 7 | 10 |
| Uttarakhand | −2.9 | 5.2 | −9.9 | 1.6 | 0.2 |
| West Bengal | −3 | −2.3 | 1.6 | 2.3 | −4.6 |
| Union Territories | |||||
| NCT Delhi | −8 | −2.1 | −6.8 | 9.9 | −9 |
| Jammu & Kashmir | 8.2 | 5 | −5.7 | 7.5 | 1.4 |
| Ladakh | 4.5 | ||||
| Andaman & Nicobar | 1.3 | ||||
| Chandigarh | −0.4 | ||||
| Dadra and Nagar Haveli and Daman and Diu | −16.4 | ||||
| Lakshadweep | 8.3 | ||||
| Puducherry | −3.6 |
No secular or systematic pattern of decline was observed across states with considerable variation (Table 4). However, the prevalence of Zero-Food in 1993 (baseline) was inversely associated with the absolute change between 1993 and 2021 (r = −0.74, p < 0.001), such that states that had a higher prevalence of Zero-Food at baseline experienced a greater decline (Fig. 1).
Fig. 1.

Relationship between 1993 the prevalence of Zero-Food (%) and Absolute Change (percentage points) for 1993–2021, India. AN: Andaman & Nicobar, AP: Andhra Pradesh, AR: Arunachal Pradesh, AS: Assam, BR: Bihar, CH: Chandigarh, CG: Chhattisgarh, DH: Dadra and Nagar Haveli and Daman and Diu, GA: Goa, GJ: Gujarat, HR: Haryana, HP: Himachal Pradesh, JK: Jammu & Kashmir, JH: Jharkhand, KA: Karnataka, KL: Kerala, LK: Ladakh, LD: Lakshadweep, MP: Madhya Pradesh, MH: Maharashtra, MN: Manipur, ML: Meghalaya, MZ: Mizoram, DL: NCT Delhi, NL: Nagaland, OR: Odisha, PY: Puducherry, PB: Punjab, RJ: Rajasthan, SK: Sikkim, TN: Tamil Nadu, TL: Telangana, TR: Tripura, UP: Uttar Pradesh, UK: Uttarakhand, WB: West Bengal.
The inequalities in the prevalence of Zero-Food between states/UTs only slightly declined between 1993 and 2021 (Fig. 2). For instance, the interquartile range (IQR) decreased from 9.7% (25th percentile: 10.5%, 75th percentile: 20.2%) in 1993 to 8.8% (25th percentile: 8.9%, 75th percentile: 17.7%) in 2021. The IQR based inequality were the largest in 1999 (13.7%; 25th percentile: 7.2%, 75th percentile: 20.9%) and smallest in 2006 (5.2%; 25th percentile: 5.8%, 75th percentile: 11.0%).
Fig. 2.

Summary distribution of State/Union Territory-level prevalence of Zero-Food, 1993–2021. Box-and-whisker plot shows the variability of a data set using lowest and highest values, and quartiles of the data. The upper and lower whiskers represent minimum and maximum values respectively. The upper outline of the box depicts 75th and the lower outline the 25th percentile respectively. The line within the box (separating the darker and lighter tones of grey) shows median (i.e., 50th percentile); Zero-Food refers to zero consumption of both solid and liquid food in the 24-h recall period.
Even though the magnitude of inequalities between states/UTs did not change markedly over time, the rank-ordering of states/UTs did change (Table S3, Fig. S1). For instance, the rank correlation between the ordering of states/UTs in 1993 and 2021 was only moderate (r = 0.32, p = 0.08). Similar magnitude of correlation was observed for the two most recent periods (i.e., 2016 and 2021) as well (r = 0.41, p = 0.02). The current order of states/UTs are most strongly correlated with the ordering in 1999 (r = 0.64, p = 0.0002).
Changes in the geographic distribution of the prevalence of Zero-Food
An interactive online dashboard displaying the prevalence of Zero-Food for the states/UTs across all waves is included (Appendix S3, https://geographicinsights.iq.harvard.edu/State-Zero-Food). In 2021, the states with the highest prevalence of Zero-Food were the northern states of Uttar Pradesh (27.4%), Chhattisgarh (24.6%), Jharkhand (21.0%), Rajasthan (19.8%) and Assam (19.4%) (Table 3). Except Rajasthan, where the prevalence of Zero-Food declined by 18.6 percentage points between 1993 and 2021, the other four states witnessed an increase, with Uttar Pradesh and Chhattisgarh observing a substantial increase between 2016 and 2021 at 10.0 and 12.9 percentage points, respectively (Table 4).
Substantially lower prevalence of Zero-Food in 2021 (compared to the All-India prevalence) were noted in the southern states/UTs of Puducherry (3.3%) and Goa (5.1%); and the northern states/UTs of Manipur (6.2%), Chandigarh (7.3%) and West Bengal (7.5%) (Table 3). Goa, Manipur, and West Bengal observed a decline between 1993 and 2021 by 5.2, 8.0 and 3.0 percentage points, respectively (Table 4). The decline in prevalence of Zero-Food Goa was considerable in the most recent period of 2016–2021 (13.8 percentage-points) (Table 4).
Assessing states/UTs purely on patterns of change between 1993 and 2021, the largest absolute increase were observed for the northern states of Chhattisgarh (12.5%), Mizoram (9.0%), Jammu and Kashmir (8.2%), Uttar Pradesh (7.2%) and Punjab (6.5%) (Table 4). Put simply, the prevalence of Zero-Food in these states worsened over the 30 years. Meanwhile, other northern, eastern, and north-eastern states of Nagaland (−19.7%), Rajasthan (−18.6%), Odisha (−18.5%), Madhya Pradesh (−11.7%), and Manipur and Delhi (−8.0%) saw largest absolute decline in the prevalence of Zero-Food over the same time period (Table 4). Focusing on the most recent change between 2016 and 2021, the states that experienced the largest increase were the northern states of Chhattisgarh, Uttar Pradesh and Sikkim with absolute change of 12.9%, 10.0% and 8.7% respectively. During this most recent period of 2016–2021, the risk of a child being Zero-Food was reduced the most in Tripura, followed by Daman-Diu and Dadra Nagar Haveli, and Goa with a decline of 19.3, 16.4 and, 13.8 percentage points, respectively (Table 4).
Considering the alternative definition of Zero-Food∗ (i.e., a child is considered not Zero-Food if they had food that essentially had no calories, such as sugar/honey water, juice, tea, coffee) does not substantially and meaningfully change the prevalence and patterns described above (Table S4).
Estimated headcount of Zero-Food children in India
In 2021, approximately 33,623,000 children were aged 6–23 months in India. The estimated population headcount of Zero-Food children in 2021 in India was 5,998,138 (Table 5). The population headcount of Zero-Food children varied from 1,705,074 in Uttar Pradesh to 1406 in Sikkim. Uttar Pradesh has more than a million and Bihar more than half a million (greater than 500,000) Zero-Food children. Uttar Pradesh (28.43%), Bihar (14.25%), Maharashtra (7.14%), Rajasthan (6.53%) and Madhya Pradesh (6.02%) account for 62.3% of the total burden of Zero-Food children.
Table 5.
Estimated headcount (N) of Zero-Food children for India and 36 States/Union Territories, and percentage share of Zero-Food children of each State/Union Territory to All-India, 2021.
| Zero-Food children | Percentage distribution | |
|---|---|---|
| India | 5,998,138 | 100 |
| States/Union Territories | ||
| Uttar Pradesh | 1,705,074 | 28.43 |
| Bihar | 854,824 | 14.25 |
| Maharashtra | 428,053 | 7.14 |
| Rajasthan | 391,817 | 6.53 |
| Madhya Pradesh | 361,258 | 6.02 |
| Karnataka | 267,276 | 4.46 |
| Gujarat | 246,930 | 4.12 |
| Jharkhand | 216,981 | 3.62 |
| Andhra Pradesh | 192,498 | 3.21 |
| Chhattisgarh | 191,158 | 3.19 |
| West Bengal | 187,040 | 3.12 |
| Assam | 168,744 | 2.81 |
| Tamil Nadu | 135,347 | 2.26 |
| Telangana | 132,789 | 2.21 |
| Haryana | 108,124 | 1.80 |
| Punjab | 97,804 | 1.63 |
| Odisha | 84,131 | 1.40 |
| Kerala | 55,599 | 0.93 |
| Jammu & Kashmir | 38,550 | 0.64 |
| NCT Of Delhi | 38,372 | 0.64 |
| Uttarakhand | 33,447 | 0.56 |
| Himachal Pradesh | 14,260 | 0.24 |
| Meghalaya | 13,373 | 0.22 |
| Tripura | 11,715 | 0.20 |
| Mizoram | 4,657 | 0.08 |
| Manipur | 4,163 | 0.07 |
| Arunachal Pradesh | 3,891 | 0.06 |
| Nagaland | 2,343 | 0.04 |
| Goa | 1,654 | 0.03 |
| Sikkim | 1,406 | 0.02 |
| Chandigarh | 1,338 | 0.02 |
| Dadra & Nagar Haveli | 1,315 | 0.02 |
| Puducherry | 808 | 0.01 |
| Andaman & Nicobar Island | 597 | 0.01 |
| Ladakh | 559 | 0.01 |
| Lakshadweep | 244 | 0.00 |
States/UTs with higher prevalence of Zero-Food, on average, tend to have a larger population burden of Zero-Food children (r = 0.54, p < 0.001) (Fig. 3). Uttar Pradesh, Bihar, Madhya Pradesh and Rajasthan are states with High Prevalence and High Burden (headcount) of Zero-Food children (Type IV). The states with Low Prevalence but High Burden (Type II) of Zero-Food children are Maharashtra, West Bengal, Tamil Nadu and Odisha. Conversely, there are states such as Punjab, Haryana, and Arunachal Pradesh, that because of the smaller population size of infants and young children have High Prevalence but Low Burden of Zero-Food children (Type III). Lastly, most (n = 12) states, such as Goa, Himachal Pradesh, and Uttarakhand, have Low Prevalence and Low Burden of Zero-Food children (Type I).
Fig. 3.

Relationship between the prevalence of Zero-Food (%) and 2021 Headcount Burden of Zero-Food children, 2021. AN: Andaman & Nicobar, AP: Andhra Pradesh, AR: Arunachal Pradesh, AS: Assam, BR: Bihar, CH: Chandigarh, CG: Chhattisgarh, DH: Dadra and Nagar Haveli and Daman and Diu, GA: Goa, GJ: Gujarat, HR: Haryana, HP: Himachal Pradesh, JK: Jammu & Kashmir, JH: Jharkhand, KA: Karnataka, KL: Kerala, LK: Ladakh, LD: Lakshadweep, MP: Madhya Pradesh, MH: Maharashtra, MN: Manipur, ML: Meghalaya, MZ: Mizoram, DL: NCT Delhi, NL: Nagaland, OR: Odisha, PY: Puducherry, PB: Punjab, RJ: Rajasthan, SK: Sikkim, TN: Tamil Nadu, TL: Telangana, TR: Tripura, UP: Uttar Pradesh, UK: Uttarakhand, WB: West Bengal. Since Bihar and Uttar Pradesh had exceptionally high headcount of Zero-Food children (1,704,074 and 854,824, respectively) including those data points on a common scale as others was masking the pattern emerging from the remaining states, and hence not shown in the Figure. Since they appear to be “outliers” we report the correlation coefficient between the Headcount and Prevalence both with and without the inclusion of Uttar Pradesh and Bihar.
Correlates of Zero-Food
The all-India prevalence of Zero-Food in 2021 was highest among children aged 6–11 months (30.6%, 95% CI: 30.3%, 31.2%), even though it was still substantial among children aged 18–23 months (8.5%, 95% CI: 8.1%, 8.9%) (Table 6). The prevalence of Zero-Food was also patterned by socioeconomic status, captured through mother's educational attainment and household's economic status, with advantaged groups having a lower prevalence compared to the disadvantaged groups. For instance, there was about 10 and 7 percentage points difference in prevalence of Zero-Food between the lowest and the highest education/wealth categories, respectively (Table 6). Other characteristics such as the sex of child, social caste of the head of the household and place of residence showed smaller differentials on the prevalence of Zero-Food.
Table 6.
Sample distribution and percentage (and 95% confidence interval (CI)) of Zero-Food children by demographic and socioeconomic characteristics, 2021, India.
| Sample distribution |
Prevalence of Zero-Food |
|||
|---|---|---|---|---|
| n | % | % | 95% CI | |
| Child age | ||||
| 6–11 months | 21,439 | 34.9 | 30.6 | (30.0–31.2) |
| 12–17 months | 21,770 | 34.6 | 13.1 | (12.6–13.5) |
| 18–23 months | 18,800 | 30.6 | 8.5 | (8.1–8.9) |
| Child sex | ||||
| Female | 32,239 | 52.0 | 18.1 | (17.7–18.5) |
| Male | 29,770 | 48.0 | 17.5 | (17.1–17.9) |
| Place of residence | ||||
| Rural | 49,393 | 73.3 | 18.9 | (18.5–19.2) |
| Urban | 12,616 | 26.7 | 14.8 | (14.2–15.4) |
| Social caste | ||||
| Other Caste | 9897 | 19.0 | 15.6 | (14.9–16.3) |
| Other Backward Classes | 23,851 | 45.9 | 18.1 | (17.6–18.6) |
| Scheduled Caste | 12,596 | 24.3 | 18.8 | (18.1–19.5) |
| Scheduled Tribe | 12,418 | 10.8 | 19.3 | (18.7–20) |
| Educational Attainment (Mother) | ||||
| No formal schooling | 11,968 | 18.7 | 23.0 | (22.2–23.7) |
| Primary (1–5 years) | 7193 | 11.0 | 19.1 | (18.2–20.0) |
| Secondary (6–10 years) | 23,969 | 37.4 | 17.1 | (16.7–17.6) |
| Senior secondary (11–12 years) | 9236 | 15.2 | 16.1 | (15.4–16.9) |
| College education (more than 12 years) | 9643 | 17.8 | 14.3 | (13.6–15) |
| Household Wealth (Quintile) | ||||
| Poorest | 16,258 | 23.7 | 21.0 | (20.4–21.6) |
| Poor | 14,256 | 21.2 | 20.0 | (19.4–20.7) |
| Middle | 12,279 | 20.0 | 17.3 | (16.6–17.9) |
| Rich | 10,613 | 18.7 | 15.5 | (14.8–16.1) |
| Richest | 8603 | 16.4 | 13.6 | (12.8–14.3) |
Discussion
Our study has five salient findings. First, the prevalence of Zero-Food in India has only marginally declined over the last 30 years, with a significant decline in 2006 and a subsequent rise in 2016 and 2021 to levels similar to 1993. There are indications of stagnation or even increases in the last 15 years. Second, the extent of state-inequalities in the prevalence of Zero-Food appears to have largely remained the same, even though the rank-ordering of states/UTs have changed across years. Third, states that had an initial higher prevalence of Zero-Food generally experienced a greater AC compared to states that had lower initial prevalence of Zero-Food. Fourth, India currently has a large and substantial headcount burden of Zero-Food children, and the states of Uttar Pradesh, Bihar, Maharashtra, Rajasthan and Madhya Pradesh (all moderate to high prevalence of Zero-Food states) account for nearly two-third of the headcount burden of Zero-Food children. At the same time, there is evidence that considering the prevalence of Zero-Food and the population headcount of Zero-Food children together is necessary for targeting and prioritizing states/UTs that need immediate intervention. Fifth, the risk of Zero-Food is patterned by child's age and socioeconomic status but prevalence is still substantial across all groups.
The following data-related issues should be considered while interpreting the findings. First, the questionnaire does not assess the frequency or severity of food deprivation. However, not eating anything for even one day during the most essential period of child's development represents a useful metric of food deprivation, and aligns with the FAO's criteria of food insecurity.7 Second, the food consumption questions in NFHS were restricted to age 6–23 months. Thus, our estimates are not representative of all children under the age of 5, which is the age group conventionally considered for “young children”. The substantial prevalence of food deprivation among age 6–23 months identified in our study underscores the need to expand the food consumption questions in future NFHS to include all children under the age of 5, in order to have a complete picture of food deprivation among children in India. Third, in South Asia, there is likely to be seasonality to consumption of food items,35 and therefore the time of the survey interview could influence the responses to previous 24-h recall of food consumption. While seasonality may be important for consumption of specific food items based on availability and affordability, it is unlikely to influence response to overall food consumption or lack of it, which is the focus of our study. Fourth, the NFHS-5 was initiated in 2019 and was disrupted due to Covid-19 before resuming and completing it in 2020–21.25 There is a need for further deep dive investigation of the micro data separated by the dates of survey preceding Covid-19 from the rest, to examine any systematic influence of Covid-19 on responses, both positive such as the effects of Pradhan Mantri Garib Kalyan Ann Yojana (PMGKAY) by the Government of India during Covid-19, and negative such as loss of sustained employment. Fifth, the scope of our study does not allow us to meaningfully engage in any formal policy assessment or reasons for the observed trends. However, we make note of the government programmes that may need careful appraisal in the light our findings. Sixth, about 15% of the sample in 1993 had not reported food consumption information with a higher percentage of the same among children aged 18–23 months. Since we adopted a complete case analysis, we assumed no potential impact of these missing cases for the values of 1993. Seventh, the explanation of the substantial decline in prevalence of Zero-Food children in 2006 and then its sharp increase by 2016 needs further scrutiny from a survey administration perspective as well as if this was “real”, such as effects of economic growth or policies. To the extent, we could discern on the survey design aspect, 2006 was the survey year when more detailed questions on food intake were administered for the first time. It could be that the 2006 is the anomaly here since the prevalence of Zero-Food prior to, and after, 2006 show similar levels, suggesting little change in the last thirty years. Finally, the 1993 and 1999 estimates are approximations for the following states (Appendix S2): Andhra Pradesh, Bihar, Chhattisgarh, Jharkhand, Madhya Pradesh, Telangana, Uttar Pradesh, Uttarakhand, and Jammu and Kashmir. For 2006, estimates are approximations for the following states: Andhra Pradesh, Telangana, Jammu and Kashmir, and Ladakh.
Within the context of the preceding data-related considerations, we discuss our study findings by providing a comparative perspective to estimates of food deprivation. We follow this by mapping the food policy landscape in India to contextualize our findings to facilitate a policy deliberation of existing policies from a resource and design perspective.
We are not aware of any study that has estimated the prevalence of food deprivation among infants and young children for India and its states/UTs, currently or over time. To the extent that there are studies on all population (primarily, adults or households), there is substantial variation in the definition of food deprivation itself that prohibits a strict comparison, besides being local and non-representative. Nonetheless, at the all-India level, the FAO's PoU which captures food deprivation based on inadequate dietary calorie consumption for healthy living among all population (children and adults) was 16.3% in 2019–21.15 Prevalence of food inadequacy, which extends the PoU to account for those who did not consume enough calories for a normal physical activity, was about 25.0% in 2014–16 in India.36 Another study using the FIES, showed that among children aged 15 years or younger in India, 16.1% lived in a household where at least one member faced severe food insecurity.37 The prevalence of Zero-Food we report in our study for infants and young children, thus, seem broadly consistent with prior estimates at the all-India level. To effectively monitor the prevalence of Zero-Food, future iterations of NFHS can incorporate a straightforward question regarding the child's daily food consumption. The question could be phrased for example as: ‘Has the child eaten anything yesterday apart from breastmilk such as any solid food, soft mushy food, milk, infant milk powder?’. This approach emphasizes the importance of identifying children who are experiencing extreme food deprivation.
Policy response to the issue of food security in India has evolved over time to include a substantial share of the population (Table S5). Historically, India addressed the issue of food insecurity through its Public Distribution System (PDS). The PDS was revamped as the Targeted Public Distribution System (TPDS) in 1997 to target the poorest population.38 The TPDS and its subsidiary Antyodaya Anna Yojana provide 35 kg of food grains per family per month at a merged price of Indian Rupees 2–3 per kilogram to the poorest of poor.39 Population specific policies such as the Annapurna scheme (for elderly), The Rajiv Gandhi Scheme for Empowerment of Adolescent Girls, renamed as Sabla scheme (for adolescent girls) and Nutrition Rehabilitation Centres (for severely malnourished children) were rolled out in 2000–2010. The enactment of the 2013 National Food Security Act (NFSA) marked a paradigm shift in India's policy response to addressing food insecurity from a “welfare” perspective to a “human rights” perspective.40 Since the National Food Security Act, 75% of the rural and 50% of the urban populations are legally entitled to receive subsidized food grains under AAY.
Focused programs such as the Special Nutrition Program (1970) and Integrated Child Development Services (ICDS) (1975) were launched to improve maternal and child under-nutrition and remains in place. The Supplementary Nutrition Program under ICDS provides food supplements of 500 calories of energy and 12-15 grams of protein per day, either as a take-home ration (for 6 months to 3 years) or morning snack and home-cooked meals (for 3 to 6 years). Severely underweight children are given 800 calories and 20 to 25 grams of protein per day for each child. Pregnant women and lactating mothers are given food supplements of 600 calories of energy and 18-20 grams of protein per day in the form of Micronutrient Fortified Food and/or energy-dense food as Take-Home Ration.41,42 To further streamline efforts and policies targeting under-nutrition among children and women, POSHAN Abhiyaan (Prime Minister's Overarching Scheme for Holistic Nutrition) was launched in 2018, which was later aligned with the supplementary nutrition programme and scheme for adolescent girls and launched as Integrated Nutrition Support Programme (POSHAN 2.0).43
In addition to the above national policies, state governments have also developed programs for their respective populations. For example, Karnataka, Tamil Nadu and West Bengal have community canteens that serve cooked meals at much subsidised rates.44 Telangana and Kerala have recently adopted schemes for providing fortified foods that cater to a substantial amount of daily micronutrient requirements of children.45 Andhra Pradesh and Haryana have augmented their supplementary nutrition program of ICDS by providing milk to children 6–72 months as well as pregnant and lactating mothers.46,47
The COVID-19-related disruptions prompted the launch of the Pradhan Mantri Garib Kalyan Ann Yojana in 2020.48 Under this scheme, about 800 million individuals (two-thirds of India's population) received 5 kg of food grains and 1 kg pulses per month. The program has been relaunched from January 1, 2023 for Antyodaya and priority households.49
India has the breadth and depth of policy instruments and coverage to adequately address the issue of food deprivation and insecurity in India. A careful appraisal of these instruments from a design, implementation as well as resource perspective is likely to be helpful. In particular, a greater degree of precision is required to ensure that food is reaching the populations most in need in a timely and equitable manner. Policy precision in targeting could be facilitated with further analysis focused on identifying smaller areas (e.g., districts, sub-districts, and villages) and vulnerable populations based on demographic and socioeconomic characteristics using the metric of Zero-Food. Indeed, in the remaining eight years left to achieve the SDG 2, India should consider a routine and systematic food surveillance to monitor the progress they are making in ensuring food security and eliminating hunger among children and adults.
Globally, food insecurity has emerged as a critical issue underscored by the vulnerabilities of the globally interconnected food production and distribution systems,50 including in higher-income countries. For instance, the current United States (US) administration hosted a White House conference and released a National Strategy identifying ending hunger by 2030, among others, as an explicit policy goal.51 A comparable effort in India with the backing of current political leadership can help galvanize a purposeful strategy to comprehensively address the issue of food access and security for India. The fact that almost one out of every five children in India is at the risk of not being able to eat any food every day indicates substantial calorie deficiency based on the recommended WHO guidelines, even after accounting for breastmilk intake. The existing framework of NFSA should be re-examined to identify improvements in design and in better identifying populations that needs the most assistance, based on both prevalence of Zero-Food and population headcount of Zero-Food children. Bringing precision to existing food policies should be urgently considered if India aims to realize the SDG goal related to ending hunger and ensuring access to safe, nutritious, and sufficient food all year round by 2030.17
Contributors
Conceptualization and Design: S.V.S., S.S., R.K.; Data Acquisition and Analysis: M.A., A.K.; Data Interpretation: S.V.S., M.A., S.S., A.K., R.K.; Writing of the Manuscript: M.A., S.V.S., S.S., A.K.; Critical Revisions: S.V.S., M.A., S.S., A.K., R.K.; Overall Supervision: S.V.S.
Data sharing statement
The study is based on publicly available data and can be accessed from https://dhsprogram.com/data/available-datasets.cfm. The underlying data tables used in this analysis can be accessed from the interactive dashboard linked here: https://geographicinsights.iq.harvard.edu/State-Zero-Food.
Declaration of interests
None.
Acknowledgements
The authors would like to thank the Demographic and Health Surveys program for making the National Family Health Survey data freely accessible. We would also like to acknowledge Bharat Maps for the making available the latest State/Union Territory map of India.
Footnotes
Supplementary data related to this article can be found at https://doi.org/10.1016/j.eclinm.2023.101890.
Interactive Dashboard of Zero-Food and Zero-Food∗ across States/UTs of India (1993 to 2021): https://geographicinsights.iq.harvard.edu/State-Zero-Food
Contributor Information
S.V. Subramanian, Email: svsubram@hsph.harvard.edu.
Mayanka Ambade, Email: mayanka_ambade@fas.harvard.edu.
Smriti Sharma, Email: ssharma@tatatrusts.org.
Akhil Kumar, Email: akhil.kumar0@yahoo.com.
Rockli Kim, Email: rocklikim@korea.ac.kr.
Appendix A. Supplementary data
References
- 1.World Health Organization and United Nations Children's Fund . 2021. Indicators for assessing infant and young child feeding practices: definitions and measurement methods. Geneva.https://www.who.int/publications/i/item/9789240018389 [Google Scholar]
- 2.Tiwari S., Bharadva K., Yadav B., et al. Infant and young child feeding guidelines, 2016. Indian Pediatr. 2016;53(8):703–713. doi: 10.1007/s13312-016-0914-0. [DOI] [PubMed] [Google Scholar]
- 3.Pan American Health Organization and World Health Organization . 2003. Guiding principles for complementary feeding of the breastfed child. Washington, DC.https://iris.paho.org/handle/10665.2/752 [Google Scholar]
- 4.World Health Organization . 2022. Complementary feeding.https://www.who.int/health-topics/complementary-feeding#tab=tab_1 [Google Scholar]
- 5.United Nations Development Program . 2022. The SDGs in action.https://www.undp.org/sustainable-development-goals [Google Scholar]
- 6.Food and Agriculture Organization . 2022. Sustainable Development Goals: Indicator 2.1.1- Prevalence of undernourishment.https://www.fao.org/sustainable-development-goals/indicators/211/en/ Accessed December 27, 2022. [Google Scholar]
- 7.Food and Agriculture Organization . 2022. Hunger and food insecurity.https://www.fao.org/hunger/en/#:∼:text=A%20person%20is%20food%20insecure,at%20different%20levels%20of%20severity [Google Scholar]
- 8.Heemann M., Kim R., Vollmer S., Subramanian S.V. Assessment of undernutrition among children in 55 low-and middle-income countries using dietary and anthropometric measures. JAMA Netw Open. 2021;4(8) doi: 10.1001/jamanetworkopen.2021.20627. [DOI] [PMC free article] [PubMed] [Google Scholar]
- 9.Heemann M., Kim R., Sharma S., Vollmer S., Subramanian S.V. Food group consumption patterns among children meeting and not meeting WHO's recommended dietary diversity: evidence from 197,514 children in 59 countries. Food Pol. 2022;112:102368. doi: 10.1016/j.foodpol.2022.102368. [DOI] [Google Scholar]
- 10.World Health Organization . WHO; France: 2009. Infant and young child feeding: model chapter for textbooks for medical students and allied health professionals.https://apps.who.int/iris/bitstream/handle/10665/44117/9789241597494_eng.pdf?sequence=1&isAllowed=y [PubMed] [Google Scholar]
- 11.Saunders J., Smith T. Malnutrition: causes and consequences. Clin Med. 2010;10(6):624–627. doi: 10.7861/clinmedicine.10-6-624. [DOI] [PMC free article] [PubMed] [Google Scholar]
- 12.Pollitt E., Golub M., Gorman K., et al. A reconceptualization of the effects of undernutrition on children's biological, psychosocial, and behavioral development and commentaries'. Soc Policy Rep. 1996;10(5):1–22. doi: 10.1002/j.2379-3988.1996.tb00003.x. [DOI] [Google Scholar]
- 13.Beckerman-Hsu J.P., Kim R., Sharma S., Subramanian S.V. Dietary variation among children meeting and not meeting minimum dietary diversity: an empirical investigation of food group consumption patterns among 73,036 children in India. J Nutr. 2020;150(10):2818–2824. doi: 10.1093/jn/nxaa223. [DOI] [PMC free article] [PubMed] [Google Scholar]
- 14.Agrawal S., Kim R., Gausman J., et al. Socio-economic patterning of food consumption and dietary diversity among Indian children: evidence from NFHS-4. Eur J Clin Nutr. 2019;73(10):1361–1372. doi: 10.1038/s41430-019-0406-0. [DOI] [PubMed] [Google Scholar]
- 15.FAO. IFAD. UNICEF. WFP. WHO . Food and Agriculture Organisation; Rome: 2022. The State of Food Security and Nutrition in the World 2022: repurposing food and agricultural policies to make healthy diets more affordable. [DOI] [Google Scholar]
- 16.Beckerman-Hsu J.P., Chatterjee P., Kim R., Sharma S., Subramanian S.V. A typology of dietary and anthropometric measures of nutritional need among children across districts and parliamentary constituencies in India, 2016. J Glob Health. 2020;10(2):020424. doi: 10.7189/jogh.10.020424. [DOI] [PMC free article] [PubMed] [Google Scholar]
- 17.Subramanian S.V., Ambade M., Kumar A., et al. Progress on Sustainable Development Goal indicators in 707 districts of India: a quantitative mid-line assessment using the National Family Health Surveys, 2016 and 2021. Lancet Reg Health South East Asia. 2023 doi: 10.1016/j.lansea.2023.100155. 100155. [DOI] [PMC free article] [PubMed] [Google Scholar]
- 18.Rajpal S., Kim R., Liou L., Joe W., Subramanian S.V. Does the choice of metric matter for identifying areas for policy priority? An empirical assessment using child undernutrition in India. Soc Indic Res. 2020;152(3):823–841. doi: 10.1007/s11205-020-02467-9. [DOI] [Google Scholar]
- 19.National Portal of India . 2022. India at a glance: Profile.https://www.india.gov.in/india-glance/profile [Google Scholar]
- 20.Dreze J., Sen A., editors. Indian development: selected regional perspectives. Clarendon: Oxford University Press; 1997. [DOI] [Google Scholar]
- 21.Kurian N.J. Widening regional disparities in India: some indicators. Econ Polit Wkly. 2000;35(7):538–550. https://www.jstor.org/stable/4408933 [Google Scholar]
- 22.Karlsson O., Kim R., Sarwal R., James K., Subramanian S.V. Trends in underweight, stunting, and wasting prevalence and inequality among children under three in Indian states, 1993–2016. Sci Rep. 2021;11(1):14137. doi: 10.1038/s41598-021-93493-1. [DOI] [PMC free article] [PubMed] [Google Scholar]
- 23.Johri M., Rajpal S., Subramanian S.V. Progress in reaching unvaccinated (zero-dose) children in India, 1992–2016: a multilevel, geospatial analysis of repeated cross-sectional surveys. Lancet Glob Health. 2021;9(12):e1697–e1706. doi: 10.1016/S2214-109X(21)00349-1. [DOI] [PubMed] [Google Scholar]
- 24.International Institute for Population Sciences and ICF . 2016. National family Health survey (NFHS-4), 2015-16: India.http://rchiips.org/nfhs/nfhs-4Reports/India.pdf [Google Scholar]
- 25.International Institute for Population Sciences and ICF . 2021. National family Health survey (NFHS-5), 2020–21.http://rchiips.org/nfhs/NFHS-5Reports/NFHS-5_INDIA_REPORT.pdf [Google Scholar]
- 26.International Institute for Population Sciences and Macro International . 2007. National Family Health Survey (NFHS-3), 2005–06: India, volume 1.http://rchiips.org/nfhs/nfhs3_national_report.shtml [Google Scholar]
- 27.International Institute for Population Sciences and Macro International . 2000. National Family Health Survey (NFHS-2), 1998–99: India.http://rchiips.org/nfhs/india2.shtml [Google Scholar]
- 28.International Institute for Population Sciences . 1995. National family health survey (MCH and family planning), India 1992–93.http://rchiips.org/nfhs/india1.shtml [PubMed] [Google Scholar]
- 29.National Commission on Population . Ministry of Health and Family Welfare, Government of India; New Delhi: 2020. Population Projections for India and states 2011-2036: report of the technical group on population projections.https://main.mohfw.gov.in/sites/default/files/Population%20Projection%20Report%202011-2036%20-%20upload_compressed_0.pdf [Google Scholar]
- 30.Integrated Public Use Microdata Series and Demographic and Health Survey Program . 2022. POPWT_HH, POPWT, KIDWT, and MENWT expansion factors.https://www.idhsdata.org/idhs/population_weights.shtml [Google Scholar]
- 31.StataCorp L . StataCorp LP; College Station, TX: 2013. Stata statistical software: release 15. [Google Scholar]
- 32.ESRI . 2022. Arc-GIS pro.https://www.esri.com/en-us/arcgis/products/arcgis-pro/overview [Google Scholar]
- 33.Microsoft . 2022. Power BI.https://powerbi.microsoft.com/en-au/ [Google Scholar]
- 34.International Institute for Population Sciences . 2019. National family health survey- women's questionnaire.http://rchiips.org/NFHS/NFHS5/schedules/NFHS-5Womans.pdf Accessed February 9, 2023. [Google Scholar]
- 35.Madan E.M., Haas J.D., Menon P., Gillespie S. Seasonal variation in the proximal determinants of undernutrition during the first 1000 days of life in rural South Asia: a comprehensive review. Global Food Secur. 2018;19:11–23. doi: 10.1016/j.gfs.2018.08.008. [DOI] [Google Scholar]
- 36.Reddy A.A. Food security indicators in India compared to similar countries. Curr Sci. 2016;111(4):632–640. https://www.currentscience.ac.in/Volumes/111/04/0632.pdf [Google Scholar]
- 37.Pereira A.L., Handa S., Holmqvist G. UNICEF Office of Research; Florence: 2017. Prevalence and correlates of food insecurity among children across the globe. Innocenti Working Paper 2017–09.https://www.unicef-irc.org/publications/pdf/IWP_2017_09.pdf [Google Scholar]
- 38.Department of Food and Public Distribution, Ministry of Consumer Affairs, Food and Public Distribution, Government of India . 2022. Targeted public distribution system.https://dfpd.gov.in/pds-tpds.htm [Google Scholar]
- 39.Department of Food and Public Distribution, Ministry of Consumer Affairs, Food and Public Distribution, Government of India . 2022. ANTYODAYA ANNA YOJANA (AAY) AAY.https://dfpd.gov.in/pds-aay.htm [Google Scholar]
- 40.Department of Food and Public Distribution . Ministry of Law and Justice; 2022. Government of India. National Food Security Act (NFSA), 2013.https://nfsa.gov.in/portal/nfsa-act [Google Scholar]
- 41.Ministry of Women and Child Development . 2014. Government of India. Supplementary Nutrition Programme.https://pib.gov.in/newsite/printrelease.aspx?relid=104046#:∼:text=Supplementary%20Nutrition%20Programme&text=The%20Supplementary%20Nutrition%20is%20one,Average%20Daily%20Intake%20(ADI) [Google Scholar]
- 42.Ministry of Women and Child Development, Government of India . 2022. Integrated Child Development Services (ICDS) scheme.http://icds-wcd.nic.in/supplnutrition.aspx [Google Scholar]
- 43.Ministry of Women and Child Development, Government of India . 2022. Mission Saksham Anganwadi and Poshan 2.0: Scheme Guidelines. New Delhi.https://wcd.nic.in/sites/default/files/Final%20Saksham%20Guidelines%20with%20covering%20letter%20%281%29.pdf [Google Scholar]
- 44.Rajendran S. Amma unavagams of Tamil Nadu: panacea for urban food insecurity? Econ Polit Wkly. 2013;48(50):22–24. https://www.epw.in/journal/2013/50/commentary/amma-unavagams-tamil-nadu.html [Google Scholar]
- 45.Department of Women and Child Welfare, Government of Telangana . 2022. Balamrutham - weaning food for children between 7 months and 3 years.https://wdcw.tg.nic.in/Balamrutham.html [Google Scholar]
- 46.Government of Andhra Pradesh . 2020. YSR sampoorna poshan.https://ysrsampoornaposhana.ap.gov.in/YSRSP/Default.aspx [Google Scholar]
- 47.Chief Minister Office Haryana . Government of Haryana; 2020. Press release.https://haryanacmoffice.gov.in/01-august-2020 [Google Scholar]
- 48.Ministry of Finance . 2020. Finance minister announces Rs 1.70 lakh crore relief package under Pradhan Mantri Garib Kalyan Yojana for the poor to help them fight the battle against Corona virus.https://pib.gov.in/PressReleasePage.aspx?PRID=1608345 [Google Scholar]
- 49.Ministry of Consumer Affairs, Food and Public Distribution . 2023. Centre names new integrated food security scheme launched from 1 January 2023 as “Pradhan Mantri Garib Kalyan Ann Yojana (PMGKAY)”.https://pib.gov.in/PressReleasePage.aspx?PRID=1890272 [Google Scholar]
- 50.Xu Z. Food dependency and global food crisis. Int Crit Thought. 2019;9(2):269–281. doi: 10.1080/21598282.2019.1613920. [DOI] [Google Scholar]
- 51.United States Department of Health and Human Services . 2022. White House conference on hunger, nutrition, and health.https://health.gov/our-work/nutrition-physical-activity/white-house-conference-hunger-nutrition-and-health/conference-details [Google Scholar]
Associated Data
This section collects any data citations, data availability statements, or supplementary materials included in this article.