

Abstract
Background
Major Depressive Disorder (MDD) is a psychiatric illness that is often associated with potentially life-threatening physiological changes and increased risk for suicidal behavior. Electroencephalography (EEG) research suggests an association between depression and specific frequency imbalances in the frontal brain region. Further, while recently developed technology has been proposed to simplify EEG data acquisition, more research is still needed to support its use in patients with MDD.
Methods
Using the 14-channel EMOTIV EPOC cap, we recorded resting state EEG from 15 MDD patients with and MDD persons with suicidal ideation (SI) vs. 12 healthy controls (HC) to investigate putative power spectral density (PSD) between-group differences at the F3 and F4 electrode sites. Specifically, we explored 1) between-group alpha power asymmetries (AA), 2) between-group differences in delta, theta, alpha and beta power, 3) between PSD data and the scores in the Beck’s Depression Inventory-II (BDI-II), Beck’s Anxiety Inventory (BAI), Reasons for Living Inventory (RFL), and Self-Disgust Questionnaire (SDS).
Results
When compared to HC, patients had higher scores on the BAI (p = 0.0018), BDI-II (p = 0.0001) or SDS (p = 0.0142) scale and lower scores in the RFL (p = 0.0006) scale. The PSD analysis revealed no between-group difference or correlation with questionnaire scores for any of the measures considered.
Conclusions
The present study could not confirm previous research suggesting frequency-specific anomalies in depressed persons with SI but might suggest that frontal EEG imbalances reflect greater anxiety and negative self-referencing. Future studies should confirm these findings in a larger population sample.
Keywords: Electroencephalogram, EEG, Depression, Anxiety, Suicidal ideation, Emotiv epoc
1. Introduction
Major Depressive Disorder (MDD) is a psychiatric illness associated with both psychological suffering and potentially life-threatening changes in normal physiology (Lopez et al., 2006, Whiteford et al., 2015). Moreover, depression is the most common psychiatric disorder in people dying by suicide (Rich et al., 1986, Henriksson et al., 1993, Conwell et al., 1996, Harwood et al., 2001, Kious et al., 2018). Therefore, the identification of risk factors for suicide in persons with depression is key to improving diagnosis reliability and identifying strategies for targeted intervention.
Diagnosis of depression is typically carried out using structured interviews employing the DSM-5 and ICD-11 classification systems. Diagnostic criteria are based on both self-reported symptoms (e.g., changes in normal day-to-day behavior, cognitive, affective or physical disturbances) and interview-based clinical assessments. However, this approach can be prone to patient and expert bias, suggesting the need for more objective and reliable ways to inform both clinical diagnosis and treatment. In this context, electroencephalography (EEG) is one the most explored methods, with clear advantages over other techniques, being non-invasive, capable of detecting signals with high spatial and temporal resolution and widely available at a relatively low cost.
Through electrodes appropriately placed on the scalp, EEG systems allow for the acquisition of electrical signals from the brain, which can then be converted into digital form employing ad hoc software. The rhythmic EEG spectrum is typically categorized into five main oscillation frequency bands: 1) delta (<4 Hz) more represented during sleep, 2) theta (4–8 Hz) reflecting a state of drowsiness, 3) alpha (8–12 Hz) accompanying a relaxed state, 4) beta (12–30 Hz) commonly index of an engaged or active brain, and 5) gamma (30–50 Hz or higher), participating in both perception and synchronization of neural firing rates across separate brain regions (Singer and Gray, 1995, Buzsáki, 2006, Britton et al., 2016). Modern of note, modern EEG systems allow for highly simplified data acquisition, reducing set up time to just a few minutes, which could be crucial when working with potentially problematic clinical populations (e.g, persons who are intimidated by standard EEG equipment or easily upset by a long set up time). In particular, the EMOTIV EPOC headset wirelessly connected to the iMotions (https://imotions.com) workstation has been employed in recent research (Amico et al., 2016, Williams et al., 2020). However, more research is needed to evaluate the ability of this system to detect EEG anomalies in patients with depression.
Importantly, suicidal ideation (SI) is more likely to occur when people’s thoughts are at rest (Beck, 1979), therefore gathering EEG data during resting state could provide a background on the psychological processes associated with SI, including negative thinking (Kleiman et al., 2014, Stange et al., 2015), ruminative brooding and hopelessness thoughts (Kleiman et al., 2014). Resting-state EEG research suggests a role of reduced right frontal delta power (Meerwijk et al., 2015) in depression and in patients with greater psychological pain, a proposed risk factor for suicide (Troister et al., 2013), and reduced frontal delta power has been interpreted as an indicator of less effective emotion regulation, including increased rumination and the inability to reappraise the causes and consequences of psychological suffering (Meerwijk et al., 2015). These findings were confirmed by Meerwijk and Weiss (Meerwijk and Weiss, 2016), who found that recent desire for suicide modulates the relationship between psychological pain and frontal delta power, although recent research with MDD patients has shown that increased rather than decreased delta power was associated with an increased risk for SI (Dolsen et al., 2017).
On the other hand, theta band activity has been found to be increased across frontal regions in depressed individuals (Arns et al., 2015) and greater frontal theta power positively correlates with SI (Lee et al., 2017). Interestingly, research with adolescents (Lee et al., 2017) has shown that the risk for suicide may be driven by a positive correlation between frontal theta power and depression/anxiety scores (Lee et al., 2017), suggesting that further research is needed to confirm these results in an adult population. Interestingly, depressive symptoms have been shown to positively correlate with delta and theta activity in the orbitofrontal cortex and negatively with theta activity in the default mode network (DMN) (Knyazev et al., 2015), a large-scale subset of brain regions that is involved in self-referencing (Andrews-Hanna, 2012). To our knowledge, however, more research is needed to explore the link between frontal low frequency EEG anomalies and negative self-perception in depressed persons.
In depressed persons at risk for suicide, frontal high frequency EEG activity may also be altered (Benschop et al., 2019, Duan et al., 2021). In particular, high risk individuals may exhibit lower beta power in the frontal region (Benschop et al., 2019, Duan et al., 2021), which might affect resilience to stress, be associated with greater anxiety and reduce a person’s ability to cope with negative thoughts (Putman et al., 2014). Moreover, resting state EEG recordings from depressed patients have shown increased altered alpha activity in the frontal region (von Knorring et al., 1983, Prichep and John, 1992), which could reflect lower cortical activation. Altogether, these findings could be in line with the evidence showing that suicide risk is associated with reduced emotion regulation efficiency (Swann et al., 2020) and with neuroimaging research showing that altered functional abnormalities in frontal cortical areas may increase the risk for suicide attempt (Cao et al., 2021).
Finally, greater left-hemisphere alpha activity in frontal/prefrontal regions has been frequently reported as a potential discriminant between depressed and healthy individuals (Davidson et al., 2002, Stewart et al., 2011), although some inconclusive findings exist (Reid et al., 1998, Pizzagalli et al., 2002). This difference in frontal/prefrontal alpha band activity is known as alpha-asymmetry (AA), with studies indicating a link with both behavioral and physiological changes in depressed individuals (Reid et al., 1998). However, further research is required, to confirm whether AA represents a trait-marker, an endophenotype related to risk for depression, or both (Debener et al., 2000, Allen et al., 2004, Thibodeau et al., 2006, Allen and Cohen, 2010).
With this in mind, the aim of the present study was to explore putative resting state frontal, frequency-specific EEG differences between depressed patients and healthy controls, also exploring their association with suicide risk. Additionally, we hypothesized that only the patient group exhibited AA.
2. Materials and methods
2.1. Participants
The study was approved by the ethics committee of the Wicklow Mental Health Services following submission. Clinical protocols were established to escalate concern to the clinical teams in the event of distress or emergent SI during investigation. Individuals were approached for enrollment and those who consented were interviewed and screened up to a week before (depending on the subject’s availability) the experimental session.
Participants were naturalistically sampled from patients that were attendees of the service, selected on the basis of their score on the Beck’s Depression Scale (BDI-II) (Beck et al., 1996) current SI and judged safe to participate by two experienced psychiatrists, independent of the data collector. Clinical exclusion criteria included current or previous psychiatric conditions other than clinically diagnosed depressive disorders ICD F31.3, F31.4 F31.5, F32, F33, F34 and F60 (WHO, 2016), or current alcohol dependence and/or drug misuse assessed through a standard psychiatric assessment. Control subjects were recruited following screening among the hospital staff and clinical graduate students. Given the sample size, patients and controls could not be age or sex matched.
2.2. Demographics scales
Data were analysed from 27 subjects, of which 15 were patients (7 females and 8 males; median age = 37) and 12 were healthy controls (HC) (7 females and 5 males; median age = 37.5). Other demographic measures considered were: years of education, number of cigarettes smoked/day (e.g., Bronisch et al., 2008; Han et al., 2017), and alcohol intake (e.g., Schuckit, 2009) as measured by ml of ethanol/week (Schuckit, 2009).
2.3. Psychiatric scales
Psychiatric questionnaires were self-administered using the iMotions survey presentation module https://imotions.com/survey/ to each of the 27 participants.
The Beck’s Depression Inventory-II (BDI-II) was administered to assess depression (Beck et al., 1996). Given, that anxiety (Bentley et al., 2016) and self-disgust (Mason et al., 2022) may increase the risk for suicide ideation, the Beck’s Anxiety Inventory (BAI) (Beck et al., 1988) and Self-Disgust Questionnaire (SDS) (Olatunji et al., 2007) were also administered. Finally, the Reasons for Living Inventory (RFL) (Linehan et al., 1983) was used to measure suicide risk. The RFL measures the reasons for not taking one’s life despite the suicidal thoughts. A major assumption of the RFL instrument is that suicidal individuals are lacking in the adaptive beliefs that are instead present among non-suicidal individuals that deter suicidal behavior. Finally the Edinburgh Handedness scale (Oldfield, 1971) was administered to establish hand dominance, which has been shown to correlate with both cognitive functions and emotional processing (Cuzzocreo et al., 2009, Propper et al., 2010, Lyle et al., 2013).
2.4. Resting state task and data acquisition
Participants were required to sit in front of a 22” LCD computer monitor (distance 70 cm) and fixate a white cross (size: 22 × 22 mm) on a black background (size: 425 × 285 mm) for 10 min. The image was created and presented using the iMotions software package (https://imotions.com). The experimenter was always in the same room during sessions, sitting at the same desk behind a 27” LCD computer monitor, and had visual access to the participant through a camera (Logitech® Webcam C930e) mounted on top of the presentation monitor.
Throughout the session, the participant’s EEG was recorded using an EMOTIV EPOC cap (Boutani and Ohsuga, 2013, Rodriguez et al., 2013, Williams et al., 2020), featuring 14 channels (AF3, AF4, F3, F4, FC5, FC6, F7, F8, T7, T8, P7, P8, O1, O2) (Fig. 1), with CMS and DRL used as reference. EEG data were recorded at a 128 Hz sampling rate.
Fig. 1.
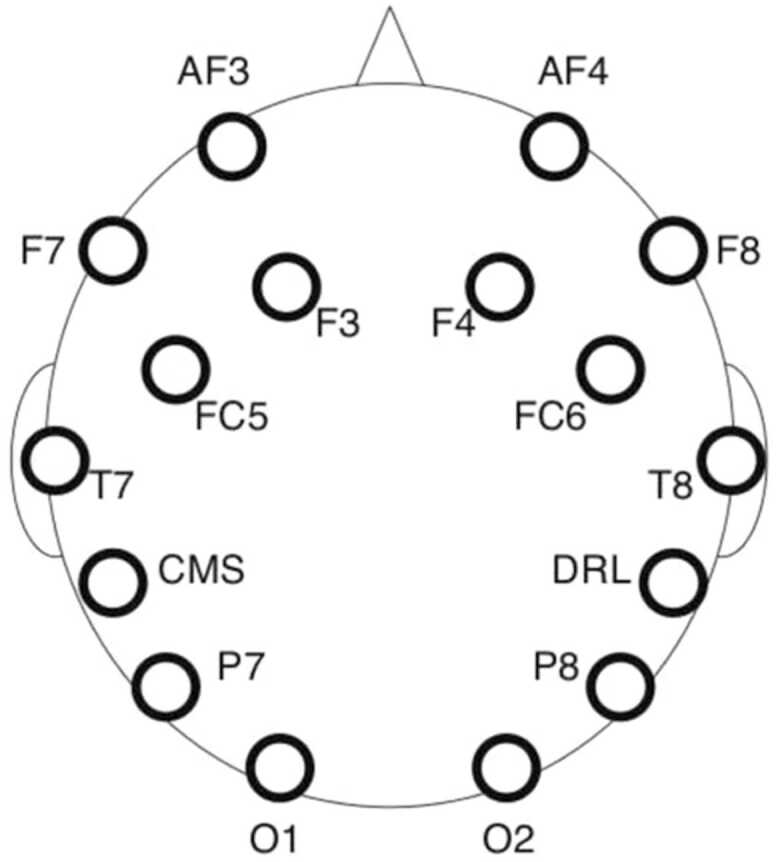
Electrode locations in the EMOTIV EPOC headset.
2.5. EEG data processing
Fig. 2 shows a schematic representation of the process employed to analyze the EEG data. All analysis steps were performed using both the EEGLAB toolbox and MATLAB custom-made scripts.
Fig. 2.

The EEG data analysis process.
More specifically, we applied a bandpass filter of 1.5–45 Hz to the raw data to filter out gamma band frequencies (45 Hz or higher). The EEG dataset of each participant was first visually inspected to manually remove artifacts - i.e. aberrant signals due to large eye movements not related to blinking, skeletal/cardiac muscle activity, or artifacts due to signal discontinuity. The remaining artifacts were located and removed using the Independent Component Analysis (ICA) algorithm implemented in EEGLAB (Bell and Sejnowski, 1995, Delorme and Makeig, 2004).
As suggested by previous research (Davidson et al., 2002, Stewart et al., 2011, Arns et al., 2015, Meerwijk et al., 2015), we investigated between-group EEG activity differences at the F3 and F4 electrode sites. The cleaned up data were then used to compute power spectral density (PSD) using the Welch’s method (Welch, 1967) at each of the two channels, in 4 different frequency bands: delta (1.5–3.5 Hz), theta (4–7.5 Hz), alpha (8–13 Hz), and beta (13–29 Hz). This yielded 8 PSD variables (2 channels x 4 frequency bands) for each participant. In line with the study by Thompson and Ong [37], we also computed the Alpha Asymmetry (AA) index for each participant using the equation:
Where F4 (alpha) and F3 (alpha) stand for alpha (8–13 Hz) power values at F4 (right frontal) and F3 (left frontal), respectively and ln stands for natural log.
2.6. Statistical analysis
The analysis was carried out in three main steps: 1) evaluation of the homogeneity of the subjects’ demographic data for each of the 2 groups, 2) exploration of between-group differences for all 8 PSD variables and AA and 3) investigation of putative correlations between the 8 PSD variables and each of the four psychiatric scale scores.
In the first step, a Shapiro-Wilk test for normality applied to all demographic variables and psychiatric scale scores revealed that less than 50% of the values were normally distributed. In line with this, we explored between-group differences for demographic values and psychiatric scale scores using the non-parametric Mann-Whitney test (except in the case of the sex variable, whose homogeneity was evaluated using a Fisher test, which is specific for Bernoulli variables).
In the second step of our analysis, we applied a Shapiro-Wilk test for normality to each of the PSD variables and found that these were normally distributed. Consequently, we applied a parametric two-sample unpaired t-test to explore the between-group differences for all 8 PSD variables, using a Bonferroni correction to control for multiplicity. Further, we used a parametric two-sample unpaired t-test to explore between-group differences in the AA index.
In the third step of our analysis, we evaluated Spearman correlations between the 8 PSD variables and each of the 4 psychiatric scale scores. For each score, we used a Bonferroni correction to control for multiple comparisons. We set the significance threshold at 0.05 and applied the correction to each score (new threshold: 0.05/8 = 0.0063).
3. Results
3.1. Demographic scales
Table 1 reports minimum, median, and maximum values for each demographic variable/group as well as the p-value of the Mann-Whitney test.
Table 1.
Participants’ demographic and psychiatric scale ratings (MDD: patients; HC: healthy controls). BAI: Beck’s anxiety inventory; BDI-II: Beck’s depression inventory II; RFL: reasons for life scale; SDS: self-disgust scale; p-value: outcome of the Mann-Whitney test comparing groups MDD and HC.
| MDD (N = 15) |
HC (N = 12) |
p-value | |||||
|---|---|---|---|---|---|---|---|
| Females/males | 7/8 |
7/5 |
n.s. | ||||
| min | median | max | min | median | max | p-value | |
| Age | 19 | 37 | 65 | 22 | 37.5 | 60 | 0.6248 |
| Years of education | 7 | 14 | 20 | 13 | 16.5 | 20 | 0.0099 |
| Edinburgh scale handedness score | -80 | 70 | 90 | -70 | 40 | 60 | 0.0292 |
| Alcohol intake (ml of ethanol/week) | 0 | 0 | 466.26 | 0 | 20.27 | 186.5 | 0.3620 |
| Smoking, cigarettes/day | 0 | 8 | 40 | 0 | 0 | 20 | 0.0347 |
| BAI | 13 | 35.5 | 55 | 2 | 8.5 | 51 | 0.0018 |
| BDI_II | 1 | 38 | 56 | 0 | 2 | 12 | 0.0001 |
| RFL | 78 | 205 | 291 | 139 | 319 | 401 | 0.0006 |
| SDS | 62 | 71 | 85 | 58 | 68.5 | 77 | 0.0142 |
There was no between-group difference for age or alcohol intake. The Fisher exact test revealed no sex effect (p = 0.70357, not reported on Table 1). However, we found differences for the years of education (p = 0.0099), number of cigarettes smoked/day (p = 0.0347) and handedness scores (p = 0.0292). Finally, when compared to the HC group, patients had higher scores in the BAI (p = 0.0018), BDI-II (p = 0.0001) or SDS (p = 0.0142) scale and lower scores in the RFL (p = 0.0006) scale.
3.2. Power spectral density (PSD)
The unpaired Bonferroni corrected student’s t-test did not reveal any significant difference between patients and HC for any of the 8 PSD variables considered, as summarized in Table 2. The same test applied to the AA index did not show any between-group difference. However, a power analysis suggested that the sample size was too small to reveal significant differences (Table 2).
Table 2.
Means and standard deviation (SD) of PSD at F3 and F4 for the bands: delta, theta, alpha, beta. MDD: patients; HC: healthy controls; p-value: t-test outcome of the comparison between groups MDD and HC.
| MDD (N = 15) |
HC (N = 12) |
|||||
|---|---|---|---|---|---|---|
| Band/Channel | mean | SD | mean | SD | p-value | power |
| delta/F3 | 3.613 | 4.930 | 0.894 | 3.767 | 0.11689 | 0.47 |
| delta/F4 | 5.307 | 4.728 | 3.454 | 2.886 | 0.22231 | 0.32 |
| theta/F3 | 4.099 | 4.524 | 1.777 | 3.802 | 0.15999 | 0.41 |
| theta/F4 | 5.486 | 4.053 | 4.421 | 2.958 | 0.43803 | 0.19 |
| alpha/F3 | 2.073 | 3.291 | -0.14 | 3.509 | 0.10723 | 0.51 |
| alpha/F4 | 3.318 | 3.094 | 2.387 | 3.201 | 0.45363 | 0.19 |
| beta/F3 | -0.602 | 4.335 | -3.56 | 3.595 | 0.06946 | 0.6 |
| beta/F4 | 0.562 | 3.593 | -1.46 | 3.058 | 0.13324 | 0.46 |
| AA | 1.2070 | 3.2311 | 0.7565 | 2.3877 | 0.6908 | 0.1 |
3.3. Correlation analyses
We found that the BAI scores positively correlated with alpha (p < 0.001) and beta (p < 0.001) power at F4. Also, SDS scores positively correlated with delta (p < 0.01), theta (p < 0.01) and beta (p < 0.01) power at F3 (Table 3).
Table 3.
Outcomes of the Spearman correlation test exploring the relationship between PSD variables and questionnaire scores. BAI: Beck’s anxiety inventory; BDI-II: Beck’s depression inventory II; RFL: reasons for life scale; SDS: self-disgust scale.
| BAI |
BDI-II |
|||
|---|---|---|---|---|
| Band/Channel | correlation | p-value | correlation | p-value |
| delta_F3 | 0.51863 | 0.007 | 0.42479 | 0.007 |
| delta_F4 | 0.23282 | 0.252 | 0.02581 | 0.900 |
| theta_F3 | 0.52068 | 0.006 | 0.40667 | 0.039 |
| theta_F4 | 0.14667 | 0.475 | 0.00462 | 0.982 |
| alpha_F3 | 0.34701 | 0.082 | 0.33897 | 0.090 |
| alpha_F4 | 0.59726 | 0.001* | -0.0288 | 0.889 |
| beta_F3 | 0.24786 | 0.222 | 0.30615 | 0.128 |
| beta_F4 | 0.60137 | 0.001* | 0.01419 | 0.945 |
| Band/Channel | RFL | SDS | ||
| delta/F3 | -0.06872 | 0.739 | 0.53282 | 0.005* |
| delta/F4 | -0.00479 | 0.981 | 0.09932 | 0.629 |
| theta/F3 | -0.09607 | 0.641 | 0.52188 | 0.006* |
| theta/F4 | -0.04889 | 0.813 | 0.09487 | 0.645 |
| alpha/F3 | -0.29548 | 0.135 | 0.46684 | 0.016 |
| alpha/F4 | -0.13492 | 0.502 | 0.01179 | 0.954 |
| beta/F3 | -0.24342 | 0.231 | 0.54684 | 0.004* |
| beta/F4 | -0.21607 | 0.289 | 0.16564 | 0.419 |
* indicates statistical significance.
4. Discussion
In the present study, we found no difference in frontal PSD between MDD patients and HC in the frequency spectrum ranging from delta to beta. However, we suggest that greater alpha and beta power in the right frontal region (F4) were likely to be associated with greater anxiety when both patients and HC were considered. Similarly, greater delta, theta and beta power in the left frontal region (F3) were likely to be positively associated with greater self-disgust. Since we demonstrated that patients were significantly more anxious and scored significantly higher in the SDS scale than HC, it is possible that there was a positive association between PSD and anxiety or SDS scores. In other words, since patients were found to be more anxious and had greater self-disgust than HC, it is possible that our hypothesis could not be confirmed simply because the statistical power of our tests was too low, not because there was actually no difference between the two groups.
Conversely to the evidence suggesting that frontal alpha asymmetry (AA) can be considered as a trait marker for depression (Davidson, 1992, Roh et al., 2020) but also in line with other research (Debener et al., 2000, van der Vinne et al., 2017, Thompson and Ong, 2018, Kołodziej et al., 2021), we found that the AA index, as measured during our resting state paradigm, was not predictive of a difference between MDD patients and HC.
While there was no association between the EEG measures considered and BDI scores, the results of the correlation tests might be in line with previous research showing that persons with anxiety may exhibit increased alpha power in the frontal region (Thibodeau et al., 2006). Neuroimaging research with suicidal persons has shown that structural, functional, molecular and metabolic anomalies in frontal and prefrontal regions can be associated with depression and anxiety (Cox Lippard et al., 2014; van Heeringen et al., 2017; Schmaal et al., 2020), suggesting that frontal and/or prefrontal hypoactivation (i.e. greater alpha activity) in this population could underpin the reduced ability of these regions to play their modulatory role in emotion regulation (Engel et al., 2009).
Our results might also suggest a trend for a correlation between delta, theta and beta and self-disgust, an affective state that reflects disgust directed towards the self (Overton et al., 2008) and that may increase the risk for suicide (Mason et al., 2022). Importantly, recent fMRI and EEG research has found that the amplitude of low-frequency fluctuation is positively correlated with resting state activity in the right superior frontal cortex (Li et al., 2021), which is an inhibition-related brain region. Also, other findings indicate that the duration, occurrence rate, and contribution of at least some components of these low frequency oscillations are related to the anterior DMN and might reflect the subjective representation of one's own body by combining interoceptive information with affective salience (Li et al., 2021). In this context, greater beta power in a frontal region might reflect an increase in cognitive effort related to the attempt to cope against the psychological distress associated with self-disgust or with negative emotions more in general (Li et al., 2017). The correlations we found, however, need to be confirmed in future studies with a greater participant sample, and by correlation tests carried out separately for patients or healthy controls.
Interestingly, previous research (Roh et al., 2016) has shown that symptom severity as measured by BDI can positively correlate with inattention in patients with depression and that anxiety can play a key role in the process. In the same study, fronto-central beta and gamma power negatively correlated with inattention, and our finding might suggest that frontal alpha power could also be involved. However, we could not establish a direct link between any of the EEG measures considered and either anxiety or depression scores. Keeping into account the subjective nature of self-administered questionnaires assessing emotions (Hooley and Parker, 2006, Balon, 2007, Furukawa, 2010) and that we formally assessed depression using one questionnaire only (BDI), more research is needed to confirm these findings. Of relevance, the observer-rated Hamilton depression questionnaire (HAM-D) and the self-report BDI are among the most commonly employed rating instruments for depression, and are both considered reliable. However, BDI and HAM-D ratings are frequently discordant as while BDI scores reflect the psychological symptoms of depression, HAM-D scores are instead reflective of its somatic symptoms (Enns et al., 2000, Furukawa et al., 2019). Interestingly, other research suggests that other than depression, hopelessness may be a risk factor for suicide (Costanza et al., 2015) and that the assessment of demoralization may contribute to a more comprehensive evaluation of suicide risk, especially in patients where a clinical diagnosis of depression cannot be confirmed (Costanza et al., 2022). Hence, future research should attempt to replicate our results in such patient populations.
Source localization and independent component analysis research indicates that in persons with depression, a negative emotional valence is more likely to accompany spontaneous thoughts and that this is reflected by frequency specific changes in the activity of resting-state networks. More specifically, depressive symptoms have been shown to positively correlate with delta and theta activity in the orbitofrontal cortex and negatively with theta activity in the DMN (Knyazev et al., 2015). Since an increase of low-frequency oscillations in the orbitofrontal cortex has been demonstrated in aversive states, whereas their decrease in the DMN reflects functional disruption of this network in emotionally challenged individuals (Hayes et al., 2016; Imperatori et al., 2019), the trend for a correlation between delta or theta oscillations and self-disgust we found might be in line with the notion that depression is characterized by a general negative emotional disposition and excessive focus on the self (Nolen-Hoeksema et al., 2008). Whether this profile is associated with an increased risk for suicide in depressed patients needs to be determined in future research comparing high risk versus low risk depressed individuals. However, the possible relationship between theta activity and negative self-referencing thoughts suggested by our correlation tests might confirm previous research indicating theta activity as a possible target for interventions aimed at reducing negative self-referencing (Stevens et al., 2004).
5. Limitations
The study recruited from a naturalistic sample of clinical service attendees who were willing to co-operate and safe to undergo the procedure. Controls were not systematically matched and, given the small group size, very unlikely represented population diversity. It is also important to keep in mind that all the depressed patients recruited in the study received pharmacological treatment during the course of the study and that antidepressants are known to induce EEG changes in multiple frequency bands (Saletu et al., 1983, Bruder et al., 2008, Aiyer et al., 2016, van der Vinne et al., 2019), with effects also on AA (Harwood et al., 2001, Kious et al., 2018).
Also, a power analysis carried out on our data (Table 2), suggests that our sample size was very likely too small to detect between-group differences in PSD or AA. Accordingly, the conclusions must be tempered by the confidence in the comparability of the sample to the whole clinical spectrum. However, the subjects were all routine clinical patients attending a public mental health service and face validity of the findings is reasonable to assert pending a larger systematic study. Finally, the headset used in the present study did not offer the opportunity to record frontal EEG from the midline, which could have certainly allowed us to provide more comprehensive results. Hence, the study should be replicated using a high-density EEG recording system, which would also allow for source localization analysis.
6. Conclusions
The present study did not reveal any between-group EEG differences between depressed persons with SI and HC. While self-administered questionnaires suggested a high-risk profile, we could not support the hypothesis that frequency specific-frontal EEG anomalies are found in depressed adult persons at risk for suicide. Nevertheless, our findings suggest that a number of frontal EEG imbalances might reflect greater anxiety and negative self-referencing in persons with SI, which however should be confirmed by future research in a larger population sample.
Author contribution
Dr. Francesco Amico: study design, data acquisition, project management, wrote manuscript; Dr. Daniela De Canditiis: statistical analysis; Dr. Annalisa Pascarella: EEG data analysis; Dr. Filippo Castiglione: leadership of the data analysis group; Ms Noemi Venerelli: contribution to data analysis; Dr. Jennifer, V. Fagan & Dr. John, H. Yek: participant recruitment; Dr. Justin Brophy: principal investigator.
Funding
We would like to thank Gerry Raleigh, director the National Office for Suicide Prevention (NOSP) for providing financial support for equipment sourcing and data acquisition. Dr Filippo Castiglione acknowledges partial support of data analysis and manuscript writing from the European Commission through the “Horizon 2020 Research and Innovation Program grant ”iPC Individualized Pediatric Cure” (Grant no 826121).
CRediT authorship contribution statement
Francesco Amico: Methodology, Investigation, Data curation, Writing – original draft, Writing – review & editing, Supervision, Project administration. Daniela De Canditiis: Formal analysis, Writing – review & editing. Filippo Castiglione: Formal analysis, Funding acquisition. Annalisa Pascarella: Formal analysis, Writing – review & editing. Jennifer, V. Fagan: Investigation. John, H. Yek : Investigation. Justin Brophy: Conceptualization, Writing – review & editing, Funding acquisition.
Acknowledgements
We are grateful to the patients and staff members of Newcastle Hospital for their time.
References
- Aiyer R., Novakovic V., Barkin R.L. A systematic review on the impact of psychotropic drugs on electroencephalogram waveforms in psychiatry. Post. Med. 2016;128(7):656–664. doi: 10.1080/00325481.2016.1218261. [DOI] [PubMed] [Google Scholar]
- Allen J.J., Cohen M.X. Deconstructing the "resting" state: exploring the temporal dynamics of frontal alpha asymmetry as an endophenotype for depression. Front. Hum. Neurosci. 2010;4:232. doi: 10.3389/fnhum.2010.00232. [DOI] [PMC free article] [PubMed] [Google Scholar]
- Allen J.J., Urry H.L., Hitt S.K., Coan J.A. The stability of resting frontal electroencephalographic asymmetry in depression. Psychophysiology. 2004;41(2):269–280. doi: 10.1111/j.1469-8986.2003.00149.x. [DOI] [PubMed] [Google Scholar]
- Amico F., Healy G., Arvaneh M., Kearney D., Mohedano E., Roddy D., Yek J., Smeaton A., Brophy J. Multimodal validation of facial expression detection software for real-time monitoring of affect in patients with suicidal intent. Eur. Psychiatry. 2016;33:S596. [Google Scholar]
- Andrews-Hanna J.R. The brain's default network and its adaptive role in internal mentation. Neuroscientist. 2012;18(3):251–270. doi: 10.1177/1073858411403316. [DOI] [PMC free article] [PubMed] [Google Scholar]
- Arns M., Etkin A., Hegerl U., Williams L.M., DeBattista C., Palmer D.M., Fitzgerald P.B., Harris A., deBeuss R., Gordon E. Frontal and rostral anterior cingulate (rACC) theta EEG in depression: implications for treatment outcome? Eur. Neuropsychopharmacol. 2015;25(8):1190–1200. doi: 10.1016/j.euroneuro.2015.03.007. [DOI] [PubMed] [Google Scholar]
- Balon R. Rating scales for anxiety/anxiety disorders. Curr. Psychiatry Rep. 2007;9(4):271–277. doi: 10.1007/s11920-007-0032-8. [DOI] [PubMed] [Google Scholar]
- Beck, A.T., 1979. Cognitive therapy of depression, Guilford Press.
- Beck A.T., Epstein N., Brown G., Steer R.A. An inventory for measuring clinical anxiety: psychometric properties. J. Consult Clin. Psychol. 1988;56(6):893–897. doi: 10.1037//0022-006x.56.6.893. [DOI] [PubMed] [Google Scholar]
- Beck, A.T., Steer, R.A., Brown, G.K., 1996. Manual for the Beck depression inventory-II. Psychological Corporation, San Antonio, TX, USA.
- Bell A.J., Sejnowski T.J. An information-maximization approach to blind separation and blind deconvolution. Neural Comput. 1995;7(6):1129–1159. doi: 10.1162/neco.1995.7.6.1129. [DOI] [PubMed] [Google Scholar]
- Benschop L., Baeken C., Vanderhasselt M.A., Van de Steen F., Van Heeringen K., Arns M. Electroencephalogram resting state frequency power characteristics of suicidal behavior in female patients with major depressive disorder. J. Clin. Psychiatry. 2019;80:6. doi: 10.4088/JCP.18m12661. [DOI] [PubMed] [Google Scholar]
- Bentley K.H., Franklin J.C., Ribeiro J.D., Kleiman E.M., Fox K.R., Nock M.K. Anxiety and its disorders as risk factors for suicidal thoughts and behaviors: a meta-analytic review. Clin. Psychol. Rev. 2016;43:30–46. doi: 10.1016/j.cpr.2015.11.008. [DOI] [PMC free article] [PubMed] [Google Scholar]
- Boutani H., Ohsuga M. Applicability of the "Emotiv EEG Neuroheadset" as a user-friendly input interface. Conf. Proc. IEEE Eng. Med. Biol. Soc. 2013;2013:1346–1349. doi: 10.1109/EMBC.2013.6609758. [DOI] [PubMed] [Google Scholar]
- Britton, J.W., L.C. Frey, J.L. Hopp, P. Korb, M.Z. Koubeissi, W.E. Lievens, E.M. Pestana-Knight, E.K. St Louis, 2016. Electroencephalography (EEG): An Introductory Text and Atlas of Normal and Abnormal Findings in Adults, Children, and Infants. Electroencephalography (EEG): An Introductory Text and Atlas of Normal and Abnormal Findings in Adults, Children, and Infants. E. K. St. Louis and L. C. Frey. Chicago. [PubMed]
- Bronisch T., Hofler M., Lieb R. Smoking predicts suicidality: findings from a prospective community study. J. Affect Disord. 2008;108(1–2):135–145. doi: 10.1016/j.jad.2007.10.010. [DOI] [PubMed] [Google Scholar]
- Bruder G.E., Sedoruk J.P., Stewart J.W., McGrath P.J., Quitkin F.M., Tenke C.E. Electroencephalographic alpha measures predict therapeutic response to a selective serotonin reuptake inhibitor antidepressant: pre- and post-treatment findings. Biol. Psychiatry. 2008;63(12):1171–1177. doi: 10.1016/j.biopsych.2007.10.009. [DOI] [PMC free article] [PubMed] [Google Scholar]
- Buzsáki, G., 2006. Rhythms of the Brain, Oxford Scholarship Online.
- Cao J., Chen X., Chen J., Ai M., Gan Y., He J., Kuang L. The Association Between Resting State Functional Connectivity and the Trait of Impulsivity and Suicidal Ideation in Young Depressed Patients With Suicide Attempts. Front Psychiatry. 2021;12 doi: 10.3389/fpsyt.2021.567976. [DOI] [PMC free article] [PubMed] [Google Scholar]
- Conwell Y., Duberstein P.R., Cox C., Herrmann J.H., Forbes N.T., Caine E.D. Relationships of age and axis I diagnoses in victims of completed suicide: a psychological autopsy study. Am. J. Psychiatry. 1996;153(8):1001–1008. doi: 10.1176/ajp.153.8.1001. [DOI] [PubMed] [Google Scholar]
- Costanza A., Baertschi M., Weber K., Canuto A. Neurological diseases and suicide: from neurobiology to hopelessness. Rev. Med. Suisse. 2015;11(461):402–405. [PubMed] [Google Scholar]
- Costanza A., Vasileios C., Ambrosetti J., Shah S., Amerio A., Aguglia A., Serafini G., Piguet V., Luthy C., Cedraschi C., Bondolfi G., Berardelli I. Demoralization in suicide: a systematic review. J. Psychosom. Res. 2022;157 doi: 10.1016/j.jpsychores.2022.110788. [DOI] [PubMed] [Google Scholar]
- Cox Lippard E.T., Johnston J.A., Blumberg H.P. Neurobiological risk factors for suicide: insights from brain imaging. Am. J. Prev. Med. 2014;47(3 Suppl 2):S152–S162. doi: 10.1016/j.amepre.2014.06.009. [DOI] [PMC free article] [PubMed] [Google Scholar]
- Cuzzocreo J.L., Yassa M.A., Verduzco G., Honeycutt N.A., Scott D.J., Bassett S.S. Effect of handedness on fMRI activation in the medial temporal lobe during an auditory verbal memory task. Hum. Brain Mapp. 2009;30(4):1271–1278. doi: 10.1002/hbm.20596. [DOI] [PMC free article] [PubMed] [Google Scholar]
- Davidson R.J. Anterior cerebral asymmetry and the nature of emotion. Brain Cogn. 1992;20(1):125–151. doi: 10.1016/0278-2626(92)90065-t. [DOI] [PubMed] [Google Scholar]
- Davidson R.J., Pizzagalli D., Nitschke J.B., Putnam K. Depression: perspectives from affective neuroscience. Annu Rev. Psychol. 2002;53:545–574. doi: 10.1146/annurev.psych.53.100901.135148. [DOI] [PubMed] [Google Scholar]
- Debener S., Beauducel A., Nessler D., Brocke B., Heilemann H., Kayser J. Is resting anterior EEG alpha asymmetry a trait marker for depression? Findings for healthy adults and clinically depressed patients. Neuropsychobiology. 2000;41(1):31–37. doi: 10.1159/000026630. [DOI] [PubMed] [Google Scholar]
- Delorme A., Makeig S. EEGLAB: an open source toolbox for analysis of single-trial EEG dynamics including independent component analysis. J. Neurosci. Methods. 2004;134(1):9–21. doi: 10.1016/j.jneumeth.2003.10.009. [DOI] [PubMed] [Google Scholar]
- Dolsen M.R., Cheng P., Arnedt J.T., Swanson L., Casement M.D., Kim H.S., Goldschmied J.R., Hoffmann R.F., Armitage R., Deldin P.J. Neurophysiological correlates of suicidal ideation in major depressive disorder: hyperarousal during sleep. J. Affect Disord. 2017;212:160–166. doi: 10.1016/j.jad.2017.01.025. [DOI] [PMC free article] [PubMed] [Google Scholar]
- Duan M., Wang L., Liu X., Su F., An L., Liu S. Abnormal brain activity in fronto-central regions in mental disorders with suicide: an EEG Study. Annu Int Conf. IEEE Eng. Med Biol. Soc. 2021;2021:1035–1038. doi: 10.1109/EMBC46164.2021.9629876. [DOI] [PubMed] [Google Scholar]
- Engel K., Bandelow B., Gruber O., Wedekind D. Neuroimaging in anxiety disorders. J. Neural Transm. (Vienna) 2009;116(6):703–716. doi: 10.1007/s00702-008-0077-9. [DOI] [PMC free article] [PubMed] [Google Scholar]
- Enns M.W., Larsen D.K., Cox B.J. Discrepancies between self and observer ratings of depression. The relationship to demographic, clinical and personality variables. J. Affect Disord. 2000;60(1):33–41. doi: 10.1016/s0165-0327(99)00156-1. [DOI] [PubMed] [Google Scholar]
- Furukawa T.A. Assessment of mood: guides for clinicians. J. Psychosom. Res. 2010;68(6):581–589. doi: 10.1016/j.jpsychores.2009.05.003. [DOI] [PubMed] [Google Scholar]
- Furukawa T.A., Reijnders M., Kishimoto S., Sakata M., DeRubeis R.J., Dimidjian S., Dozois D.J.A., Hegerl U., Hollon S.D., Jarrett R.B., Lesperance F., Segal Z.V., Mohr D.C., Simons A.D., Quilty L.C., Reynolds C.F., Gentili C., Leucht S., Engel R.R., Cuijpers P. Translating the BDI and BDI-II into the HAMD and vice versa with equipercentile linking. Epidemiol. Psychiatr. Sci. 2019;29 doi: 10.1017/S2045796019000088. [DOI] [PMC free article] [PubMed] [Google Scholar]
- Han B., Compton W.M., Blanco C. Tobacco use and 12-month suicidality among adults in the United States. Nicotine Tob. Res. 2017;19(1):39–48. doi: 10.1093/ntr/ntw136. [DOI] [PMC free article] [PubMed] [Google Scholar]
- Harwood D., Hawton K., Hope T., Jacoby R. Psychiatric disorder and personality factors associated with suicide in older people: a descriptive and case-control study. Int J. Geriatr. Psychiatry. 2001;16(2):155–165. doi: 10.1002/1099-1166(200102)16:2<155::aid-gps289>3.0.co;2-0. [DOI] [PubMed] [Google Scholar]
- Hayes, D.J., Northoff, G., Greenshaw, A.J., 2016. Reward- and aversion-related processing in the brain: translational evidence for separate and shared circuits, Frontiers in systems neuroscience. [DOI] [PMC free article] [PubMed]
- Henriksson M.M., Aro H.M., Marttunen M.J., Heikkinen M.E., Isometsa E.T., Kuoppasalmi K.I., Lonnqvist J.K. Mental disorders and comorbidity in suicide. Am. J. Psychiatry. 1993;150(6):935–940. doi: 10.1176/ajp.150.6.935. [DOI] [PubMed] [Google Scholar]
- Hooley J.M., Parker H.A. Measuring expressed emotion: an evaluation of the shortcuts. J. Fam. Psychol. 2006;20(3):386–396. doi: 10.1037/0893-3200.20.3.386. [DOI] [PubMed] [Google Scholar]
- Imperatori C., Farina B., Adenzato M., Valenti E.M., Murgia C., Marca G.D., Brunetti R., Fontana E., Ardito R.B. Default mode network alterations in individuals with high-trait-anxiety: an EEG functional connectivity study. J. Affect Disord. 2019;246:611–618. doi: 10.1016/j.jad.2018.12.071. [DOI] [PubMed] [Google Scholar]
- Kious B.M., Kondo D.G., Renshaw P.F. Living high and feeling low: altitude, suicide, and depression. Harv. Rev. Psychiatry. 2018;26(2):43–56. doi: 10.1097/HRP.0000000000000158. [DOI] [PubMed] [Google Scholar]
- Kleiman, E.M., J.H. Riskind, J.P. Stange, J.L. Hamilton and L. B. J. B. t. Alloy, 2014. Cognitive and interpersonal vulnerability to suicidal ideation: A weakest link approach. 45(6), pp. 778–790. [DOI] [PMC free article] [PubMed]
- Knyazev G.G., Savostyanov A.N., Bocharov A.V., Saprygin A.E., Tamozhnikov S.S. Vulnerability to depression and oscillatory resting-state networks. Zh. Vyss. Nerv. Deiat Im. I P Pavlov. 2015;65(3):344–351. [PubMed] [Google Scholar]
- Kołodziej A., Magnuski M., Ruban A., Brzezicka A. No relationship between frontal alpha asymmetry and depressive disorders in a multiverse analysis of five studies. Elife. 2021:10. doi: 10.7554/eLife.60595. [DOI] [PMC free article] [PubMed] [Google Scholar]
- Lee S.M., Jang K.I., Chae J.H. Electroencephalographic correlates of suicidal ideation in the theta band. Clin. EEG Neurosci. 2017;48(5):316–321. doi: 10.1177/1550059417692083. [DOI] [PubMed] [Google Scholar]
- Li Y., Kang C., Wei Z., Qu X., Liu T., Zhou Y., Hu Y. Beta oscillations in major depression - signalling a new cortical circuit for central executive function. Sci. Rep. 2017;7(1):18021. doi: 10.1038/s41598-017-18306-w. [DOI] [PMC free article] [PubMed] [Google Scholar]
- Li Z., Li Y., Li X., Zou F., Wang Y., Wu X., Luo Y., Zhang M. The spontaneous brain activity of disgust: Perspective from resting state fMRI and resting state EEG. Behav. Brain Res. 2021;403 doi: 10.1016/j.bbr.2021.113135. [DOI] [PubMed] [Google Scholar]
- Linehan M.M., Goodstein J.L., Nielsen S.L., Chiles J.A. Reasons for staying alive when you are thinking of killing yourself: the reasons for living inventory. J. Consult Clin. Psychol. 1983;51(2):276–286. doi: 10.1037//0022-006x.51.2.276. [DOI] [PubMed] [Google Scholar]
- Lopez A.D., Mathers C.D., Ezzati M., Jamison D.T., Murray C.J. Global and regional burden of disease and risk factors, 2001: systematic analysis of population health data. Lancet. 2006;367(9524):1747–1757. doi: 10.1016/S0140-6736(06)68770-9. [DOI] [PubMed] [Google Scholar]
- Lyle K.B., Chapman L.K., Hatton J.M. Is handedness related to anxiety? New answers to an old question. Laterality. 2013;18(5):520–535. doi: 10.1080/1357650X.2012.720259. [DOI] [PubMed] [Google Scholar]
- Mason D., James D., Andrew L., Fox J.R.E. The last thing you feel is the self-disgust'. The role of self-directed disgust in men who have attempted suicide: a grounded theory study. Psychol. Psychother. 2022;95(2):575–599. doi: 10.1111/papt.12389. [DOI] [PMC free article] [PubMed] [Google Scholar]
- Meerwijk E.L., Ford J.M., Weiss S.J. Resting-state EEG delta power is associated with psychological pain in adults with a history of depression. Biol. Psychol. 2015;105:106–114. doi: 10.1016/j.biopsycho.2015.01.003. [DOI] [PMC free article] [PubMed] [Google Scholar]
- Meerwijk E.L., Weiss S.J. Does suicidal desire moderate the association between frontal delta power and psychological pain? PeerJ. 2016;4 doi: 10.7717/peerj.1538. [DOI] [PMC free article] [PubMed] [Google Scholar]
- Nolen-Hoeksema S., Wisco B.E., Lyubomirsky S. Rethinking rumination. Perspect. Psychol. Sci. 2008;3(5):400–424. doi: 10.1111/j.1745-6924.2008.00088.x. [DOI] [PubMed] [Google Scholar]
- Olatunji B.O., Williams N.L., Tolin D.F., Abramowitz J.S., Sawchuk C.N., Lohr J.M., Elwood L.S. The Disgust Scale: item analysis, factor structure, and suggestions for refinement. Psychol. Assess. 2007;19(3):281–297. doi: 10.1037/1040-3590.19.3.281. [DOI] [PubMed] [Google Scholar]
- Oldfield R.C. The assessment and analysis of handedness: the Edinburgh inventory. Neuropsychologia. 1971;9(1):97–113. doi: 10.1016/0028-3932(71)90067-4. [DOI] [PubMed] [Google Scholar]
- Overton P.G., Markland F.E., Taggart H.S., Bagshaw G.L., Simpson J. Self-disgust mediates the relationship between dysfunctional cognitions and depressive symptomatology. Emotion. 2008;8(3):379–385. doi: 10.1037/1528-3542.8.3.379. [DOI] [PubMed] [Google Scholar]
- Pizzagalli D.A., Nitschke J.B., Oakes T.R., Hendrick A.M., Horras K.A., Larson C.L., Abercrombie H.C., Schaefer S.M., Koger J.V., Benca R.M., Pascual-Marqui R.D., Davidson R.J. Brain electrical tomography in depression: the importance of symptom severity, anxiety, and melancholic features. Biol. Psychiatry. 2002;52(2):73–85. doi: 10.1016/s0006-3223(02)01313-6. [DOI] [PubMed] [Google Scholar]
- Prichep L.S., John E.R. QEEG profiles of psychiatric disorders. Brain Topogr. 1992;4(4):249–257. doi: 10.1007/BF01135562. [DOI] [PubMed] [Google Scholar]
- Propper R.E., Brunye T.T., Christman S.D., Bologna J. Negative emotional valence is associated with non-right-handedness and increased imbalance of hemispheric activation as measured by tympanic membrane temperature. J. Nerv. Ment. Dis. 2010;198(9):691–694. doi: 10.1097/NMD.0b013e3181ef1f35. [DOI] [PubMed] [Google Scholar]
- Putman P., Verkuil B., Arias-Garcia E., Pantazi I., van Schie C. EEG theta/beta ratio as a potential biomarker for attentional control and resilience against deleterious effects of stress on attention. Cogn. Affect Behav. Neurosci. 2014;14(2):782–791. doi: 10.3758/s13415-013-0238-7. [DOI] [PubMed] [Google Scholar]
- Reid S.A., Duke L.M., Allen J.J. Resting frontal electroencephalographic asymmetry in depression: inconsistencies suggest the need to identify mediating factors. Psychophysiology. 1998;35(4):389–404. [PubMed] [Google Scholar]
- Rich C.L., Young D., Fowler R.C. San Diego suicide study. I. Young vs old subjects. Arch. Gen. Psychiatry. 1986;43(6):577–582. doi: 10.1001/archpsyc.1986.01800060071009. [DOI] [PubMed] [Google Scholar]
- Rodriguez A., Rey B., Alcaniz M. Validation of a low-cost EEG device for mood induction studies. Stud. Health Technol. Inf. 2013;191:43–47. [PubMed] [Google Scholar]
- Roh S.C., Kim J.S., Kim S., Kim Y., Lee S.H. Frontal alpha asymmetry moderated by suicidal ideation in patients with major depressive disorder: a comparison with healthy individuals. Clin. Psychopharmacol. Neurosci. 2020;18(1):58–66. doi: 10.9758/cpn.2020.18.1.58. [DOI] [PMC free article] [PubMed] [Google Scholar]
- Roh S.C., Park E.J., Shim M., Lee S.H. EEG beta and low gamma power correlates with inattention in patients with major depressive disorder. J. Affect Disord. 2016;204:124–130. doi: 10.1016/j.jad.2016.06.033. [DOI] [PubMed] [Google Scholar]
- Saletu B., Grunberger J., Rajna P. Pharmaco-EEG profiles of antidepressants. Pharmacodynamic studies with fluvoxamine. Br. J. Clin. Pharmacol. 1983;15(Suppl 3):369S–383S. doi: 10.1111/j.1365-2125.1983.tb02128.x. [DOI] [PMC free article] [PubMed] [Google Scholar]
- Schmaal L., van Harmelen A.L., Chatzi V., Lippard E.T.C., Toenders Y.J., Averill L.A., Mazure C.M., Blumberg H.P. Imaging suicidal thoughts and behaviors: a comprehensive review of 2 decades of neuroimaging studies. Mol. Psychiatry. 2020;25(2):408–427. doi: 10.1038/s41380-019-0587-x. [DOI] [PMC free article] [PubMed] [Google Scholar]
- Schuckit M.A. Alcohol-use disorders. Lancet. 2009;373(9662):492–501. doi: 10.1016/S0140-6736(09)60009-X. [DOI] [PubMed] [Google Scholar]
- Singer W., Gray C.M. Visual feature integration and the temporal correlation hypothesis. Annu. Rev. Neurosci. 1995;18:555–586. doi: 10.1146/annurev.ne.18.030195.003011. [DOI] [PubMed] [Google Scholar]
- Stange J.P., Hamilton J.L., Burke T.A., Kleiman E.M., O’Garro-Moore J.K., Seligman N.D., Abramson L.Y., Alloy L.B.J.P.R. Negative cognitive styles synergistically predict suicidal ideation in bipolar spectrum disorders: a 3-year prospective study. Psychiatry Res. 2015;226(1):162–168. doi: 10.1016/j.psychres.2014.12.042. [DOI] [PMC free article] [PubMed] [Google Scholar]
- Stevens L., Brady B., Goon A., Adams D., Rebarchik J., Gacula L., Johnson J., Wright C., Hank N., McManus P., Arsuffi L., Morris L., Verdugo S. Electrophysiological alterations during hypnosis for ego-enhancement: a preliminary investigation. Am. J. Clin. Hypn. 2004;46(4):323–344. doi: 10.1080/00029157.2004.10403616. [DOI] [PubMed] [Google Scholar]
- Stewart J.L., Coan J.A., Towers D.N., Allen J.J. Frontal EEG asymmetry during emotional challenge differentiates individuals with and without lifetime major depressive disorder. J. Affect Disord. 2011;129(1–3):167–174. doi: 10.1016/j.jad.2010.08.029. [DOI] [PMC free article] [PubMed] [Google Scholar]
- Swann A.C., Lijffijt M., O'Brien B., Mathew S.J. Impulsivity and suicidal behavior. Curr. Top. Behav. Neurosci. 2020;47:179–195. doi: 10.1007/7854_2020_144. [DOI] [PubMed] [Google Scholar]
- Thibodeau R., Jorgensen R.S., Kim S. Depression, anxiety, and resting frontal EEG asymmetry: a meta-analytic review. J. Abnorm Psychol. 2006;115(4):715–729. doi: 10.1037/0021-843X.115.4.715. [DOI] [PubMed] [Google Scholar]
- Thompson C., Ong E.L.C. The association between suicidal behavior, attentional control, and frontal asymmetry. Front Psychiatry. 2018;9:79. doi: 10.3389/fpsyt.2018.00079. [DOI] [PMC free article] [PubMed] [Google Scholar]
- Troister T., Davis M.P., Lowndes A., Holden R.R. A five-month longitudinal study of psychache and suicide ideation: replication in general and high-risk university students. Suicide Life Threat Behav. 2013;43(6):611–620. doi: 10.1111/sltb.12043. [DOI] [PubMed] [Google Scholar]
- van der Vinne N., Vollebregt M.A., Boutros N.N., Fallahpour K., van Putten M., Arns M. Normalization of EEG in depression after antidepressant treatment with sertraline? A preliminary report. J. Affect Disord. 2019;259:67–72. doi: 10.1016/j.jad.2019.08.016. [DOI] [PubMed] [Google Scholar]
- van der Vinne N., Vollebregt M.A., van Putten M., Arns M. Frontal alpha asymmetry as a diagnostic marker in depression: fact or fiction? A meta-analysis. Neuroimage Clin. 2017;16:79–87. doi: 10.1016/j.nicl.2017.07.006. [DOI] [PMC free article] [PubMed] [Google Scholar]
- van Heeringen K., Wu G.R., Vervaet M., Vanderhasselt M.A., Baeken C. Decreased resting state metabolic activity in frontopolar and parietal brain regions is associated with suicide plans in depressed individuals. J. Psychiatr. Res. 2017;84:243–248. doi: 10.1016/j.jpsychires.2016.10.011. [DOI] [PubMed] [Google Scholar]
- von Knorring L., et al. Intercorrelations between different computer-based measures of the EEG alpha amplitude and its variability over time and their validity in differentiating healthy volunteers from depressed patients. Adv. Biol. Psychiatry. 1983;13:172–181. [Google Scholar]
- Welch, P., 1967. "The use of fast Fourier transform for the estimation of power spectra: A method based on time averaging over short, modified periodograms." 15(2).
- Whiteford H.A., Ferrari A.J., Degenhardt L., Feigin V., Vos T. The global burden of mental, neurological and substance use disorders: an analysis from the Global Burden of Disease Study 2010. PLoS One. 2015;10(2) doi: 10.1371/journal.pone.0116820. [DOI] [PMC free article] [PubMed] [Google Scholar]
- WHO, 2016. "International Statistical Classification of Diseases and Related Health Problems 10th Revision." from https://icd.who.int/browse10/2016/en.
- Williams N.S., McArthur G.M., de Wit B., Ibrahim G., Badcock N.A. A validation of Emotiv EPOC Flex saline for EEG and ERP research. PeerJ. 2020;8 doi: 10.7717/peerj.9713. [DOI] [PMC free article] [PubMed] [Google Scholar]