Abstract
Background
This study aimed to investigate the association of superficial cerebral veins (SCVs) with sex-related cognitive differences and the possible hemodynamic mechanisms underlying these associations.
Methods
This investigation was a prospective case-control study. A total of 344 healthy volunteers were recruited. In all, 200 volunteers were included to establish the deep learning model, and 144 volunteers were used for the research, including 72 males (50%) and 72 females (50%). No significant differences in age (P=0.358) or education (P=0.779) were observed between the sexes. Cognitive functioning was evaluated using neuropsychological tests, including the Mini-Mental State Examination (MMSE) and the Montreal Cognitive Assessment-Basic (MOCA-B). Susceptibility-weighted imaging scans were acquired with a 3.0 T magnetic resonance imaging system using a 32-channel high-resolution phased array coil. Minimum intensity projection images were obtained by reconstructing susceptibility-weighted imaging data. A deep learning model was trained on the minimum intensity projection images to quantify the diameter, tortuosity index, length, and the number of SCVs in the bilateral cerebral hemispheres. Finally, the association between cognitive differences between males and females and the properties of the SCVs was analyzed.
Results
The MMSE and MOCA-B scores of males were significantly higher than those of females (P<0.05). Males had more SCVs in the bilateral cerebral hemispheres than did females (right hemisphere: P<0.01; left hemisphere: P<0.05). The number of SCVs in the right cerebral hemisphere was significantly and positively correlated with the MMSE and MOCA-B scores (correlation coefficients: 0.246 and 0.201, respectively; P<0.05). The number of SCVs in the left cerebral hemisphere was positively correlated with the MMSE scores (correlation coefficient: 0.196; P<0.05) and the MOCA-B scores. In this study, no significant correlations were observed between cognition and the diameter, length, or tortuosity index of the SCVs in the bilateral cerebral hemispheres.
Conclusions
The cognitive function of males was better than that of females, and the different numbers of SCVs may be one of the explanations for this phenomenon of sex-based differences in cognition.
Keywords: Cerebral veins, cognition, sex, susceptibility-weighted imaging, deep learning
Introduction
Both the prevalence of certain diseases and their manifestations and treatment efficacy may differ depending on the sex of the patient. Thus, the identification of populations with particular individual characteristics is important to improve clinical prevention and treatment effects (1-3). It is well-established that the performance of cognition is related to many factors, which can be divided into social and biological factors. As many studies have pointed to the differences in cognition between sexes, the relevant pathophysiological mechanisms underlying sex-related differences in thinking and cognitive performance have generated considerable research interest and attention, particularly the differences in brain anatomy between the sexes. Sex differences of the brain have been observed in both humans and mice. For example, the brain volumes of healthy males are significantly larger than those of females (4-7). Moreover, differences in the shape and functions of the cortex are known contributors to the cognitive differences between sexes. Many researchers believe that sex differences in cognition are determined by biological factors, such as genetic and hormonal factors that affect brain anatomy, function, or both (7,8). The difference in hemodynamics is also presumed to be a reason for the difference in the brain volume, which may be the potential reason why cognitive performance differs between sexes (9). However, the mechanism underlying the correlation between hemodynamics and cognition requires further exploration.
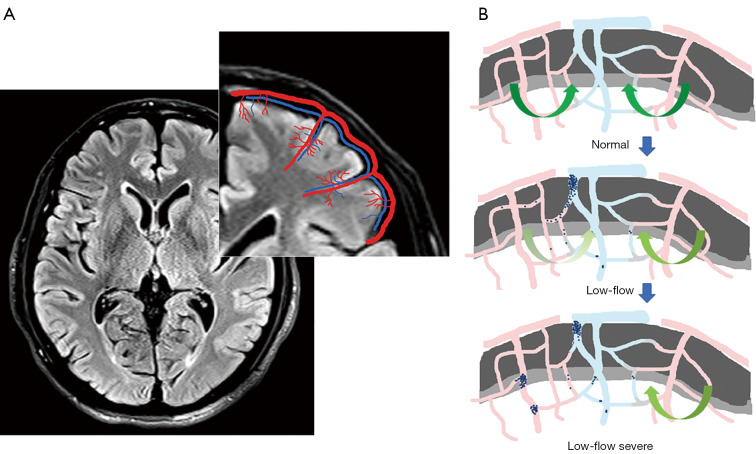
Previous tissue anatomy studies have reported that typical penetrating venules appear to drain the blood supplied by 4 to 5 penetrating arterioles (10,11). A schematic representation of the vascular anatomical structure of the veins and arteries in the cortex is shown in Figure 1A. Due to these anatomical features of the cortical vasculature, stenosis, or occlusion of one penetrating venule can evidently increase resistance in multiple upstream arterioles. The mechanism underlying the hemodynamic changes due to this venous structure is shown in Figure 1B. Given the aforementioned information, we hypothesized that, because of the characteristics of the human cortical angioarchitecture, the penetrating venules located at the center of the perfusion domain may be a point of vulnerability in patients with cerebrovascular disease. Thus, an exploration of the potential relationship between cerebral veins and cerebrovascular-related diseases and the related mechanism may be valuable. It is well-known that susceptibility-weighted imaging (SWI) is the primary method for noninvasively investigating the cerebral veins in vivo. The SWI sequence uses full velocity-compensated high-resolution 3-dimensional (3D) gradient echo sequences, in which the difference in magnetic susceptibility between tissues is used to enhance the image contrast. Based on this imaging principle, SWI has been used to visualize hemosiderin, deoxyhaemoglobin, and other substances. Therefore, SWI is useful for observing the intracranial venous system. Moreover, it has gradually become a powerful and useful tool to delineate venous structures in the brain and to study diverse pathological conditions (12-15).
Figure 1.
Schematic representation of the vascular anatomical structure of the veins and arteries in the cortex and the mechanism of hemodynamic changes due to the venous structure under pathological conditions. (A) Cerebral vascular structure of veins in the cortex. The red lines represent the penetrating arterioles in the cortex, and the blue lines represent the penetrating venules, each of which has to drain blood supplied by 4 to 5 penetrating arterioles. (B) The dynamic process of blood flow stasis in the upstream supplying arteries due to the changes in the state of venous blood flow. The green arrows represent the ability to circulate blood. Gradually lighter coloring indicates the decreased blood flow. The blood flow status is normal at first, but drainage is hindered when the veins undergo pathological damage, resulting in slow blood flow in the upstream arteries and possible occlusion. Arterial stasis further aggravates venous drainage obstruction.
In recent studies, SWI has been used to assess the correlation between cerebral veins, especially deep medullary veins (DMVs), and diseases, including cerebral small-vessel disease, leukoaraiosis, and white-matter hyperintensity (WMH), which may lead to cognitive decline (16-19). The difference in the veins visualized on an SWI scan may be used to evaluate and diagnose various diseases. For instance, because the intravenous deoxyhaemoglobin level is increased in regions of decreased perfusion, venous visualization is increased on SWI scans in patients with acute cerebral infarction compared with that in healthy controls (20). SWI has also been used to assess diffusion–perfusion mismatch (21). Researchers (22) reported transient prominence of the venous vasculature on SWI scans detected in patients with migraine aura. Other researchers (23) also noted that the epileptic foci in patients with acute-stage pediatric encephalopathy are consistent with the venous area highlighted on SWI scans. However, many previous studies examining cognition have focused on DMVs. Based on the anatomical characteristics of the veins and arteries in the cortex, the important role of the cortex in the cognitive function and the sex-based differences in cognitive performance, we posited that the morphological characteristics of the superficial cerebral veins (SCVs) potentially reflect the hemodynamic features of the cortex and may be correlated with cognitive differences between the sexes. At present, there are few studies available on SCVs, and there is still no effective and recognized SCV assessment method. Most researchers adopt the subjective visual assessment method, which is based on their own experience in SCVs. Usually, a visual qualitative evaluation system is used to assess the changes of SCVs’ visibility in patients with epilepsy, acute cerebral infarction, and migraine (23-26). This method is subjective and not very reliable and is mainly used for an approximate estimation of the changes of SCVs during clinical disease progression. In addition, since SCVs are widely distributed in the human brain, quantifying SCVs usually requires a lot of time when large sample sizes are involved. To overcome these issues, we independently established a deep learning model to quantify the morphological characteristics of SCVs based on minimum intensity projection (MinIP) images. Then, we used this model to explore the study data using the improved model. We further investigated the potential hemodynamic mechanisms underlying the differences in sex-based cognitive performance based on the characteristics of the SCVs. We present the following article in accordance with the STROBE reporting checklist (available at https://qims.amegroups.com/article/view/10.21037/qims-22-87/rc).
Methods
Participants
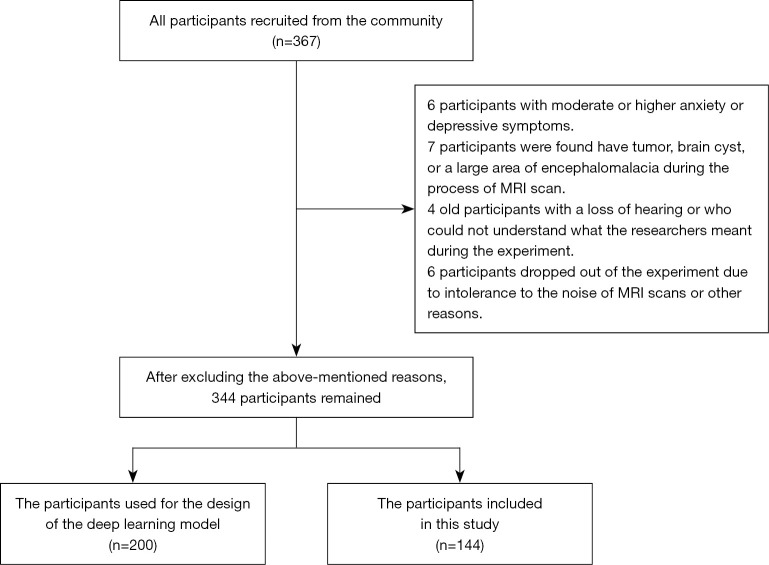
This prospective, case-control study was approved by the Ethics Committee of Guangzhou First People’s Hospital (No. K-2019-166-01) and was conducted after the volunteers’ written informed consent was obtained and in accordance with the Declaration of Helsinki (as revised in 2013). We recruited volunteers from the community between August 2018 and December 2021. A total of 344 volunteers were recruited. In all, 200 volunteers were used for establishing the deep learning model, and 144 volunteers were included in the research including 72 males (mean age 58.96±6.37 years) and 72 females (mean age 60.32±7.41 years). All enrolled volunteers in this study (I) were right-handed Chinese-speaking individuals of Chinese ethnicity; (II) had completed more than 7 years of education; (III) exhibited no obvious abnormalities in vision and hearing and had a sound mental state; (IV) had no history of brain tumors or craniocerebral surgery; (V) had no conditions known to influence cerebral function, such as alcoholism, current depression, Parkinson disease, epilepsy, severely damaged liver and kidney function, or abnormal thyroid function; and (VI) had no contraindications to magnetic resonance imaging (MRI). During the experiment, some people were found to (I) have moderate or more severe depression during the Hamilton Anxiety Scale (HAMA) evaluation [the methods for assessing mental state used in this study were the HAMA and Hamilton Depression Scale (HAMD)], which affects the accuracy of the cognitive function evaluation; (II) were unable to cooperate with the performance of an MRI scan and cognitive function tests; and (III) had intracranial lesions underlying an unknown condition. Thus, 23 participants with the aforementioned problems were excluded from this study. Finally, 344 participants, including 200 persons for establishing the model and 144 for the experiments, were included (Figure 2). The cognitive function tests were conducted by 3 trained independent researchers using the Mini-Mental State Examination (MMSE) and the Montreal Cognitive Assessment-Basic (MOCA-B).
Figure 2.
Participants included at different stages of this study and reasons for exclusion. MRI, magnetic resonance imaging.
MRI data acquisition
All volunteers were scanned with a Siemens Skyra 3.0 T MRI scanner (Siemens Healthineers, Erlangen, Germany) using a 32-channel high-resolution phased array coil in the Nansha Imaging Center of Guangzhou First People’s Hospital. None of the participants were taking any medication that might have influenced cognition during the scans at the time of the study. The volunteers laid in a supine position with their heads fixed snugly with foam pads to minimize head motion. MRI sequences included 3D T1-weighted imaging and 3D SWI. An axial orientation parallel to the anterior commissure to the posterior commissure (AC-PC) line in all sequences covered the entire brain. T1-weighted imaging was performed under the following parameters: repetition time (TR) =2,530 ms, echo time (TE) =2.96 ms, slice thickness =1.0 mm, flip angle =7°, field of view =256×256 mm2, and acquisition matrix =352×352. SWI was performed with the following parameters: TR =28 ms, TE =20 ms, slice thickness =1.0 mm, flip angle =15°, field of view (FOV) =220×193.8 mm2, and acquisition matrix =352×352.
MRI data processing
Data set collection
Since the SCVs are tortuous and branched, we used volume imaging to reconstruct the original SWI data. Through a pre-experimental comparison and analysis of various reconstruction layer thicknesses, MinIP images were reconstructed with a layer thickness set at 20 mm and an interlayer distance set to 1 mm. Importantly, the MinIP images were used as the image data for model construction. Two hundred MinIP images from the healthy participants were imported into a MicroDicom Viewer (https://www.microdicom.com/). The window width (WW) and window level (WL) were fixed in the range of 20–40. The vascular structure of the SCVs in the bilateral cerebral region was observed at the level of the lateral ventricle. Three layers between the upper and lower edges of the lateral ventricle were chosen as samples for the regions of interest (ROIs) to select the area in which the SCVs was best visualized. Finally, 600 sets of images were chosen.
Preprocessing steps
The original images were stored in DICOM format; this format prohibited the neural network from directly analyzing the images, and thus they were converted to the general JPG format. The number of images obtained after conversion to JPG format was the same as the number of layers after SWI, and each image displayed the complete image information of a slice. The number of layers and the location of the SCVs were quickly located through the position information and the number of scan layers. The selected layer image was imported into Labelme software (https://github.com/wkentaro/labelme). All visible SCVs were outlined by the neuroradiologists with more than 2 years’ work experience. Because the data set in this study was small, it was expanded through data augmentation procedures. According to the ratio of 67%, some images are randomly selected from the 600 data sets. The selected images were expanded through data augmentation procedures, including translation, rotation, left-right mirroring, and random noise, which were added to the original data set to expand the number of images to 1,000. By using these image augmentation methods, the robustness of the model could be increased while preventing model overfitting. The 1,000 images were used to train the model.
SCVs refer to the cerebral veins in the area of the cerebral cortex. In the MinIP images, the SCVs are represented by the linear black part of the cerebral cortex, which is distinguished from the surrounding white brain parenchyma. Our objective in this study was to identify the SCVs and automatically quantify their morphological characteristics; notably, only the brain parenchyma needed to be analyzed. Therefore, the extraction of the brain parenchyma from the image, as the outer contour of the brain, might have affected the learning of the neural network.
Deep learning model
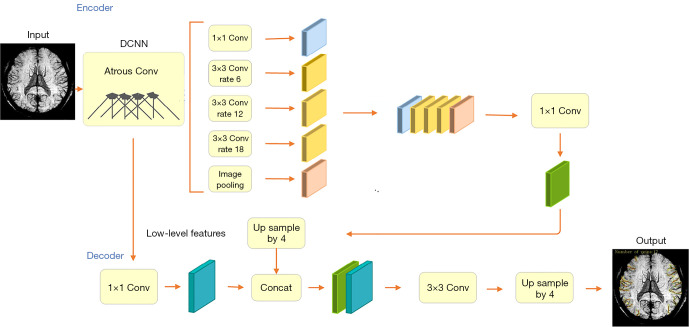
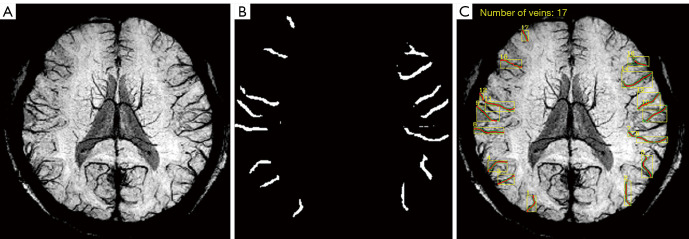
The experiment was performed on a Windows 10 system, and the central processing unit (CPU) was an Intel Core i7-8565U1.80 GHz (Santa Clara, CA, USA). PyTorch framework version 1.4 (Linux Foundation, San Francisco, CA, USA) and Python version 3.6 (Python Software Foundation, Wilmington, DE, USA) were used. The 1,000 sets of data were randomly divided into training (n=600), validation (n=200), and test sets (n=200). The amount of data used for establishing a deep learning model at each stage is summarized in Table 1. In the experiment, the DeepLabV3+ network (27) (Hasty, Berlin, Germany) was used to train the segmentation image of SCVs. The main body of this network structure decoder is a deep convolutional neural network (DCNN) with atrous convolution, and its basic network structure, Resnet, is used to extract image features. In addition, the network structure decoder also has atrous spatial pyramid pooling (ASPP), which is mainly used to introduce multiscale information and a decoding module and, in addition, to fuse low-level features with high-level features and improve the accuracy of segmentation boundaries. A gradual decrease method was adopted for the learning rate to avoid falling into a local optimum; specifically, after every 200 iterations, the learning rate was adjusted. The input image size was fixed to 512×512, and the output data were the model classification prediction results. The main parameters for training the deep learning model were the following: model depth =19, hidden layer =16, dropout =0.5 [dropout may effectively alleviate the occurrence of overfitting and achieve the effect of regularization to a certain extent (28)], batch size =64 (batch size refers to the number of data samples captured in a training session), pretrained = true, number of epochs =200 (epochs refer to the number of times all data have been traversed), and learning rate =0.01 (the learning rate controls the learning progress of the model). The neural network structure training process is shown in Figure 3. The segmentation and recognition steps for the SCV images are shown in Figure 4.
Table 1. Amount of data used at each stage of establishing the deep learning model.
| Stage | Number |
|---|---|
| Participant used for establishing the model | 200 |
| Layers of MinIP image for model | 600 |
| Image after expansion | 1,000 |
| Images for training | 600 |
| Images for validation | 200 |
| Images for test sets | 200 |
MinIP, minimum intensity projection.
Figure 3.
Framework of the neural network model for the automatic quantification of SCVs. DCNN, deep convolutional neural network; SCV, superficial cerebral vein.
Figure 4.
Segmentation and recognition steps for SCV images. (A) Original MinIP image. (B) Identified SCVs. (C) Superimposition of the identified SCVs on the MinIP map and automatic generation of the different quantified indexes of the SCVs. The red lines in (C) represent the actual length of the SCVs, the green lines represent the actual area of the SCVs, and the yellow lines represent the target area, which was automatically identified, namely, the area between the 2 ends of the SCVs. SCV, superficial cerebral vein; MinIP, minimum intensity projection.
Model application
The SWI scans of the 144 participants in this study were processed with the same reconstruction parameters to obtain MinIP images. Then, the largest layer of the brain was selected in each participant’s MinIP image and fed into the SCV morphological feature quantification model. The model then automatically identified and quantified the diameter, tortuosity index (TI), length, and number of SCVs in the bilateral cerebral hemispheres. The TI was calculated as the total tortuous length divided by the total straight length. The diameter was defined as the ratio of the area of the SCVs to the tortuous length. Finally, the diameter, TI, length, and number of all recognized SCVs in the largest bilateral cerebral hemisphere level were summed, and the means of these indexes were calculated for each participant.
Statistical analysis
Statistical analyses were conducted using SPSS software (version 25.0; IBM Corp., Armonk, NY, USA). Study participants were categorized by sex. Measurement data with a normal distribution are reported as means ± standard deviations, and the independent sample t test was used for comparisons between groups. Measurement data with a skewed distribution are presented as the median and the first and third quartile [M (Q1, Q3)], and the Mann-Whitney test was used to compare results between groups. Potential SCV-related effects on cognition were investigated by calculating the Spearman correlation coefficients, with the cognitive score and the quantified characteristics of SCVs serving as variables. A P value less than 0.05 indicated a statistically significant difference.
Results
Performance evaluation of the deep learning model
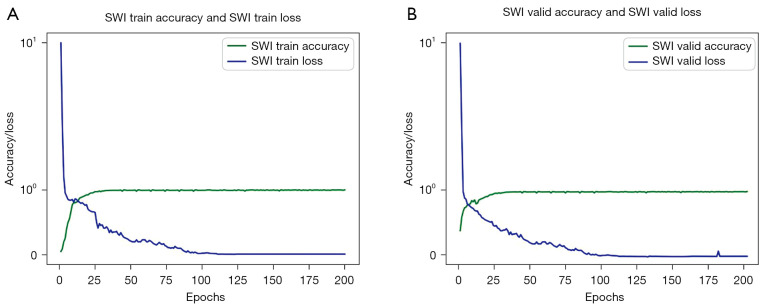
The results for the evaluation of the performance of the deep learning model in analyzing both the training and validation sets are shown in Figure 5. The accuracy is defined as the mean of the union of the intersection area ratios of the marker map and the recognition map. The epochs refer to the number of times all data have been traversed. Generally, the accuracy of the model increased consistently as the number of epochs increased. After 20 epochs, the model eventually stabilized and was highly accurate for both the training and validation sets, as shown by the blue curved line in Figure 5. Finally, the accuracy of the deep learning model reached 98.86% for the training set and 98.02% for the validation set. The loss values obtained in the process of model training and model validation are also shown in Figure 5 and are indicated by the green curve. The loss function decreased gradually as the number of epochs increased, indicating good model convergence.
Figure 5.
Accuracy and loss versus the number of epochs in the deep learning model. (A) Accuracy and loss for the training set. (B) Accuracy and loss for the validation set. The epochs refer to the number of times all data have been traversed. Generally, the accuracy increased and the loss function gradually decreased as the number of epochs increased for both the training and validation sets, indicating good model accuracy and convergence. SWI, susceptibility-weighted imaging.
Demographic and cognitive characteristics
Demographic information and cognitive performance of the volunteers in this study are shown in Table 2. A total of 144 volunteers were included in this study. The average age was 59.64 years, the numbers of males and females were 72 (50%) and 72 (50%), respectively, and the average education level was 11.49 years. No significant differences in age or education were observed between the groups. The results shown in Figure 6 indicate that in terms of cognitive performance, males scored significantly higher than females on both the MMSE and MOCA-B (P=0.016 and P=0.015, respectively).
Table 2. Demographic and cognitive characteristics of participants in this study.
| Characteristics | All participants | Males | Females | z/t | P |
|---|---|---|---|---|---|
| Demographics | |||||
| N | 144 | 72 | 72 | – | – |
| Age (years) | 59.64±6.92 | 58.96±6.37 | 60.32±7.41 | –0.918 | 0.358 |
| Education (years) | 11 [9–15] | 11 [9–15] | 11 [9–14] | 0.281 | 0.779 |
| Cognitive test | |||||
| MMSE | 27 [25–29] | 28 [26–29] | 27 [25–28] | 2.413 | 0.016 |
| MOCA-B | 23 [21–26] | 24 [22–27] | 22 [19–26] | 2.432 | 0.015 |
Values are presented as mean ± standard deviation or medians [interquartile ranges] for each variable. MMSE, Mini-Mental State Examination; MOCA-B, Montreal Cognitive Assessment-Basic.
Figure 6.
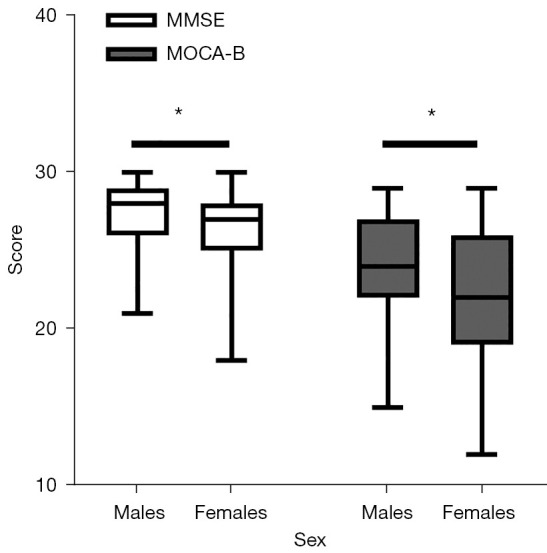
MMSE and MOCA-B scores of females and males. The lines in boxes indicate the median MMSE and MOCA-B scores for each group. The MMSE and MOCA-B scores of males were significantly higher than those of females. *P<0.05. MMSE, Mini-Mental State Examination; MOCA-B, Montreal Cognitive Assessment-Basic.
Quantitative characteristics of the SCVs in patients stratified by sex
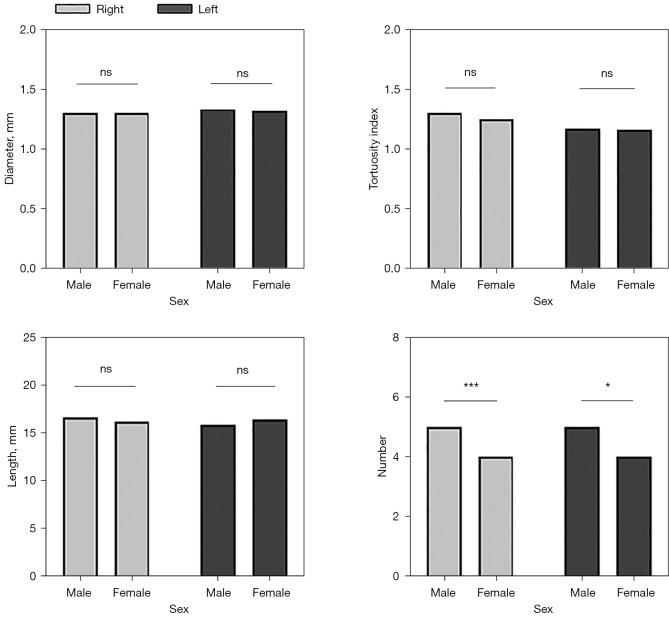
The SCVs characteristics of the study participants were quantified and are shown in Table 3. Males had significantly more SCVs in the bilateral cerebral hemispheres than did females (P<0.01 for the right cerebral hemisphere; P<0.05 for the left cerebral hemisphere). No significant differences in the diameter, length, or TI of the SCVs in the bilateral cerebral hemispheres were observed between males and females in this study (Figures 7,8).
Table 3. Quantitative characteristics of the superficial cerebral veins in patients stratified by sex.
| Characteristic | Males | Females | z | P |
|---|---|---|---|---|
| Diameter (mm) | ||||
| Right | 1.30 [1.22–1.37] | 1.30 [1.19–1.41] | −0.511 | 0.609 |
| Left | 1.32±0.15 | 1.34±0.16 | −0.672 | 0.502 |
| Tortuosity index | ||||
| Right | 1.30 [1.17–1.45] | 1.25 [1.16–1.39] | −1.099 | 0.272 |
| Left | 1.17 [1.13–1.24] | 1.16 [1.13–1.22] | −0.603 | 0.546 |
| Length (mm) | ||||
| Right | 16.58 [13.58–19.47] | 16.17 [12.49–20.52] | −0.308 | 0.758 |
| Left | 15.84 [13.42–20.00] | 16.56 [13.21–21.73] | −0.188 | 0.851 |
| Number | ||||
| Right | 5 [4–6] | 4 [2–5] | −4.388 | 0.000 |
| Left | 5 [4–6] | 4 [2–6] | −2.421 | 0.015 |
Values are presented as mean ± standard deviation or medians [interquartile ranges] for each variable. The independent samples t test was used to assess differences in diameter in the left cerebral hemisphere between males and females. Other sex-specific differences were assessed using the Mann-Whitney test; Right, right cerebral hemisphere; Left, left cerebral hemisphere.
Figure 7.
Quantitative analysis of the characteristics of the SCVs, including diameter, TI, length, and number, in males and females. *P<0.05; *** P<0.001. SCV, superficial cerebral vein; ns, no significant difference; TI, tortuosity index.
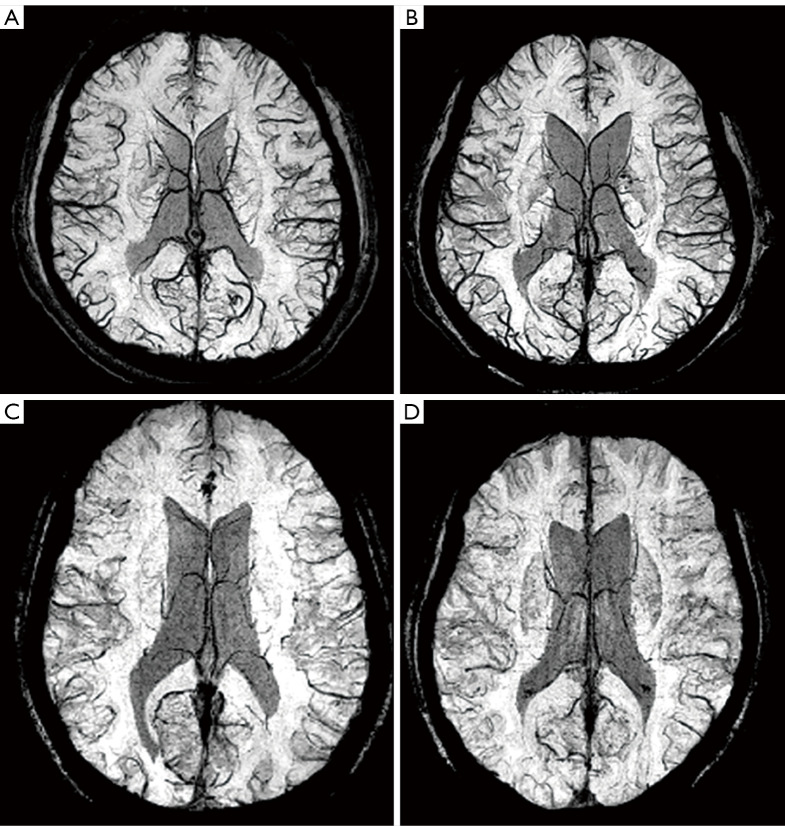
Figure 8.
Distribution of the SCVs in the bilateral cerebral hemispheres of patients stratified by sex. (A,B) Images from males. (C,D) Images from females. The number of SCVs in both hemispheres of males was significantly greater than that in females. SCV, superficial cerebral vein.
Correlations between SCV characteristics and cognition
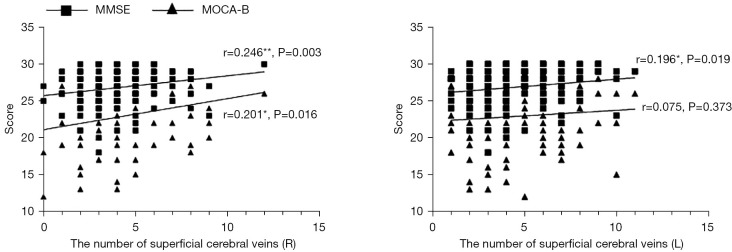
The number of SCVs in the right cerebral hemisphere was positively correlated with both the MMSE (r=0.246; P=0.003) and MOCA-B scores (r=0.201; P=0.016), while the number of SCVs in the left cerebral hemisphere was significantly and positively correlated with the MMSE score (r=0.196; P=0.019) and positively but not significantly correlated with the MOCA-B score (Figure 9). No significant correlations were observed between cognition and the diameter, length, or TI of the SCVs in the bilateral cerebral hemispheres in this study (Table 4).
Figure 9.
Correlation between cognition and the number of SCVs in the bilateral cerebral hemispheres. *P<0.05, **P<0.01. R, right cerebral hemisphere; L, left cerebral hemisphere; SCV, superficial cerebral vein.
Table 4. Spearman correlation coefficients between quantitative characteristics of the superficial cerebral veins and cognition.
| Variable | Diameter (mm) | Tortuosity index | Length (mm) | Number | |||||||
|---|---|---|---|---|---|---|---|---|---|---|---|
| Right | Left | Right | Left | Right | Left | Right | Left | ||||
| MMSE | 0.122 | 0.094 | 0.082 | −0.070 | −0.046 | −0.130 | 0.246 | 0.196 | |||
| MOCA-B | 0.107 | −0.008 | 0.052 | −0.111 | −0.002 | −0.041 | 0.201 | 0.075 | |||
MMSE, Mini-Mental State Examination; MOCA-B, Montreal Cognitive Assessment-Basic; Right, right cerebral hemisphere; Left, left cerebral hemisphere.
Discussion
In the present study, we created and successfully performed a preliminary test of an automatic SCV recognition and quantification deep learning model. According to the performance evaluated of the deep learning model, the accuracy was high and the convergence was good. Therefore, we used this model in our present study. Based on imaging results, our research validated the hypothesis that the state of SCVs’ blood flow affects cognitive performance. We also further verified that the cognitive function of males was better than that of females. Our study preliminarily assessed the relationship between SCVs and cognitive function, which has rarely been reported upon in any literature. In addition, our study may provide a potential cerebral vein biomarker for detecting cognitive decline using SWI.
Quantification of the SCVs
In previous studies, the reported scoring criteria and automatic quantification methods for evaluating the cerebral veins focused on the DMVs (16,18,29-31). Researchers have developed and evaluated a method for automatically detecting and quantifying DMVs, which is both fast and reliable (29). Some studies have noted that morphological changes in the DMVs, including a decrease in the number and an increase in the curvature, were correlated with WMHs, which are considered one of the causes of cognitive decline (18,31,32). The authors postulated that differences in venous morphology may provide a new perspective on vascular involvement in dementia. Based on our understanding of tissue anatomy, we reasoned that the SCVs would also be important. The information that can be gleaned from the SCVs may be even greater than that from the DMVs because the former are visualized in MinIP images more clearly than are the latter, thus facilitating a more accurate evaluation and imparting greater suitability for clinical application. However, the SCVs are limited to a subjective and sometimes unreliable visual evaluation based on the researcher’s experience. We adopted a deep learning method and established an image segmentation recognition model that automatically quantified the SCVs, ensuring that the morphological characteristics of the SCVs were more intuitive and objective. We evaluated the performance of this deep learning model and achieved high accuracy and good model convergence. This model is a preliminary attempt to automatically quantify the morphological features of the SCVs, which may help fill the knowledge gap regarding this structure.
Sex differences in cognition
In previous studies, researchers have noted that the incidence and symptoms of neurological and psychiatric diseases show significant sex differences. Further studies of sex differences of the brain and cognition are needed to better understand the mechanisms underlying neurological and psychiatric diseases (33,34). In the present study, the MMSE and MOCA-B scores of males were significantly higher than those of females, indicating that males have better cognition than females. This result is consistent with previous studies. Researchers have performed a meta-analysis and found that males with mild cognitive impairment (MCI) performed better than did females in all cognitive domains in a manner that could not be explained by differences in age (35). In addition, some researchers found that females with Alzheimer disease (AD) also show a greater prevalence of disease and steeper declines in memory or more severe cognitive symptoms (1). Overall, these findings indicate that cognition is both more severely and widely manifest in females than in males (36-38).
Sex differences in SCV-dependent cognition
In addition to the effects of genes and hormone levels, cerebral blood microcirculation is an important factor affecting sex-based cognitive differences. However, few studies have assessed differences in the blood drainage of the cerebral microvasculature, which may be an important factor contributing to cognitive decline (39). Compared with those of arteries, the walls of veins are thinner, the diameters are larger, and they possess less elastic tissue and muscle, indicating that the vascular compliance of veins is high and, hence, the volume of the vein might flexibly change as the pressure changes (40). Therefore, veins are highly distensible, expanding easily to accommodate large volumes of blood. This dynamic difference in the cerebral veins is clearly observed on SWI scans. Researchers found that during an aura episode, patients with migraine exhibited characteristic hypoperfusion with fewer SCVs and a reduced diameter on SWI scans, while those who underwent SWI examinations during the headache phase had hyperperfusion with more SCVs and an increased diameter (41). Thus, SWI of the SCVs may reflect the state of human brain perfusion and drainage. In addition, given the anatomical characteristics of the penetrating venules and arteries in the cortex, the former become vulnerable points during the course of cerebrovascular and neurodegenerative disease because of their core position in the large perfusion domain. In a previous study, researchers noted two potential underlying mechanisms of the different cognitive states due to the different states of the SCVs. First, the blood flow of the upstream arterioles is slow when the penetrating venule drains poorly (42,43). Second, poor venous drainage also obstructs metabolite excretion in the brain (10,44). In our study, the number of SCVs was positively correlated with cognition, and males had more SCVs than did females. Combining these findings with those from a previous study, we can infer two explanations for these results. First, males may have a greater arterial blood volume than do females, and their venous blood vessels are more dilated. Thus, the number of images displayed on MinIP in males is greater than that in females. Second, the number of congenital veins in males is large, and thus males have an anatomical advantage over females, as this difference reduces the risk of microinfarction and other vascular lesions that might affect cognitive performance as a result of venous blood stasis. Therefore, in our study, males had more SCVs than did females, and their cognitive function was better. The results of our study indicate that the different drainage statuses of the SCVs may lead to differences in cognition between males and females. The differences in the SCVs provide a new perspective on vascular involvement in cognition.
This study is a preliminary exploration of the automatic quantification of the SCVs with deep learning. We used this deep learning model to explore the connection between the SCVs and cognitive differences between the sexes. Future studies should better clarify the effect of SWI image contrast on the data and further validate this model and the study results. In addition, the SCVs should be quantitatively analyzed in the different functional areas of the brain. We will subsequently combine arterial spin labelling (ASL) and functional MRI (fMRI) to verify and evaluate the differences in cerebral blood supply and brain function between the sexes in the future. Finally, we will also explore whether SCVs can predict cognition better than can deep veins.
Conclusions
In this study, we achieved preliminary morphological feature multi-index quantification of the SCVs in the bilateral cerebral hemispheres through image segmentation on SWI results with a deep learning–based model and observed differences in the number of SCVs between the sexes. By evaluating the cognition of males and females, we also found that the difference in the number of SCVs may be potentially associated with cognitive differences between the sexes. In addition, we speculate that the number of SCVs in the human brain is potentially related to cognitive function, and the decrease of the number of SCVS may reflect cognitive decline.
Supplementary
The article’s supplementary files as
Acknowledgments
Funding: This work was supported by grants from the Guangzhou Science and Technology Plan Project (No. 201907010020) and the People’s Livelihood Science and Technology Project in Nansha District, Guangzhou (No. 2021MS007).
Ethical Statement: The authors are accountable for all aspects of the work in ensuring that questions related to the accuracy or integrity of any part of the work are appropriately investigated and resolved. The study was conducted in accordance with the Declaration of Helsinki (as revised in 2013). This study was approved by the Ethics Committee of Guangzhou First People’s Hospital (No. K-2019-166-01). Informed consent was obtained from the volunteers before scans.
Footnotes
Reporting Checklist: The authors have completed the STROBE reporting checklist. Available at https://qims.amegroups.com/article/view/10.21037/qims-22-87/rc
Conflicts of Interest: All authors have completed the ICMJE uniform disclosure form (available at https://qims.amegroups.com/article/view/10.21037/qims-22-87/coif). Jun Wu is the director of the intelligent video lab at the Institute of Software Application Technology in Guangzhou, China. Pengpeng Han is an algorithm engineer at the Institute of Software Application Technology in Guangzhou, China. The other authors have no conflicts of interest to declare.
References
- 1.McPherson S, Back C, Buckwalter JG, Cummings JL. Gender-related cognitive deficits in Alzheimer's disease. Int Psychogeriatr 1999;11:117-22. 10.1017/S1041610299005670 [DOI] [PubMed] [Google Scholar]
- 2.Gutiérrez-Lobos K, Scherer M, Anderer P, Katschnig H. The influence of age on the female/male ratio of treated incidence rates in depression. BMC Psychiatry 2002;2:3. 10.1186/1471-244X-2-3 [DOI] [PMC free article] [PubMed] [Google Scholar]
- 3.Wang H, Sun J, Cui D, Wang X, Jin J, Li Y, Liu Z, Yin T. Quantitative assessment of inter-individual variability in fMRI-based human brain atlas. Quant Imaging Med Surg 2021;11:810-22. 10.21037/qims-20-404 [DOI] [PMC free article] [PubMed] [Google Scholar]
- 4.Spring S, Lerch JP, Henkelman RM. Sexual dimorphism revealed in the structure of the mouse brain using three-dimensional magnetic resonance imaging. Neuroimage 2007;35:1424-33. 10.1016/j.neuroimage.2007.02.023 [DOI] [PubMed] [Google Scholar]
- 5.Meyer CE, Kurth F, Lepore S, Gao JL, Johnsonbaugh H, Oberoi MR, Sawiak SJ, MacKenzie-Graham A. In vivo magnetic resonance images reveal neuroanatomical sex differences through the application of voxel-based morphometry in C57BL/6 mice. Neuroimage 2017;163:197-205. 10.1016/j.neuroimage.2017.09.027 [DOI] [PMC free article] [PubMed] [Google Scholar]
- 6.Luders E, Toga AW. Sex differences in brain anatomy. Prog Brain Res 2010;186:3-12. 10.1016/B978-0-444-53630-3.00001-4 [DOI] [PubMed] [Google Scholar]
- 7.Corre C, Friedel M, Vousden DA, Metcalf A, Spring S, Qiu LR, Lerch JP, Palmert MR. Separate effects of sex hormones and sex chromosomes on brain structure and function revealed by high-resolution magnetic resonance imaging and spatial navigation assessment of the Four Core Genotype mouse model. Brain Struct Funct 2016;221:997-1016. 10.1007/s00429-014-0952-0 [DOI] [PubMed] [Google Scholar]
- 8.Yagi S, Galea LAM. Sex differences in hippocampal cognition and neurogenesis. Neuropsychopharmacology 2019;44:200-13. 10.1038/s41386-018-0208-4 [DOI] [PMC free article] [PubMed] [Google Scholar]
- 9.Paez AG, Gu C, Rajan S, Miao X, Cao D, Kamath V, Bakker A, Unschuld PG, Pantelyat AY, Rosenthal LS, Hua J. Differential Changes in Arteriolar Cerebral Blood Volume between Parkinson's Disease Patients with Normal and Impaired Cognition and Mild Cognitive Impairment (MCI) Patients without Movement Disorder - An Exploratory Study. Tomography 2020;6:333-42. 10.18383/j.tom.2020.00033 [DOI] [PMC free article] [PubMed] [Google Scholar]
- 10.Duvernoy HM, Delon S, Vannson JL. Cortical blood vessels of the human brain. Brain Res Bull 1981;7:519-79. 10.1016/0361-9230(81)90007-1 [DOI] [PubMed] [Google Scholar]
- 11.Hartmann DA, Hyacinth HI, Liao FF, Shih AY. Does pathology of small venules contribute to cerebral microinfarcts and dementia? J Neurochem 2018;144:517-26. 10.1111/jnc.14228 [DOI] [PMC free article] [PubMed] [Google Scholar]
- 12.Haacke EM, Xu Y, Cheng YC, Reichenbach JR. Susceptibility weighted imaging (SWI). Magn Reson Med 2004;52:612-8. 10.1002/mrm.20198 [DOI] [PubMed] [Google Scholar]
- 13.Haacke EM, Mittal S, Wu Z, Neelavalli J, Cheng YC. Susceptibility-weighted imaging: technical aspects and clinical applications, part 1. AJNR Am J Neuroradiol 2009;30:19-30. 10.3174/ajnr.A1400 [DOI] [PMC free article] [PubMed] [Google Scholar]
- 14.Mittal S, Wu Z, Neelavalli J, Haacke EM. Susceptibility-weighted imaging: technical aspects and clinical applications, part 2. AJNR Am J Neuroradiol 2009;30:232-52. 10.3174/ajnr.A1461 [DOI] [PMC free article] [PubMed] [Google Scholar]
- 15.Haacke EM, Tang J, Neelavalli J, Cheng YC. Susceptibility mapping as a means to visualize veins and quantify oxygen saturation. J Magn Reson Imaging 2010;32:663-76. 10.1002/jmri.22276 [DOI] [PMC free article] [PubMed] [Google Scholar]
- 16.Shaaban CE, Aizenstein HJ, Jorgensen DR, MacCloud RL, Meckes NA, Erickson KI, Glynn NW, Mettenburg J, Guralnik J, Newman AB, Ibrahim TS, Laurienti PJ, Vallejo AN, Rosano C; . In Vivo Imaging of Venous Side Cerebral Small-Vessel Disease in Older Adults: An MRI Method at 7T. AJNR Am J Neuroradiol 2017;38:1923-8. 10.3174/ajnr.A5327 [DOI] [PMC free article] [PubMed] [Google Scholar]
- 17.Yan S, Wan J, Zhang X, Tong L, Zhao S, Sun J, Lin Y, Shen C, Lou M. Increased visibility of deep medullary veins in leukoaraiosis: a 3-T MRI study. Front Aging Neurosci 2014;6:144. 10.3389/fnagi.2014.00144 [DOI] [PMC free article] [PubMed] [Google Scholar]
- 18.Houck AL, Gutierrez J, Gao F, Igwe KC, Colon JM, Black SE, Brickman AM. Increased Diameters of the Internal Cerebral Veins and the Basal Veins of Rosenthal Are Associated with White Matter Hyperintensity Volume. AJNR Am J Neuroradiol 2019;40:1712-8. 10.3174/ajnr.A6213 [DOI] [PMC free article] [PubMed] [Google Scholar]
- 19.Han H, Ning Z, Yang D, Yu M, Qiao H, Chen S, Chen Z, Li D, Zhang R, Liu G, Zhao X. Associations between cerebral blood flow and progression of white matter hyperintensity in community-dwelling adults: a longitudinal cohort study. Quant Imaging Med Surg 2022;12:4151-65. 10.21037/qims-22-141 [DOI] [PMC free article] [PubMed] [Google Scholar]
- 20.Morita N, Harada M, Uno M, Matsubara S, Matsuda T, Nagahiro S, Nishitani H. Ischemic findings of T2*-weighted 3-tesla MRI in acute stroke patients. Cerebrovasc Dis 2008;26:367-75. 10.1159/000151640 [DOI] [PubMed] [Google Scholar]
- 21.Kesavadas C, Santhosh K, Thomas B. Susceptibility weighted imaging in cerebral hypoperfusion-can we predict increased oxygen extraction fraction? Neuroradiology 2010;52:1047-54. 10.1007/s00234-010-0733-2 [DOI] [PubMed] [Google Scholar]
- 22.Karaarslan E, Ulus S, Kürtüncü M. Susceptibility-weighted imaging in migraine with aura. AJNR Am J Neuroradiol 2011;32:E5-7. 10.3174/ajnr.A1973 [DOI] [PMC free article] [PubMed] [Google Scholar]
- 23.Iwasaki H, Takeda T, Ito T, Tsujioka Y, Yamazaki H, Hara M, Fujita Y. The use of susceptibility-weighted imaging for epileptic focus localization in acute-stage pediatric encephalopathy: a case report. Pediatr Neurol 2014;50:171-6. 10.1016/j.pediatrneurol.2013.09.004 [DOI] [PubMed] [Google Scholar]
- 24.Yadav BK, Krishnamurthy U, Buch S, Jella P, Hernandez-Andrade E, Yeo L, Korzeniewski SJ, Trifan A, Hassan SS, Haacke EM, Romero R, Neelavalli J. Imaging putative foetal cerebral blood oxygenation using susceptibility weighted imaging (SWI). Eur Radiol 2018;28:1884-90. 10.1007/s00330-017-5160-x [DOI] [PMC free article] [PubMed] [Google Scholar]
- 25.Darwish EAF, Abdelhameed-El-Nouby M, Geneidy E. Mapping the ischemic penumbra and predicting stroke progression in acute ischemic stroke: the overlooked role of susceptibility weighted imaging. Insights Imaging 2020;11:6. 10.1186/s13244-019-0810-y [DOI] [PMC free article] [PubMed] [Google Scholar]
- 26.Iftikhar W, Cheema FF, Khanal S, Khan QU. Migrainous Infarction and Cortical Spreading Depression. Discoveries (Craiova) 2020;8:e112. 10.15190/d.2020.9 [DOI] [PMC free article] [PubMed] [Google Scholar]
- 27.Kong Y, Liu Y, Yan B, Leung H, Peng X. A Novel Deeplabv3+ Network for SAR Imagery Semantic Segmentation Based on the Potential Energy Loss Function of Gibbs Distribution. Remote Sens 2021;13:454. 10.3390/rs13030454 [DOI] [Google Scholar]
- 28.Srivastava N, Hinton G, Krizhevsky A, Sutskever I, Salakhutdinov R. Dropout: A Simple Way to Prevent Neural Networks from Overfitting. Journal of Machine Learning Research 2014;15:1929-58. [Google Scholar]
- 29.Kuijf HJ, Bouvy WH, Zwanenburg JJ, Razoux Schultz TB, Viergever MA, Vincken KL, Biessels GJ. Quantification of deep medullary veins at 7 T brain MRI. Eur Radiol 2016;26:3412-8. 10.1007/s00330-016-4220-y [DOI] [PMC free article] [PubMed] [Google Scholar]
- 30.Egger K, Dempfle AK, Yang S, Schwarzwald R, Harloff A, Urbach H. Reliability of cerebral vein volume quantification based on susceptibility-weighted imaging. Neuroradiology 2016;58:937-42. 10.1007/s00234-016-1712-z [DOI] [PubMed] [Google Scholar]
- 31.Bouvy WH, Kuijf HJ, Zwanenburg JJ, Koek HL, Kappelle LJ, Luijten PR, Ikram MK, Biessels GJ; . Abnormalities of Cerebral Deep Medullary Veins on 7 Tesla MRI in Amnestic Mild Cognitive Impairment and Early Alzheimer's Disease: A Pilot Study. J Alzheimers Dis 2017;57:705-10. 10.3233/JAD-160952 [DOI] [PubMed] [Google Scholar]
- 32.Keith J, Gao FQ, Noor R, Kiss A, Balasubramaniam G, Au K, Rogaeva E, Masellis M, Black SE. Collagenosis of the Deep Medullary Veins: An Underrecognized Pathologic Correlate of White Matter Hyperintensities and Periventricular Infarction? J Neuropathol Exp Neurol 2017;76:299-312. 10.1093/jnen/nlx009 [DOI] [PubMed] [Google Scholar]
- 33.Gobinath AR, Choleris E, Galea LA. Sex, hormones, and genotype interact to influence psychiatric disease, treatment, and behavioral research. J Neurosci Res 2017;95:50-64. 10.1002/jnr.23872 [DOI] [PubMed] [Google Scholar]
- 34.Mazure CM, Swendsen J. Sex differences in Alzheimer's disease and other dementias. Lancet Neurol 2016;15:451-2. 10.1016/S1474-4422(16)00067-3 [DOI] [PMC free article] [PubMed] [Google Scholar]
- 35.Au B, Dale-McGrath S, Tierney MC. Sex differences in the prevalence and incidence of mild cognitive impairment: A meta-analysis. Ageing Res Rev 2017;35:176-99. 10.1016/j.arr.2016.09.005 [DOI] [PubMed] [Google Scholar]
- 36.Read S, Pedersen NL, Gatz M, Berg S, Vuoksimaa E, Malmberg B, Johansson B, McClearn GE. Sex differences after all those years? Heritability of cognitive abilities in old age. J Gerontol B Psychol Sci Soc Sci 2006;61:P137-43. 10.1093/geronb/61.3.P137 [DOI] [PubMed] [Google Scholar]
- 37.Proust-Lima C, Amieva H, Letenneur L, Orgogozo JM, Jacqmin-Gadda H, Dartigues JF. Gender and education impact on brain aging: a general cognitive factor approach. Psychol Aging 2008;23:608-20. 10.1037/a0012838 [DOI] [PubMed] [Google Scholar]
- 38.Irvine K, Laws KR, Gale TM, Kondel TK. Greater cognitive deterioration in women than men with Alzheimer's disease: a meta analysis. J Clin Exp Neuropsychol 2012;34:989-98. 10.1080/13803395.2012.712676 [DOI] [PubMed] [Google Scholar]
- 39.Xu Z, Li F, Xing D, Song H, Chen J, Duan Y, Yang B. A Novel Imaging Biomarker for Cerebral Small Vessel Disease Associated With Cognitive Impairment: The Deep-Medullary-Veins Score. Front Aging Neurosci 2021;13:720481. 10.3389/fnagi.2021.720481 [DOI] [PMC free article] [PubMed] [Google Scholar]
- 40.Hainsworth R. The Importance of Vascular Capacitance in Cardiovascular Control. News Physiol Sci 1990;5:250-4. 10.1152/physiologyonline.1990.5.6.250 [DOI] [Google Scholar]
- 41.Pollock JM, Deibler AR, Burdette JH, Kraft RA, Tan H, Evans AB, Maldjian JA. Migraine associated cerebral hyperperfusion with arterial spin-labeled MR imaging. AJNR Am J Neuroradiol 2008;29:1494-7. 10.3174/ajnr.A1115 [DOI] [PMC free article] [PubMed] [Google Scholar]
- 42.Du AT, Schuff N, Kramer JH, Rosen HJ, Gorno-Tempini ML, Rankin K, Miller BL, Weiner MW. Different regional patterns of cortical thinning in Alzheimer's disease and frontotemporal dementia. Brain 2007;130:1159-66. 10.1093/brain/awm016 [DOI] [PMC free article] [PubMed] [Google Scholar]
- 43.Pini L, Pievani M, Bocchetta M, Altomare D, Bosco P, Cavedo E, Galluzzi S, Marizzoni M, Frisoni GB. Brain atrophy in Alzheimer's Disease and aging. Ageing Res Rev 2016;30:25-48. 10.1016/j.arr.2016.01.002 [DOI] [PubMed] [Google Scholar]
- 44.Hilal S, Tan CS, van Veluw SJ, Xu X, Vrooman H, Tan BY, Venketasubramanian N, Biessels GJ, Chen C. Cortical cerebral microinfarcts predict cognitive decline in memory clinic patients. J Cereb Blood Flow Metab 2020;40:44-53. 10.1177/0271678X19835565 [DOI] [PMC free article] [PubMed] [Google Scholar]
Associated Data
This section collects any data citations, data availability statements, or supplementary materials included in this article.
Supplementary Materials
The article’s supplementary files as


