

Abstract
Objective:
Despite its prevalence, cone beam computed tomography (CBCT) has poor soft-tissue contrast, making it challenging to localize liver tumors. We propose a patient-specific deep learning model to generate synthetic magnetic resonance imaging (MRI) from CBCT to improve tumor localization.
Methods:
A key innovation is using patient-specific CBCT-MRI image pairs to train a deep learning model to generate synthetic MRI from CBCT. Specifically, patient planning CT was deformably registered to prior MRI, and then used to simulate CBCT with simulated projections and Feldkamp, Davis, and Kress reconstruction. These CBCT-MRI images were augmented using translations and rotations to generate enough patient-specific training data. A U-Net-based deep learning model was developed and trained to generate synthetic MRI from CBCT in the liver, and then tested on a different CBCT dataset. Synthetic MRIs were quantitatively evaluated against ground-truth MRI.
Results:
The synthetic MRI demonstrated superb soft-tissue contrast with clear tumor visualization. On average, the synthetic MRI achieved 28.01, 0.025, and 0.929 for peak signal-to-noise ratio, mean square error, and structural similarity index, respectively, outperforming CBCT images. The model performance was consistent across all three patients tested.
Conclusion:
Our study demonstrated the feasibility of a patient-specific model to generate synthetic MRI from CBCT for liver tumor localization, opening up a potential to democratize MRI guidance in clinics with conventional LINACs.
1 |. INTRODUCTION
Liver cancer is the second deadliest cancer globally, and its occurrence rate is faster than any other cancer for both males and females.1 Although surgical removal provides a relatively good overall survival rate, over 70% of patients are not eligible for surgical treatment due to liver dysfunction or other patient comorbidities.2 Thus, alternative treatment methods were introduced in recent decades, such as trans-arterial chemoembolization (TACE) and percutaneous radiofrequency ablation (RFA). However, the efficacy of these methods is limited by the location and size of the tumor. Recently, stereotactic body radiation therapy (SBRT) has become one of the most common non-invasive treatment methods for liver cancer. Although SBRT provides some promising results in early clinical outcomes, the 2-year local control is as low as 60–70%.3,4 Previous studies for lung and prostate cancer treatment showed that the local control failure rate has a strong correlation with tumor localization accuracy of the treatment.5 Thus, we could infer that tumor localization accuracy also plays an important role in the local control for liver SBRT treatment.
Currently, cone beam computed tomography (CBCT) is the most commonly used imaging modality for target localization in liver SBRT due to the prevalence of onboard X-ray imaging devices. However, CBCT images suffer from various artifacts caused by respiratory motion, scattering, beam hardening, and undersampling that significantly affect the image quality.6,7 In addition, CBCT has extremely low soft-tissue contrast, because the soft tissue has a relatively uniform attenuation coefficient. Consequently, CBCT provides limited or no visualization of the liver tumor, making it almost impossible to localize the tumor directly. As an alternative, indirect localization methods are routinely used for liver SBRT in clinical practice. One of the most common methods is using liver boundaries to guide the positioning. However, such methods have very limited accuracy, because the liver has large deformations during respiration. For example, the dose coverage of the tumor could fall below 90% with a 10-mm planning target volume margin, which is clinically significant.8 Another common method for liver tumor localization is marker implantation. However, marker implantation is invasive and it might cause serious effects, such as tumor spread, liver inflammation, and embolization.9 To address the limitations of CBCT, on-board MRI has been introduced in recent years to provide superior soft-tissue contrast. However, MRI-based linear accelerator is rare due to its high cost and several technical challenges. The high magnetic field of the imaging system could interfere with the linear accelerator dose delivery. One of the most important effects is the electron return effect. Due to the magnetic field, electrons will return to the tumor at the beam exit point, which might create a hotspot in the tumor.10 Other effects, such as lateral dose shifting or cavity under and overdosing, could also affect the accuracy of dose delivery. In this case, MR linear accelerator needs to be designed carefully by adding multiple shielding, which makes the cost even higher. Ultrasound is another alternative for target localization. However, its application is even more limited for radiation therapy due to its limited image quality: low soft-tissue contrast, lack of 3D anatomical structures, limited field-of-view, and potential deformation of liver during image acquisition. There is an urgent clinical need to develop an onboard imaging technique that is widely available on radiotherapy machines and provides superb soft-tissue contrast for target localization in liver SBRT.
In the present study, we propose to investigate the feasibility of generating synthetic MRI images from CBCT to address the clinical need. Deep learning models have been developed to generate synthetic images. Xue et al. implemented three deep learning models, CycleGAN, Pix2pix, and UNet, for synthetic CT generation from onboard CBCT images.11 All of the models achieved better evaluation metrics based on the DVH and 2D gamma index analysis. Similarly, Lei et al. implemented CycleGAN to generate synthetic MRI from onboard CBCT images for multi-organ segmentation.12 Their models were trained based on a group of patients’ data to enhance the quality of CBCT. Although they were successful in correcting the artifacts and enhancing the contrasts of organ boundaries, their capabilities in enhancing the intra-organ soft-tissue contrast, such as liver tumor contrast, are limited. This is because deep learning cannot artificially create information; that is, tumor contrast, when it is completely lost in the original CBCT images. To address this limitation, we propose to incorporate patient-specific prior knowledge into the deep learning model to provide information missing in the CBCT to enhance tumor contrast for localization. Our recent study demonstrated the great potential of such a patient-specific deep learning model for digital tomosynthesis image enhancement.13 In the present study, we aimed to develop a patient-specific deep learning model to generate synthetic MRI from CBCT to improve the tumor localization precision of CBCT-guided liver SBRT.
A deep learning model was developed based on the U-Net architecture with L1 loss function to generate synthetic MRI from CBCT. The model is trained to be patient-specific based on the CBCT and MRI image from the same patient, with the MRI serving as the ground truth for training. This training data can be obtained during the treatment planning stage using CBCTs simulated from planning CT and planning MRI images. Data augmentation methods, including simulating deformations, translations, and rotations, can be applied to increase the datasets to be adequate for model training. Once the model is trained, it can be applied to generate synthetic MRI from daily CBCTs for target localization. In the present study, we used MRIs acquired on different days and planning CT to build the training dataset. The model was trained to generate synthetic MRI only in the liver region solely for the purpose of liver tumor localization. The generated synthetic MRI was quantitatively evaluated against ground-truth MRI using the structural similarity index (SSIM), peak signal-to-noise ratio (PSNR), mean square error (MSE), and mutual information (MI).
2 |. METHODS
2.1 |. Method overview
Figure 1 shows the proposed workflow of synthetic MRI generation. Patient planning CT is first registered to the planning MRI images using deformable registration, and then used to simulate CBCT using simulated projections and Feldkamp, Davis, and Kress (FDK) reconstruction. Liver images in the CBCT and MRI images are extracted and used to build the patient-specific training data. Specifically, data augmentation techniques are used to simulate deformations, translations, and rotations in the CBCT and MRI images to increase the data size for model training. However, we are still investigating the method to best simulate deformations, and have not utilized this augmentation technique in the current pilot study. In addition, in the present study, we obtained multiple days MRI for training, which already incorporated the daily deformation of liver and thus reduced the need for deformation simulation. The model is trained to generate synthetic MRI from CBCT with the planning MRI as the ground truth. After training, the model is tested to generate synthetic MRI of the liver from onboard CBCT acquired on the treatment days. The liver synthetic MRI images are finally embedded into the CBCT to generate hybrid images, providing MRI in the liver for target localization and CBCT outside the liver for organs at risk verification. Note that a key innovation of this method is that the model is trained to be patient-specific using prior data from the same patient. This patient-specific model can obtain extra information from patient prior knowledge to compensate for the missing information in the input image, such as the missing tumor contrast in CBCT, to recover full tumor contrast in the synthetic MRI images generated.
FIGURE 1.

Overall workflow of this study. CBCT, cone beam computed tomography; CT, computed tomography; MRI, magnetic resonance imaging
2.2 |. Model architecture
The architecture of the model was developed based on UNetdue to its excellent performance for other image translation tasks.14 Figure 2 briefly shows the network structure of UNet for synthesis MRI from CBCT. The network is symmetric, and contains a contracting path and an expanding path. The contracting path contains a general convolutional network, and the expanding path is constructed by transposed 2D convolutional layers. The contracting path contains four convolutional steps, each step contains two 2D convolutional layers and a max-pooling layer. The expanding path also contains four convolutional steps. The input of each step is concatenated with the output of the contracting path. For each convolutional layer, we optimized the parameters to kernel_size = 4, stride = 2, and padding = 1. The image size of the final output is the same as the input of the model.
FIGURE 2.

Architecture of UNet. The orange block is the input and the green block is the output
2.3 |. Model training configurations
The proposed method was implemented using Python 3.9.7 and PyTorch 1.8.1. The UNet model was trained on an NVIDIA TITAN RTX GPU with 24 GB of memory. The training process takes 48 h for 100 epochs with batch size 1. The learning rate and the momentum term of the Adam optimizer are empirically set to 0.0002 and 0.5.
2.4 |. Experimental design
The present study uses data acquired for liver cancer patients treated by SBRT. In each patient, planning CT and seven MRI datasets were acquired on different days. CT images are the treatment planning images acquired at the beginning of the treatment course. MRIs are onboard MRI images acquired during each treatment. The CT images were scanned with Siemens SOMATOM drive scanner at 120 kVp and 55 mAs. Each CT image was reconstructed to 512 × 512 size, 0.979 × 0.979 mm resolution, and 2 mm slice thickness. MRIs were t1-weighted scanned with 1.5T Philips Marlin system. The repetition time of MRI images is 4.7 ms and echo time is 1.9 ms. Each MRI was reconstructed to 256 × 256 size, 1.64 × 1.64-mm resolution, and 4.76-mm slice thickness. The patients were imaged in the same position, and all of these images are the average of 4D scans.
The CT and first six sets of MRI images were used to build the patient-specific training data, following the process explained in Figure 1. Specifically, the planning CT was deformably registered to the MRI images using MIM software. Next, the registered CT images were used as the input to generate 180 digitally reconstructed radiographs over a 360° scan angle with half-fan geometry, which were then used to reconstruct CBCT based on our in-house Matlab FDK reconstruction software. Our in-house reconstruction software is strictly implemented based on the FDK algorithm with ramp filter.15 The algorithm is exactly the same as the algorithm used for clinical CBCT reconstructions. In addition, our in-house software has been used for multiple studies to simulate onboard CBCT images6,7,16. The parameter settings for the reconstruction were based on real clinical geometry. These six pairs of CBCT-MRI image sets were further augmented by translating the images up to 6.5 mm with step size of 1.5 mm along superior-inferior and lateral directions, and rotating the images up to 2° clockwise and counterclockwise to increase the datasets to ~23 000 image pairs. These augmented datasets were used to train the model to generate synthetic MRI from CBCT with the real MRI images as the ground truth. MRI and CBCT were scaled to (–1, 1) to normalize their intensity range. Only liver regions in the MRI and CBCT were extracted for model training to save the computing resources. For model testing, planning CT was registered to the seventh MRI image set and then used to simulate the corresponding CBCT. The deep learning model was tested to generate synthetic MRI from this CBCT, and was evaluated against the real MRI as the ground truth. The performance of this patient-specific model was evaluated on a cohort of three liver cancer patients.
2.5 |. Evaluation
The synthetic MR images were compared with the ground truth MR images and CBCT images. The quality was evaluated based on four metrics: SSIM,17 MSE, PSNR,18 and MI.19 These metrics are defined as follows:
| (1) |
where μx, μy are the mean values of x and y, respectively. σxy is the covariance of x, and are the variance of x, y.c1 = 0.012 x, y.c2 = 0.032
| (2) |
where n is the number of pixels.
| (3) |
where MAXI is the maximum intensity. In our case, MAXI means the maximum intensity of ground truth MRI.
In addition to these three metrics, line profiles of the whole liver and tumor region were also used to evaluate the results.
3 |. RESULTS
3.1 |. Synthetic MRI for liver
Figure 3 shows example images of CBCT, synthetic MRI, and ground truth MRI. The red circle in each image highlights the region of interest that contains the tumor. From the CBCT images, it is clear that the image has low soft-tissue contrast and contains scatter artifacts. In contrast, the synthetic MRI restores the anatomical structure and tumor by enhancing the contrast and reducing the artifacts. Specifically, the shape of the tumor in synthetic MRI is close to the ground truth MRI. In addition, the intensity of synthetic MRI is also adjusted by the patient-specific deep learning model to better match the ground truth MRI.
FIGURE 3.

Representative slices of (A) onboard cone beam computed tomography (CBCT), (B) synthetic magnetic resonance imaging (MRI), and (C) ground truth MRI. The red circle highlights the region that contains the tumor
3.2 |. Image difference comparison
Figure 4 shows the difference images, which were generated based on the equation ydiff = |y – x|, where x is the onboard CBCT or synthetic MRI image, y is the ground truth. From image (a), which was calculated based on the difference between onboard CBCT and MRI, it is clear that the intensity difference has large variances and the maximum difference is larger than 2. In contrast, the generated synthetic MRI is closer to the ground truth MRI, with much smaller variance and intensity difference.
FIGURE 4.
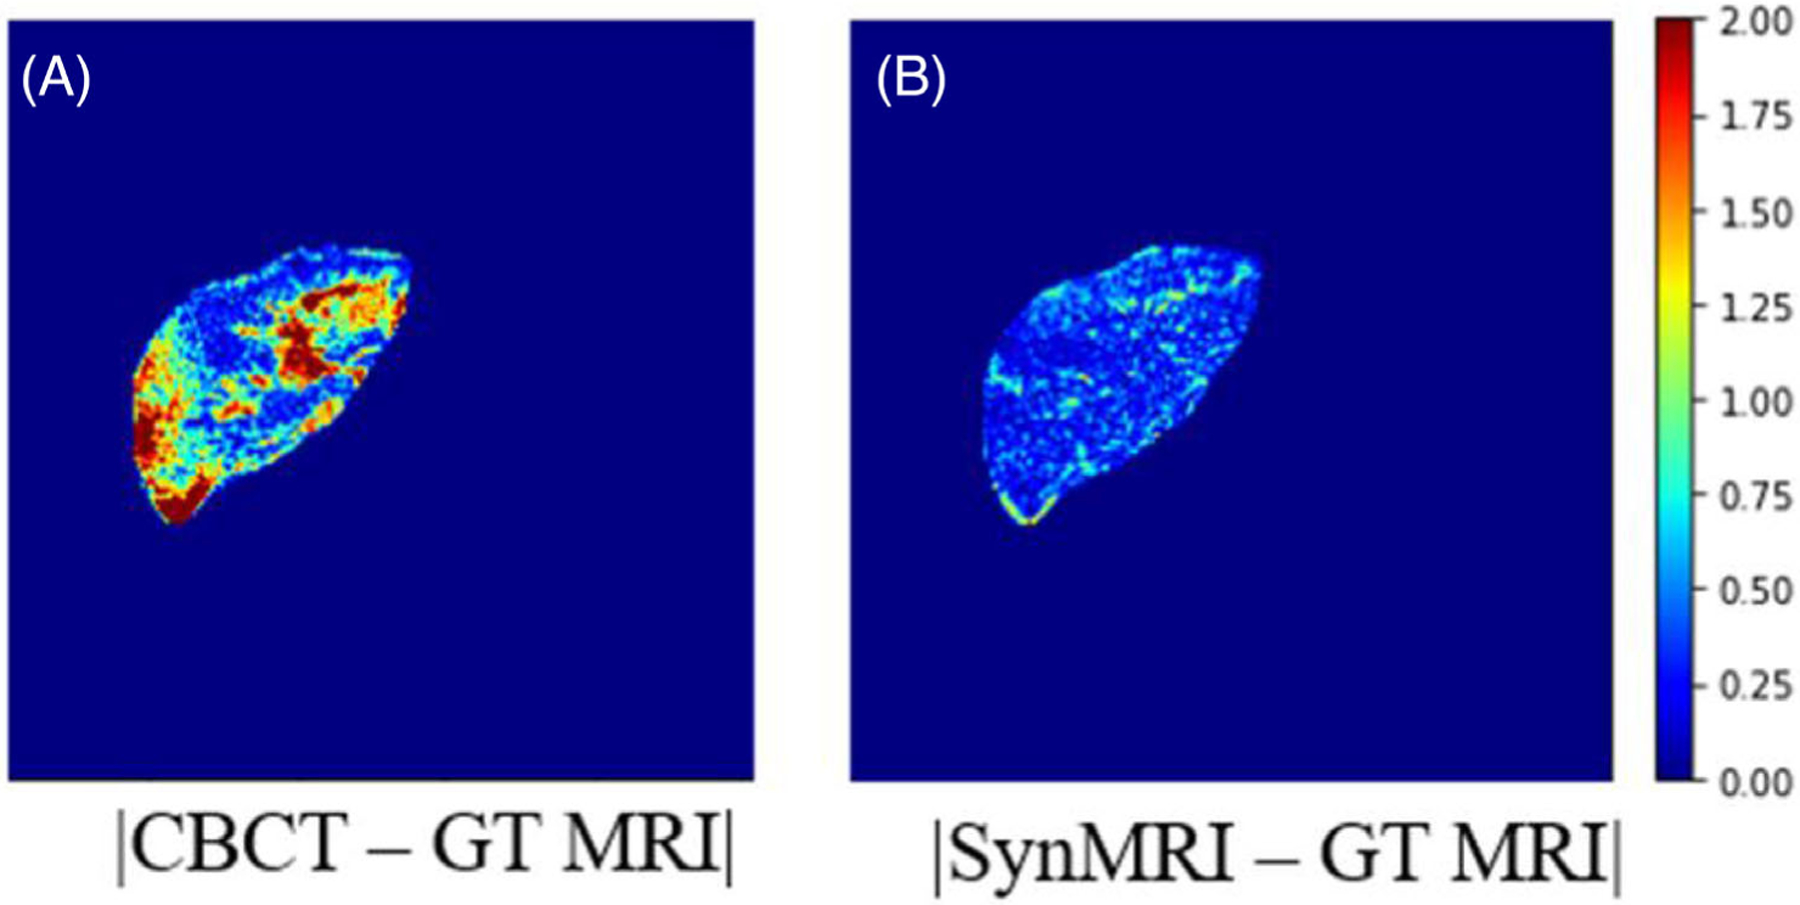
Representative difference images of the patient study. (A) Image showing the difference image between cone beam computed tomography (CBCT), and ground truth magnetic resonance imaging (MRI). (B) Image presents the difference between synthetic MRI and ground truth MRI
3.3 |. Line profile comparison
Figure 5 presents the line profile of CBCT, synthetic MRI, and ground truth MRI for comparison. The left image shows the ground truth MRI, with the red line indicating the location of the profile. The profile plot clearly states that the synthetic MRI has similar pixel values compared with the ground truth MRI.
FIGURE 5.

Line profiles of onboard cone beam computed tomography (CBCT), synthetic magnetic resonance imaging (MRI), and ground truth MRI for the liver. The red line illustrates the position of line profiles on the image
Figure 6 shows the line profile of onboard CBCT, synthetic MRI, and ground truth MRI for the tumor region. The tumor is cropped by the contour obtained from the clinic. The plot shows the ground truth MRI and synthetic MRI have similar pixel values across the plot around the tumor region, but onboard CBCT and ground truth have larger differences.
FIGURE 6.

Line profiles of onboard cone beam computed tomography (CBCT), synthetic MRI and ground truth magnetic resonance imaging (MRI) for the tumor. The red line illustrates the position of line profiles on the image. GTV, gross tumor volume
3.4 |. Hybrid MRI/CBCT
Figure 7 shows two representative slices of the final hybrid MRI/CBCT from two different patients. The images were generated by embedding the synthetic MRI of the liver into the whole body CBCT images. From these two images, the liver region achieves superior soft-tissue contrast and tumors are easier to localize due to the improved contrast.
FIGURE 7.

Representative slices of hybrid magnetic resonance imaging (MRI)/cone beam computed tomography (CBCT) images from two patients
3.5 |. Phantom results
Figure 8 shows the patient-specific model trained by XCAT phantoms. In the present study, we utilized 4D XCAT phantom with 10 phases for training and testing. We trained the phantom with nine phases and tested on another phase. The synthetic MRXCAT image improved the soft-tissue contrast of XCAT images, and it has high agreement with the ground truth MRXCAT image.
FIGURE 8.

Representative slices of XCAT, synthetic MR-XCAT, and ground truth MR-XCAT
3.6 |. Quantitative evaluation
Table 1 shows the quantitative evaluation of CBCT and synthetic MRI of three testing patients. The PSNR, MSE, and SSIM were calculated with real MRI as the ground truth. From the table, all of the metrics are greatly improved from the CBCT to synthetic MRI. The high PSNR and SSIM values show that the synthetic MRI quantitatively matches with the ground truth MRI. Table 2 presents the SSIM evaluation of the tumor region. The results also improved from CBCT to synthetic MRI.
TABLE 1.
Quantitative evaluation results of the patient study for the whole liver region
| CBCT | Synthetic MRI | |||||
|---|---|---|---|---|---|---|
| PSNR | MSE | SSIM | PSNR | MSE | SSIM | |
| P1 | 19.4 dB | 0.0606 | 0.959 | 26.4 dB | 0.0119 | 0.970 |
| P2 | 22.9 dB | 0.115 | 0.866 | 31.0 dB | 0.0175 | 0.929 |
| P3 | 28.3 dB | 0.166 | 0.894 | 31.5 dB | 0.0798 | 0.932 |
CBCT, cone beam computed tomography; MRI, magnetic resonance imaging; MSE, mean square error; PSNR, peak signal-to-noise ratio; SSIM, structural similarity index.
TABLE 2.
Quantitative evaluation results of the patient study for tumor (gross tumor volume) region
| SSIM (GTV) | ||
|---|---|---|
| CBCT | Synthetic MRI | |
| P1 | 0.829 | 0.934 |
| P2 | 0.812 | 0.918 |
| P3 | 0.898 | 0.907 |
Image intensities are z-normalized to calculate the metrics.
CBCT, cone beam computed tomography; GTV, gross tumor volume; MRI, magnetic resonance imaging; SSIM, structural similarity index.
4 |. DISCUSSION
CBCT has been widely used for target localization in radiation therapy. However, CBCT suffers from various artifacts caused by scattering, beam hardening, or undersampling. In addition, CBCT has extremely poor soft-tissue contrast, which makes it almost impossible for liver tumor localization. In the present study, we demonstrated the feasibility of developing a patient-specific model to generate synthetic onboard MRI from CBCT to achieve significantly improved soft-tissue contrast for tumor localization.
Compared with the prior deep learning methods, our proposed method is innovative in proposing a patient-specific model training strategy, which was to train the model using prior data from the specific patient under investigation.12,20 This patient-specific training allows us to use the patient’s prior knowledge to recover the missing information; that is, tumor contrast, in the input CBCT to generate synthetic MRI with superb soft-tissue contrast for the tumor. This would not be achievable in a population-based model, as the tumor contrast is often completely lost in CBCT, and it is impossible for the model to artifi cially create a tumor in the liver without the knowledge of the specific patient (e.g., each patient can have different tumor contrasts, sizes, and locations).
The results showed that our method achieved excellent performance both qualitatively and quantitatively. The synthetic MRIs matched closely to the ground truth MRIs visually. The soft-tissue contrast is superior and the tumor is clear to localize. Furthermore, line profiles, difference images, and evaluation metrics also proved that the results of synthetic MRIs had high agreement to the ground truth MRI.
In the present study, the patient-specific training data were built using planning CT and multiple MRI image sets acquired on different days due to the availability of the data. However, we realize that this may not always be available in clinical practice. In the future, we plan to simulate deformations in the planning MRI images for data augmentation instead of using multiple MRI image sets. Specifically, we will use a finite element based method to simulate different deformations of the liver. The liver will be simulated as a finite element 3D model with an appropriate material property. Different forces and pressures will be applied to simulate different magnitudes and patterns of liver deformations for data augmentation. Using this scheme together with simulating translations and rotations, a patient-specific training dataset can be built just using planning CT and MRI images, so that the model can be trained during the planning stage and then tested to generate synthetic MRI from CBCT during the treatment stage. One limitation of the study was that the onboard CBCT was simulated using digitally reconstructed radiographs of the planning CT instead of real projections. The digitally reconstructed radiographs were acquired based on the ray-tracing algorithm, and it does not contain noise and scatters. In the future, we will use the Monte Carlo method to simulate more realistic CBCT images from planning CT for model training during the planning stage, and use real CBCT images for model testing during the treatment stage.
Another limitation of the present study was the accuracy of deformable image registration. We agree that deformable image registration in this study might lead to inaccuracies in our final results. In our future study, we plan to generate synthetic CT images from these MRIs with deep learning to avoid using deformable image registration. The synthetic CT generation model has been reported by other groups.21 Instead of using deformable image registration, the synthetic CT images could be directly generated from these MRI images with exactly the same geometry, and CBCT images could be simulated from synthetic CT images. The workflow discussed above could eliminate the impact of deformable image registration error. In addition, the planning CT images are derived from the 4D CT averaged over three mid-positions. The MRI images are also the average of 4D MRI mid-position images. Patients were scanned with abdominal compression to minimize the respiratory motion amplitude. Although residual motion can exist in the average images, its impact was considered low due to the motion control mechanism. Last but not least, more evaluations using a larger patient cohort need to be performed to further evaluate the robustness and accuracy of the synthetic MRI generation.
5 |. CONCLUSION
The proposed patient-specific deep learning model demonstrated the potential to use CBCT to generate accurate synthetic MRI with superb tumor contrast for target location in liver SBRT. This important advance opens up a horizon to democratize MRI guidance in regular LINAC to substantially improve the treatment precision and thus the outcomes of liver SBRT.
ACKNOWLEDGMENT
This work was supported by the National Institutes of Health under Grant No. R01-CA184173, R01-EB028324.
Footnotes
CONFLICT OF INTEREST
The authors declares that they have no conflicts of interest.
ETHICS STATEMENT
All patient data included in this study are anonymized. Patient data are acquired from Medical College of Wisconsin.
REFERENCES
- 1.Siegel RL, Miller KD, Jemal A. Cancer statistics, 2019. CA Cancer J Clin. 2019;69(1):7–34. [DOI] [PubMed] [Google Scholar]
- 2.Anwanwan D, Singh SK, Singh S, Saikam V, Singh R. Challenges in liver cancer and possible treatment approaches. Biochim Biophys Acta Rev Cancer. 2020;1873(1):188314. [DOI] [PMC free article] [PubMed] [Google Scholar]
- 3.Liu E, Stenmark MH, Schipper MJ, et al. Stereotactic body radiation therapy for primary and metastatic liver tumors. Transl Oncol. 2013;6(4):442–446. [DOI] [PMC free article] [PubMed] [Google Scholar]
- 4.Scorsetti M, Comito T, Clerici E, et al. Phase II trial on SBRT for unresectable liver metastases: long-term outcome and prognostic factors of survival after 5 years of follow-up. Radiat Oncol. 2018;13(1):1–10. [DOI] [PMC free article] [PubMed] [Google Scholar]
- 5.Zelefsky MJ, Kollmeier M, Cox B, et al. Improved clinical outcomes with high-dose image guided radiotherapy compared with non-IGRT for the treatment of clinically localized prostate cancer. Int J Radiat Oncol Biol Phys. 2012;84(1):125–129. [DOI] [PubMed] [Google Scholar]
- 6.Zhang Z, Huang M, Jiang Z, et al. 4D radiomics: impact of 4D-CBCT image quality on radiomic analysis. Phys Med Biol. 2021;66(4):045023. [DOI] [PMC free article] [PubMed] [Google Scholar]
- 7.Jiang Z, Chen Y, Zhang Y, Ge Y, Yin F-F, Ren L. Augmentation of CBCT reconstructed from under-sampled projections using deep learning. IEEE Trans Med Imaging. 2019;38(11):2705–2715. [DOI] [PMC free article] [PubMed] [Google Scholar]
- 8.Ren G, Zhang Y, Yin F, Ren L. Enhancing On-Board Image Contrast Using Prior Images and Deformable Registration for Target Localization: A Feasibility Study. Med Phys; 2018;45(6):E600–E600. [Google Scholar]
- 9.Hennessey H, Valenti D, Cabrera T, Panet-Raymond V, Roberge D. Cardiac embolization of an implanted fiducial marker for hepatic stereotactic body radiotherapy: a case report. J Med Case Rep. 2009;3(1):1–5. [DOI] [PMC free article] [PubMed] [Google Scholar]
- 10.Lagendijk J, Van Vulpen M, Raaymakers B. The development of the MRI linac system for online MRI-guided radiotherapy: a clinical update. J Intern Med. 2016;280(2):203–208. [DOI] [PubMed] [Google Scholar]
- 11.Xue X, Ding Y, Shi J, et al. Cone Beam CT (CBCT) based synthetic CT generation using deep learning methods for dose calculation of nasopharyngeal carcinoma radiotherapy. Technol Cancer Res Treat. 2021;20:15330338211062415. [DOI] [PMC free article] [PubMed] [Google Scholar]
- 12.Lei Y, Wang T, Tian S, et al. Male pelvic multi-organ segmentation aided by CBCT-based synthetic MRI. Phys Med Biol. 2020;65(3):035013. [DOI] [PMC free article] [PubMed] [Google Scholar]
- 13.Jiang Z, Yin F-F, Ge Y, Ren L. Enhancing digital tomosynthesis (DTS) for lung radiotherapy guidance using patient-specific deep learning model. Phys Med Biol. 2021;66(3):035009. [DOI] [PMC free article] [PubMed] [Google Scholar]
- 14.Ronneberger O, Fischer P, Brox T. U-net: Convolutional Networks for Biomedical Image Segmentation. Springer; 2015:234–241. [Google Scholar]
- 15.Feldkamp LA, Davis LC, Kress JW. Practical cone-beam algorithm. J Opt Soc Am A. 1984;1(6):612–619. [Google Scholar]
- 16.Chen Y, Yin F-F, Zhang Y, Zhang Y, Ren L. Low dose cone-beam computed tomography reconstruction via hybrid prior contour based total variation regularization (hybrid-PCTV). Quant Imaging Med Surg. 2019;9(7):1214. [DOI] [PMC free article] [PubMed] [Google Scholar]
- 17.Wang Z, Bovik AC, Sheikh HR, Simoncelli EP. Image quality assessment: from error visibility to structural similarity. IEEE Trans Image Process. 2004;13(4):600–612. [DOI] [PubMed] [Google Scholar]
- 18.Würfl T, Hoffmann M, Christlein V, et al. Deep learning computed tomography: learning projection-domain weights from image domain in limited angle problems. IEEE Trans Med Imaging. 2018;37(6):1454–1463. [DOI] [PubMed] [Google Scholar]
- 19.Duncan TE. On the calculation of mutual information. SIAM J Appl Math. 1970;19(1):215–220. [Google Scholar]
- 20.Lei Y, Dong X, Tian Z, et al. CT prostate segmentation based on synthetic MRI-aided deep attention fully convolution network. Med Phys. 2020;47(2):530–540. [DOI] [PMC free article] [PubMed] [Google Scholar]
- 21.Lei Y, Harms J, Wang T, et al. MRI-only based synthetic CT generation using dense cycle consistent generative adversarial networks. Med Phys. 2019;46(8):3565–3581. [DOI] [PMC free article] [PubMed] [Google Scholar]