Abstract
Purpose:
To determine how particle density affects dose distribution and outcomes after lobar radioembolization.
Methods:
Matched pairs of patients, treated with glass versus resin microspheres, were selected by propensity score matching (114 patients), in this single-institution retrospective study. For each patient, tumor and liver particle density (particles/cm3) and dose (Gy) were determined. Tumor-to-normal ratio was measured on both 99mTc-MAA SPECT/CT and post-90Y bremsstrahlung SPECT/CT. Microdosimetry simulations were used to calculate 1st percentile dose, which is the dose in the cold spots between microspheres. Local progression-free survival (LPFS) and overall survival were analyzed.
Results:
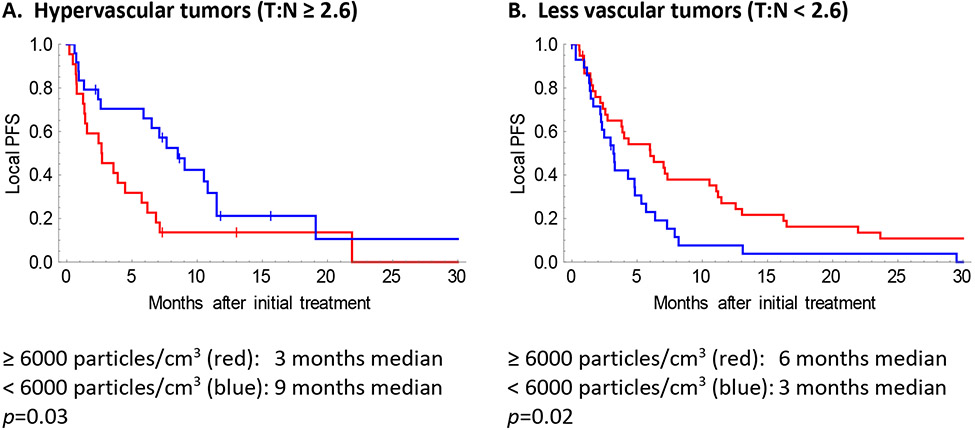
As more particles were delivered, doses on 90Y SPECT/CT became more uniform throughout the treatment volume: tumor and liver doses became more similar (p=0.04), and microscopic cold spots between particles disappeared. For hypervascular tumors (tumor-to-normal ratio ≥ 2.6 on MAA scan), delivering fewer particles (<6000 particles/cm3 treatment volume) was associated with better LPFS (p=0.03). For less vascular tumors (tumor-to-normal ratio < 2.6), delivering more particles (≥6000 particles/cm3) was associated with better LPFS (p=0.02). In matched pairs of patients, using the optimal particle density resulted in improved overall survival (11.5 vs 6.8 months, p=0.047), compared to using suboptimal particle density. Microdosimetry resulted in better predictions of LPFS (p=0.03), and overall survival (p=0.02), compared to conventional dosimetry.
Conclusion:
The number of particles delivered can be chosen to maximize the tumor dose and minimize the liver dose, based on tumor vascularity. Optimizing the particle density resulted in improved LPFS and overall survival.
Keywords: radioembolization, embolization, dosimetry, microdosimetry, tumor vascularity
Introduction
Large or multifocal liver tumors can be treated using lobar radioembolization. In lobar radioembolization, two major variables that can be controlled by the interventional radiologist are the prescribed activity, and the number of particles delivered. The effects of tumor dose on outcomes have been studied extensively [7; 8; 12; 17]. The effects of tumor particle density on outcomes are less well understood [1; 14; 19].
There are 3 main mechanisms whereby tumor particle density can affect outcomes. First, low particle density can result in gaps between particles, thus reducing the effective dose [10; 13; 14; 19]. Second, high particle density could cause tumor hypoxia via an embolic effect. Although sublethal levels of hypoxia can make tumors resistant to radiation [9], lethal levels of hypoxia could supplement cell killing due to radiation [2]. Third, particles initially preferentially flow to the most vascular part of the tumor, and after those vessels are embolized, particles flow to less vascular tumor, and then to normal liver. This results in a changing distribution of microspheres, as more microspheres are delivered.
Previously, we hypothesized that large and hypervascular tumors might benefit from delivering more 90Y microspheres [1]. Here, we present data to test that hypothesis. Specifically, we examine matched pairs of patients, treated with glass versus resin microspheres. For each patient, we calculate the tumor volume, tumor-to-normal ratio, number of particles delivered, and the particle density (particles/cm3), and evaluate whether those variables affect outcomes.
Materials and Methods
Patients
This HIPAA-compliant retrospective study was approved by the IRB. From July 2010 – December 2019, 195 consecutive patients received their initial lobar radioembolization, using standard lobar dosing (described below). Patients who received radiation segmentectomy or lobectomy were excluded. The first radioembolization procedure was examined.
Propensity score matching
Propensity score matching (1:1 nearest neighbor matching within 0.2 logit units) was performed to identify 57 pairs of patients, where one patient was treated using glass microspheres, and the other patient was treated using resin microspheres. Patients were matched using the following variables: age, gender, pathology, neuroendocrine tumor grade, BCLC stage and AFP (for HCC), CEA (for colorectal cancer), Child-Pugh score, and prior therapies (chemotherapy, liver resection, liver radiation, liver ablation, or transarterial embolization/chemoembolization).
Radioembolization
Lobar radioembolization was performed using either 90Y-loaded glass (TheraSphere, Boston Scientific, Marlborough, MA) or resin (SIR-Spheres, Sirtex Medical, Woburn, MA) microspheres, as previously described [1]. Prescribed activity for glass microspheres was calculated to achieve an average dose of 120 Gy in the treatment volume (medical internal radiation dose (MIRD) model). Prescribed activity for resin microspheres was calculated using the body surface area (BSA) method.
Tumor and liver volumes
Whole liver, treated liver, and tumor volumes were measured using Aquarius Intuition software (TeraRecon, Durham, NC).
Tumor-to-normal ratio
The tumor-to-normal (T:N) ratio was measured on both 99mTc-MAA SPECT/CT and post-90Y bremsstrahlung SPECT/CT (with attenuation correction), using Hybrid Viewer software (Hermes Medical Solutions, Greenville, NC). 3D regions of interest (ROI) were drawn over the target tumors, and over the surrounding normal liver, within the treated arterial distribution. The tumor-to-normal ratio provides an estimate of the ratio of the dose (Gy) or particle density in the tumor, relative to the surrounding liver.
Particles delivered (glass)
Traditionally, glass microspheres have a higher activity per particle than resin microspheres, meaning that fewer particles are needed to achieve the same average dose (Gy) in the treatment volume. However, if glass microspheres are used in the second week after calibration, then the activity per particle can be similar to resin.
At the time of calibration (Sundays at noon, Eastern time), glass microspheres have 2500 Bq/particle. The entire dose vial is used in interventional radiology. The number of particles delivered to the patient is:
Nominal activity at the time of calibration (GBq) × 400000 × Fraction of the dose vial delivered to the patient (usually >95%)
Particles delivered (resin)
Traditionally, resin microspheres have lower activity per particle than glass microspheres. However, the FLEXdose program enables delivery of resin microspheres with a higher activity per particle.
Resin microsphere vials contain 44.48×10⁶ particles, and an aliquot of the dose vial is obtained to achieve the desired activity. The number of particles delivered to the patient is:
(Note that 64.1 is the half life of 90Y in hours.)
Tumor and liver particle density and dose
The tumor particle density (particles/cm3) is related to the number of particles delivered, tumor-to-normal ratio, tumor volume, and liver volume. The tumor dose (Gy) is related to the delivered activity, tumor-to-normal ratio, tumor volume, and liver volume.
Using a partition model, the mean particle density in the tumor is:
where:
= particle density in tumor (particles/cm3)
= number of particles delivered to the liver (after correcting for lung-shunt fraction)
= tumor volume (cm3)
= liver volume (excluding tumor, cm3)
= T:N ratio on 99mTc-MAA SPECT/CT
Microdosimetry simulations
Given the mean dose (Gy) and particle density (particles/cm3), microdosimetry simulations were performed to calculate microdosimetry maps, dose distributions, median doses, and 1st percentile doses, using Mathematica 12. First, activity per particle was calculated using the standard 50 Gy kg/GBq conversion factor. Second, we assumed an average of 5 particles per cluster [10], and distributed clusters in 3D space following a uniform random distribution. Finally, for each point in the 3D volume, the dose was calculated by summing up the dose from each cluster, using data on the dose around a point source of 90Y [15].
Outcomes after radioembolization
Change in tumor size was evaluated on the 2-month post-procedure CT or MRI. Local progression-free survival for the target tumors was evaluated by RECIST 1.1. Radioembolization induced liver disease (REILD) was defined as a symptomatic deterioration in liver function, developing 2 weeks – 4 months after radioembolization, without tumor progression or biliary obstruction [3].
Statistics
Averages and regression coefficients were compared using two-tailed t-tests. Proportions were compared using Fisher’s exact test or a chi-squared test. Kaplan Meier curves were compared using a log rank test. Univariate and multivariate Cox proportional hazards model was used to determine predictors of local progression-free survival (LPFS) and overall survival. Optimal cutoffs for T:N ratio and particle density were selected to minimize the p value [4] for comparing the LPFS curves for patients above versus below the cutoff.
Results
Patient characteristics
Clinical characteristics of patients who received glass versus resin microspheres are shown in Table 1. Prior to radioembolization, there were no significant differences between the two groups.
Table 1.
Propensity-score matched pairs of patients treated using resin versus glass 90Y microspheres.
| Characteristic | Resin (57 patients) |
Glass (57 patients) |
p |
|---|---|---|---|
| Age | 61 ± 12 | 61 ± 12 | 0.88 |
| Female | 36 (63%) | 39 (68%) | 0.69 |
| Pathology | 0.99 | ||
| HCC | 1 (2%) | 1 (2%) | |
| Cholangiocarcinoma | 2 (4%) | 1 (2%) | |
| Colorectal | 22 (39%) | 23 (40%) | |
| NET, grade 1 | 1 (2%) | 2 (4%) | |
| NET, grade 2 | 3 (5%) | 3 (5%) | |
| NET, grade 3 | 2 (4%) | 1 (2%) | |
| Breast | 14 (25%) | 16 (28%) | |
| Sarcoma | 1 (2%) | 1 (2%) | |
| Other | 11 (19%) | 9 (16%) | |
| Liver function | |||
| Child-Pugh score | 0.24 | ||
| A5 | 41 (72%) | 43 (75%) | |
| A6 | 15 (26%) | 10 (18%) | |
| B7 | 1 (2%) | 4 (7%) | |
| Albumin | 3.88 ± 0.45 | 3.79 ± 0.42 | 0.29 |
| Bilirubin | 0.71 ± 0.50 | 0.64 ± 0.29 | 0.40 |
| Tumor burden | |||
| % tumor volume in treated liver | 22% ± 26% | 18% ± 16% | 0.36 |
| Extrahepatic disease | 39 (68%) | 38 (67%) | 1.0 |
| CEA (for colorectal) | 520 ± 1100 | 870 ± 2400 | 0.53 |
| Prior chemotherapy | 48 (84%) | 47 (82%) | 1.0 |
| Lung shunt fraction | 5.1% ± 3.7% | 4.8% ± 3.3% | 0.68 |
| Treatment volume (cm3) | 1200 ± 600 | 1100 ± 500 | 0.17 |
| T:N ratio (MAA scan) | 3.0 ± 3.2 | 3.6 ± 3.7 | 0.31 |
Glass versus resin microspheres
The mean particle density over the entire treatment volume was 12600 ± 5000 particles/cm3 for resin and 3700 ± 3400 particles/cm3 for glass microspheres. The mean dose over the entire treatment volume was 44 ± 15 Gy for resin and 127 ± 13 Gy for glass microspheres. Despite these large differences in dose and particle density, there was no difference in local progression-free survival or overall survival after resin versus glass microspheres (Figure 1).
Figure 1.
No difference in local progression-free survival (A), or overall survival (B), after radioembolization using resin (red) versus glass (blue) microspheres. Median LPFS: 4.3 months (resin) versus 4.8 months (glass), p=0.75. Median overall survival: 8.4 months (resin) versus 7.9 months (glass), p=0.32.
However, subgroup analysis (Supplemental Table 1) shows that hypervascular tumors (T:N ratio ≥ 3.3 on MAA scan) have better local progression free survival (LPFS) with glass microspheres, compared to resin (9 versus 2 months, p=0.003). Less vascular tumors (T:N ratio < 1.5 on MAA scan) have better LPFS with resin microspheres, compared to glass (6 versus 2 months, p=0.008). There was a trend towards improved overall survival when hypervascular tumors were treated using glass microspheres (p=0.06), and a trend towards improved overall survival when less vascular tumors were treated using resin microspheres (p=0.08). There was no benefit to using resin microspheres for large tumor volumes, compared to glass, in terms of local progression free survival (p=0.17) or overall survival (p=0.54).
The subgroup analysis suggests that the optimal particle density depends on the T:N ratio from the MAA scan. The cutoffs that maximize the difference in LPFS between the groups, are: T:N ratio ≥ 2.6, and particle density ≥ 6000 particles/cm3 over the entire treatment volume. Using the 6000 particles/cm3 cutoff, 91% (52 of 57) of resin treatments were classified as high particle density, and 84% (48 of 57) of glass treatments were classified as low particle density.
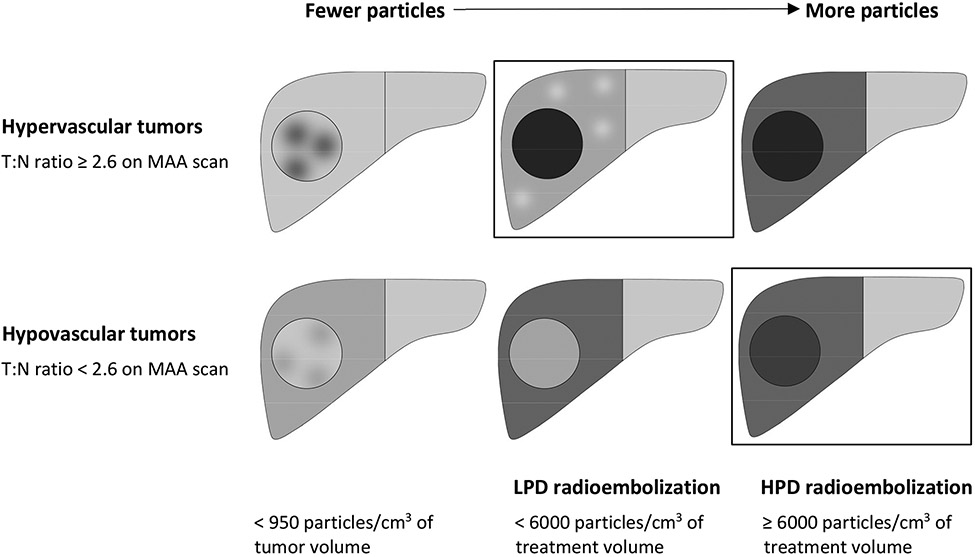
Hypervascular tumors benefitted from low particle density (LPD) radioembolization, and less vascular tumors benefitted from high particle density (HPD) radioembolization (Figure 2). Using the optimal particle density resulted in improved local progression free survival (7.1 vs 3.0 months, p=0.0007) and improved overall survival (11.5 vs 6.8 months, p=0.047), compared to using suboptimal particle density (Supplemental Figure 2).
Figure 2.
Optimal particle density depends on tumor vascularity. Graphs show local progression-free survival, for hypervascular (A) or less vascular (B) tumors, treated with high particle density (HPD; red) versus low particle density (LPD; blue) radioembolization. For hypervascular tumors (T:N ratio ≥ 2.6), delivering fewer particles (<6000 particles/cm3) was associated with better LPFS (p=0.03). For less vascular tumors (T:N ratio < 2.6), delivering more particles (≥6000 particles/cm3) was associated with better LPFS (p=0.02). The T:N ratio was measured on the MAA scan. The particle density refers to the mean particle density over the entire treatment volume. The differences in optimal particle density for hypervascular versus less vascular tumors could be explained by the changes in T:N ratios as more particles are delivered (Figure 3, Table 2).
T:N ratio is affected by the number of particles delivered
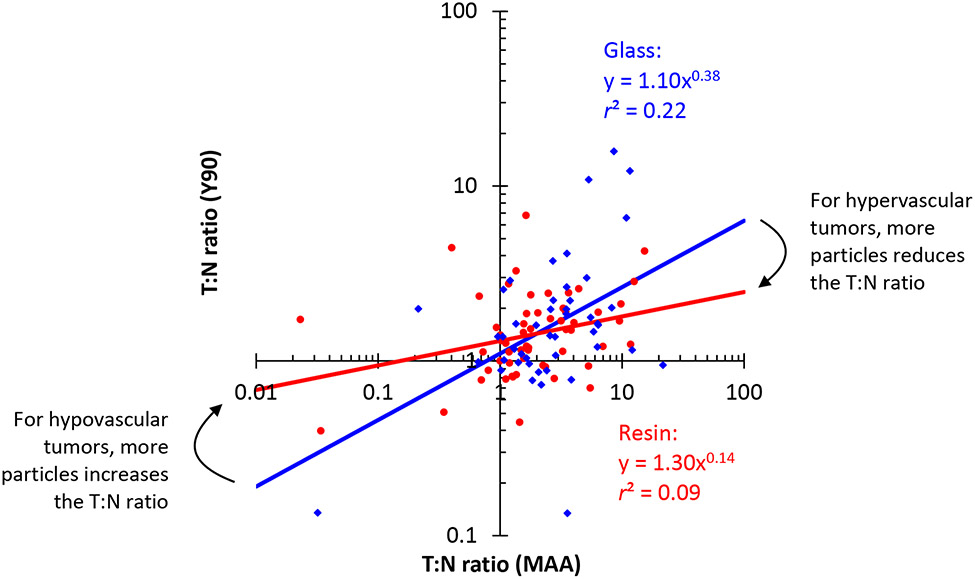
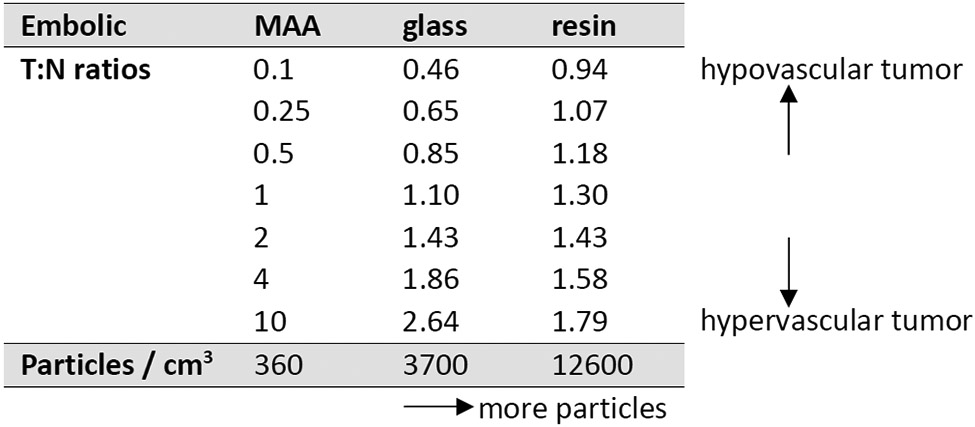
The T:N ratio is a measure of tumor vascularity, and it also gives the ratio of tumor dose to liver dose. However, T:N ratios on MAA scans systematically overestimated the ratios seen on post-Y90 scans (Figure 3, Table 2). As more particles are delivered, doses become more uniform, and T:N ratios become less extreme.
Figure 3.
The T:N ratio changes as more particles are delivered. Glass microspheres show a greater correlation between T:N ratio on 99mTc-MAA SPECT/CT and post-90Y bremsstrahlung SPECT/CT, compared to resin. Each point represents 1 patient. The blue points (♦) and regression line show results for glass microspheres, and the red points (•) and regression line show results for resin microspheres (power law regression on a log-log plot). The regression lines for glass versus resin microspheres have different exponents (p=0.04). The differences in T:N ratios can be explained by the particle flow model in Supplemental Materials.
Table 2.
The T:N ratio changes as more particles are delivered. For hypervascular tumors, glass results in better T:N ratio than resin. For hypovascular tumors, resin results in better T:N ratio than glass. Mean particle density over the entire treatment volume is listed for 99mTc-MAA versus 90Y-glass versus 90Y-resin, as well as T:N ratios from the regression lines in Figure 3.
|
Although the correlation between T:N ratio on MAA scan and post-90Y scan is weak, the slope is higher and the correlation is stronger for glass microspheres, compared to resin (Figure 3, Table 2). The regression lines cross at a T:N ratio of 2 (MAA scan). As a result, for hypervascular tumors (T:N ratio >2 on MAA scan), the regression lines predict a higher T:N ratio on the post-90Y scan for glass microspheres, compared to resin. For less vascular tumors (T:N ratio <2 on MAA scan), resin microspheres are predicted to have a higher T:N ratio on the post-90Y scan, compared to glass.
The shifting T:N ratios suggest that particles initially flow to the most vascular areas, and as more particles are delivered, they start to flow to less vascular areas. In Supplemental Materials, we present a simple physical model of particle flow during embolization. Particle flow to tumor and liver was simulated using a physical model including vascular resistance, and capacitance for receiving embolic particles. Particles initially flow towards low resistance arteries, then shift towards high capacitance arteries as embolization approaches stasis.
Microdosimetry simulations quantify cold spots between particles
Doses calculated from SPECT/CT are mean doses over a volume larger than about 1 cm3. On the other hand, microdosimetry simulations provide information on dose heterogeneity on a microscopic scale (down to resolution of individual microspheres), due to random gaps between particles.
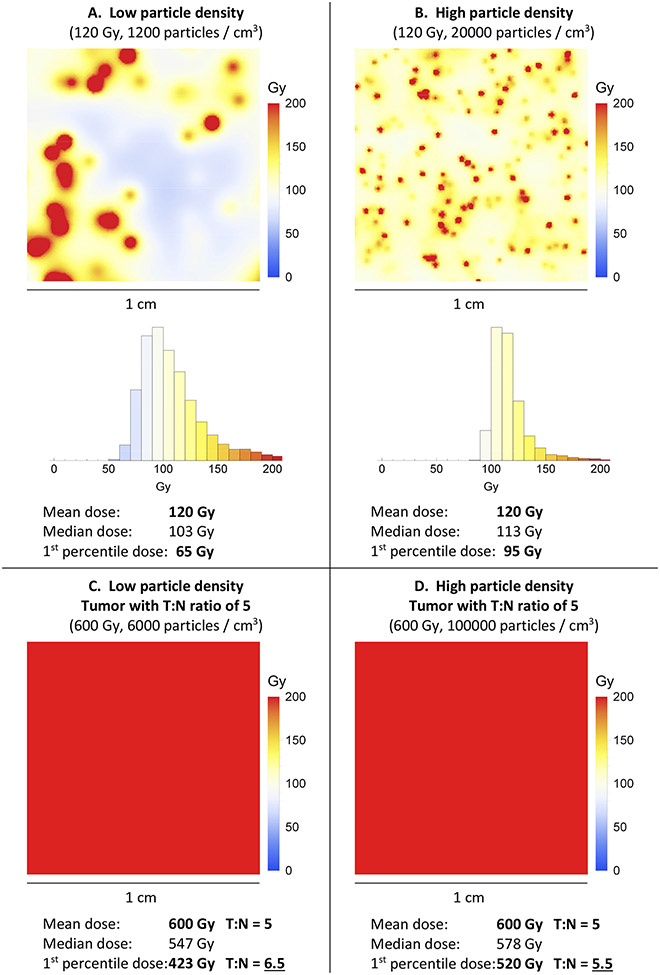
Microdosimetry maps (Figure 4) show that the mean dose (Gy) in the liver or tumor can be misleading: the dose can be much higher immediately next to a 90Y microsphere, and much lower in the gaps between microspheres. The 1st percentile dose provides an estimate of the “minimum” dose in the gaps between particles.
Figure 4.
A and B: Microdosimetry maps (1×1 cm) showing 120 Gy (mean dose), achieved using low versus high particle density. Although the mean dose is the same in both microdosimetry maps, the dose distribution is not the same. With low particle density, there are cold spots between particles. C and D: Corresponding microdosimetry heat maps and doses in a homogeneous hypervascular tumor, with a T:N ratio of 5 (which means 5 times the mean dose, and 5 times the particle density). In this example, for both low and high particle density, the dose is uniformly therapeutic throughout the tumors.
High particle density results in a more uniform dose distribution, with smaller hot spots as well as smaller cold spots (Figure 4A versus B). Cold spots are presumably helpful when they occur in normal liver, but harmful when they occur in tumor. The difference in 1st percentile dose could explain why 120 Gy glass, 120 Gy resin, and 120 Gy external beam radiation are not equivalent.
In Figure 4, low particle density appears to be helpful for hypervascular tumors (better 1st percentile T:N ratio), because the tumor dose is uniformly therapeutic, while the normal liver is protected by cold spots. In a hypovascular tumor, the situation is reversed, because low particle density translates into cold spots in the tumor.
The conclusion from the simulated microdosimetry heat maps (Figure 4) is consistent with the retrospective data (Figure 2), which showed improved outcomes when hypervascular tumors were treated with low particle density, and hypovascular tumors were treated with high particle density.
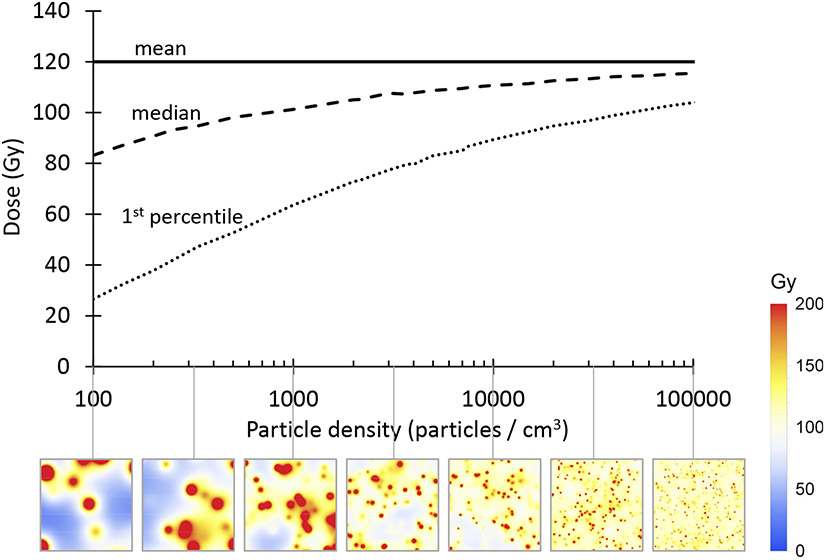
The relationship between mean, median, and 1st percentile dose, as a function of particle density, is shown in Figure 5. The 1st percentile dose decreases when the particle density is decreased, due to random gaps between particles.
Figure 5.
Mean, median, and 1st percentile doses, as a function of particle density, with corresponding microdosimetry maps (1×1 cm). Cold spots are seen between particles when the particle density is low. The 1st percentile tumor dose was a better predictor of LPFS and overall survival than the mean tumor dose.
Mean doses can be converted into median or 1st percentile doses, using the curves in Figure 5. Empirically, the 1st percentile dose can be estimated using the formula:
where
= particle density (particles / cm3)
= mean dose (Gy) from post-90Y SPECT/CT
This approximation has a maximum error of <1%, in the range 100 ≤ ≤ 100000. Microdosimetry simulation to estimate the 1st percentile dose takes 3.3 hours on a laptop computer, compared to <0.001 seconds using the formula (=100000, Intel Core i7 CPU at 2.6 GHz). The formula enables routine use of microdosimetry, without requiring special software.
1st percentile tumor dose is a better predictor of LPFS and survival than mean tumor dose
To validate the clinical utility of the 1st percentile dose formula, we examined the predictive value of mean versus 1st percentile tumor dose. Mean tumor dose did not predict local progression free survival (p=0.42) or overall survival (p=0.44) in our patient population (Table 3). However, 1st percentile tumor dose (which accounts for the effects of particle density), was correlated with both LPFS (p=0.025) and overall survival (p=0.023; Table 4).
Table 3.
Predictors of local progression free survival after radioembolization. Variables with p<0.1 in the univariate model were included in the multivariate model. RR = relative risk of progression. All patients in this study received standard 120 Gy (glass) or BSA (resin) dosing, and patients who received a higher dose (radiation segmentectomy or lobectomy) were excluded. The lack of variation in dosing, combined with the wide variation in number of particles delivered, could explain the lack of correlation between mean dose and outcomes in this study.
| Univariate | Multivariate | |||
|---|---|---|---|---|
| RR | p | RR | p | |
| Age | 1.0 | 0.78 | ||
| Primary site | ||||
| Breast | 0.88 | 0.60 | ||
| Colorectal | 1.3 | 0.17 | ||
| Other or unknown | 1 | |||
| Child Pugh score | 1.2 | 0.33 | ||
| CEA | 1.0003 | < 0.001 * | 1.0003 | < 0.001 * |
| Extrahepatic disease | 1.6 | 0.025 * | 1.5 | 0.058 |
| Percent liver replaced with tumor | 1.9 | 0.15 | ||
| Lung shunt fraction | 21 | 0.23 | ||
| T:N ratio on MAA scan | 1.0 | 0.88 | ||
| Tumor dose (mean) | 1.0 | 0.42 | ||
| Tumor dose (1st percentile) | 0.997 | 0.025 * | 0.997 | 0.028 * |
| Liver dose (mean) | 1.0 | 0.57 | ||
| Liver dose (1st percentile) | 1.0 | 0.58 | ||
Table 4.
Predictors of overall survival after radioembolization. Variables with p<0.1 in the univariate model were included in the multivariate model. RR = relative risk of death.
| Univariate | Multivariate | |||
|---|---|---|---|---|
| RR | p | RR | P | |
| Age | 1.0 | 0.59 | ||
| Primary site | ||||
| Breast | 1.0 | 0.94 | ||
| Colorectal | 1.3 | 0.29 | ||
| Other or unknown | 1 | |||
| Child Pugh score | 1.3 | 0.19 | ||
| CEA | 1.0003 | 0.001 * | 1.0002 | 0.046 * |
| Extrahepatic disease | 1.6 | 0.059 | 1.3 | 0.30 |
| Percent liver replaced with tumor | 5.8 | < 0.001 * | 3.9 | 0.0039 * |
| Lung shunt fraction | 430 | 0.04 * | 110 | 0.17 |
| T:N ratio on MAA scan | 1.0 | 0.62 | ||
| Tumor dose (mean) | 1.0 | 0.44 | ||
| Tumor dose (1st percentile) | 0.996 | 0.023 * | 0.997 | 0.097 |
| Liver dose (mean) | 1.0 | 0.24 | ||
| Liver dose (1st percentile) | 0.991 | 0.059 | 1.0 | 0.94 |
Discussion
Our original hypothesis — that large and hypervascular tumors would benefit from more particles [1] — was not supported by the data. There is some intuitive appeal to the idea that, since large hypervascular tumors can take more particles before reaching stasis, that they would benefit from more particles. But the data shows that it is actually hypovascular tumors that benefit from more particles.
Two things happen to the dose distribution when you deliver more particles. First, particles initially flow to more vascular regions of the treatment volume, and as more particles are delivered, they start to flow to less vascular regions (Figure 3 and Table 2). Second, on a microscopic level, as the less vascular regions fill up with particles, gaps between particles are filled, and the 1st percentile dose rises faster than the mean dose (Figure 5). As a result of both of these phenomena, doses become more uniform throughout the treatment volume as more particles are delivered. Thus, hypervascular tumors have better tumor-to-normal ratio when treated with low particle density (LPD) radioembolization (<6000 particles/cm3 of treatment volume), resulting in increased tumor dose, decreased liver dose, and improved local progression-free survival (Figure 2). On the other hand, hypovascular tumors have better tumor-to-normal ratio when treated with high particle density (HPD) radioembolization (≥ 6000 particles/cm3 of treatment volume), resulting in increased tumor dose, decreased liver dose, and improved local progression-free survival.
These changes in dose distribution are summarized in the schematic diagram shown in Figure 6. For hypervascular tumors, particles initially flow to the hot spots in a heterogeneous tumor (left). As the interventional radiologist delivers more particles, the tumor fills up, while the liver is protected by cold spots (middle); this is the optimal endpoint for hypervascular tumors. As the embolization gets closer to stasis, particles start to flow more into the normal liver (right). For hypovascular tumors, gaps between particles, and cold spots due to tumor heterogeneity are a bigger problem, because of the lower particle density in the tumor (left). Particles initially flow mostly to the liver, because of the poor tumor vascularity (middle). More particles are eventually able to overcome the poor tumor vascularity, resulting in better tumor specificity as the embolization gets closer to stasis (right); this is the optimal endpoint for hypovascular tumors.
Figure 6.
The particle distribution changes as more particles are delivered. Boxes are drawn around the ideal embolization endpoints, which maximize the tumor dose and minimize the liver dose. Darker shading indicates higher particle density. For hypervascular tumors, enough particles should be delivered to fill up the tumor, but embolization should be stopped when particles start to flow mostly to liver. For hypovascular tumors, more particles can be needed to overcome the poor tumor vascularity. Using the optimal particle density resulted in improved local progression free survival and improved overall survival, compared to using suboptimal particle density. Particle density and T:N ratio cutoffs in this figure are based on data from Figure 2 and Supplemental figure 1.
The tumor-to-normal ratio (tumor dose divided by liver dose) is a key variable in arterially directed therapies. A high tumor-to-normal ratio indicates a high degree of specificity for tumor — high tumor dose and low liver dose — which should improve efficacy and reduce side effects. Although the tumor-to-normal ratio is related to tumor vascularity, it can also be modulated by changes in technique. Here, we show that the number of particles delivered by the interventional radiologist can affect the tumor-to-normal ratio, because the particle distribution changes over the course of embolization. Other techniques that might improve the tumor-to-normal ratio include: using an antireflux or balloon microcatheter to change blood flow [11; 16], use of a temporary embolic to protect branches supplying normal liver [5], or using a vasoconstrictor to preferentially constrict non-tumor vessels [18].
The data show that the tumor-to-normal ratio can flip during the course of embolization. For hypervascular tumors, particles mostly flow to tumor at the beginning, and then flow to liver at the end of embolization. For hypovascular tumors, particles mostly flow to liver at the beginning, and then flow to tumor at the end of embolization. Thus, the optimal embolization endpoint varies, based on the tumor vascularity. A simple blood flow model that explains these results is provided in Supplemental Materials.
Mean tumor doses for glass and resin are not comparable: gaps between particles produce heterogeneity in microdosimetry, resulting in a lower effective dose for glass microspheres [10; 14; 19]. Here, we present a simple formula for calculating the 1st percentile dose, which is the dose seen in the cold spots between particles. We show that the 1st percentile dose is a better predictor of local progression-free survival and overall survival, than the mean tumor dose. The 1st percentile dose accounts for the effects of particle density, and thus allows us to compare glass and resin doses on the same scale.
Limitations of this study include the fact that 90Y bremsstrahlung SPECT/CT is not as accurate as 90Y-PET/CT [6], and the correlation between T:N ratio on MAA scan and post-90Y scan is weak. We only examined standard dosing (120 Gy for glass, and BSA for resin) for lobar treatments, so the findings might not be applicable to other dosing methods. Specifically, caution should be exercised before routinely performing HPD lobar treatments using 120 Gy dosing, since the safety of 120 Gy lobar radioembolization has mostly been studied in the setting of LPD radioembolization [10]. We did not examine tumor heterogeneity, but we predict that tumors with both hypervascular and hypovascular regions could require high particle density to treat the hypovascular portions of the tumor. Some alternative hypotheses have not been excluded — for example, the differences between glass and resin particles could be caused by differences in the properties of the particles or delivery methods, and the differences between hypervascular and hypovascular tumors could be caused by differences in sensitivity to ischemia or radiation. There could be an embolic effect at higher particle densities, causing hypoxia-induced cell death that supplements the radiation-induced cell death. Most patients in this study had liver metastases, and it’s unknown whether these results are applicable to patients with hepatocellular carcinoma.
In conclusion, for hypervascular tumors, LPD radioembolization (few hot particles) provides better tumor specificity due to flow selectivity to tumor, resulting in improved local progression-free survival. For less vascular tumors, HPD radioembolization (many cold particles) enabled better penetration of the poor tumor vascularity, thus boosting the tumor dose, resulting in improved local progression-free survival. A recent trial showed that optimizing the prescribed activity, based on the tumor vascularity, results in improved response [7]. Future radioembolization trials should also examine optimal particle density, which can be adjusted independently of the prescribed activity. Similar principles could be relevant for determining the optimal embolization endpoint and drug loading for chemoembolization.
Supplementary Material
Acknowledgements
Assen S. Kirov helped with T:N ratio measurements. Chris Crane suggested looking at the minimum tumor dose, rather than the mean tumor dose. Daniel Kelly wrote queries to extract information from our hospital’s clinical database. This research was funded in part through an NIH/NCI Cancer Center Support Grant to MSKCC (P30 CA008748), and by City of Hope National Medical Center.
Footnotes
Publisher's Disclaimer: This version of the article has been accepted for publication, after peer review, but is not the Version of Record and does not reflect post-acceptance improvements, or any corrections. The Version of Record is available online at: https://doi.org/10.1007/s00270-022-03139-6
Publisher's Disclaimer: Use of this Accepted Version is subject to the publisher’s Accepted Manuscript terms of use: https://www.springernature.com/gp/open-research/policies/accepted-manuscript-terms
Disclosures
FEB is a co-founder of Claripacs, LLC. He received research support (investigator-initiated) from GE Healthcare. He received research grants from the US Department of Defense, Thompson Family Foundation, and Brockman Medical Research Foundation. He received research supplies (investigator-initiated) from Bayer, Steba Biotech, and Terumo. He received a research grant and speaker fees from Society of Interventional Oncology, which were sponsored by Guerbet. He attended research meetings sponsored by Guerbet. He is an investor in Labdoor, Qventus, CloudMedx, Notable Labs, and Xgenomes. He is the inventor and assignee on US patent 8233586, and is an inventor on US provisional patent applications 62/754,139 and 62/817,116.
EZ received research grants from: Society of Interventional Radiology, Radiological Society of North America, North American Neuroendocrine Tumor Society, American Association for Cancer Research, Druckenmiller Foundation, Memorial Sloan Kettering Cancer Center, Ethicon, and Novartis.
CS received grants from NIH/NCI, Boston Scientific / BTG, Ethicon, and SIRTEX. He received personal fees from Boston Scientific/BTG, Terumo, Varian, Ethicon, and SIRTEX.
HY is an advisory board member of BD Medical.
References
- 1.Boas FE, Bodei L, Sofocleous CT (2017) Radioembolization of Colorectal Liver Metastases: Indications, Technique, and Outcomes. J Nucl Med, 58(Suppl 2):104S–111S [DOI] [PMC free article] [PubMed] [Google Scholar]
- 2.Boas FE, Sofocleous CT (2020) Embolotherapy for the management of liver malignancies other than hepatocellular carcinoma. In: Mauro MA, Murphy KP, Thomson KR, Venbrux AC, Morgan RA, (eds) Image-Guided Interventions, 3rd ed. Elsevier, Philadelphia, pp 297–300 [Google Scholar]
- 3.Braat MN, van Erpecum KJ, Zonnenberg BA, van den Bosch MA, Lam MG (2017) Radioembolization-induced liver disease: a systematic review. Eur J Gastroenterol Hepatol, 29(2):144–152 [DOI] [PubMed] [Google Scholar]
- 4.Budczies J, Klauschen F, Sinn BV, et al. (2012) Cutoff Finder: a comprehensive and straightforward Web application enabling rapid biomarker cutoff optimization. PloS one, 7(12):e51862. [DOI] [PMC free article] [PubMed] [Google Scholar]
- 5.Core JM, Frey GT, Sharma A, et al. (2020) Increasing Yttrium-90 Dose Conformality Using Proximal Radioembolization Enabled by Distal Angiosomal Truncation for the Treatment of Hepatic Malignancy. J Vasc Interv Radiol, 31(6):934–942 [DOI] [PubMed] [Google Scholar]
- 6.Elschot M, Vermolen BJ, Lam MG, de Keizer B, van den Bosch MA, de Jong HW (2013) Quantitative comparison of PET and Bremsstrahlung SPECT for imaging the in vivo yttrium-90 microsphere distribution after liver radioembolization. PLoS One, 8(2):e55742. [DOI] [PMC free article] [PubMed] [Google Scholar]
- 7.Garin E, Tselikas L, Guiu B, et al. (2021) Personalised versus standard dosimetry approach of selective internal radiation therapy in patients with locally advanced hepatocellular carcinoma (DOSISPHERE-01): a randomised, multicentre, open-label phase 2 trial. Lancet Gastroenterol Hepatol, 6(1):17–29 [DOI] [PubMed] [Google Scholar]
- 8.Hermann AL, Dieudonne A, Ronot M, et al. (2020) Relationship of Tumor Radiation-absorbed Dose to Survival and Response in Hepatocellular Carcinoma Treated with Transarterial Radioembolization with (90)Y in the SARAH Study. Radiology, 296(3):673–684 [DOI] [PubMed] [Google Scholar]
- 9.Horsman MR, Overgaard J (2016) The impact of hypoxia and its modification of the outcome of radiotherapy. J Radiat Res, 57 Suppl 1:i90–i98 [DOI] [PMC free article] [PubMed] [Google Scholar]
- 10.Pasciak AS, Abiola G, Liddell RP, et al. (2020) The number of microspheres in Y90 radioembolization directly affects normal tissue radiation exposure. Eur J Nucl Med Mol Imaging, 47(4):816–827 [DOI] [PubMed] [Google Scholar]
- 11.Pasciak AS, McElmurray JH, Bourgeois AC, Heidel RE, Bradley YC (2015) The impact of an antireflux catheter on target volume particulate distribution in liver-directed embolotherapy: a pilot study. J Vasc Interv Radiol, 26(5):660–669 [DOI] [PubMed] [Google Scholar]
- 12.Ridouani F, Soliman MM, England RW, et al. (2021) Relationship of radiation dose to efficacy of radioembolization of liver metastasis from breast cancer. Eur J Radiol, 136:109539. [DOI] [PMC free article] [PubMed] [Google Scholar]
- 13.Sarwar A, Ali A, Ljuboja D, et al. (2021) Neoadjuvant Yttrium-90 Transarterial Radioembolization with Resin Microspheres Prescribed Using the Medical Internal Radiation Dose Model for Intrahepatic Cholangiocarcinoma. J Vasc Interv Radiol, 32(11):1560–1568 [DOI] [PubMed] [Google Scholar]
- 14.Spreafico C, Maccauro M, Mazzaferro V, Chiesa C (2014) The dosimetric importance of the number of 90Y microspheres in liver transarterial radioembolization (TARE). Eur J Nucl Med Mol Imaging, 41(4):634–638 [DOI] [PubMed] [Google Scholar]
- 15.Stabin MG, Eckerman KF, Ryman JC, Williams LE (1994) Bremsstrahlung radiation dose in yttrium-90 therapy applications. J Nucl Med, 35(8):1377–1380 [PubMed] [Google Scholar]
- 16.Titano JJ, Fischman AM, Cherian A, et al. (2019) End-hole Versus Microvalve Infusion Catheters in Patients Undergoing Drug-Eluting Microspheres-TACE for Solitary Hepatocellular Carcinoma Tumors: A Retrospective Analysis. Cardiovasc Intervent Radiol, 42(4):560–568 [DOI] [PMC free article] [PubMed] [Google Scholar]
- 17.van den Hoven AF, Rosenbaum CE, Elias SG, et al. (2016) Insights into the Dose-Response Relationship of Radioembolization with Resin 90Y-Microspheres: A Prospective Cohort Study in Patients with Colorectal Cancer Liver Metastases. J Nucl Med, 57(7):1014–1019 [DOI] [PubMed] [Google Scholar]
- 18.van den Hoven AF, Smits ML, Rosenbaum CE, Verkooijen HM, van den Bosch MA, Lam MG (2014) The effect of intra-arterial angiotensin II on the hepatic tumor to non-tumor blood flow ratio for radioembolization: a systematic review. PLoS One, 9(1):e86394. [DOI] [PMC free article] [PubMed] [Google Scholar]
- 19.Walrand S, Hesse M, Jamar F, Lhommel R (2014) A hepatic dose-toxicity model opening the way toward individualized radioembolization planning. J Nucl Med, 55(8):1317–1322 [DOI] [PubMed] [Google Scholar]
Associated Data
This section collects any data citations, data availability statements, or supplementary materials included in this article.


