

Abstract
The invasive trophoblast cell lineage in rat and human share crucial responsibilities in establishing the uterine-placental interface of the hemochorial placenta. These observations have led to the rat becoming an especially useful animal model to study hemochorial placentation. However, our understanding of similarities or differences between regulatory mechanisms governing rat and human invasive trophoblast cell populations is limited. In this study, we generated single-nucleus (sn) ATAC-seq data from gestation day (gd) 15.5 and 19.5 rat uterine-placental interface tissues and integrated the data with single-cell RNA-seq data generated at the same stages. We determined the chromatin accessibility profiles of invasive trophoblast, natural killer, macrophage, endothelial, and smooth muscle cells, and compared invasive trophoblast chromatin accessibility to extravillous trophoblast (EVT) cell accessibility. In comparing chromatin accessibility profiles between species, we found similarities in patterns of gene regulation and groups of motifs enriched in accessible regions. Finally, we identified a conserved gene regulatory network in invasive trophoblast cells. Our data, findings and analysis will facilitate future studies investigating regulatory mechanisms essential for the invasive trophoblast cell lineage.
Keywords: trophoblast, placentation, single cell genomic analysis, rat
INTRODUCTION
Hemochorial placentation is a reproductive strategy utilized by some mammals, including the mouse, rat, and human [1]. This type of placentation involves establishment of a uterine-placental interface characterized by trophoblast cells of extraembryonic origin breaching the maternal vasculature [1]. Trophoblast cells are the parenchymal cells of the placenta [2–4]. Their origins can be traced to the trophectoderm of the early embryo and the initial cell differentiation event during embryogenesis [5,6]. Trophoblast cells differentiate into a range of specialized lineages [3–5]. Among the specialized trophoblast cell lineages are invasive trophoblast (generic term) or extravillous trophoblast (EVT, human/primate specific term). These cells exit the placenta and enter the uterine compartment where they transform the vasculature and immune environment into a structure ensuring placental and fetal viability and growth [3,4,7]. Failures in invasive trophoblast/EVT cell differentiation and function result in a range of pregnancy diseases such as preeclampsia, intrauterine growth restriction, and preterm birth [8,9]. Deep trophoblast cell invasion and uterine transformation are characteristic features of rat and human placentation sites [10–13]. Identification of potential regulatory mechanisms controlling cellular constituents of the rodent and human uterine-placental interface have emerged from single-cell RNA-sequencing (scRNA-seq) [14–20]. Conserved sets of transcripts have been identified in rat invasive trophoblast and human EVT cells [20]. These insights have led to the identification of candidate regulators of invasive trophoblast and EVT cell lineages and dissection of their biological relevance using trophoblast stem (TS) cells and rat models [21–23]. Such experimentation has advanced the field but on its own is an inefficient strategy for defining gene regulatory networks driving invasive trophoblast/EVT cell lineage development and function.
Gene regulatory networks can be accessed through genome-wide analysis of the chromatin landscape [24–27]. Indeed, insights into the hierarchical regulation of rodent and human trophoblast cell development have been achieved through deep sequencing of histone modifications defining gene activation and repression states [28–36]. The integration of transcriptome and chromatin accessibility datasets has also been used as an effective tool to elucidate gene regulatory networks in trophoblast tissue and cells [37,38].
In this report, we interrogated the chromatin landscape of invasive trophoblast cells isolated from the uterine-placental interface of the rat using single-nucleus assay for transposase-accessible chromatin-sequencing (snATAC-seq). These datasets were integrated with scRNA-seq datasets from rat and human invasive trophoblast/EVT cells [20], as well as ATAC-seq from EVT cells [39], to identify conserved gene regulatory networks controlling the invasive trophoblast cell lineage.
RESULTS
Identification of chromatin accessibility profiles in cell types of the rat uterine-placental interface
We generated snATAC-seq profiles from gestation day (gd) 15.5 and 19.5 uterine-placental interface tissue of the rat to determine chromatin accessibility of its cellular constituents. These datasets were integrated with scRNA-seq profiles obtained from the same tissues [20].
Following quality control and preprocessing (Figs. S1 and S2), we obtained 25,321 and 14,388 high quality nuclei in the gd 15.5 and gd 19.5 samples, respectively (Table S1). Next, snATAC-seq data was integrated with scRNA-seq data [20] to identify cell populations based on the relationship between accessibility and gene expression profiles [40] (Fig. 1A). Clusters and chromatin accessibility profiles of invasive trophoblast, natural killer, macrophage, endothelial, and smooth muscle cells were identified (Table S1).
Fig. 1. Chromatin accessibility profiles of cell populations at the uterine-placental interface.

A) UMAP of snATAC-seq profiles at gestation day (gd) 15.5 and 19.5 showing cell identities obtained by transferring labels from scRNA-seq data. B) Dot plots showing known markers of cell types generally have higher accessibility within 2,000 base pairs (bp) of the transcription start sites (TSS) and in a higher percent of nuclei than in other cell populations. Dot sizes correspond to the percent of nuclei in each cell population that were open around the TSS; colors correspond to the levels of predicted gene activity. C) Stack bar plots showing that cell type-specific open chromatin peaks were most often distal to the TSS. For distribution of distances for each individual cell type see Fig. S4. D) Bar plots showing the number of open chromatin peaks specific to a cell population, and the number of nearest genes to cell-specific open chromatin peaks. Cell specific open chromatin peaks are open chromatin peaks differentially accessible in the cell population compared to all other cell populations (adjusted p-value ≤ 0.05, average log2(fold change) ≥ log2(1.5)).
These analyses are based on an assumption that there is a significant correlation between gene expression level (scRNA-seq data) and chromatin accessibility (snATAC-seq data) [40]. Therefore, as a quality control step for the snATAC-seq cluster labeling, we calculated the Spearman correlation between gene expression and chromatin accessibility profiles. We obtained moderate but significant correlations (0.44≤ρ≤0.54, p-value<2.2e-16) in all cell populations (Fig. S3), which agrees with previous studies done at the both single cell and tissue levels [38,41,42]. Moreover, we observed that established marker gene expression for each cell population are generally more accessible in the respective cell population (Fig. 1B), demonstrating we have obtained high quality clustering and cluster annotation.
We further performed differential accessibility analysis at both gestation days to identify the most accessible peaks in each cell type (defined as cell type-specific peaks). The distance distribution of cell type-specific peaks to the nearest gene transcription start site (TSS) showed, that in general, most of the cell type-specific peaks are distal to the TSS (>5 kb) (81.65% at gd 15.5, and 75.16% at gd 19.5) (Fig. 1C, Fig. S4). Moreover, we observed that the invasive trophoblast cell population had the highest number of cell type-specific peaks of the major cell types analyzed, despite being of less abundance than some other cell types (Fig. 1D). Related to this, the invasive trophoblast cell population had the most gene-associated accessible chromatin among the cell types identified.
Identification of invasive trophoblast cell regulated genes using cell type-specific chromatin accessibility profiles
Following the observation that invasive trophoblast cells had the most cell type-specific peaks, we next checked the number of peaks associated with each gene at each gestation day. At both gestational timepoints, there were many genes associated with at least two open regions (808 and 349 genes at gd 15.5 and 19.5, respectively) (Fig. 2A). Next, we investigated the differences in expression levels of transcripts linked to 2, 3, 4, or 5 peaks using the average expression level obtained from the scRNA-seq data. In general, we observed an increasing trend of expression level when a transcript is associated with more peaks. Furthermore, we observed that while gd 15.5 expression levels were significantly different as the number of associated peaks increased, at gd 19.5, transcript expression profiles were not significantly different when more peaks were associated with a transcript after a cut-off of 3 (Fig. S5). Therefore, we partitioned transcripts into two groups for the next analyses: ≥3 peaks or <3 peaks. At both gestation days, genes with more than three peaks had significantly higher expression than genes with less than three peaks (p-value=7.029e-09 and 1.374e-08 at gd 15.5 and 19.5, respectively) (Fig. 2B), suggesting that, in general, genes with ≥3 trophoblast-specific peaks are more active within the cell population and could have important functional roles for trophoblast cells. However, there are notable exceptions, including Prl7b1 (Table S2), which has <3 peaks, but whose expression is specific and among the highest in the invasive trophoblast cell lineage.
Fig. 2. Analysis of chromatin accessibility profiles can identify regulatory regions for genes defining the invasive trophoblast cell population.
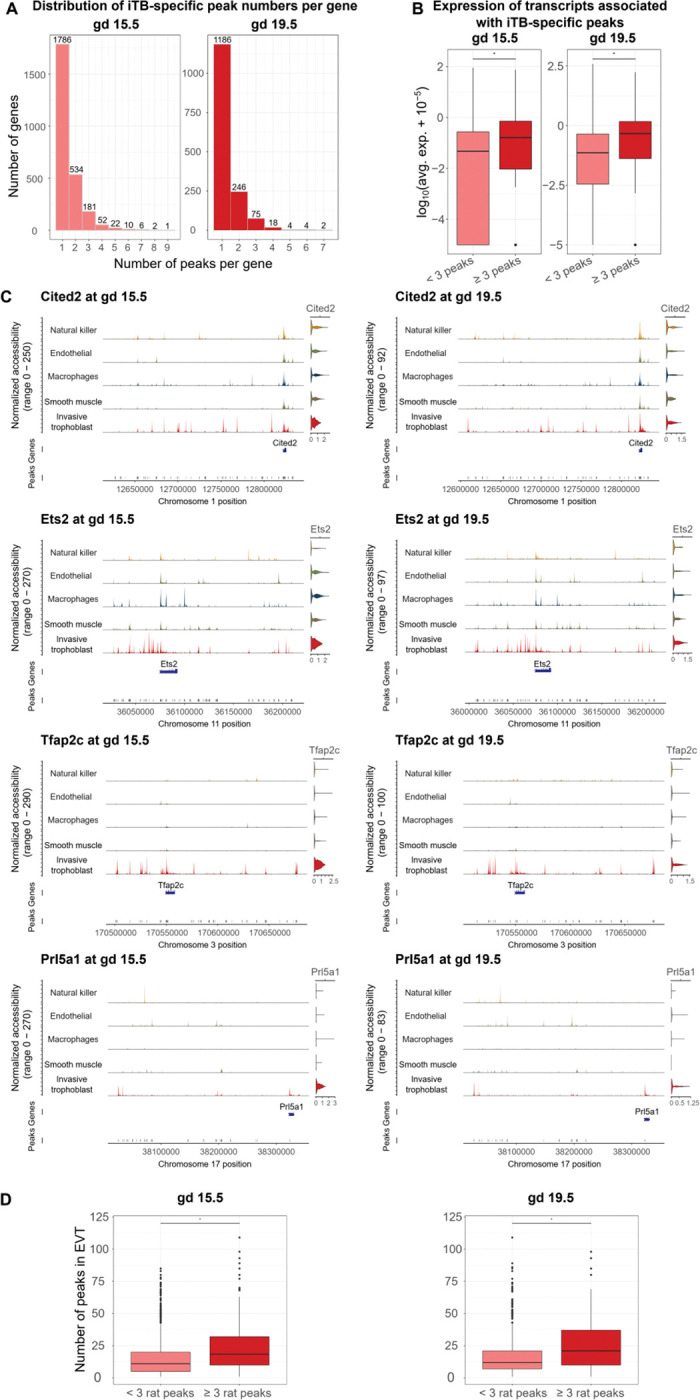
A) Histograms of the number of invasive trophoblast-specific (iTB-specific) peaks per gene showing that many genes had ≥1 peaks. The x-axis shows the number of peaks per gene, and the y-axis shows the number of genes. B) Boxplots of transcript expression associated with iTB-specific peaks showing that genes with ≥3 peaks had significantly higher expression than genes with fewer than 3 peaks. Expression was plotted in a log10(average expression + 10−5) scale. C) Examples of iTB-specific genes with ≥3 associated peaks at both gd 15.5 and 19.5. For each subplot, the first section was composed of five tracks of normalized accessibility, corresponding to five cell types. The right-most column of the first section shows the predicted gene activity using chromatin accessibility within 2,000 bp of the TSS. The second and third section include two tracks corresponding to gene location and open chromatin peak locations, respectively. D) Boxplots of the number of conserved ATAC-seq peaks in EVT cells and rat invasive trophoblast cells. Rat genes with ≥3 invasive trophoblast cell-specific peaks had significantly more EVT cell ATAC-seq peaks than rat genes with <3 invasive trophoblast cell-specific peaks. ATAC-seq peaks in EVT cells were obtained from Varberg et al. [39]. Statistical analyses were performed using Wilcoxon rank sum tests at a significance level of 0.05.
In addition, we compared transcripts with ≥3 open regions to transcripts with invasive trophoblast cell cluster-specific expression (invasive trophoblast cell marker transcripts), previously determined from the scRNA-seq data [20] at each gestation day. At gd 15.5, 57 of the 274 genes with ≥3 peaks were also markers of the invasive trophoblast cell cluster (p-value=5.29e-08), and at gd 19.5, 39 of the 103 genes with ≥3 peaks were markers of the invasive trophoblast cell cluster (p-value=6.79e-06). These markers included genes with known trophoblast functions (Tfap2c [43–45], Ets2 [46], and Cited2 [23,47,48]), and genes known to be prominently expressed in invasive trophoblast cells (Prl5a1 [49]) (Fig. 2C). Of note, while some of these markers (Cited2 and Ets2) have similar activities around their promoter regions in all cell types, they had multiple associating peaks specific to the invasive trophoblast cell cluster.
To determine if transcripts that have multiple associated peaks in rat invasive trophoblast cells also possess multiple associated peaks in human EVT cells, we incorporated open regions (ATAC-seq peaks) identified in EVT cells into our analysis [39]. First, we associated the EVT cell open regions to genes. Then, we compared the number of EVT cell peaks associated with genes that have either ≥3 or <3 peaks in rat invasive trophoblast cells (Table S2). We observed that, at both time points, genes with ≥3 peaks in rat invasive trophoblast cells had significantly more peaks in human EVT cells than genes that had fewer than 3 peaks in rat invasive trophoblast cells (p-value<2.2e-16) (Fig. 2D).
Identification of transcription factors (TFs) enriched in invasive trophoblast cell-specific peaks
To predict TFs that may be important for the invasive trophoblast cell population, we carried out motif enrichment analysis in the 1242 invasive trophoblast cell-specific peaks identified at both gestation days, hereafter referred to as common peaks (Table S3). Following the enrichment tests, filtering, and TF family grouping, we identified 11 TF families that were enriched in the common peaks, some of which have known roles in regulating trophoblast biology (Fig. 3A, Table S3). For example, TFAP2C motifs were enriched with the highest fold change in the common peaks. TFAP2C is a member of the AP-2 TF family and is a known regulator of the trophoblast cell lineage in both mouse and human [3,50,51]. We further confirmed the enrichment of the TFAP2C binding sites by comparing the rat open regions with TFAP2C motifs to TFAP2C chromatin immunoprecipitation (ChIP)-seq peaks from differentiated mouse TS cells [34]. We found that of the 439 rat peaks with TFAP2C motifs, 208 (47.38%) overlapped with TFAP2C peaks in differentiated mouse TS cells, which was significant (p-value=0.009). Additionally, all 11 TF families enriched in the rat peaks were enriched in EVT cell ATAC-seq peaks [39] (Table S3). These comparisons provide evidence for the validity of the computationally based binding site predictions.
Fig. 3. Motif analysis identifies transcription factor (TF) combinations regulating invasive trophoblast cell functions.

A) Representative motifs for enriched TF families found in common open chromatin peaks. Motifs for the top two most highly expressed TFs in each family are shown. In case multiple motifs are enriched that correspond to the same TF, motifs with the highest fold change are shown. See the mapping of motifs to TFs in Table S3. A motif is considered enriched if its hypergeometric adjusted p-value is ≤0.05 and fold change ≥1.5. The p-values were adjusted with the Benjamini-Hochberg procedure. Only motifs corresponding to genes with expression level ≥0.5 at both gd 15.5 and gd 19.5 were used in the downstream analysis. B) Heatmap of hypergeometric adjusted (adj.) p-values showing that some TF family pairs share a significant number of target genes and binding locations. The p-values were adjusted with the Benjamini-Hochberg procedure. Representative motif names (as in A) were used for TF family names. Significance level was 0.05. Blue scale: adj. p-values when testing for significance of shared genes; dark red scale: adj. p-values when testing for significance of shared binding locations. C) Histogram for number of TF families per open chromatin peak showing that most open chromatin peaks had at least two TF families predicted to be bound while there were some open chromatin peaks with only one TF family predicted to be bound. The x-axis shows the number of TF families per peak, and the y-axis showed the number of peaks.
To determine if TF functions could be predicted using the binding sites, we carried out functional enrichment analysis on the genes associated with peaks where the TF families’ binding sites were found. We observed four families with at least one term enriched (Table S3), two of which were enriched for important invasive trophoblast functions: “NR2F6, Pparg::Rxra” (Thyroid hormone receptor-related factors – RXR-related receptors family, Nuclear receptors with C4 zinc fingers class) enriched for “positive regulation of cell migration” and “vasculature development”; and “TFAP2C” (AP-2 family, Basic helix-span-helix factors class) enriched for “cell-cell adhesion”, “positive regulation of cell motility”, and “vasculature development”. Many of these observed terms agree with previous findings about roles of the families in trophoblast cell functions [44,45,52].
Next, we investigated which TF families were associated with the same target genes. We observed multiple pairs of TF families that shared a significant number of overlapping target genes, such as: “TCF4” (E2A-related factors family, Basic helix-loop-helix factors class) and “SNAI1” (More than 3 adjacent zinc finger factors family, C2H2 zinc finger factors class) (adjusted p-value=3.64e-55); “JUNB, FOSL2::JUN” (FOS-related factors – JUN-related factors family, Basic leucine zipper factors class) and “CREB3, Creb5” (CREB-related factors family, Basic leucine zipper factors class) (adjusted p-value=9.35e-41); and “TFAP2C” (AP-2 family, Basic helix-span-helix factors class) and “TCF4” (E2A-related factors family, Basic helix-loop-helix factors class) (adjusted p-value=7.88e-06) (Fig. 3B, blue scale). Overall, this analysis highlights TF families that share common target genes.
We also checked if TF family pairs occurred in the same peaks more than expected by chance. We found six pairs of TF families significantly over-represented together, including: “TCF4” (E2A-related factors) and “SNAI1” (More than 3 adjacent zinc finger factors family) (adjusted p-value=3.09e-58), “CREB3, Creb5” (CREB-related factors family) and “JUNB, FOSL2::JUN” (FOS-related factors – JUN-related factors family) (adjusted p-value=1.36e-45), and “TFAP2C” (AP-2 family) and “TCF4” (E2A-related factors family) (adjusted p-value=4.67e-04) (Fig. 3B, dark red scale). Each TF family that is part of the over-represented pairs has been individually connected to the regulation of trophoblast cell function. For example, TCF4 and SNAI1 are regulators of trophoblast cell differentiation and motility [53] and trophoblast invasion [54], respectively. Moreover, most of the peaks were bound by at least two TF families (Fig. 3C). This analysis suggested that TF families can bind in the same locations to interact and regulate cell type-specific functions. TFs can also bind individually to act in their regulatory roles.
Identification of conserved, invasive trophoblast cell-specific regulatory regions using network analysis
To predict distal elements and TFs associated with genes defining invasive trophoblast cell clusters at both gestation days, we created a TF-gene network. To establish the network we compiled several datasets: i) rat invasive trophoblast cell common peaks that overlapped with accessible regions in EVT cells (conserved common peaks), ii) motifs enriched within these regions, and iii) conserved genes that exhibited invasive trophoblast cell-specific expression, according to the scRNA-seq analysis [20], at both gd 15.5 and 19.5 [20]. The resulting network had 11 source nodes, corresponding to 11 TF families, and 34 target genes (Fig. 4A, Table S4).
Fig. 4. Network analysis predicts candidate genes and their distal regulatory elements that govern invasive trophoblast cell functions.

A) Analysis of a network of TF families and target genes highlighting candidate genes and their distal regulatory elements underlying invasive trophoblast cell functions. Rectangular nodes: TF families with representative motif names (as in Fig. 3A). Round nodes: target genes. Color: the darker the color, the higher the node in-degree centrality. Directed edges mean peaks with the predicted TF families were associated to the target genes. B) Chromatin accessibility tracks of a candidate invasive trophoblast (iTB) cell-specific distal element associated with the Cited2 gene in the rat genome (rn6). A region of interest was highlighted in light blue. C) Locations of the candidate region, ATAC-seq peaks in EVT cells and TFAP2C ChIP-seq peaks in the human genome (hg38). A region of interest was highlighted in light blue.
In this network, there are multiple genes with high in-degree centrality (≥5), meaning the genes were associated with invasive trophoblast cell-specific peaks predicted to be bound by TFs connected to ≥5 TF families. These genes were Plk2 (linked with five TFs), Scap (linked with five TFs), AABR07027306.1 (PHACTR1 human ortholog, linked with six TFs), Pcdh12 (linked with six TFs), Galnt6 (linked with six TFs), and Col4a1 (linked with seven TFs) (Fig. 4A). Pcdh12, Plk2, Scap, and Col4a1 have previously been linked to the regulation of embryonic and placental development [55–61]. Although, Phactr1 and Galnt6 have not been directly implicated in trophoblast cell biology, they have been shown to regulate migration and invasion of cancer cells [62–64]. Further analysis of the involvement of these genes in the regulation of the invasive trophoblast cell lineage is merited. Regulatory elements and the enriched motifs associated with these genes as well as all other target genes in the network can be found in Table S4.
Moreover, other target genes in the network and their distal elements could also be important for regulating invasive trophoblast cell functions. For example, Cited2, a gene required for trophoblast cell differentiation, placental development, and regulation of invasive trophoblast/EVT cells [23,47,48,65], was predicted to be regulated by a distal peak where TFAP2C and STAT3 motifs were found (Fig. 4A and B). This peak (chr1:12808761–12809434) also overlapped with a TFAP2C ChIP-seq peak from differentiated mouse TS cells [34] (Fig. 4C), suggesting that it may be bound in vivo.
Together, the target genes, regulatory elements, and TFs we identified will be candidates for future experiments to interrogate gene regulatory networks controlling invasive trophoblast cells.
DISCUSSION
The invasive trophoblast cell lineage is an evolutionary adaptation facilitating viviparity in mammals possessing hemochorial placentation [66]. Invasive trophoblast cells acquire migratory behavior, penetrate the uterine parenchyma, and serve a transformative role on cellular constituents ensuring a successful pregnancy outcome [3,4,7]. The root cause of many obstetric complications is predicted to be a failure in invasive trophoblast cell-guided uterine transformation [8,9]. Surprisingly, existing knowledge of gene regulatory networks controlling development and function of the invasive trophoblast cell lineage is modest. In this report, we sought to provide new insights into the regulation of the invasive trophoblast cell lineage. Our efforts focused on the rat, a species possessing deep intrauterine trophoblast cell invasion with similarities to human placentation and amenable to testing hypotheses pertaining to the invasive trophoblast cell lineage in vivo [12,13]. In this report, we integrated snATAC-seq and scRNA-seq [20] datasets from the rat uterine-placental interface with the goal of gaining insight into gene regulatory networks controlling the invasive trophoblast cell lineage. Chromatin accessibility profiles for each of the cellular constituents of the uterine-placental interface were determined. An in-depth analysis of invasive trophoblast cells led to the identification of invasive trophoblast cell specific genes, TFs, and TF target genes. A correlation was established between the presence of invasive trophoblast cell-specific open chromatin and gene expression. Using DNA motif binding enrichment and network analysis, we predicted TF pairs and cis-regulatory elements linked to invasive trophoblast cell genes. The efforts led to the recognition of conservation between rat and human invasive trophoblast cell lineages and predictions of distal regulatory elements within the invasive trophoblast cell lineage.
Our approach of relating open chromatin to gene expression profiles is not perfect. Gene regulatory regions can regulate multiple genes [67] and can be located considerable distances from the gene they regulate [68]. We observed that most open chromatin regions were distal to genes. Moreover, the open chromatin-gene association rule we used, together with the stringent requirement for conserved regulatory regions and genes, contributed to the inference of a relatively small and manageable network of TFs and target genes. This contributed to a straightforward network analysis that enabled the prediction of relevant interactions. Other computational methods such as co-accessibility analysis, which employs chromatin accessibility profiles to predict interactions of cis-elements [69], represents a complementary approach. Although our network construction method involved using only conserved open regions and conserved target genes, this does not negate the merits of investigating TFs and target genes inferred with species-specific elements.
Candidate TFs driving gene regulation in invasive trophoblast cells were identified through their expression in invasive trophoblast cells and through the presence of corresponding TF DNA binding motifs associated with invasive trophoblast cell specific genes. The most striking TF families linked to the invasive trophoblast cell lineage exhibit conservation in human EVT cells [39] and have been previously implicated in trophoblast cell biology [70,71]. Most interestingly, many of the invasive trophoblast cell relevant TFs are implicated in early phases of trophoblast cell lineage development or the differentiation of other trophoblast cell lineages. For example, mouse mutagenesis has demonstrated indispensable roles for Tfap2c, Cdx2, Ets2, and Pparg in trophoblast cells and placentation that precede the appearance of the invasive trophoblast cell lineage [44–46,52,72,73]. Some of these TFs were predicted to regulate the same genes based on the motif enrichment analysis, and all of these TFs had a high degree of connectivity with each other in the network we present. Previous studies have determined that TFs can work in combination to regulate trophoblast cell lineages, but different TF partnerships are implicated in the regulation of distinct processes [71,74,75]. Re-use of trophoblast lineage associated TFs in the regulation of invasive trophoblast cells is intriguing but creates experimental challenges. Future in vivo investigation will necessitate the establishment of conditional mutagenesis rat models specific to the invasive trophoblast cell lineage. Such efforts will be facilitated by the integration of single-nucleus chromatin accessibility and single-cell gene expression profiles reported here. Unique TF combinations at gene regulatory domains and/or the recruitment of unique sets of co-regulators may prove crucial to invasive trophoblast cell biology.
The uterine-placental tissue used in generating the snATAC-seq and scRNA-seq contains invasive trophoblast cells that have exited the placenta and entered the uterus and thus represent a differentiated cell type. We did not observe any evidence for multiple types of differentiated invasive trophoblast cell types nor did we detect evidence for invasive trophoblast cell progenitors. This latter population of progenitor cells should reside in the junctional zone of the rat placenta or the EVT cell column of the human placenta. Thus, the present analysis is biased towards characterization of a mature invasive trophoblast cell population. Consequently, the invasive trophoblast cell gene signature, including TFs, may best represent requirements for maintenance of the invasive trophoblast cell state. Comparisons of these rat invasive trophoblast cell chromatin and gene expression profiles with human EVT cell populations isolated from first trimester tissues [15–20,39] or derived from human TS cells [39,59] have some inherent limitations. Elucidation of single cell multi-omic profiles for the junctional zone will provide valuable information regarding derivation of the invasive trophoblast cell lineage and further insights into conservation of this important developmental process.
The datasets and analyses presented in this report represent a framework for constructing hypotheses relevant to establishing a gene regulatory network controlling the invasive trophoblast cell lineage. A research approach can now proceed involving identification of candidate conserved regulatory pathways, evaluating the importance of the regulators using TS cell models, and testing critical hubs within the pathways using relevant in vivo rat models.
MATERIALS AND METHODS
Animals
Holtzman rats were originally purchased from Envigo. Rats were maintained on a 14 h light/10 h dark cycle with open access to food and water. Timed pregnancies were obtained by mating adult males (>10 weeks of age) and adult females (8–12 weeks of age). Pregnancies were confirmed the next morning by presence of sperm in a saline vaginal lavage and defined as gd 0.5. Protocols for research with animals were approved by the University of Kansas Medical Center (KUMC) Animal Care and Use Committee.
Cell isolation from tissue
Uterine-placental interface tissue (also called metrial glands) were dissected from gd 15.5 (n=3 pregnancies) and 19.5 rat placentation sites (n=3 pregnancies) as previously described [20,76] and put in ice cold Hank’s balanced salt solution (HBSS). Tissues were minced into fine pieces with a razor blade and digested in Dispase II (1.25 units/mL, D4693, Sigma-Aldrich), 0.4 mg/mL collagenase IV (C5138, Sigma-Aldrich), and DNase I (80 units/mL, D4513, Sigma-Aldrich) in HBSS for 30 min. Red blood cells were lysed using ACK lysis buffer (A10492–01, Thermo-Fisher), rotating at room temperature for 5 min. Samples were washed with HBSS supplemented with 2% fetal bovine serum (FBS, Thermo-Fisher), and DNase1 (Sigma-Aldrich) and passed through a 100 μm cell strainer (100ICS, Midwest Scientific). Following enzymatic digestion, cell debris was removed using MACS Debris Removal Solution (130–109-398, Miltenyi Biotec). Cells were then filtered through a 40 μm cell strainer (40ICS, Midwest Scientific) and cell viability was assessed, which ranged from 90 to 93%.
Nuclei isolation, library preparation, and sequencing
Cells were isolated from gd 15.5 and 19.5 uterine-placental interface tissue as described above, and nuclei were isolated from the cell suspension according to the 10X Genomics Nuclei Isolation protocol. Briefly, cells were washed with HBSS supplemented with 2% FBS (Thermo-Fisher) and cell number determined. Approximately 500,000 cells were centrifuged, and 100 μL 10X Genomics Nuclei Isolation Lysis Buffer was added. The suspension was incubated for 3 min, then 10X Genomics Nuclei Isolation Wash Buffer was added. Cells were passed through a 40 μm cell strainer and centrifuged. Cells were resuspended in 50 μL chilled 10X Genomics Nuclei Isolation Buffer. Single nuclei were captured using the Chromium Controller into 10X barcoded gel beads. Libraries were generated using Chromium Next GEM Single Cell ATAC Library & Gel Bead Kit v1.1 (10X Genomics) and sequenced in a NovaSeq6000 sequencer at the KUMC Genome Sequencing Core.
snATAC-seq preprocessing
Read alignment to the rat genome (Rnor 6.0, Ensembl 98 [77]), primary peak calling, and feature quantification were performed using Cell Ranger Software (version 4.0.0). Quality control steps and downstream analyses were performed using the R package Signac (version 1.1.1) [40]. Unless otherwise reported, default parameters were used. We identified accessible regions using the CallPeaks() function in Signac, which utilizes model-based analysis for ChIP-seq (MACS) [78]. Parameters used for the analyses were nuclei with a total number of fragments in peaks ranging from 1000 to 20000, percentage of reads in peaks >15%, and enrichment ratio at transcription start sites >1.5 (Fig. S1). We normalized across samples and across peaks using term frequency-inverse document frequency, which is implemented through RunTFIDF() in Seurat. We used method =3, which computes log(term frequency) × log(IDF), due to great sparsity in the feature matrix and strong count outliers (Fig. S2). All features are retained to perform dimension reduction with singular value decomposition (SVD). Normalization with term frequency-inverse document frequency followed by SVD is also known as latent semantic indexing (LSI) [79]. We also investigated the correlations between sequencing depth and LSI components (using the DepthCor() function) as well as ranked the LSI components using the percentage of variance (using the ElbowPlot() function). As a result, we kept LSI components 2 to 20 for gd 15.5 replicates, and LSI components 2 to 10 for gd 19.5 replicates (Fig. S2). Replicates for each time point were then merged using the Merge() function in Seurat.
snATAC-seq clustering
To identify cell clusters for each time point, we utilized K-nearest neighbor (KNN) graphs with retained significant LSI components and the smart local moving algorithm [80], which was implemented through the Seurat functions FindNeighbors() and FindClusters(). The clusters were then visualized with uniform manifold approximation and projection (UMAP).
scRNA-seq and snATAC-seq integration – label transferring
To transfer cluster labels from our corresponding scRNA-seq data, we used the FindTransferAnchors() and TransferData() functions in the Seurat package (version 4.1.0) [81]. Briefly, this process uses canonical correlation analysis for initial dimension reduction, then identifies cell neighborhoods with KNNs, and mutual nearest neighbors (MNN). The correspondences between cells were referred to as “anchors”. Next, the anchors were given scores and weights to eliminate incorrect correspondences and to define the association strengths between cells and anchors. Finally, anchor classification and anchor weights were used to transfer labels from scRNA-seq to snATAC-seq data.
To check the correlation between snATAC-seq and scRNA-seq profiles in each cell population, we first estimated the chromatin accessibility profiles around transcription start sites, referred to as the gene activity, using the Signac function GeneActivity(). Then Spearman correlation and its statistical significance were calculated using the R function cor.test() (stats package version 4.0.2 [82]).
Analysis of cell population-specific peaks
The FindAllMarkers() function was used with cell identities transferred from scRNA-seq data and the fragment counts in peaks, to compare chromatin accessibility profiles between cell types for each gd. We used a logistic regression framework with a latent variable of the total number of fragments in peaks to account for the difference in sequencing depths. A peak is considered more accessible in a cell population (and hence specific) if it has an adjusted p-value ≤0.05 and an average log2(fold change) ≥log2(1.5).
Rat peaks were associated with the nearest gene (according to the start position) on the same chromosomes using the Signac function ClosestFeature() with the underlying genome annotation from Ensembl 98 [77]. This association rule was also used when the distance distribution of peaks to transcription start sites was calculated with the R package ChIPseeker [83]. ATAC-seq peaks in EVT cells [39] were associated to the single nearest genes with the maximum distance of 1000 kb around the TSS using GREAT (Genomic Regions Enrichment of Annotations Tool) [67]. Rat genes were mapped to their one-to-one human orthologs using gene mapping from Ensembl 98.
To assess changes in the expression level of transcripts with different numbers of associated peaks, or differences in the numbers of EVT peaks between two gene groups, we used the Wilcoxon rank sum test, implemented with the R function wilcox.test() (stats package version 4.0.2 [82]). To test the significance of overlap between genes with ≥3 peaks and invasive trophoblast cell markers, we used the hypergeometric test with the R function phyper() (stats package version 4.0.2 [82]) using options lower.tail = TRUE. In all tests, the significance level used was 0.05.
Common peaks, peak mapping across species, and conserved common peaks
Common invasive trophoblast cell-specific peaks between the two gd were obtained using bedtools intersect (version 2.27.1) [84]. Regions between the two gd were considered common if ≥50% of the base pairs overlapped.
To compare peaks across species (rat, mouse and human), all peak sets were converted to human coordinates (hg38) using LiftOver (default settings) [85].
Bedtools intersect (version 2.27.1) [84] was used to identify conserved peaks, which were defined as peaks that overlapped with ATAC-seq peaks in EVT cells [39] by ≥1 base pair (bp).
Motif analysis with common peaks
To identify enriched motifs in common peaks, we used the Homo sapiens, Mus musculus and Rattus norvegicus motif databases from JASPAR (version 2020) [86]. A BSgenome object for Rattus norvegicus, necessary to add motif information to Seurat objects, was built using the BSgenome R package (version 1.58.0) [87] and genome sequences obtained from Ensembl 98 [77]. We used the gd 19.5 coordinates of the common peak sets as input, then generated a set of 50,000 background sequences with matched length and GC content distribution using the Seurat function MatchRegionStats(). For each motif, we calculated a fold change as the percentage the motif is observed in the input sequences divided by the percentage it is observed in the background. A motif is considered enriched if its hypergeometric adjusted p-value is ≤0.05 and fold change ≥1.5. The p-values were adjusted with the Benjamini-Hochberg procedure [88].
To identify motif groups, we first mapped enriched motifs for all three organisms to their corresponding TFs using TF – motif mapping information from the JASPAR database, then retained only TFs with expression level ≥0.5 at both gd using the scRNA-seq data. Next, we grouped TFs according to their protein families, also obtained from the JASPAR database.
To compare the observed binding sites of the protein TFAP2C with previously published data from Lee et al. [34], we accessed the TFAP2C ChIP-seq data generated from differentiated TS cells through the GEO ID GSM3019344. A rat peak with TFAP2C motifs was defined to agree with mouse TFAP2C ChIP-seq peaks if they overlapped by ≥1 bp as assessed with bedtools intersect (version 2.27.1) [84]. The significance of the overlap was determined using Fisher’s exact test, with the option alternative = “greater” and a significance level of 0.05.
To carry out functional enrichment of target genes of the enriched TF families, we used Webgestalt (version 2019) [89] with the rat genome. A term was considered enriched if its FDR <0.05, enrichment rate ≥2, and number of observed genes is ≥5.
To test for over-representation of shared genes and shared binding locations, we used hypergeometric tests with the R function phyper() (stats package version 4.0.2 [82]) using options lower.tail = TRUE. Correction for multiple testing was carried out using the Benjamini-Hochberg procedure [88]. Significance level was set at 0.05.
Network inferences and analyses with conserved common peaks
In our networks, an edge between a TF family and a gene means the gene is the nearest one to conserved common peaks with the enriched motifs of the family. Source nodes in the network were TF families named with representative motifs. Target genes were marker genes of the invasive trophoblast cell clusters at both gd and were conserved in EVT cells according to the scRNA-seq data [20]. The network was visualized and analyzed with Cytoscape [90].
Supplementary Material
ACKNOWLEDGEMENTS
We would like to thank the Research IT group at Iowa State University (http://researchit.las.iastate.edu) for providing servers and IT support, and members of the Tuteja and Soares laboratories for their valuable discussions.
FUNDING
Supported by an NIH National Research Service, HD104495 (RLS), NIH grants: HD020676 (MJS), ES029280 (MJS), HD099638 (MJS), HD104033 (MJS, GT), HD105734 (MJS), HD096083 (GT) and the Sosland Foundation (MJS). Geetu Tuteja is a Pew Scholar in the Biomedical Sciences, supported by The Pew Charitable Trusts. The views expressed are those of the author(s) and do not necessarily reflect the views of the funding agencies.
Footnotes
DECLARATION OF INTERESTS
The authors declare no competing interests.
DATA AND RESOURCE AVAILABILITY
The snATAC-seq datasets we generated are available from the Gene Expression Omnibus website (https://www.ncbi.nlm.nih.gov/geo/GSE227943). All data generated and analyzed during this study are included in the published article and the online supporting files. All code used for the analyses are available at https://github.com/Tuteja-Lab/MetrialGland-scATAC-seq. Any additional resources generated and analyzed during the current study are available from the corresponding author upon reasonable request.
REFERENCES
- 1.Roberts RM, Green JA, Schulz LC. (2016). The Evolution of the Placenta. Reproduction. 152(5):R179. DOI: 10.1530/REP-16-0325 [DOI] [PMC free article] [PubMed] [Google Scholar]
- 2.Red-Horse K, Zhou Y, Genbacev O, Prakobphol A, Foulk R, McMaster M, Fisher SJ. (2004). Trophoblast differentiation during embryo implantation and formation of the maternal-fetal interface. J Clin Invest. 114(6):744. DOI: 10.1172/JCI22991 [DOI] [PMC free article] [PubMed] [Google Scholar]
- 3.Soares MJ, Varberg KM, Iqbal K. (2018). Hemochorial placentation: development, function, and adaptations. Biol Reprod. 99(1):196–211. DOI: 10.1093/BIOLRE/IOY049 [DOI] [PMC free article] [PubMed] [Google Scholar]
- 4.Knöfler M, Haider S, Saleh L, Pollheimer J, Gamage TKJB, James J. (2019). Human placenta and trophoblast development: key molecular mechanisms and model systems. Cell Mol Life Sci. 76(18):3479. DOI: 10.1007/S00018-019-03104-6 [DOI] [PMC free article] [PubMed] [Google Scholar]
- 5.Gardner RL, Beddington RSP. (1988). Multi-lineage “stem” cells in the mammalian embryo. J Cell Sci Suppl. 10(SSUPL. 10):11–27. DOI: 10.1242/JCS.1988.SUPPLEMENT_10.2 [DOI] [PubMed] [Google Scholar]
- 6.Rossant J. (2001). Stem cells from the Mammalian blastocyst. Stem Cells. 19(6):477–82. DOI: 10.1634/STEMCELLS.19-6-477 [DOI] [PubMed] [Google Scholar]
- 7.Turco MY, Moffett A. (2019). Development of the human placenta. Dev. 146(22). DOI: 10.1242/DEV.163428/223131 [DOI] [PubMed] [Google Scholar]
- 8.Brosens I, Puttemans P, Benagiano G. (2019). Placental bed research: I. The placental bed: from spiral arteries remodeling to the great obstetrical syndromes. Am J Obstet Gynecol. 221(5):437–56. DOI: 10.1016/J.AJOG.2019.05.044 [DOI] [PubMed] [Google Scholar]
- 9.Brosens I, Pijnenborg R, Vercruysse L, Romero R. (2011). THE “GREAT OBSTETRICAL SYNDROMES” ARE ASSOCIATED WITH DISORDERS OF DEEP PLACENTATION. Am J Obstet Gynecol. 204(3):193. DOI: 10.1016/J.AJOG.2010.08.009 [DOI] [PMC free article] [PubMed] [Google Scholar]
- 10.Pijnenborg R, Vercruysse L. (2010). Animal models of deep trophoblast invasion. Placent Bed Disord Basic Sci its Transl to Obstet. :127–39. DOI: 10.1017/CBO9780511750847.014 [DOI] [Google Scholar]
- 11.Pijnenborg R, Vercruysse L, Brosens I. (2011). Deep placentation. Best Pract Res Clin Obstet Gynaecol. 25(3):273–85. DOI: 10.1016/J.BPOBGYN.2010.10.009 [DOI] [PubMed] [Google Scholar]
- 12.Soares MJ, Chakraborty D, Karim Rumi MA, Konno T, Renaud SJ. (2012). RAT PLACENTATION: AN EXPERIMENTAL MODEL FOR INVESTIGATING THE HEMOCHORIAL MATERNAL-FETAL INTERFACE. Placenta. 33(4):233. DOI: 10.1016/J.PLACENTA.2011.11.026 [DOI] [PMC free article] [PubMed] [Google Scholar]
- 13.Shukla V, Soares MJ. (2022). Modeling Trophoblast Cell-Guided Uterine Spiral Artery Transformation in the Rat. Int J Mol Sci. 23(6). DOI: 10.3390/IJMS23062947 [DOI] [PMC free article] [PubMed] [Google Scholar]
- 14.Nelson AC, Mould AW, Bikoff EK, Robertson EJ. (2016). Single-cell RNA-seq reveals cell type-specific transcriptional signatures at the maternal-foetal interface during pregnancy. Nat Commun. 7. DOI: 10.1038/ncomms11414 [DOI] [PMC free article] [PubMed] [Google Scholar]
- 15.Liu Y, Fan X, Wang R, Lu X, Dang YL, Wang H, Lin HY, Zhu C, Ge H, Cross JC, et al. (2018). Single-cell RNA-seq reveals the diversity of trophoblast subtypes and patterns of differentiation in the human placenta. Cell Res 2018 288. 28(8):819–32. DOI: 10.1038/s41422-018-0066-y [DOI] [PMC free article] [PubMed] [Google Scholar]
- 16.Suryawanshi H, Morozov P, Straus A, Sahasrabudhe N, Max KEA, Garzia A, Kustagi M, Tuschl T, Williams Z. (2018). A single-cell survey of the human first-trimester placenta and decidua. Sci Adv. 4(10). DOI: 10.1126/SCIADV.AAU4788/SUPPL_FILE/AAU4788_SM.PDF [DOI] [PMC free article] [PubMed] [Google Scholar]
- 17.Vento-Tormo R, Efremova M, Botting RA, Turco MY, Vento-Tormo M, Meyer KB, Park JE, Stephenson E, Polański K, Goncalves A, et al. (2018). Single-cell reconstruction of the early maternal–fetal interface in humans. Nature. 563(7731):347–53. DOI: 10.1038/s41586-018-0698-6 [DOI] [PMC free article] [PubMed] [Google Scholar]
- 18.Sun T, Gonzalez TL, Deng N, Di Pentino R, Clark EL, Lee B, Tang J, Wang Y, Stripp BR, Yao C, et al. (2020). Sexually Dimorphic Crosstalk at the Maternal-Fetal Interface. J Clin Endocrinol Metab. 105(12):e4831. DOI: 10.1210/CLINEM/DGAA503 [DOI] [PMC free article] [PubMed] [Google Scholar]
- 19.Marsh B, Zhou Y, Kapidzic M, Fisher S, Blelloch R. (2022). Regionally distinct trophoblast regulate barrier function and invasion in the human placenta. Elife. 11. DOI: 10.7554/ELIFE.78829 [DOI] [PMC free article] [PubMed] [Google Scholar]
- 20.Scott RL, Vu HTH, Jain A, Iqbal K, Tuteja G, Soares MJ. (2022). Conservation at the uterine-placental interface. Proc Natl Acad Sci U S A. 119(41):e2210633119. DOI: 10.1073/PNAS.2210633119/SUPPL_FILE/PNAS.2210633119.SD05.XLSX [DOI] [PMC free article] [PubMed] [Google Scholar]
- 21.Varberg KM, Iqbal K, Muto M, Simon ME, Scott RL, Kozai K, Choudhury RH, Aplin JD, Biswell R, Gibson M, et al. (2021). ASCL2 reciprocally controls key trophoblast lineage decisions during hemochorial placenta development. Proc Natl Acad Sci U S A. 118(10). DOI: 10.1073/PNAS.2016517118/-/DCSUPPLEMENTAL [DOI] [PMC free article] [PubMed] [Google Scholar]
- 22.Muto M, Chakraborty D, Varberg KM, Moreno-Irusta A, Iqbal K, Scott RL, McNally RP, Choudhury RH, Aplin JD, Okae H, et al. (2021). Intersection of regulatory pathways controlling hemostasis and hemochorial placentation. Proc Natl Acad Sci U S A. 118(50). DOI: 10.1073/PNAS.2111267118/-/DCSUPPLEMENTAL [DOI] [PMC free article] [PubMed] [Google Scholar]
- 23.Kuna M, Dhakal P, Iqbal K, Dominguez EM, Kent LN, Muto M, Moreno-Irusta A, Kozai K, Varberg KM, Okae H, et al. (2023). CITED2 is a conserved regulator of the uterine-placental interface. Proc Natl Acad Sci U S A. 120(3):e2213622120. DOI: 10.1073/PNAS.2213622120/SUPPL_FILE/PNAS.2213622120.SD05.XLSX [DOI] [PMC free article] [PubMed] [Google Scholar]
- 24.Ong CT, Corces VG. (2012). Enhancers: emerging roles in cell fate specification. EMBO Rep. 13(5):423. DOI: 10.1038/EMBOR.2012.52 [DOI] [PMC free article] [PubMed] [Google Scholar]
- 25.Tuteja G, Moreira KB, Chung T, Chen J, Wenger AM, Bejerano G. (2014). Automated discovery of tissue-targeting enhancers and transcription factors from binding motif and gene function data. PLoS Comput Biol. 10(1). DOI: 10.1371/JOURNAL.PCBI.1003449 [DOI] [PMC free article] [PubMed] [Google Scholar]
- 26.Yadav T, Quivy JP, Almouzni G. (2018). Chromatin plasticity: A versatile landscape that underlies cell fate and identity. Science (80-). 361(6409):1332–6. DOI: 10.1126/SCIENCE.AAT8950/ASSET/A1C8838D-A86A-4958-97E3-0850CCA7A899/ASSETS/GRAPHIC/361_1332_F4.JPEG [DOI] [PubMed] [Google Scholar]
- 27.Peñalosa-Ruiz G, Bright AR, Mulder KW, Veenstra GJC. (2019). The interplay of chromatin and transcription factors during cell fate transitions in development and reprogramming. Biochim Biophys acta Gene Regul Mech. 1862(9). DOI: 10.1016/J.BBAGRM.2019.194407 [DOI] [PubMed] [Google Scholar]
- 28.Rugg-Gunn PJ, Cox BJ, Ralston A, Rossant J. (2010). Distinct histone modifications in stem cell lines and tissue lineages from the early mouse embryo. Proc Natl Acad Sci U S A. 107(24):10783–90. DOI: 10.1073/PNAS.0914507107/SUPPL_FILE/SD01.XLS [DOI] [PMC free article] [PubMed] [Google Scholar]
- 29.Chuong EB, Rumi MAK, Soares MJ, Baker JC. (2013). Endogenous retroviruses function as species-specific enhancer elements in the placenta. Nat Genet. 45(3):325–9. DOI: 10.1038/ng.2553 [DOI] [PMC free article] [PubMed] [Google Scholar]
- 30.Tuteja G, Chung T, Bejerano G. (2016). Changes in the enhancer landscape during early placental development uncover a trophoblast invasion gene-enhancer network. Placenta. 37:45–55. DOI: 10.1016/j.placenta.2015.11.001 [DOI] [PMC free article] [PubMed] [Google Scholar]
- 31.Schoenfelder S, Mifsud B, Senner CE, Todd CD, Chrysanthou S, Darbo E, Hemberger M, Branco MR. (2018). Divergent wiring of repressive and active chromatin interactions between mouse embryonic and trophoblast lineages. Nat Commun 2018 91. 9(1):1–10. DOI: 10.1038/s41467-018-06666-4 [DOI] [PMC free article] [PubMed] [Google Scholar]
- 32.Xu J, Kidder BL. (2018). KDM5B decommissions the H3K4 methylation landscape of self-renewal genes during trophoblast stem cell differentiation. Biol Open. 7(5). DOI: 10.1242/BIO.031245 [DOI] [PMC free article] [PubMed] [Google Scholar]
- 33.Kwak YT, Muralimanoharan S, Gogate AA, Mendelson CR. (2019). Human Trophoblast Differentiation Is Associated With Profound Gene Regulatory and Epigenetic Changes. Endocrinology. 160(9):2189. DOI: 10.1210/EN.2019-00144 [DOI] [PMC free article] [PubMed] [Google Scholar]
- 34.Lee BK, Jang Y, Kim M, LeBlanc L, Rhee C, Lee J, Beck S, Shen W, Kim J. (2019). Super-enhancer-guided mapping of regulatory networks controlling mouse trophoblast stem cells. Nat Commun. 10(1). DOI: 10.1038/S41467-019-12720-6 [DOI] [PMC free article] [PubMed] [Google Scholar]
- 35.Zhang B, Kim MY, Elliot GN, Zhou Y, Zhao G, Li D, Lowdon RF, Gormley M, Kapidzic M, Robinson JF, et al. (2021). Human placental cytotrophoblast epigenome dynamics over gestation and alterations in placental disease. Dev Cell. 56(9):1238–1252.e5. DOI: 10.1016/J.DEVCEL.2021.04.001 [DOI] [PMC free article] [PubMed] [Google Scholar]
- 36.Starks RR, Kaur H, Tuteja G. (2021). Mapping cis-regulatory elements in the midgestation mouse placenta. Sci Reports 2021 111. 11(1):1–13. DOI: 10.1038/s41598-021-01664-x [DOI] [PMC free article] [PubMed] [Google Scholar]
- 37.Nelson AC, Mould AW, Bikoff EK, Robertson EJ. (2017). Mapping the chromatin landscape and Blimp1 transcriptional targets that regulate trophoblast differentiation. Sci Reports 2017 71. 7(1):1–15. DOI: 10.1038/s41598-017-06859-9 [DOI] [PMC free article] [PubMed] [Google Scholar]
- 38.Starks RR, Biswas A, Jain A, Tuteja G. (2019). Combined analysis of dissimilar promoter accessibility and gene expression profiles identifies tissue-specific genes and actively repressed networks. Epigenetics and Chromatin. 12(1):1–16. DOI: 10.1186/s13072-019-0260-2 [DOI] [PMC free article] [PubMed] [Google Scholar]
- 39.Varberg KM, Dominguez EM, Koseva B, McNally RP, Moreno-Irusta A, Wesley ER, Iqbal K, Cheung WA, Okae H, Arima T, et al. (2022). Active remodeling of the chromatin landscape directs extravillous trophoblast cell lineage development. medRxiv. :2022.05.25.22275520. DOI: 10.1101/2022.05.25.22275520 [DOI] [PMC free article] [PubMed] [Google Scholar]
- 40.Stuart T, Butler A, Hoffman P, Hafemeister C, Papalexi E, Mauck WM, Hao Y, Stoeckius M, Smibert P, Satija R. (2019). Comprehensive Integration of Single-Cell Data. Cell. 177(7):1888–1902.e21. DOI: 10.1016/j.cell.2019.05.031 [DOI] [PMC free article] [PubMed] [Google Scholar]
- 41.Merrill CB, Montgomery AB, Pabon MA, Shabalin AA, Rodan AR, Rothenfluh A. (2022). Harnessing changes in open chromatin determined by ATAC-seq to generate insulin-responsive reporter constructs. BMC Genomics. 23(1). DOI: 10.1186/S12864-022-08637-Y [DOI] [PMC free article] [PubMed] [Google Scholar]
- 42.Pervolarakis N, Nguyen QH, Williams J, Gong Y, Gutierrez G, Sun P, Jhutty D, Zheng GXY, Nemec CM, Dai X, et al. (2020). Integrated Single-Cell Transcriptomics and Chromatin Accessibility Analysis Reveals Regulators of Mammary Epithelial Cell Identity. Cell Rep. 33(3):108273. DOI: 10.1016/J.CELREP.2020.108273 [DOI] [PMC free article] [PubMed] [Google Scholar]
- 43.Kuckenberg P, Kubaczka C, Schorle H. (2012). The role of transcription factor Tcfap2c/TFAP2C in trophectoderm development. Reprod Biomed Online. 25(1):12–20. DOI: 10.1016/j.rbmo.2012.02.015 [DOI] [PubMed] [Google Scholar]
- 44.Auman HJ, Nottoli T, Lakiza O, Winger Q, Donaldson S, Williams T. (2002). Transcription factor AP-2γ is essential in the extra-embryonic lineages for early postimplantation development. Development. 129(11):2733–47. DOI: 10.1242/DEV.129.11.2733 [DOI] [PubMed] [Google Scholar]
- 45.Werling U, Schorle H. (2002). Transcription Factor Gene AP-2γ Essential for Early Murine Development. Mol Cell Biol. 22(9):3149. DOI: 10.1128/MCB.22.9.3149-3156.2002 [DOI] [PMC free article] [PubMed] [Google Scholar]
- 46.Yamamoto H, Flannery ML, Kupriyanov S, Pearce J, McKercher SR, Henkel GW, Maki RA, Werb Z, Oshima RG. (1998). Defective trophoblast function in mice with a targeted mutation of Ets2. Genes Dev. 12(9):1315. DOI: 10.1101/GAD.12.9.1315 [DOI] [PMC free article] [PubMed] [Google Scholar]
- 47.Withington SL, Scott AN, Saunders DN, Lopes Floro K, Preis JI, Michalicek J, Maclean K, Sparrow DB, Barbera JPM, Dunwoodie SL. (2006). Loss of Cited2 affects trophoblast formation and vascularization of the mouse placenta. Dev Biol. 294(1):67–82. DOI: 10.1016/J.YDBIO.2006.02.025 [DOI] [PubMed] [Google Scholar]
- 48.Imakawa K, Dhakal P, Kubota K, Kusama K, Chakraborty D, Rumi MAK, Soares MJ. (2016). CITED2 MODULATION OF TROPHOBLAST CELL DIFFERENTIATION: INSIGHTS FROM GLOBAL TRANSCRIPTOME ANALYSIS. Reproduction. 151(5):509. DOI: 10.1530/REP-15-0555 [DOI] [PMC free article] [PubMed] [Google Scholar]
- 49.Ain R, Canham LN, Soares MJ. (2003). Gestation stage-dependent intrauterine trophoblast cell invasion in the rat and mouse: Novel endocrine phenotype and regulation. Dev Biol. 260(1):176–90. DOI: 10.1016/S0012-1606(03)00210-0 [DOI] [PubMed] [Google Scholar]
- 50.Kaiser S, Koch Y, Kühnel E, Sharma N, Gellhaus A, Kuckenberg P, Schorle H, Winterhager E. (2015). Reduced gene dosage of Tfap2c impairs trophoblast lineage differentiation and alters maternal blood spaces in the mouse placenta. Biol Reprod. 93(2):31–2. DOI: 10.1095/biolreprod.114.126474 [DOI] [PubMed] [Google Scholar]
- 51.Kuckenberg P, Kubaczka C, Schorle H. (2012). The role of transcription factor Tcfap2c/TFAP2C in trophectoderm development. Reprod Biomed Online. 25(1):12–20. DOI: 10.1016/J.RBMO.2012.02.015 [DOI] [PubMed] [Google Scholar]
- 52.Barak Y, Nelson MC, Ong ES, Jones YZ, Ruiz-Lozano P, Chien KR, Koder A, Evans RM. (1999). PPARγ Is Required for Placental, Cardiac, and Adipose Tissue Development. Mol Cell. 4(4):585–95. DOI: 10.1016/S1097-2765(00)80209-9 [DOI] [PubMed] [Google Scholar]
- 53.Meinhardt G, Haider S, Haslinger P, Proestling K, Fiala C, Pollheimer J, Knöfler M. (2014). Wnt-Dependent T-Cell Factor-4 Controls Human Etravillous Trophoblast Motility. Endocrinology. 155(5):1908–20. DOI: 10.1210/EN.2013-2042 [DOI] [PubMed] [Google Scholar]
- 54.Davies J E., Pollheimer J, Yong HEJ, Kokkinos MI, Kalionis B, Knöfler M, Murthi P. (2016). Epithelial-mesenchymal transition during extravillous trophoblast differentiation. Cell Adh Migr. 10(3):310. DOI: 10.1080/19336918.2016.1170258 [DOI] [PMC free article] [PubMed] [Google Scholar]
- 55.Bouillot S, Rampon C, Tillet E, Huber P. (2006). Tracing the Glycogen Cells with Protocadherin 12 During Mouse Placenta Development. Placenta. 27(8):882–8. DOI: 10.1016/J.PLACENTA.2005.09.009 [DOI] [PubMed] [Google Scholar]
- 56.Bouillot S, Tillet E, Carmona G, Prandini MH, Gauchez AS, Hoffmann P, Alfaidy N, Cand F, Huber P. (2011). Protocadherin-12 Cleavage Is a Regulated Process Mediated by ADAM10 Protein: EVIDENCE OF SHEDDING UP-REGULATION IN PRE-ECLAMPSIA. J Biol Chem. 286(17):15195–204. DOI: 10.1074/JBC.M111.230045 [DOI] [PMC free article] [PubMed] [Google Scholar]
- 57.Ma S, Charron J, Erikson RL. (2003). Role of Plk2 (Snk) in Mouse Development and Cell Proliferation. Mol Cell Biol. 23(19):6936. DOI: 10.1128/MCB.23.19.6936-6943.2003 [DOI] [PMC free article] [PubMed] [Google Scholar]
- 58.Schenke-Layland K, Angelis E, Rhodes KE, Heydarkhan-Hagvall S, Mikkola HK, MacLellan WR. (2007). Collagen IV induces trophoectoderm differentiation of mouse embryonic stem cells. Stem Cells. 25(6):1529–38. DOI: 10.1634/STEMCELLS.2006-0729 [DOI] [PubMed] [Google Scholar]
- 59.Okae H, Toh H, Sato T, Hiura H, Takahashi S, Shirane K, Kabayama Y, Suyama M, Sasaki H, Arima T. (2018). Derivation of Human Trophoblast Stem Cells. Cell Stem Cell. 22(1):50–63.e6. DOI: 10.1016/J.STEM.2017.11.004 [DOI] [PubMed] [Google Scholar]
- 60.Matsuda M, Korn BS, Hammer RE, Moon YA, Komuro R, Horton JD, Goldstein JL, Brown MS, Shimomura I. (2001). SREBP cleavage-activating protein (SCAP) is required for increased lipid synthesis in liver induced by cholesterol deprivation and insulin elevation. Genes Dev. 15(10):1206–16. DOI: 10.1101/GAD.891301 [DOI] [PMC free article] [PubMed] [Google Scholar]
- 61.Oefner CM, Sharkey A, Gardner L, Critchley H, Oyen M, Moffett A. (2015). Collagen type IV at the fetal–maternal interface. Placenta. 36(1):59. DOI: 10.1016/J.PLACENTA.2014.10.012 [DOI] [PMC free article] [PubMed] [Google Scholar]
- 62.Herman L, Legois B, Todeschini AL, Veitia RA. (2021). Genomic exploration of the targets of FOXL2 and ESR2 unveils their implication in cell migration, invasion, and adhesion. FASEB J. 35(4). DOI: 10.1096/FJ.202002444R [DOI] [PubMed] [Google Scholar]
- 63.Song J, Liu W, Wang J, Hao J, Wang Y, You X, Du X, Zhou Y, Ben J, Zhang X, et al. (2020). GALNT6 promotes invasion and metastasis of human lung adenocarcinoma cells through O-glycosylating chaperone protein GRP78. Cell Death Dis. 11(5). DOI: 10.1038/S41419-020-2537-6 [DOI] [PMC free article] [PubMed] [Google Scholar]
- 64.Gao F, Zheng G. (2022). RUNX3-Regulated GALNT6 Promotes the Migration and Invasion of Hepatocellular Carcinoma Cells by Mediating O-Glycosylation of MUC1. Dis Markers. 2022. DOI: 10.1155/2022/2959846 [DOI] [PMC free article] [PubMed] [Google Scholar] [Retracted]
- 65.Moreau JLM, Artap ST, Shi H, Chapman G, Leone G, Sparrow DB, Dunwoodie SL. (2014). Cited2 is required in trophoblasts for correct placental capillary patterning. Dev Biol. 392(1):62–79. DOI: 10.1016/J.YDBIO.2014.04.023 [DOI] [PubMed] [Google Scholar]
- 66.Pijnenborg R, Robertson WB, Brosens I, Dixon G. (1981). Review article: Trophoblast invasion and the establishment of haemochorial placentation in man and laboratory animals. Placenta. 2(1):71–91. DOI: 10.1016/S0143-4004(81)80042-2 [DOI] [PubMed] [Google Scholar]
- 67.McLean CY, Bristor D, Hiller M, Clarke SL, Schaar BT, Lowe CB, Wenger AM, Bejerano G. (2010). GREAT improves functional interpretation of cis-regulatory regions. Nat Biotechnol. 28(5):495–501. DOI: 10.1038/nbt.1630 [DOI] [PMC free article] [PubMed] [Google Scholar]
- 68.Lin X, Liu Y, Liu S, Zhu X, Wu L, Zhu Y, Zhao D, Xu X, Chemparathy A, Wang H, et al. (2022). Nested epistasis enhancer networks for robust genome regulation. Science. 377(6610):1077–85. DOI: 10.1126/SCIENCE.ABK3512/SUPPL_FILE/SCIENCE.ABK3512_MOVIES_S1_TO_S4.ZIP [DOI] [PMC free article] [PubMed] [Google Scholar]
- 69.Pliner HA, Packer JS, McFaline-Figueroa JL, Cusanovich DA, Daza RM, Aghamirzaie D, Srivatsan S, Qiu X, Jackson D, Minkina A, et al. (2018). Cicero Predicts cis-Regulatory DNA Interactions from Single-Cell Chromatin Accessibility Data. Mol Cell. 71(5):858–871.e8. DOI: 10.1016/j.molcel.2018.06.044 [DOI] [PMC free article] [PubMed] [Google Scholar]
- 70.Rossant J, Cross JC, Lunenfeld S. (2001). Placental Development: Lessons from Mouse Mutants. Nat Rev Genet. 2(July):538–48. DOI: 10.1038/35080570 [DOI] [PubMed] [Google Scholar]
- 71.Hemberger M, Hanna CW, Dean W. (2020). Mechanisms of early placental development in mouse and humans. Nat Rev Genet. 21(1):27–43. DOI: 10.1038/s41576-019-0169-4 [DOI] [PubMed] [Google Scholar]
- 72.Chawengsaksophak K, James R, Hammond VE, Köntgen F, Beck F. (1997). Homeosis and intestinal tumours in Cdx2 mutant mice. Nat 1997 3866620. 386(6620):84–7. DOI: 10.1038/386084a0 [DOI] [PubMed] [Google Scholar]
- 73.Chawengsaksophak K, De Graaff W, Rossant J, Deschamps J, Beck F. (2004). Cdx2 is essential for axial elongation in mouse development. Proc Natl Acad Sci U S A. 101(20):7641–5. DOI: 10.1073/PNAS.0401654101/SUPPL_FILE/01654FIG9.PDF [DOI] [PMC free article] [PubMed] [Google Scholar]
- 74.Latos PA, Sienerth AR, Murray A, Senner CE, Muto M, Ikawa M, Oxley D, Burge S, Cox BJ, Hemberger M. (2015). Elf5-centered transcription factor hub controls trophoblast stem cell self-renewal and differentiation through stoichiometry sensitive shifts in target gene networks. Genes Dev. 29(23):2435–48. DOI: 10.1101/gad.268821.115 [DOI] [PMC free article] [PubMed] [Google Scholar]
- 75.Latos PA, Hemberger M. (2016). From the stem of the placental tree: Trophoblast stem cells and their progeny. Dev. 143(20):3650–60. DOI: 10.1242/dev.133462 [DOI] [PubMed] [Google Scholar]
- 76.Ain R, Konno T, Canham LN, Soares MJ. (2006). Phenotypic analysis of the rat placenta. Methods Mol Med. 121(8):295–313. DOI: 10.1385/1-59259-983-4:293 [DOI] [PubMed] [Google Scholar]
- 77.Cunningham F, Achuthan P, Akanni W, Allen J, Amode MR, Armean IM, Bennett R, Bhai J, Billis K, Boddu S, et al. (2019). Ensembl 2019. Nucleic Acids Res. 47(D1):D745–51. DOI: 10.1093/nar/gky1113 [DOI] [PMC free article] [PubMed] [Google Scholar]
- 78.Zhang Y, Liu T, Meyer CA, Eeckhoute J, Johnson DS, Bernstein BE, Nussbaum C, Myers RM, Brown M, Li W, et al. (2008). Model-based analysis of ChIP-Seq (MACS). Genome Biol. 9(9):R137. DOI: 10.1186/gb-2008-9-9-r137 [DOI] [PMC free article] [PubMed] [Google Scholar]
- 79.Cusanovich DA, Daza R, Adey A, Pliner HA, Christiansen L, Gunderson KL, Steemers FJ, Trapnell C, Shendure J. (2015). Multiplex single-cell profiling of chromatin accessibility by combinatorial cellular indexing. Science (80-). 348(6237):910–4. DOI: 10.1126/science.aab1601 [DOI] [PMC free article] [PubMed] [Google Scholar]
- 80.Waltman L, Van Eck NJ. (2013). A smart local moving algorithm for large-scale modularity-based community detection. Eur Phys J B. 86(11):1–14. DOI: 10.1140/epjb/e2013-40829-0 [DOI] [Google Scholar]
- 81.Butler A, Hoffman P, Smibert P, Papalexi E, Satija R. (2018). Integrating single-cell transcriptomic data across different conditions, technologies, and species. Nat Biotechnol. 36(5):411–20. DOI: 10.1038/nbt.4096 [DOI] [PMC free article] [PubMed] [Google Scholar]
- 82.R Core Development Team. (2013). R: A Language and Environment for Statistical Computing. http://www.r-project.org. Vienna, Austria; [Google Scholar]
- 83.Yu G, Wang LG, He QY. (2015). ChIPseeker: an R/Bioconductor package for ChIP peak annotation, comparison and visualization. Bioinformatics. 31(14):2382–3. DOI: 10.1093/BIOINFORMATICS/BTV145 [DOI] [PubMed] [Google Scholar]
- 84.Quinlan AR, Hall IM. (2010). BEDTools: A flexible suite of utilities for comparing genomic features. Bioinformatics. 26(6):841–2. DOI: 10.1093/bioinformatics/btq033 [DOI] [PMC free article] [PubMed] [Google Scholar]
- 85.Hinrichs AS, Karolchik D, Baertsch R, Barber GP, Bejerano G, Clawson H, Diekhans M, Furey TS, Harte RA, Hsu F, et al. (2006). The UCSC Genome Browser Database: update 2006. Nucleic Acids Res. 34(Database issue). DOI: 10.1093/nar/gkj144 [DOI] [PMC free article] [PubMed] [Google Scholar]
- 86.Fornes O, Castro-Mondragon JA, Khan A, Van Der Lee R, Zhang X, Richmond PA, Modi BP, Correard S, Gheorghe M, Baranašić D, et al. (2020). JASPAR 2020: Update of the open-Access database of transcription factor binding profiles. Nucleic Acids Res. 48(D1):D87–92. DOI: 10.1093/nar/gkz1001 [DOI] [PMC free article] [PubMed] [Google Scholar]
- 87.Hervé P. (2020). BSgenome: Software infrastructure for efficient representation of full genomes and their SNPs. https://bioconductor.org/packages/BSgenome. [Google Scholar]
- 88.Benjamini Y, Hochberg Y. (1995). Controlling the False Discovery Rate: A Practical and Powerful Approach to Multiple Testing. J R Stat Soc. 57(1):289–300. [Google Scholar]
- 89.Liao Y, Wang J, Jaehnig EJ, Shi Z, Zhang B. (2019). WebGestalt 2019: gene set analysis toolkit with revamped UIs and APIs. Nucleic Acids Res. 47(W1):W199–205. DOI: 10.1093/NAR/GKZ401 [DOI] [PMC free article] [PubMed] [Google Scholar]
- 90.Shannon P, Markiel A, Ozier O, Baliga NS, Wang JT, Ramage D, Amin N, Schwikowski B, Ideker T. (2003). Cytoscape: A software Environment for integrated models of biomolecular interaction networks. Genome Res. 13(11):2498–504. DOI: 10.1101/gr.1239303 [DOI] [PMC free article] [PubMed] [Google Scholar]
Associated Data
This section collects any data citations, data availability statements, or supplementary materials included in this article.
Supplementary Materials
Data Availability Statement
The snATAC-seq datasets we generated are available from the Gene Expression Omnibus website (https://www.ncbi.nlm.nih.gov/geo/GSE227943). All data generated and analyzed during this study are included in the published article and the online supporting files. All code used for the analyses are available at https://github.com/Tuteja-Lab/MetrialGland-scATAC-seq. Any additional resources generated and analyzed during the current study are available from the corresponding author upon reasonable request.