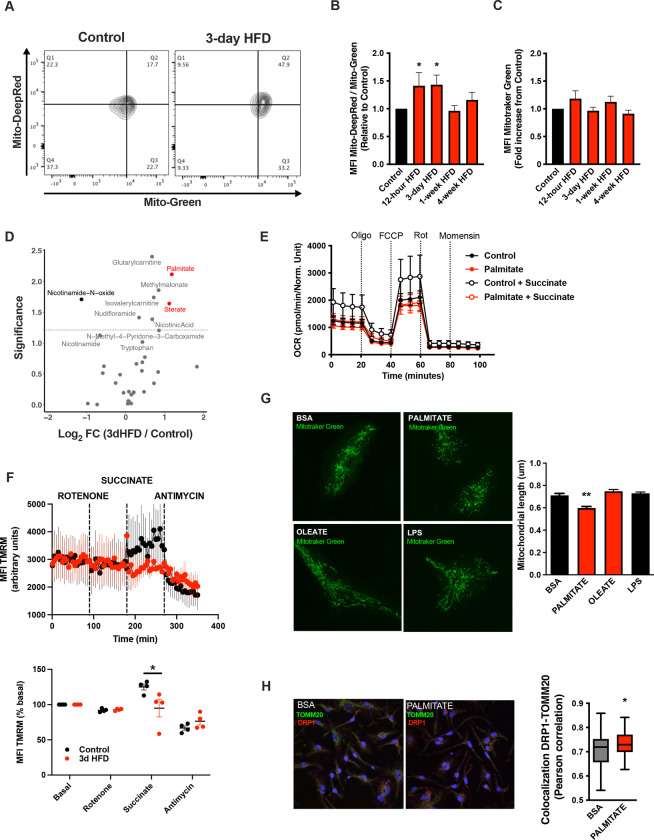
FIGURE 2: A rapid Microglial Mitochondria Response to high fat diet.
A. Facs plots depicting the ratio Mitotraker Deep Red/ Mitotraker Green from sorted microglial cells of C57Bl6/J male fed with a control diet (Control) or fed with high fat diet for 3 days (3-day HFD).
B. Graph showing the ratio Mitotraker Deep Red/ Mitotraker Green from sorted hypothalamic microglial cells of C57Bl6/J male fed with a control diet (Control) or fed with high fat diet for 12 hours,3 days or 1–4 weeks (n=5 to 12).
C. Graph showing the Mitotraker Green fluorescence from sorted hypothalamic microglial cells of C57Bl6/J male fed with a control diet (Control) or fed with high fat diet for for 12 hours,3 days or 1–4 weeks (n=5 to 12).
D. Volcano plot showing the metabolites content of cerebrospinal fluid from of C57Bl6/J male fed with a control diet (Control) or fed with high fat diet for 3 days (n=10).
E. Seahorse (+/− succinate added in the media during the experiment) on primary microglia challenged for 24hours with BSA (control) or Palmitate (experiment replicated 3times).
F. Mitochondrial Electron transport chain activity recorded with FACS after TMRM staining from sorted microglial cells of C57Bl6/J male fed with a control diet (Control) or fed with high fat diet for 3 days (n=5).
G. Mitochondrial networks from primary microglia stained with Mitotraker green after being challenged for 24hours with BSA (control), Palmitate, Oleate or LPS (n=40) and the mitochondrial length quantification graphs.
H. DRP1 colocalization with the mitochondrial network stained with TOMM20 on primary microglial cell after being challenged for 24hours with BSA (control) and Palmitate(n=40) and the colocalization quantification graphs.
Data are presented as mean ±SEM. *p<0.05, **p<0.01, ***p<0.001 as determined by two-tailed Student’s test and two-way ANOVA followed by Bonferroni post hoc test.

