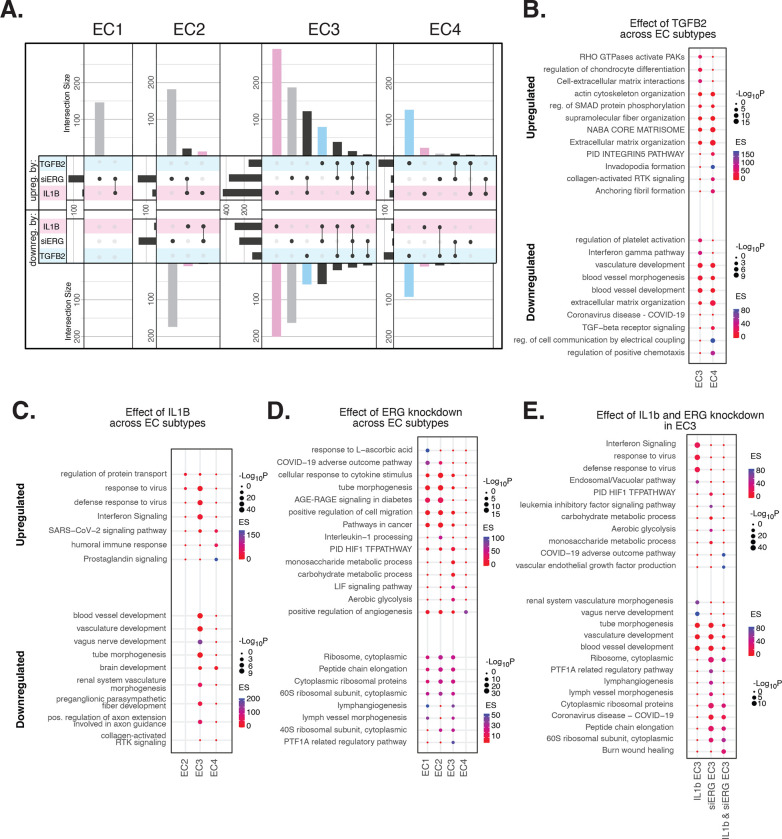
Figure 3 |. EndMT perturbations in vitro elicit EC subtype-specific transcriptional responses.
(A), Upset plots of up- and down-regulated DEGs across EC subtypes with siERG (grey), IL1B (pink), and TGFB (blue). Intersection size represents the number of genes at each intersection. (B), PEA for EC3–4 up- and down-regulated DEGs with TGFB2 compared to control media. (C), PEA for EC2–4 up- and down-regulated DEGs with IL1B compared to control media. (D), PEA for EC1–4 up- and down-regulated DEGs with siERG compared to siSCR. (E), PEA comparing up- and down-regulated DEGs that are mutually exclusive and shared between IL1B and siERG in EC3.

