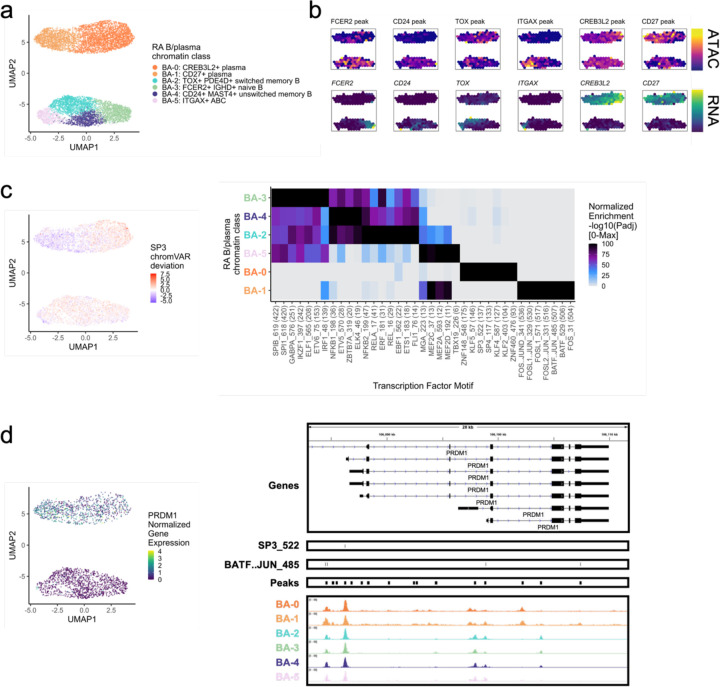
Fig. 5.
RA B/plasma chromatin classes.
a. UMAP colored by 6 B/plasma chromatin classes defined from unimodal scATAC and multimodal snATAC cells.
b. Binned normalized marker peak accessibility (top) and gene expression (bottom) for multiome snATAC cells on UMAP.
c. UMAP colored by chromVAR31 deviations for the SP3 motif (left). Most significantly enriched motifs in marker peaks per B/plasma chromatin class (right). To be included per class, motifs had to be enriched in the class above a minimal threshold and corresponding TFs had to have at least minimal expression in snRNA (Methods). Color scale normalized per motif across classes with max −log10(padj) value shown in parentheses in motif label. P-values were calculated via hypergeometric test in ArchR32.
d. UMAP colored by PRDM1 normalized gene expression (left). PRDM1 locus (chr6:106,082,865-106,111,658) with selected isoforms, motifs, open chromatin peaks, and chromatin accessibility reads from unimodal and multimodal ATAC cells aggregated by chromatin class and scaled by read counts per class (Methods) (right).

