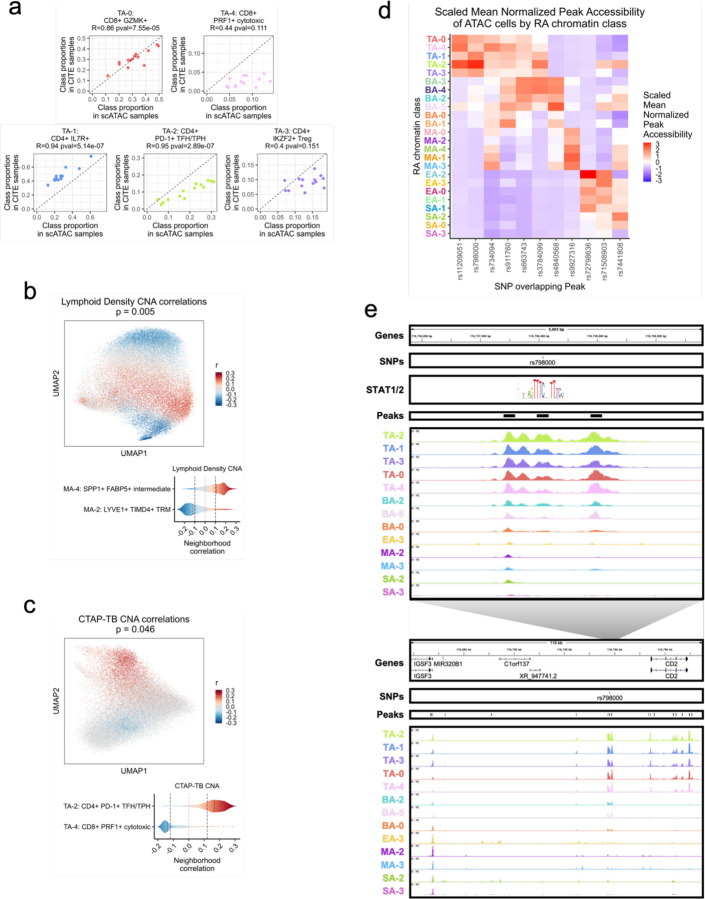
Fig. 8.
Linking RA chromatin classes to RA pathology.
a. For each donor shared between the unimodal ATAC and AMP-RA reference studies with at least 200 T cells, the Pearson correlation between the relative proportions of T cell chromatin classes defined in the unimodal ATAC datasets (x-axis) and classified into in the CITE datasets through the multiome cells (y-axis). Pearson Correlation Coefficients (R) and p-values (pval) noted.
b. CNA correlations between myeloid cell neighborhoods and lymphoid density in AMP-RA reference myeloid cells visualized on UMAP (top) and aggregated by classified myeloid chromatin classes (bottom). On the top, cells not passing the FDR threshold were colored grey. On the bottom, FDR thresholds shown in dotted black lines.
c. CNA correlations between T cell neighborhoods and CTAP-TB in AMP-RA reference T cells visualized on UMAP (top) and aggregated by classified T cell chromatin classes (bottom). On the top, cells not passing the FDR threshold were colored grey. On the bottom, FDR thresholds shown in dotted black lines.
d. Scaled mean normalized chromatin accessibility for peaks that overlap putatively causal RA risk variants across chromatin classes. Additional information in Supplementary Table 5.
e. rs798000 locus, zoomed in (chr1:116,735,799-116,740,800) (top) and zoomed out (chr1:116,658,581-116,775,106) (bottom) with isoforms, SNPs, open chromatin peaks, and chromatin accessibility reads aggregated by chromatin class and scaled by read counts per class (Methods). STAT1/2 motif was downloaded from JASPAR98 ID MA0517.1 and is not to scale, but it is aligned to the SNP-breaking motif position.

