Figure 4:

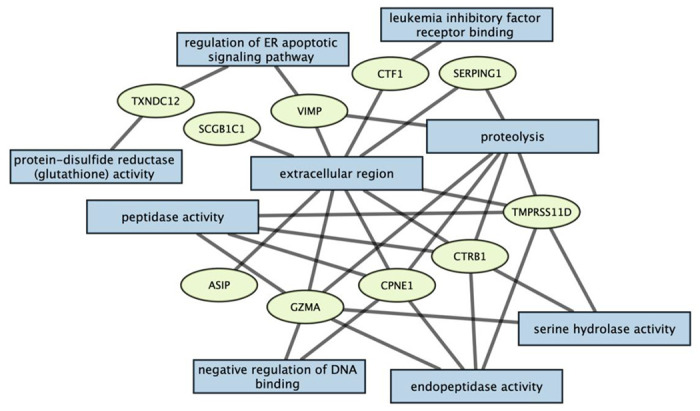
Enrichment analysis of proteins using the g:Profiler tool. The rectangles correspond to the various enriched Gene Ontology terms and the proteins associated with each term are shown in ellipses.

Enrichment analysis of proteins using the g:Profiler tool. The rectangles correspond to the various enriched Gene Ontology terms and the proteins associated with each term are shown in ellipses.