

Abstract
Communication Quality Analysis (CQA) is a rigorous transcript-based coding method for assessing clinical communication quality. We compared the resource-intensive transcript-based version with a streamlined real-time version of the method with respect to feasibility, validity, reliability, and association with traditional measures of communication quality. Simulated conversations between 108 trainees and 12 standardized patients were assessed by 7 coders using the two versions of CQA (transcript and real-time). Participants also completed two traditional communication quality assessment measures. Real-time CQA was feasible and yielded fair to excellent reliability, with some caveats that can be addressed in future work. CQA ratings were moderately correlated with traditional measures of communication quality, suggesting that CQA captures different aspects of communication quality than do traditional measures. Finally, CQA did not exhibit the ceiling effects observed in the traditional measures of communication quality. We conclude that real-time CQA is a user-friendly method for assessing communication quality that has the potential for broad application in training, research, and intervention contexts and may offer improvements to traditional, self-rated communication measures.
Keywords: Communication research methods, observational research methods, conversation analysis, intercoder reliability
Extensive literature describes critical deficiencies in clinician communication with patients and families across multiple contexts within healthcare that lead to poor outcomes for patients and family members while also stressing the healthcare system (Goldfarb et al., 2017; Gries et al., 2010; Heyland et al., 2003; Heyland et al., 2005; Leung et al., 2012; Mack et al., 2010; Menichetti et al., 2021; Scheunemann et al., 2019; Scott et al., 2019; White et al., 2007; Wilson et al., 2019). In the context of intensive care units, patients and their families consistently report that effective clinician communication is central to successfully negotiating complex end-of-life (EOL) issues and engaging in shared decision making, and they frequently rate communication quality as vital for high-quality care (Abbott et al., 2001; Curtis et al., 2001; Curtis et al., 2002b; Heyland et al., 2006; Parker et al., 2001; Steinhauser et al., 2000). Yet patients and families also consistently report dissatisfaction with clinician communication, particularly in high-stakes EOL situations where communication and trust in clinicians is critical (Azoulay et al., 2000; Curtis et al., 2005; Institute of Medicine, 2015). Thus, identifying and intervening on communication deficiencies are particularly important in EOL conversations where stakes are high and communication quality is linked to life and death outcomes.
Specifically, high-quality communication about patient values and goals decreases adverse psychological outcomes in patients and families (Curtis et al., 1999; Detering et al., 2010; Lautrette et al., 2007; Weiner & Roth, 2006; Wright et al., 2008) and improves pain and symptom control (Cleeland et al., 1994; Coyle et al., 1990; McCarthy et al., 2000; Stewart, 1995), patient and family member satisfaction (Curtis et al., 2012; Heyland et al., 2009), patient quality of life (Temel et al., 2010), and quality of dying and death (Curtis et al., 2002a; Patrick et al., 2003). By contrast, low-quality EOL communication results in greater patient and family dissatisfaction with care and higher incidence of unwanted, invasive, and expensive EOL treatments (Abbott et al., 2001; Azoulay et al., 2000; Casarett et al., 2005; Detering et al., 2010; Heyland et al., 2006; Heyland et al., 2009; Wright et al., 2008; Zhang et al., 2009). In short, the cost of poor EOL communication is significant for patients, their families, and society.
Accrediting bodies for medical and nursing schools as well as graduate medical education mandate communication training and consider excellent communication a core competency (Accreditation Council for Graduate Medical Education, n.d.; Commission on Collegiate Nursing Education, 2015; Liaison Committee on Medical Education, n.d.), yet there is little consensus among clinical educators or communication scholars about how best to measure what counts as high-quality clinical communication (Curtis et al., 2013; Dickson et al., 2012; Scott, 2014; Tulsky, 2005b; Walczak et al., 2016; Wittenberg-Lyles et al., 2008). Experts agree that to improve clinician-patient communication, a validated, flexible, and theory-driven communication assessment tool is needed since such a tool would enable scholars and clinicians to better tailor their efforts to improve communication in real-world settings (Street & Mazor, 2017). However, as Street and Mazor (2017) have observed, “over the past 40 years little has been done within communication science toward the development of a set of theoretically coherent, ontologically defensible, and epistemologically sound communication measures that could serve the needs of multiple research programs and health care quality improvement initiatives” (p. 1612). In light of the aforementioned associations between low-quality EOL communication and adverse health outcomes, the need for rigorous assessment and intervention concerning EOL communication is particularly critical, and thus clinical EOL discussion represents a key context within which to examine communication assessment.
Arguably, a patient’s perception of clinical communication quality is the gold standard for assessment, but gaining specific insight into the value of different communication practices is difficult to obtain from patient reports. Other methods for assessing communication quality, such as self-ratings (Back et al., 2007; Clayton et al., 2013; Downar et al., 2012; Krimshtein et al., 2011), standardized patient (SP) questionnaires (Akgun & Siegel, 2012; Bays et al., 2014; Downar et al., 2012; Engelberg et al., 2006), and outside-observer assessments (Alexander et al., 2006; Fallowfield et al., 2002; Roter et al., 1995) fall short of capturing what is really occurring in clinical conversations because they typically focus on whether particular communication behaviors are present or absent and give minimal consideration to the quality of the communication (Scott, 2014).
More specifically, there are at least four problems with these extant strategies for measuring communication. First, they prioritize quantity (e.g., frequency, length) of conversation over quality of conversation, which is especially problematic given the ample evidence that quality of communication is more important for EOL care outcomes than is the quantity (Heyland et al., 2006; Lautrette et al., 2007; Scott & Caughlin, 2014). Second, such strategies fail to capture the dynamic and complex nature of EOL communication, as evidenced by the fact that it is possible to score very high on current assessment tools while actually doing a poor job communicating (Dickson et al., 2012; Scott 2014; Wittenberg-Lyles et al., 2008). Third, there are so many non-theoretically-grounded and non-validated measures of communication quality that measure proliferation has become a concern (Street & Mazor, 2017). Finally, interventions using traditional assessments do not appear to align with patient perceptions of communication quality and, perhaps most concerning of all, do not appear to impact patient-centered health outcomes (Scott, 2014; Tulsky, 2005a; Uitterhoeve et al., 2010). In short, EOL conversations have unique features when compared with other types of clinical communication, and traditional measures do not appear to be fully capturing the salient elements of such interactions.
In response to these limitations, we developed and validated an innovative, theory-based, rigorous, and reliable method to evaluate the quality of EOL conversations: Communication Quality Analysis (CQA) (Van Scoy et al, 2017, 2018). This measure is grounded in the multiple goals theoretical perspective (Caughlin, 2010), which makes several theoretical assumptions that are explicitly integrated into the CQA method. First, the theory assumes that all communication is goal-directed and that three broad types of goals are salient in every conversation, including (1) task goals (e.g., making an EOL decision), (2) relational goals (e.g., validating relationships with others), and (3) identity goals (e.g., managing self-presentation) (Caughlin, 2010; Dillard, 1990). CQA explicitly incorporates this assumption by rating how well individuals enact attention to specific task, relational, and identity goals in clinical conversations. (Specifically, the measure identifies sub-domains of each goal: task goals encompass content and engagement domains, relational goals encompass emotion and relationship domains, and identity goals encompass face and accommodation domains. This is described in greater detail below and is illustrated in Figure 1).
Figure 1:
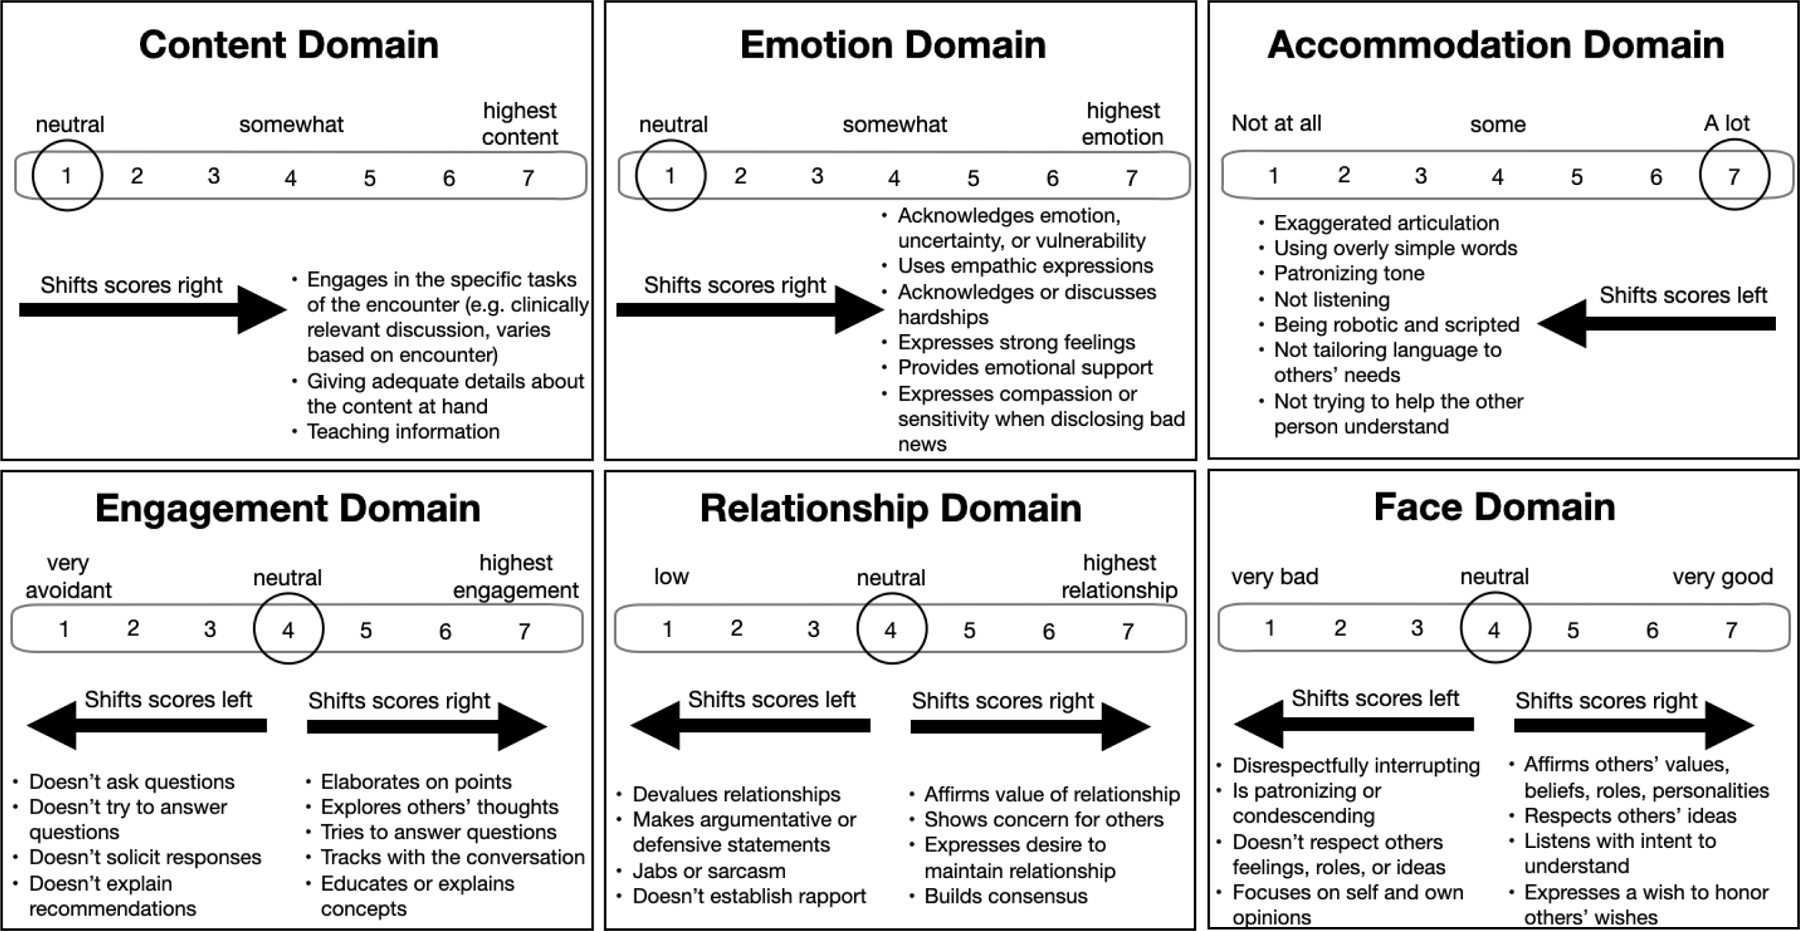
Rating process for CQA domains. A domain score is calculated for each of the six communication quality domains. Using the emotion domain as an example, the neutral score is assigned as a “1,” and as participants express emotion (as per the definition above and further detailed in the CQA codebook) the score increases. A domain score is assigned every five minutes for each of the six domains. All domains are scored 1–7 with “7” being the highest quality score.
Second, the theory defines high-quality communication not in terms of a checklist of communication behaviors, but instead as the extent to which the three broad communication goals are achieved. When all three goals are attended to simultaneously, high-quality communication occurs, but when one (or more) of the goals is ignored, low-quality communication results (Scott & Van Scoy, 2020). CQA implicitly accounts for this assumption by employing coders as “cultural informants” rather than as “detectors,” which allows them to integrate impressions of the frequency and affective intensity of communication (as opposed to simply counting behavior absence/presence). This does not mean the coders interpret the data completely differently. Rather, it means they are allowed to draw on in situ cultural knowledge to rate communication quality. This fosters an analysis of conversations with greater complexity and thus greater naturalistic accuracy than is afforded by coding for the frequency and intensity of specific discursive features separately (Bakeman & Gottman, 1997). CQA explicitly accounts for this second assumption through a composite “Multiple Goals Score” which identifies how well individuals simultaneously enact attention to all salient goals (rather than individual goals alone), as described below.
CQA is an intuitive, observational method that is easy to learn and incorporate into statistical analysis. CQA generates a quantitative score that reflects the extent to which individuals demonstrate attention to task, relational, and identity goals (Street & Mazor, 2017). CQA retains all the advantages of observational measures of communication quality (i.e., capturing different types of communicative actions, allowing for sequential analysis) and addresses some of the common disadvantages of observational measures, such as failure to specify which aspects of communication are associated with ratings and weak association with patient outcomes (Street & Mazor, 2017). The external validity of CQA has been demonstrated through its associations with a number of conversational outcomes, including measures of EOL decision-making efficacy, patient-surrogate concordance accuracy rates on clinical vignettes, EOL documentation, conversation satisfaction, relational closeness, and positive emotions after conversations (Scott & Caughlin, 2014, 2015; Scott, 2022). Previously, our interdisciplinary research team published data showing that CQA provides a robust and reliable measure of communication quality in diverse groups. Specifically, CQA has high interrater reliability (intraclass r = 0.73–0.89) and internal consistency (Cronbach alpha = 0.69–0.89) of conversations across multiple contexts while statistically accounting for covariates (p values < 0.02). (Van Scoy et al, 2017, 2018). Further, we have shown that the method is reliable when used in conversations with as many as 8 or as few as 2 participants (Van Scoy et al, 2017, 2018).
The primary drawback of CQA in its current format is the cost-, labor-, and time-intensive nature of the method as it currently requires conversations to be transcribed verbatim from audio or video files for analysis. Even though speech-to-text technology makes transcripts more accessible, there are still several drawbacks to a transcript-based measure. First, computerized transcriptions are often laden with inaccuracies. Second, transcripts cannot be made available instantly, and this introduces a substantial time delay between when the encounter occurs and when results are available, which is problematic for pragmatic uses of the method. For example, a critical aspect of successful communication intervention and training in medical education contexts is providing feedback for clinical trainees in real time, immediately after their observed interaction (Archer, 2010; Hattie & Timperley, 2007; Shute, 2008). In fact, previous research has identified the importance of immediate feedback after clinical encounters because it is more actionable than delayed feedback (Gregg et al., 2016; Ramani & Krackov, 2012; Sargeant et al., 2009; Watling, 2014). Moreover, ideally, feedback on communication quality should be provided using assessment techniques or measures that are reliable, valid, scalable, and theoretically grounded, but many existing assessments do not meet these criteria (Curtis et al., 2013; Dickson et al., Tulsky, 2005b; Wittenberg-Lyles et al., 2008).
To summarize, a more streamlined CQA measure based on real-time coding could capture the essence of more labor-intensive (i.e., transcript-based) coding and thus become a more useful tool for clinical practice, observation with feedback, or competency assessment of clinical trainees. Using CQA as an interdisciplinary tool requires a more streamlined and easily-implemented approach for use in both clinical and education settings. Thus, the overarching goal of the present study was to assess the viability of adapting our validated, transcript-based CQA method for use as a more user-friendly, real-time assessment tool of clinicians’ EOL communication quality. Our study, which compared the resource-intensive version of CQA using transcripts and the streamlined version of CQA using real-time coding, was guided by the following research questions:
RQ1: Are the transcript-based and real-time versions of CQA comparable in their reliability?
RQ2: Are the transcript-based and real-time versions of CQA comparable in their validity as measured by their associations with traditional measures of communication quality?
Materials and Methods
Participants and Recruitment
Participants were all clinical trainees (medical students, advanced practice nursing students, residents, and fellows) actively enrolled in the Penn State College of Medicine, Penn State College of Nursing, or Moravian College. Experienced actors were recruited from standardized patient (SP) programs at Penn State College of Medicine or Moravian College. We recruited a convenience sample of 108 clinicians-in-training (27 medical students, 27 advance practice nursing students, 27 residents, and 27 fellows) who represented varying levels of experience communicating with patients. Trainees were recruited via flyers and email listservs (with permission) from their training programs. The study protocol was approved by the Penn State College of Medicine’s Institutional Review Board. Trainees provided informed consent and received a $20 stipend. SPs were reimbursed at their regular hourly rate.
Simulated Encounters and Randomization
We chose to use simulated encounters for this study because they are the field standard for assessing communication skills of trainees in medical education. Using simulated encounters is recommended by the American College of Graduate Medical Education assessment guidebook, and standardized medical certification exams include SPs to assess clinical skills, so there is substantial precedent for using this approach in medical education and training assessment. Additionally, using simulated encounters allowed us to bolster our methodological rigor in several ways, including being able to randomize standardized scripting, statistically considering the topics and settings of the conversations, feasibility of data collection, and mitigating the difficulties of collecting private health information during this incremental step in the validation process. Finally, there is evidence supporting the use of elicited conversations as good proxies for real-life encounters (Bîtea, 1990).
Prior to the simulated encounter, we recorded trainees’ demographic information and their self-reported experience discussing EOL issues with patients. Trainees were randomized to one of four case scenarios. Clinical educators with expertise in SP exercises developed the four case scenarios to vary in complexity, task, and setting (Supplemental Table 1). Randomization was stratified on the trainee’s gender (male, female), level of training (medical students, advanced practice nursing students, residents, and fellows), and stage of training (early-stage, late-stage) using permuted blocks randomization (blocks of size 4 within each of the 24 strata combinations). The purpose of randomization was not to compare the four case scenarios but to apply CQA coding to a range of conversations. In the event that randomization resulted in a case scenario for which a SP was unavailable (n = 12), the encounter proceeded with a scenario for which a SP was available, and feasible substitutions to the randomized case script or updates to the trainee stratification factors were made. Encounters were hosted at the Penn State Simulation Center or Moravian College Simulation Center, which provided staged clinical environments with built-in video recording. Prior to each encounter, trainees received a one-page summary of the clinical scenario and their task and were allotted 30 minutes to complete the encounter. After the encounter, trainees and SPs completed post-conversation questionnaires assessing their perceptions of the communication quality of the encounter. The duration of recorded conversations ranged between 10 and 30 minutes.
Measures
All conversations were assessed using both versions of CQA (transcript-based and real-time) and two traditional communication quality assessment tools.
Traditional Tool 1: Simulation Assessment Questionnaire
The 16-item Simulation Assessment questionnaire (adapted from Downar et al., 2012) assesses critical care trainees’ communication skills during simulated EOL conversations (Downar et al., 2012; Schnabl et al., 1991). Missing data were handled as described in the footnote of the Supplemental Table. Using an 11-point Likert-type scale (0 = worst communication, 10 = best communication), SPs and trainees reported perceptions of trainees’ interpersonal skill, communication ability, and global assessments of communication skills.
Traditional Tool 2: Scott Communication Quality Assessment Questionnaire
The 16-item measure developed by Scott et al. (2014, November) asks respondents to rate the quality of their conversations using 7-point Likert semantic differentials. The measure uses paired opposites to assess communication effectiveness (e.g., “effective/ineffective,” “useful/useless”), appropriateness (e.g., “appropriate/inappropriate,” “respectful/disrespectful”), supportiveness (e.g., “supportive/unsupportive,” “comforting/upsetting”), and sophistication (e.g., “sophisticated/unsophisticated,” “skillful/not skillful”). In the present study, the overall measure had excellent reliability (Cronbach α = .98 and .95 respectively for SPs and trainees).
Communication Quality Analysis
The previously validated CQA method (i.e., transcript-based version) involved coders reviewing audio files while following along with verbatim transcripts. For every 5-minute interval, each coder assigned a rating score (on a 7-point scale, 1 = not at all, 7 = to a great degree) for each of the six communication quality domains (Table 1 presents a summary of the codebook definitions for the six domains, which include content, engagement, emotion, relationship, face, accommodation). All domains had been used previously to code clinical conversations except accommodation, which previously had been used to code non-clinical conversations (Scott & Caughlin, 2015). The present study was the first time accommodation was used to code clinical conversations. Additional scoring details are provided below (see the section on CQA Scoring). By having coders rate the degree to which each domain is attended on a 7-point scale, CQA provides a more robust assessment of the communication behavior compared to simple present/absent measures.
Table 1:
Conversation Quality Analysis codebook: Abbreviated domain definitions
| Goal | Domain | Brief definition |
|---|---|---|
| Task | Content | Discussion of clinically relevant topics (e.g., exploring values/beliefs relevant to treatment options); providing discrete directions for care (e.g., making decisions); elaborating on reasons for treatment choices, discussing prognosis |
| Engagement | Paying attention; tracking with the conversation; asking others to elaborate on statements; elaborating on viewpoints; asking/answering questions; being engaged | |
| Relational | Emotion | Expressing vulnerability or intense emotions; disclosing personal experiences and thoughts; discussing or acknowledging hardships; offering emotional support and empathy; acknowledging the other’s emotion |
| Relationships | Establishing rapport; affirming the value of relationships; showing a desire to repair relationships; building consensus; showing empathy | |
| Identity | Face | Showing approval and respect for others; respecting autonomy; affirming others’ values or beliefs; listening with intent to understand; expressing a wish to honor others’ wishes; considering impact of decisions on others |
| Accommodation | Tailoring communication to the other person’s needs; not being patronizing or condescending; not over-simplifying or over-emphasizing; not being ‘lazy’ in communication, ignoring others’ contribution to the conversation; being scripted/robotic; going through the motions |
The new real-time CQA method involved scoring the conversations using the same process but with one difference: The coders watched the video without pausing or reading transcripts to simulate ‘real-time’ coding. That is, the lack of pausing and transcripts was the only difference between the two conditions.
Coder Training
Using previously published procedures, eight coders were trained using six video recorded training modules (ranging in length from 10 to 25 minutes per module) that covered Multiple Goals Theory and each of the domains assessed in CQA (accompanied by a detailed CQA coding manual) according to previously published procedures. After the initial training, coders used the transcript-based method to independently code several randomly selected family meetings from a separate dataset in a practice round (using the scoring process described below). Codes were reviewed as a group in a meeting led by the first two authors, and discrepancies in rating scores were resolved through group discussion. Then, coders independently coded a second set of practice meetings from a separate dataset, followed by another calibration meeting and finally a third round of independent coding, the codes from which were used to establish interrater reliability.
SPSS version 27 was used to assess interrater reliability of CQA coders’ scores for both trainees and SPs using intraclass correlation coefficients (ICCs), which entailed evaluating trainee and SP CQA scores independent of their dyadic structure (unpaired). The ‘Average Measures’ ICC values are SPSS Type C intraclass correlation coefficients measuring consistency, and these ICCs were used to assess the reliability of coders within each coding method for data structured in groups (Fleiss et al., 2013). Discrepancies were adjudicated until fair interrater reliability was consistently achieved (ICC > 0.40) (Fleiss et al., 2013). Real-time condition ICCs ranged from 0.537 to 0.879 (Table 2), which fall within the fair (.40-.59), good (.60-.74), or excellent (.75–1.00) range (Cicchetti, 1994). ICCs for the transcript-based condition were stronger, ranging from 0.664 to 0.899, which is considered good to excellent (Cicchetti, 1994). More frequent iterative interim calibration procedures for real-time coding may improve the ICCs for domains that were less than 0.650 (i.e., within the good range).
Table 2:
Intraclass correlations for trainee and SP CQA scores
| CQA domain | Real-time coders (95% CI) | Transcript coders (95% CI) |
|---|---|---|
| Content | 0.721 (0.650–0.780) | 0.744 (0.676–0.800) |
| Engagement | 0.521 (0.398–0.622) | 0.665 (0.551–0.723) |
| Emotion | 0.558 (0.445–0.651) | 0.899 (0.873–0.922) |
| Relationship | 0.784 (0.728–0.829) | 0.837 (0.794–0.873) |
| Face | 0.878 (0.847–0.904) | 0.827 (0.782–0.865) |
| Accommodation | 0.633 (0.540–0.711) | 0.778 (0.720–0.827) |
Random Assignment into Coding Conditions
Coders were randomly assigned to transcript-based or real-time coding conditions (4 to each). Adhering to the previously published CQA method (described below), transcript-based coders used both videos and transcripts (with pausing) to code. By contrast, real-time coders watched the videos and scored the 108 conversations in real time (without transcripts or pausing; coders watched the time stamp of the video file to code every 5 minutes). All conversations (for both conditions) were coded by at least three coders.
CQA Scoring
After successful coder calibration on the training dataset, coders applied CQA to recordings of the 108 conversations (within the parameters of their coding condition). Figure 1 illustrates how the codebook was translated into a 7-point numeric score for each of the six communication quality domains. Depending on the domain, coders began at a “neutral” starting point (see circles in Figure 1). From there, coders moved scores while listening to the recording based on the extent to which the participants demonstrated characteristics of each domain as defined in the coding manual (excerpts provided in Figure 1). For the content (task goal) and emotion (relationship goal) domains, scoring began at the neutral point of “1”, and as participants enacted high-quality communication in the domain, the scores were increased based on the extent of and quality with which the communication behavior was enacted. For the engagement (task goal), relationship (relationship goal), and face (identity goal) domains, the neutral point was “4” and scores moved up or down based on the codebook definitions of high- and low-quality communication for those domains. Coders started the accommodation domain at the neutral point of “1” (optimal tailoring of communication with minimal levels of under- and over-accommodation), and as the accommodation level worsened (became increasingly under- or over-accommodating), scores were increased towards “7”. Accommodation scores were then reverse coded so for that all domain scores, higher scores indicated higher quality communication. (In future studies, the need for reverse coding may be eliminated by updating the scoring instructions so that coders begin at “7” as the neutral and move downwards towards “1” as appropriate accommodation levels deteriorate (as shown in Figure 1).) The starting points differed among the domains based on what made sense conceptually – for instance, since face can be affirmed or undermined, it is sensible to start at the midpoint of the scale (“4”) to allow coders to move in either direction, whereas for the emotion domain, it is sensible to start coding at “1” and move up as emotion is expressed.
Each of the six domains was scored every five minutes, and coders were instructed to assign domain scores based on the overall attention to that domain during the five-minute segment (see Supplemental Figure 1 for illustration of scoring across time intervals). Dependent upon the type of statistical analysis, scores were either (1) averaged across all time segments for each coder within each conversation (when coder-level metrics were needed for analysis), or (2) aggregated across coders of each coding method within each conversation (when coder-level averages by condition were needed).
The individual domain scores represent “depth” scores of communication quality by demonstrating attention to specific goals, allowing us to examine the impact of attention to individual goals. To also create a “breadth” score of communication quality in which attention to all three types of goals is weighted equally, we calculated the Multiple Goals Score – a single ordinal value that condenses the scores for the six individual domains (which, together, account for the three broad communication goals – see Supplemental Figure 2) into a single score for each time interval (as illustrated in Figure 2). We first calculated the sample means for the trainees (across all 108 conversations) for each of goal scores (task, relational, identity) for the transcript-based and real-time conditions. Next, these sample means were used as the reference point to assign each time interval a normative task, relational, and identity score of “0” (if the goal score was at or below the corresponding sample mean) or “1” (if the goal score was above the corresponding sample mean). This resulted in a series of zeros and ones across all five-minute time intervals. The sums of the three normative goal scores at each time interval (range 0–3) represent the Multiple Goals Score given to each five-minute unit of conversation. The time segments are then aggregated according to statistical analysis interests and needs (i.e., coder-level averages vs. average of coder-level averages, as outlined previously above).
Figure 2.
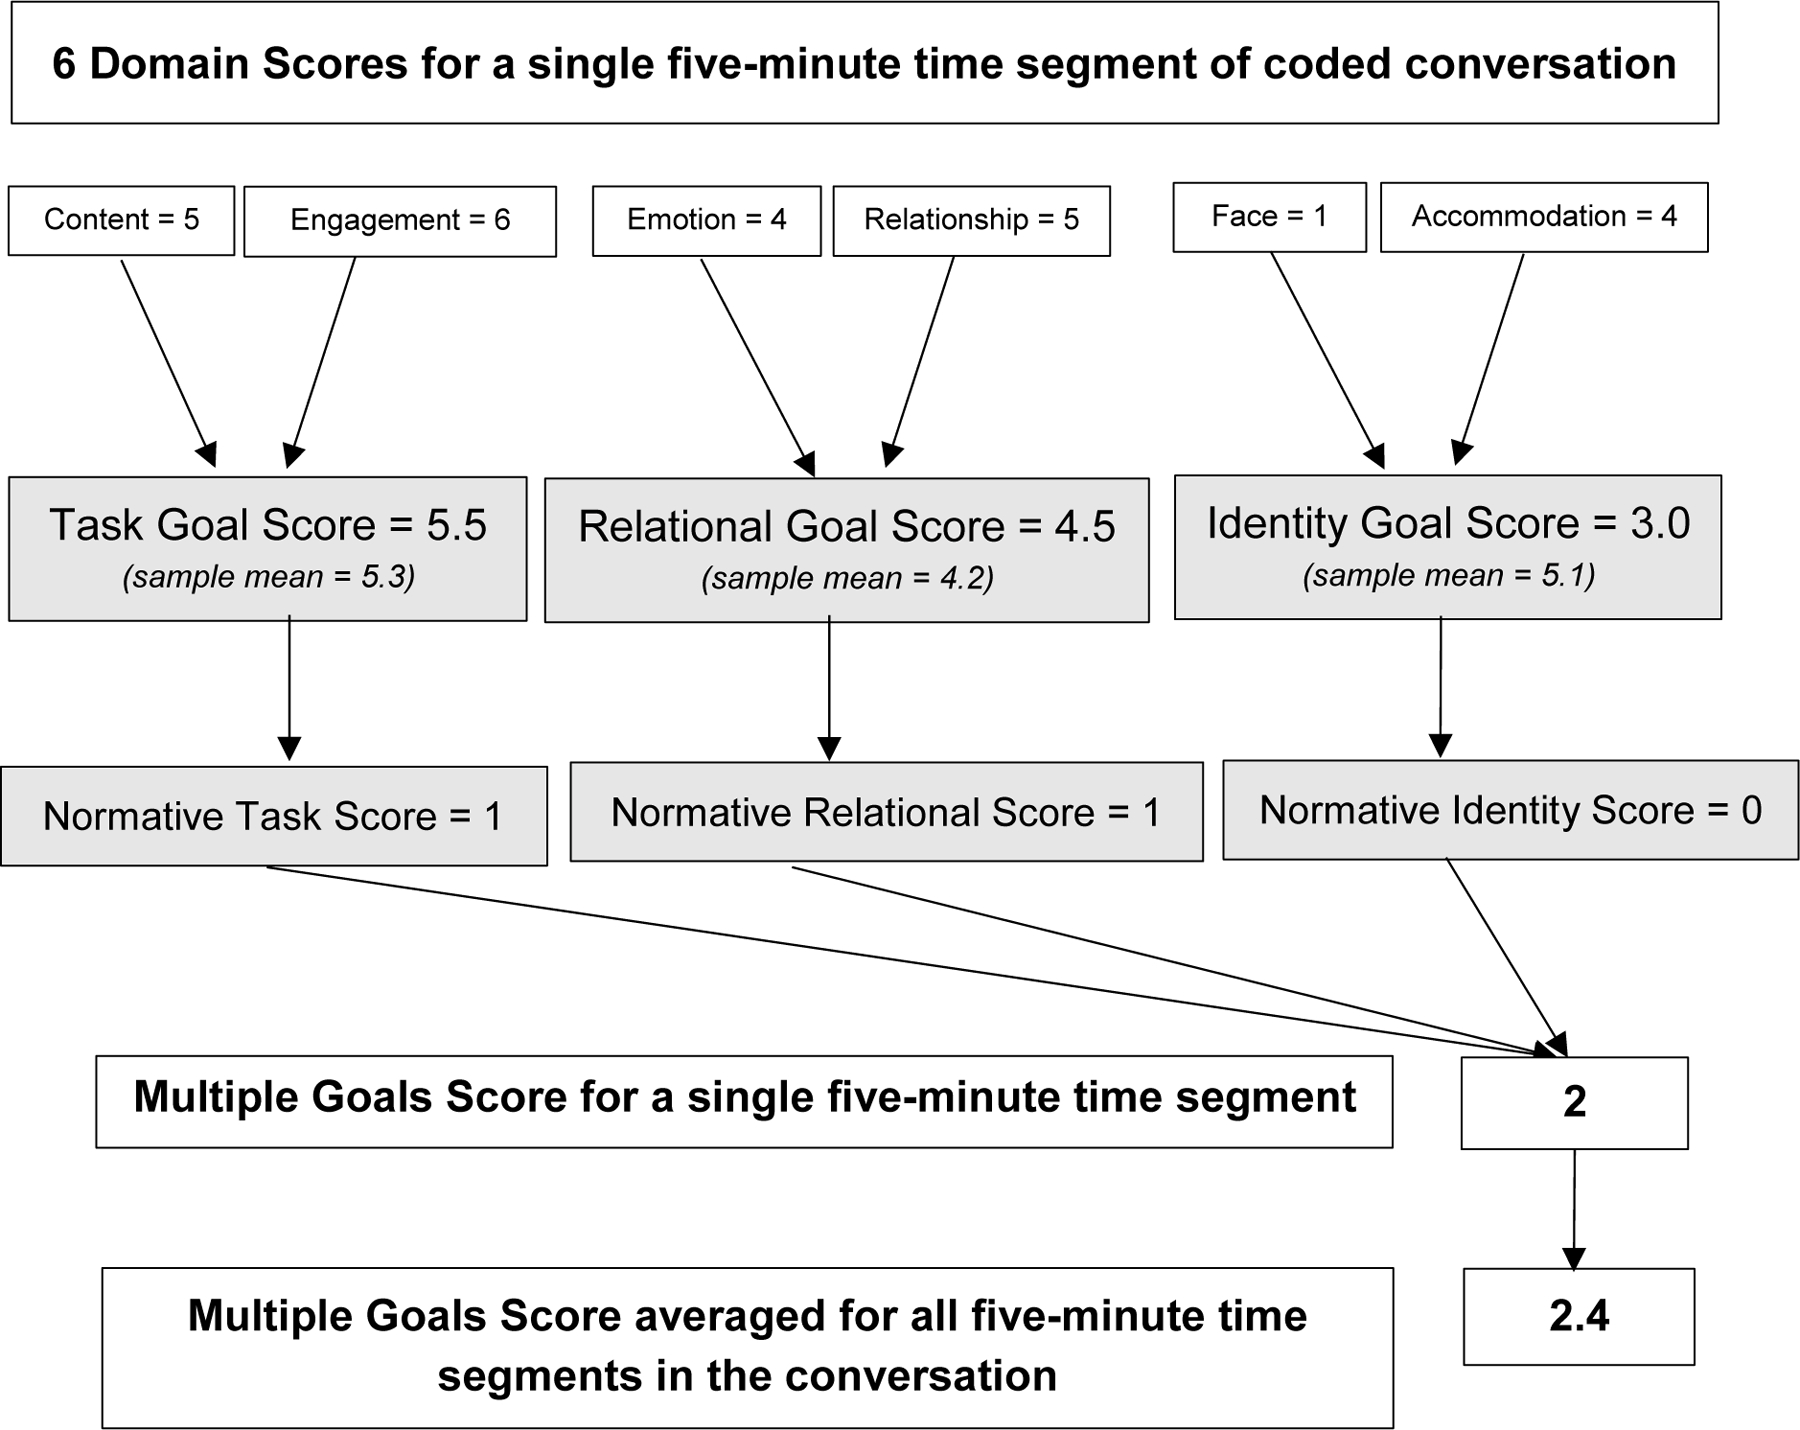
Calculating the Multiple Goal Score (hypothetical data example). The Multiple Goals Score combines individual scores for the 6 quality domains into a single “breadth” score. First, the six domain scores are combined into three goals scores that represent attention to task (the average of content and engagement domains), relational (the average of relationship and emotion domains), and identity goals (the average of face and accommodation domains). For each of these three goals, a normative score is assigned: “0” if the participant scores at or below the sample mean for the goal or “1” if the participant scores above the sample mean for the goal. The Multiple Goals Score is calculated for each time segment by taking the sum of the three normative goal scores (resulting in a range from 0–3). Once the Multiple Goals Score is calculated for each five-minute time segment, analyses then determine the aggregation approach to averaging across all time intervals.
Analysis
Sample Size Justification
For the sample size of 108 conversations, a computer simulation study (which generated 1,000 datasets, each with 108 conversations) was used to determine the precision of the 95% confidence interval for measuring the agreement between the two CQA coding methods via the concordance correlation coefficient . The computer simulation study followed the study design, accounting for the coding method, the coders, and the coders nested within each coding method, while assuming balance in the number of coders within each coding method. Each of these datasets was generated using a strong assumption that , while investigating the null hypothesis versus the alternative hypothesis . The computer simulation study displayed 91.5% statistical power for rejecting the null hypothesis in favor of the alternative, with two-sided tests at a significance level of 0.05 when the sample size consisted of 108 conversations. The interclass correlation coefficient between the two coding methods is asymptotically equivalent to the concordance correlation coefficient.
The study was powered under much more stringent assumptions and nuanced measures of agreement (concordance correlation coefficients, CCCs) than are typically used in the field of communication, where various measures of reliability and directional consistency relying on coefficients similar to those of Cronbach’s Alpha are more of interest and standardly reported. Conceptually, Cronbach’s Alpha assesses the squared correlation of coders with the overall coder average, whereas the CCC averages the agreement between each pair of coders (making the CCC more stringent and conservative). Noting this, the sample size of 108 conversations is conservative, and therefore appropriate, for the Cronbach Alpha type of reliability statistics reported for this work.
Statistical Analysis
All analysts were blinded to which CQA coders were assigned to each coding method condition for as long as feasibly possible when analyzing data. Descriptive summary statistics for both the trainees and the SPs are reported as means and standard deviations for continuous measures and frequencies and column percentages for categorical measures. A total of 12 SPs were used across the variety of 108 conversations based on SP schedule availability and script or case scenario training (see ‘Simulated Encounters and Randomization’ section above). Additionally, there were 4 types of personas that the SPs were asked to implement during their randomized case scenario script: (1) histrionic and emotional, (2) tangential and affirming, (3) suspicious and distrustful, or (4) stoic and denial. Combining these personas with the randomized case scenario scripts yielded 8 possible situational acting strata that could be used to classify each of the 108 conversations (see Supplemental Table 1). In the statistical model, we accounted for the 8 acting strata, the CQA coders (7 coders; 1 excluded due to lack of calibration with the group), and the CQA coders nested within each coding method (3 real-time coders; 4 transcript coders). We invoked a nonlinear mixed effects model to calculate adjusted mean estimates for each of the coding methods and adjusted estimates for the difference in means between the coding methods (and corresponding 95% confidence intervals) for each of the six CQA domains and the Multiple Goals Score for the trainees.
Furthermore, we invoked the nonlinear model to calculate an estimate of the correlation coefficient between the two coding methods (square root of Cronbach’s Alpha) and corresponding 95% confidence intervals for each of the six CQA domains and the Multiple Goals Score for the trainees. Estimates for the square root of Cronbach’s Alpha (and associated 95% confidence intervals) are also reported from the non-linear model described above to present reliability estimates of the coders for trainee CQA domains and scores within each of the two coding methods. Cronbach’s Alpha is calculated as a squared correlation coefficient, therefore the square root of the estimate is reported and can be interpreted as a correlation coefficient amongst the coders within each of the coding method conditions. We constructed partial Spearman correlation estimates and 95% confidence intervals (bias-adjusted using Fisher’s z-transformation) accounting for acting strata to explore the associations between each of the six CQA domains and the Multiple Goals Score for the trainees. For the latter, we applied the traditional tools – self-assessment and the SPs’ ratings of the trainees – for each coding method. Descriptive summary statistics are provided for preliminary data exploring the construct validity of CQA. Means and standard deviations of trainee CQA domains and the Multiple Goals Scores are reported for each category of prior communication experience of the trainees. Prior communication experience was collected for contributing to and leading end-of-life conversations, as well as prior formal training or work experience involving interpersonal communication. SAS Version 9.4 was used for these analyses. All hypothesis tests were two-sided assuming a significance level of 0.05.
Results
Study Population
Table 3 displays participant demographics. Equal numbers of trainees were recruited, with 27 per trainee type. Trainees’ mean age was 30.75 years (SD = 6.78), and 58.33% were female and 64.81% were white. The 12 SPs had a mean age of 61.58 years (SD = 10.06), 100% were white, and they were predominantly (83.33%) female.
Table 3:
Participant demographics
| Medical students (n = 27) |
Residents (n = 27) |
Fellows (n = 27) |
Nurse/Nurse Practitioner Students (n = 27) |
All trainees (N = 108) |
Standardized patients (N = 12) |
|
|---|---|---|---|---|---|---|
| Age, Mean (SD) | 25.50 (1.92) a | 28.70 (2.32) | 32.93 (6.06) | 35.85 (8.94) a | 30.75 (6.78) b | 61.58 (10.06) |
|
| ||||||
| Race/Ethnicity | ||||||
| White | 15 (55.56) | 18 (66.67) | 16 (59.26) | 21 (77.78) | 70 (64.81) | 12 (100.00) |
| African-American | 2 (7.41) | 1 (3.70) | 2 (7.41) | 2 (7.41) | 7 (6.48) | 0 (0.00) |
| Asian/Pacific Islander | 6 (22.22) | 5 (18.52) | 7 (25.93) | 2 (7.41) | 20 (18.52) | 0 (0.00) |
| Hispanic/Latino | 2 (7.41) | 1 (3.70) | 2 (7.41) | 1 (3.70) | 6 (5.56) | 0 (0.00) |
| Two or More Races c | 2 (7.41) | 2 (7.41) | 0 (0.00) | 1 (3.70) | 5 (4.63) | 0 (0.00) |
|
| ||||||
| Gender | ||||||
| Male | 10 (37.04) | 16 (59.26) | 17 (62.96) | 2 (7.41) | 45 (41.67) | 2 (16.67) |
| Female | 17 (62.96) | 11 (40.74) | 10 (37.04) | 25 (92.59) | 63 (58.33) | 10 (83.33) |
|
| ||||||
| Prior formal training or work experience involving interpersonal communication d | NA | |||||
| No | 22 (81.48) | 27 (100.00) | 23 (85.19) | 19 (70.37) | 91 (84.26) | |
| Yes | 5 (18.52) | 0 (0.00) | 4 (14.81) | 8 (29.63) | 17 (15.74) | |
|
| ||||||
| Experience contributing to EOL conversations with patients and/or patient’s families | NA | |||||
| Never (0 conversations) | 14 (51.85) | 5 (18.52) | 1 (3.70) | 5 (18.52) | 25 (23.15) | |
| Few (1–3 conversations) | 11 (40.74) | 13 (48.15) | 3 (11.11) | 10 (37.04) | 37 (34.26) | |
| Some (4–10 conversations) | 2 (7.41) | 5 (18.52) | 9 (33.33) | 7 (25.93) | 23 (21.30) | |
| Many (>10 conversations) | 0 (0.00) | 4 (14.81) | 14 (51.85) | 5 (18.52) | 23 (21.30) | |
|
| ||||||
| Experience leading EOL conversations with patients and/or patient’s families | NA | |||||
| Never (0 conversations) | 21 (77.78) | 12 (44.44) | 2 (7.41) | 14 (51.85) | 49 (45.37) | |
| Few (1–3 conversations) | 5 (18.52) | 7 (25.93) | 4 (14.81) | 5 (18.52) | 21 (19.44) | |
| Some (4–10 conversations) | 1 (3.70) | 5 (18.52) | 8 (29.63) | 4 (14.81) | 18 (16.67) | |
| Many (>10 conversations) | 0 (0.00) | 3 (11.11) | 13 (48.15) | 4 (14.81) | 20 (18.52) | |
SD = Standard Deviation; EOL = end-of-life; NA = Not Applicable
Categorical measures reported as frequency (column %).
n = 1 missing value
n = 2 missing values
n = 1 trainee selected ‘Other’ Race/Ethnicity and provided an open-text response that was recoded and reported here as part of the ‘Two or More Races’ category
e.g. a degree in communication, prior work as a social worker, etc.
Reliability Assessments of Real-time versus Transcript-based CQA Methods
Mean Trainee Scores and Correlation between CQA Coding Methods
We found that real-time coding was feasible and yielded comparable scoring results to transcript-based coding, with some caveats (Table 4). Since CQA is a novel measure, there is not yet data to define a true “clinically meaningful difference” between the two versions of the method. We predetermined that we would consider a difference between means of greater than 0.5 to be a potentially clinically relevant difference given (1) the coding procedure involves moving incrementally up and down on an ordinal scale and (2) the aggregation of scores across time intervals. Mean scores for both real-time and transcript-based codes for the content, emotion, and engagement domains had less than a 0.50 difference. For the relationship, face, and accommodation domains, the differences in means were > 0.50. The two coding methods had similar mean estimates for the overall Multiple Goals Score, with a difference of 0.21. Further, the correlation coefficients (Table 4) show that the two coding methods share a positive linear relationship for all six domains and the Multiple Goals Score (consistent directionality).
Table 4:
Real-time trainee CQA scores versus transcript trainee CQA scores
| CQA Domain | Real-time Mean (95% CI) | Transcript Mean (95%CI) | Difference in Means (95% CI) | Correlation coefficient real-time vs. transcript (95% CI) |
|---|---|---|---|---|
| Content | 5.93 (5.84, 6.01) | 6.12 (6.07, 6.17) | −0.19 (−0.27, −0.12) | 0.62 (0.55, 0.70) |
| Emotion | 3.16 (2.98, 3.33) | 3.59 (3.45, 3.72) | −0.43 (−0.59, −0.28) | 0.26 (0.23, 0.30) |
| Engagement | 5.99 (5.88, 6.10) | 5.85 (5.79, 5.90) | 0.14 (0.05, 0.24) | 0.49 (0.42, 0.55) |
| Relationship | 5.32 (5.18, 5.46) | 4.78 (4.70, 4.85) | 0.54 (0.44, 0.64) | 0.46 (0.41, 0.50) |
| Face | 5.43 (5.28, 5.58) | 4.72 (4.64, 4.80) | 0.71 (0.60, 0.82) | 0.42 (0.38, 0.47) |
| Accommodation | 5.42 (5.32, 5.52) | 6.36 (6.29, 6.43) | −0.94 (−1.04, −0.84) | 0.39 (0.31, 0.48) |
| Multiple Goals Score | 1.72 (1.62, 1.83) | 1.52 (1.43, 1.61) | 0.21 (0.12, 0.29) | 0.46 (0.41, 0.51) |
Correlation amongst CQA Coders within each Coding Method for Trainee Scores
To assess coder reliability for each CQA coding method with an approach that is aligned with the iterative coder calibration process described previously, Table 5 reports the correlation amongst the coders within each of the coding methods (real-time and transcript). Overall, the coder reliability for each of the methods across the CQA domains was relatively strong and stable, and generally similar between the two coding methods. However, for the accommodation domain, there was a discrepancy in the coder reliability between the two methods, as the transcript coders achieved “excellent” level of reliability in their codes for the trainees [0.87 (0.82, 0.91) vs. ‘”good” level of reliability for the real-time coders [0.66 (0.52, 0.80)].
Table 5:
Coder reliability estimates within coding methods for trainee CQA scores
| CQA Domain | Real-time coders square root of Cronbach’s Alpha (95% CI) |
Transcript coders square root of Cronbach’s Alpha (95% CI) |
|---|---|---|
| Content | 0.61 (0.47, 0.76) | 0.69 (0.57, 0.80) |
| Engagement | 0.68 (0.55, 0.81) | 0.75 (0.66, 0.84) |
| Emotion | 0.71 (0.62, 0.81) | 0.82 (0.76, 0.89) |
| Relationship | 0.77 (0.69, 0.85) | 0.79 (0.71, 0.87) |
| Face | 0.82 (0.75, 0.88) | 0.77 (0.68, 0.86) |
| Accommodation | 0.66 (0.52, 0.80) | 0.87 (0.82, 0.91) |
Note. Cronbach’s Alpha is a squared correlation coefficient.
Validity Assessment of Real-time versus Transcript-based CQA Methods
Correlations with Traditional Assessment Tools
For the transcript-based and real-time CQA methods, correlations between trainee CQA scores with the traditional assessment tools were low, with the strongest observed correlation of 0.50 (Supplemental Table 2). Correlations were generally strongest between CQA scores and the three SP assessments of trainee communication quality and lowest between CQA scores and the three trainee self-assessment scores (ranging 0.00 to 0.26). The Multiple Goals Score was most strongly correlated with the SP assessments of the trainee, specifically the Scott (2014) communication quality score (0.44 for real-time coding and 0.30 for transcript-based coding) and the global single-item score (0.43 for real-time coding and 0.26 for transcript coding).
CQA Scores Stratified by Prior Experiences with End-of-life Conversations and interpersonal communication
As another measure of validity, we compared the mean trainee CQA scores for both coding methods stratified by participants’ prior experience contributing to and leading to EOL conversations and whether they had prior formal training or work experience involving interpersonal communication. In general, CQA scores increased as experience with EOL conversations and interpersonal communication increased for both methods of coding (Table 6).
Table 6.
Means and standard deviations of trainee CQA scores for real-time and transcript coding methods stratified by experiences with end-of-life conversations
| Experience Contributing to EOL Conversations | |||||
|---|---|---|---|---|---|
| Never | Few (1–3) | Some (4–10) | Many (>10) | ||
| Real-time CQA coding of trainees | Content | 5.80 (1.50) | 5.86 (1.52) | 6.05 (1.34) | 6.02 (1.38) |
| Emotion | 3.16 (2.02) | 3.08 (1.88) | 2.95 (1.88) | 3.63 (2.13) | |
| Engagement | 5.88 (1.21) | 5.94 (1.11) | 5.94 (1.16) | 6.29 (0.85) | |
| Relationship | 5.35 (1.32) | 5.24 (1.25) | 5.14 (1.51) | 5.66 (1.15) | |
| Face | 5.51 (1.28) | 5.34 (1.30) | 5.23 (1.53) | 5.70 (1.20) | |
| Accommodation | 5.37 (1.31) | 5.45 (1.48) | 5.33 (1.62) | 5.51 (1.42) | |
| Multiple Goals Score | 1.64 (1.00) | 1.70 (0.94) | 1.66 (1.00) | 1.97 (0.89) | |
|
| |||||
| Transcript CQA coding of trainees | Content | 6.09 (0.73) | 6.11 (0.81) | 6.16 (0.73) | 6.19 (0.68) |
| Emotion | 3.63 (1.42) | 3.53 (1.40) | 3.44 (1.34) | 3.58 (1.49) | |
| Engagement | 5.81 (0.91) | 5.81 (0.90) | 5.80 (0.92) | 5.93 (0.84) | |
| Relationship | 4.75 (0.79) | 4.77 (0.89) | 4.78 (0.93) | 4.94 (0.89) | |
| Face | 4.67 (0.90) | 4.72 (0.92) | 4.75 (0.94) | 4.84 (0.93) | |
| Accommodation | 6.32 (0.74) | 6.37 (0.67) | 6.39 (0.71) | 6.37 (0.74) | |
| Multiple Goals Score | 1.44 (1.08) | 1.51 (1.07) | 1.50 (1.01) | 1.64 (1.05) | |
| Experience Leading EOL Conversations | |||||
| Never | Few (1–3) | Some (4–10) | Many (>10) | ||
|
| |||||
| Real-time CQA coding of trainees | Content | 5.90 (1.44) | 5.79 (1.63) | 6.07 (1.34) | 5.97 (1.40) |
| Emotion | 3.19 (1.97) | 3.06 (1.91) | 2.79 (1.88) | 3.68 (2.09) | |
| Engagement | 5.96 (1.13) | 5.87 (1.17) | 5.93 (1.15) | 6.30 (0.83) | |
| Relationship | 5.30 (1.27) | 5.28 (1.29) | 5.07 (1.55) | 5.70 (1.14) | |
| Face | 5.42 (1.28) | 5.39 (1.39) | 5.19 (1.53) | 5.72 (1.20) | |
| Accommodation | 5.40 (1.45) | 5.40 (1.46) | 5.45 (1.52) | 5.48 (1.44) | |
| Multiple Goals Score | 1.69 (0.94) | 1.70 (1.02) | 1.61 (0.97) | 1.99 (0.88) | |
|
| |||||
| Transcript CQA coding of trainees | Content | 6.10 (0.75) | 6.10 (0.84) | 6.22 (0.70) | 6.17 (0.69) |
| Emotion | 3.67 (1.43) | 3.31 (1.25) | 3.40 (1.46) | 3.60 (1.45) | |
| Engagement | 5.85 (0.89) | 5.72 (0.93) | 5.79 (0.90) | 5.94 (0.84) | |
| Relationship | 4.79 (0.84) | 4.75 (0.90) | 4.72 (0.93) | 4.96 (0.91) | |
| Face | 4.71 (0.90) | 4.72 (0.91) | 4.72 (0.95) | 4.87 (0.95) | |
| Accommodation | 6.37 (0.71) | 6.33 (0.68) | 6.41 (0.70) | 6.36 (0.76) | |
| Multiple Goals Score | 1.52 (1.06) | 1.39 (1.10) | 1.49 (0.96) | 1.65 (1.07) | |
| Prior Formal Training or Work Experience involving Interpersonal Communication | |||||
| No | Yes | ||||
|
| |||||
| Real-time CQA coding of trainees | Content | 5.89 (1.45) | 6.09 (1.44) | ||
| Emotion | 3.09 (1.93) | 3.75 (2.14) | |||
| Engagement | 5.96 (1.11) | 6.25 (1.05) | |||
| Relationship | 5.28 (1.27) | 5.62 (1.51) | |||
| Face | 5.38 (1.31) | 5.72 (1.48) | |||
| Accommodation | 5.44 (1.44) | 5.32 (1.56) | |||
| Multiple Goals Score | 1.68 (0.95) | 2.05 (0.94) | |||
|
| |||||
| Transcript CQA coding of trainees | Content | 6.14 (0.76) | 6.12 (0.71) | ||
| Emotion | 3.45 (1.38) | 4.04 (1.50) | |||
| Engagement | 5.80 (0.89) | 5.99 (0.90) | |||
| Relationship | 4.76 (0.85) | 5.04 (1.00) | |||
| Face | 4.70 (0.90) | 4.97 (1.00) | |||
| Accommodation | 6.36 (0.72) | 6.41 (0.67) | |||
| Multiple Goals Score | 1.47 (1.05) | 1.78 (1.07) | |||
Note. Means and standard deviations calculated by direct aggregation averaging across all 5 minute time segments
Discussion
Improving the quality of patient-clinician communication requires robust measures to evaluate the clinicians’ contributions to interactions with patients and families. There is no clear consensus on how best to assess and train clinicians in communication skills or how to examine the impact of such trainings on patient care and health outcomes. The goal of this study was to adapt the rigorous, theory-driven, transcript-based CQA method for assessing communication into a less labor-intensive and more user-friendly assessment of clinicians’ EOL communication quality that can be used in real time. Based on evaluation of 108 dyadic conversations, we found that the real-time method was feasible and that the reliability metrics for both CQA coding methods were acceptable (“good” to “excellent” for transcript-based coding and “fair” to “excellent” for real-time coding). In general, reliabilities were slightly higher for the transcript-based method for some domains, suggesting that additional refinement is needed for the real-time CQA alternative to be as reliable as the transcript-based standard. There was some variability between the methods when comparing the mean scores between the two coding methods, however the positive correlation coefficients indicate that the directionality in quality scores were consistent across methods.
With regards to interrater reliability, there were three domains (content, engagement, and accommodation) for which the real-time coding calibration process can be fine-tuned, as indicated by the reliability coefficients of in those domains (the coefficients were above the 0.40 threshold set for calibration, but ideally the coefficients would be greater than 0.70). A possible explanation for this is that the coding in the current project was completed over a longer period of time (9 months) than previous CQA projects have taken (typically 2–3 months), and thus the absence of transcripts as a reference point provided greater opportunity for coder drift over the longer time frame in the real-time condition. One strategy for improving real-time coding reliability would be to complete real-time coding over a shorter period of time with more frequent interim reliability checks among the coding team.
A second refinement to real-time coding involves the accommodation domain, which had been previously used to code non-clinical interactions but had not yet been used to assess clinical interactions. Perhaps not surprisingly, the accommodation domain experienced the largest discrepancy observed between the real-time and transcript-based coding reliabilities compared to the other domains (which were more robustly described in the codebook using clinical conversation examples). To improve interrater reliability in future work, the coding manual has been modified to provide clearer scoring examples for accommodation. Future research will examine whether these modifications improve coding score reliability.
Nevertheless, the slightly lower reliability estimates for real-time coding for most domains may be acceptable given the advantages of real-time coding in terms of resource efficiency. In its current form, CQA may be best applied using the standard transcript-based approach for research projects with ample resources. As with most research strategies, the researcher must balance feasibility and efficiency with precision and comparability to standard transcript-based scores. For example, for research comparing one communication intervention to another, as long as the same methodological approach is used consistently, comparative conclusions can still be made such that this tradeoff may not have substantial impact.
Still, future work will hone domain definitions and the calibration process as described above to improve the precision of the coding for real-time methods. In fact, the need for iterative process is not unexpected, as it speaks to the ecological validity of the CQA method – namely it demonstrates that CQA is an approach that captures nuances and complexities inherent in real-life communication. It then follows that any measure of communication quality that aims to demonstrate associations with conversational outcomes will likewise be nuanced and complex.
To pursue preliminary construct validity of CQA scoring, we used various measures of prior experience with EOL conversations to explore whether those trainees with more experience received higher quality communication scores with CQA. There appears to be a promising trend as we found that more experienced trainees seemed to have generally higher CQA scores for both coding methods. These data bolster the construct validity of CQA as past experience with communication is likely one important marker of quality, although additional studies are needed to confirm these findings.
Finally, to explore comparable validity of CQA scores, we measured associations with traditional communication measures and found that CQA scores were not well correlated with trainees’ self-assessments, but some domains were modestly correlated with the SP ratings. These weak to moderate correlations suggest that CQA is measuring something different than the other measures, which bolsters our argument that CQA is capturing something unique, which is likely why CQA has demonstrated associations with patient outcomes (Scott, 2022) in cases where other measures are poorly correlated with patient ratings of clinician communication (Burt et al., 2018). In addition, CQA ratings did not exhibit the ceiling effects often observed in the traditional measures. Additional studies (described below) have linked transcript-based CQA with health outcomes, also bolstering evidence for the validity of the scoring. Further assessments are needed to learn if real-time coding correlates with health outcomes as well.
Implications for Communication Assessment and Multiple Goals Research
This study was the first to apply the CQA method in analyzing clinician-patient encounters. Regardless of whether transcript-based or real-time coding is the preferred modality for a particular project, the current findings have a number of broader implications for communication assessment and multiple goals research. First, these results show that CQA can be reliably applied in medical and nursing education simulated encounters and clinical settings where assessing trainee communication quality in real time is critical for measuring competency and providing immediate feedback. CQA improves upon current assessment methods (i.e., frequency-based counts of behavior) commonly used in medical or nursing education because it is a theory-driven, objective, and streamlined measure of communication quality that can provide evidence-based, constructive feedback to clinicians-in-training, and in the case of real-time coding can do so immediately after a family meeting, during bedside rounds, and in many other real-time clinical settings. In particular, the Multiple Goals Score could be used to provide succinct feedback on trainees’ overall communication, and the individual domain scores could address more specific ways they could improve their communication quality.
Second, there are implications for assessing training interventions aiming to improve communication. The current study examined associations between CQA assessments and two traditional measures of communication quality. Both traditional questionnaires had generally low correlations with CQA scores, which might suggest that CQA measures different features of communication quality than traditional measures. This is may be reassuring because traditional measures of communication quality have been poorly correlated with health outcomes (Downar et al., 2017).
An alternative explanation to this is that CQA does not accurately measure communication quality (and traditional measures do). Recent studies refute this explanation, however, as they show that CQA does in fact correlate with outcomes related to EOL communication and patient health outcomes. Specifically, CQA scores were associated with completing EOL documentation and with patient/surrogate concordance accuracy rates on clinical vignettes, whereas other communication assessments, such as EOL conversation frequency, were not related to documentation (B = 0.64, p < 0.01 versus B = 0.07, p = .28) or concordance (B = 0.38, p < 0.01 versus B = −0.03, p = .43) (Scott, 2022). Additionally, CQA is related to other EOL conversation outcomes, such as relational closeness, conversational and relational satisfaction, hope, medical uncertainty, and decision-making efficacy. These findings bolster our confidence that CQA scores hold promise for explaining variance in health outcomes that has yet to be explained by traditional measures.
An important feature of CQA is its grounding in communication theory and how the method takes into account the multiplicity of goals relevant for assessing communication quality in clinical encounters (Scott & Van Scoy, 2020). Most real-time traditional assessments of communication quality (e.g., the Roter Interaction Analysis System; Roter & Larson, 2002) have coders draw one-to-one connections between a person’s statement and a specific code (i.e., each statement receives one code and only one code). Though this approach has the advantage of being simple and offering mutually exclusive categories in rendering results, it fails to capture real-life complexity of the multiplicity of goals entailed in clinical communication. It is precisely because messages often serve multiple goals that communicative behaviors in a conversation cannot be reduced to a singular goal for each statement. For instance, even a statement that is explicitly empathic often does more than show empathy; it also may honor another person’s autonomy, facilitate making a difficult decision, or strengthen a relationship. Conversely, the words a person speaks may symbolize empathy yet fail to actually show empathy if they are delivered in an impatient tone of voice. CQA (in both theory and practice) accounts for the complex nature of how conversations unfold in real life, acknowledging that (and measuring how) any given statement might pursue or achieve multiple goals. In this way, the method itself and our present findings lend empirical support for the theoretical assumptions of the multiple goals perspective that (a) task, relational, and identity goals are distinctly salient in EOL conversations and (b) attending to these goals simultaneously results in better communication than attending to only some (or none) of the goals.
Strengths, Limitations, and Future Work
The present investigation had several strengths, which can be built upon in future work. This was the first study to apply CQA to a clinical patient encounter, thus providing initial evidence for the feasibility of using CQA to assess clinical encounters. Furthermore, the method was rigorous (e.g., blinded analysis, use of multiple standardized clinical scenarios to ensure variability in setting and complexity of conversations), and we used a diverse sample of trainees from different training levels with varying levels of real-world experience, which supports the aim in achieving applicability of the method to trainees at all levels. Future work can examine how well CQA measures communication quality in other clinical contexts and can also investigate differences in communication quality between clinicians in different roles.
The study also has a number of limitations that point to directions for future research. The scope of our findings do not allow us to definitively compare CQA with traditional measures of communication quality in terms of patient-centered outcomes because the study was conducted in a simulated environment. Second, although there is evidence that staged conversations such as these do retain key features of real-life conversations (Bîtea, 1990), the simulated environments of the encounters in the present study may limit the generalizability to real-life clinical encounters. Future work could compare the extent to which real-time CQA and traditional measures of communication quality relate to outcomes in real-world conversations. A third limitation is lack of diversity among the 12 SPs and future research should also explore the potential effects of demographic characteristics on communication quality, such as race/ethnicity, gender, or age. Fourth, the lower levels of reliability in the real-time coding version need to be addressed given that the lower reliability could prevent us from detecting associations between conversational outcomes and CQA. Fine-tuning the real-time training modules will aim to address these concerns. Finally, although CQA has been and continues to be studied in contexts outside of EOL communication, the CQA method is currently most validated for EOL conversational content (which is why EOL communication topics were used in this study). Thus, the extent to which the CQA method is fully adaptable to non-EOL contexts is still under investigation.
In summary, the key finding from this study is that while transcript-based CQA exhibits stronger interrater reliability in some domains, real-time CQA is still a viable way to assess communication quality in dyadic clinical conversations. This sets the stage for CQA to be honed according to the recommendations above and used as a real-time assessment in clinical educational contexts or as an evaluation framework for interventional studies. Based on this study, real-time CQA is a promising approach for measuring how well individuals address multiple key goals in conversations where multiple goals need to be achieved for the conversation to be successful.
Practice Implications
CQA is a user-friendly method that can be used to assess clinicians’ and trainees’ communication quality using either transcript-based methods or in real-time. It has several advantages over traditional assessments of communication quality with the potential to improve communication assessments and interventions, and thereby the training of clinicians. CQA offers a theoretically-grounded way to rigorously and objectively assess the quality of EOL conversations in training environments, clinical rounds, and outpatient settings.
Supplementary Material
Acknowledgements
This work was funded by the National Institute of Health, National Institute of Nursing Research (R21NR017259). The authors would like to thank the Drs. Dennis Novack and Dr. Joseph Ballard for allow use of their standardized patient encounter scripts. We also thank Donald Bucher, DNP ACNP-BC, Deborah Halliday, MS, Jennifer Landis, BA and the Helen S. Breidegam School of Nursing at Moravian College. We are also grateful for additional CQA coders Richard Carter, MFA, A. Rosie Levi, Lauren Roberson, PhD, Sarah Sheff, PhD, Elizabeth Spencer, PhD, Symantha Webb, BA, and Carina Zelaya, MA. The data that support the findings of this study are available from the corresponding author, LJV, upon reasonable request.
Footnotes
Declaration of Interest Statement
Drs. Van Scoy and Scott hold copyright for the Communication Quality Analysis methodology and coding manual.
References
- Abbott KH, Sago JG, Breen CM, Abernethy AP, & Tulsky JA (2001). Families looking back: One year after discussion of withdrawal or withholding of life-sustaining support. Critical Care Medicine, 29, 197–201. 10.1097/00003246-200101000-00040 [DOI] [PubMed] [Google Scholar]
- Accreditation Council for Graduate Medical Education, n.d. “Common program requirements”https://www.acgme.org/what-we-do/accreditation/common-program-requirements/
- Akgun KM, & Siegel MD (2012). Using standardized family members to teach end-of-life skills to critical care trainees. Critical Care Medicine, 40, 1978–1980. 10.1097/CCM.0b013e3182536cd1 [DOI] [PubMed] [Google Scholar]
- Alexander SC, Keitz SA, Sloane R, & Tulsky JA (2006). A controlled trial of a short course to improve residents’ communication with patients at the end of life. Academic Medicine, 81, 1008–1012. 10.1097/01.ACM.0000242580.83851.ad [DOI] [PubMed] [Google Scholar]
- Archer JC (2010). State of the science in health professional education: Effective feedback. Medical Education, 44, 101–108. 10.1111/j.1365-2923.2009.03546.x [DOI] [PubMed] [Google Scholar]
- Azoulay E, Chevret S, Leleu G, Pochard F, Barboteu M, Adrie C, Canoui P, Le Gall JR, & Schlemmer B (2000). Half the families of intensive care unit patients experience inadequate communication with physicians. Critical Care Medicine, 28, 3044–3049. 10.1097/00003246-200008000-00061 [DOI] [PubMed] [Google Scholar]
- Back AL, Arnold RM, Baile WF, Fryer-Edwards KA, Alexander SC, Barley GE, Gooley TA, & Tulsky JA (2007). Efficacy of communication skills training for giving bad news and discussing transitions to palliative care. Archives of Internal Medicine, 167, 453–460. 10.1001/archinte.167.5.453 [DOI] [PubMed] [Google Scholar]
- Bakeman R, & Gottman JM (1997). Observing interaction: An introduction to sequential analysis (2nd ed.). New York: Cambridge University Press. 10.1017/CBO9780511527685 [DOI] [Google Scholar]
- Bays AM, Engelberg RA, Back AL, Ford DW, Downey L, Shannon SE, Doorenbos AZ, Edlund B, Christianson P, Arnold RW, O’Connor K, Kross EK, Reinke LF, Feemster LC, Fryer-Edwards K, Alexander SC, Tulsky JA, & Curtis JR (2014). Interprofessional communication skills training for serious illness: evaluation of a small-group, simulated patient intervention. Journal of Palliative Medicine, 17, 159–166. 10.1089/jpm.2013.0318 [DOI] [PMC free article] [PubMed] [Google Scholar]
- Bîtea IN (1990). How talk is organized. Sage Series in Interpersonal Communication, vol. 3, Sage. [Google Scholar]
- Burt J, Abel G, Elliott MN, Elmore N, Newbould J, Davey A, Llanwarne N, Maramba I, Paddison C, Campbell J, & Roland M (2018). The evaluation of physicians’ communication skills from multiple perspectives. The Annals of Family Medicine, 16, 330–337. 10.1370/afm.2241 [DOI] [PMC free article] [PubMed] [Google Scholar]
- Casarett D, Karlawish J, Morales K, Crowley R, Mirsch T, & Asch DA (2005). Improving the use of hospice services in nursing homes: A randomized controlled trial. JAMA, 294, 211–217. 10.1001/jama.294.2.211 [DOI] [PubMed] [Google Scholar]
- Caughlin JP (2010). A multiple goals theory of personal relationships: Conceptual integration and program overview. Journal of Social and Personal Relationships, 27, 824–848. 10.1177/0265407510373262 [DOI] [Google Scholar]
- Cicchetti DV (1994). Guidelines, criteria, and rules of thumb for evaluating normed and standardized assessment instruments in psychology. Psychological Assessment, 6, 284–290. 10.1037/1040-3590.6.4.284 [DOI] [Google Scholar]
- Clayton JM, Butow PN, Waters A, Laidsaar-Powell RC, O’Brien A, Boyle F, Back AL, Arnold RM, Tulsky JA, & Tattersall MHN (2013). Evaluation of a novel individualised communication-skills training intervention to improve doctors’ confidence and skills in end-of-life communication. Palliative Medicine, 27, 236–243. 10.1177/0269216312449683 [DOI] [PubMed] [Google Scholar]
- Cleeland CS, Gonin R, Hatfield AK, Edmonson JH, Blum RH, Stewart JA, & Pandya KJ (1994). Pain and its treatment in outpatients with metastatic cancer. New England Journal of Medicine, 330, 592–596. 10.1056/NEJM199403033300902 [DOI] [PubMed] [Google Scholar]
- Commission on Collegiate Nursing Education (2015). “Standards for accreditation of entry-to-practice nurse residency programs” https://www.aacnnursing.org/portals/42/ccne/pdf/ccne-entry-to-practice-residency-standards-2015.pdf?ver=2017-06-28-150337-210&ver=2017-06-28-150337-210 [DOI] [PubMed]
- Coyle N, Adelhardt J, Foley KM, & Portenoy RK (1990). Character of terminal illness in the advanced cancer patient: pain and other symptoms during the last four weeks of life. Journal of Pain and Symptom Management, 5, 83–93. 10.1016/s0885-3924(05)80021-1 [DOI] [PubMed] [Google Scholar]
- Curtis JR, Back AL, Ford DW, Downey L, Shannon SE, Doorenbos AZ, Kross EK, Reinke LF, Feemster LC, Edlund B, Arnold RW, O’Connor K, & Engelberg RA (2013). Effect of communication skills training for residents and nurse practitioners on quality of communication with patients with serious illness: a randomized trial. JAMA, 310, 2271–2281. 10.1001/jama.2013.282081 [DOI] [PMC free article] [PubMed] [Google Scholar]
- Curtis JR, Ciechanowski PS, Downey L, Gold J, Nielsen EL, Shannon SE, Treece PD, Young JP, & Engelberg RA (2012). Development and evaluation of an interprofessional communication intervention to improve family outcomes in the ICU. Contemporary Clinical Trials, 33, 1245–1254. 10.1016/j.cct.2012.06.010 [DOI] [PMC free article] [PubMed] [Google Scholar]
- Curtis JR, Engelberg RA, Wenrich MD, Shannon SE, Treece PD, & Rubenfeld GD (2005). Missed opportunities during family conferences about end-of-life care in the intensive care unit. American Journal of Respiratory and Critical Care Medicine, 171, 844–849. 10.1164/rccm.200409-1267OC [DOI] [PubMed] [Google Scholar]
- Curtis JR, Patrick DL, Caldwell E, Greenlee H, & Collier AC (1999). The quality of patient-doctor communication about end-of-life care: A study of patients with advanced AIDS and their primary care clinicians. AIDS, 13, 1123–1131. 10.1097/00002030-199906180-00017 [DOI] [PubMed] [Google Scholar]
- Curtis JR, Patrick DL, Engelberg RA, Norris K, Asp C, & Byock I (2002a). A measure of the quality of dying and death. Initial validation using after-death interviews with family members. Journal of Pain and Symptom Management, 24, 17–31. 10.1016/s0885-3924(02)00419-0 [DOI] [PubMed] [Google Scholar]
- Curtis JR, Patrick DL, Shannon SE, Treece PD, Engelberg RA, & Rubenfeld GD (2001). The family conference as a focus to improve communication about end-of-life care in the intensive care unit: opportunities for improvement. Critical Care Medicine, 29, N26–33. 10.1097/00003246-200102001-00006 [DOI] [PubMed] [Google Scholar]
- Curtis JR, Wenrich MD, Carline JD, Shannon SE, Ambrozy DM, & Ramsey PG (2002b). Patients’ perspectives on physician skill in end-of-life care: Differences between patients with COPD, cancer, and AIDS. CHEST, 122, 356–362. 10.1378/chest.122.1.356 [DOI] [PubMed] [Google Scholar]
- Detering KM, Hancock AD, Reade MC, & Silvester W (2010). The impact of advance care planning on end of life care in elderly patients: randomised controlled trial. BMJ, 340, 1345. 10.1136/bmj.c1345 [DOI] [PMC free article] [PubMed] [Google Scholar]
- Dickson RP, Engelberg RA, Back AL, Ford DW, & Curtis JR (2012). Internal medicine trainee self-assessments of end-of-life communication skills do not predict assessments of patients, families, or clinician-evaluators. Journal of Palliative Medicine, 15, 418–426. [DOI] [PMC free article] [PubMed] [Google Scholar]
- Dillard JP (1990). The nature and substance of goals in tactical communication. In Cody MJ & McLaughlin ML (Eds.), Monographs in social psychology of language, 2. The psychology of tactical communication (p. 70–90). Multilingual Matters. [Google Scholar]
- Downar J, Knickle K, Granton JT, & Hawryluck L (2012). Using standardized family members to teach communication skills and ethical principles to critical care trainees. Critical Care Medicine, 40, 1814–1819. 10.1097/CCM.0b013e31824e0fb7 [DOI] [PubMed] [Google Scholar]
- Downar J, McNaughton N, Abdelhalim T, Wong N, Lapointe-Shaw L, Seccareccia D, Miller K, Dev S, Ridley J, Lee C, Richardson L, McDonald-Blumer H, & Knickle K (2017). Standardized patient simulation versus didactic teaching alone for improving residents’ communication skills when discussing goals of care and resuscitation: A randomized controlled trial. Palliative Medicine, 31, 130–139. 10.1177/0269216316652278 [DOI] [PubMed] [Google Scholar]
- Engelberg R, Downey L, & Curtis JR (2006). Psychometric characteristics of a quality of communication questionnaire assessing communication about end-of-life care. Journal of Palliative Medicine, 9, 1086–1098. 10.1089/jpm.2006.9.1086 [DOI] [PubMed] [Google Scholar]
- Fallowfield L, Jenkins V, Farewell V, Saul J, Duffy A, & Eves R (2002). Efficacy of a Cancer Research UK communication skills training model for oncologists: A randomised controlled trial. Lancet, 359, 650–656. 10.1016/S0140-6736(02)07810-8 [DOI] [PubMed] [Google Scholar]
- Fleiss JL, Levin B, & Paik MC (2013). Statistical Methods for Rates and Proportions: John Wiley & Sons. [Google Scholar]
- Gregg SC, Heffernan DS, Connolly MD, Stephen AH, Leuckel SN, Harrington DT, Machan JT, Adams CA, & Cioffi WG (2016). Teaching leadership in trauma resuscitation: Immediate feedback from a real-time, competency-based evaluation tool shows long-term improvement in resident performance. Journal of Trauma and Acute Care Surgery, 81, 729–34. 10.1097/TA.0000000000001186 [DOI] [PubMed] [Google Scholar]
- Goldfarb MJ, Bibas L, Bartlett V, Jones H, & Khan N (2017). Outcomes of patient-and family-centered care interventions in the ICU: A systematic review and meta-analysis. Critical Care Medicine, 45, 1751–1761. 10.1097/CCM.0000000000002624 [DOI] [PubMed] [Google Scholar]
- Gries CJ, Engelberg RA, Kross EK, Zatzick D, Nielsen EL, Downey L, & Curtis JR (2010). Predictors of symptoms of posttraumatic stress and depression in family members after patient death in the ICU. CHEST, 137, 280–287. 10.1378/chest.09-1291 [DOI] [PMC free article] [PubMed] [Google Scholar]
- Hattie J, & Timperley H (2007). The power of feedback. Review of Educational Research, 77, 81–112. 10.3102/003465430298487 [DOI] [Google Scholar]
- Heyland DK, Allan DE, Rocker G, Dodek P, Pichora D, Gafni A, & Canadian Researchers at the End-of-Life Network (CARENET). (2009). Discussing prognosis with patients and their families near the end of life: Impact on satisfaction with end-of-life care. Open Medicine, 3, e101. [PMC free article] [PubMed] [Google Scholar]
- Heyland DK, Dodek P, Rocker G, Groll D, Gafni A, Pichora D, Shortt S, Tranmer J, Lazar N, Kutsogiannis J, Lam M, & Canadian Researchers at the End-of-Life Network (CARENET). (2006). What matters most in end-of-life care: Perceptions of seriously ill patients and their family members. CMAJ, 174, 627–633. 10.1503/cmaj.050626 [DOI] [PMC free article] [PubMed] [Google Scholar]
- Heyland DK, Groll D, Rocker G, Dodek P, Gafni A, Tranmer J, Pichora D, Lazar N, Kutsogiannis J, Shortt S, Lam M, & Canadian Researchers at the End of Life Network (CARENET). (2005). End-of-life care in acute care hospitals in Canada: A quality finish? Journal of Palliative Care, 21, 142–150. 10.1177/082585970502100306 [DOI] [PubMed] [Google Scholar]
- Heyland DK, Rocker GM, O’Callaghan CJ, Dodek PM, & Cook DJ (2003). Dying in the ICU: Perspectives of family members. CHEST, 124, 392–397. 10.1378/chest.124.1.392 [DOI] [PubMed] [Google Scholar]
- Institute of Medicine. 2015. Dying in America: Improving Quality and Honoring Individual Preferences Near the End of Life Washington, DC: The National Academies Press. 10.17226/18748. [DOI] [PubMed] [Google Scholar]
- Krimshtein NS, Luhrs CA, Puntillo KA, Cortez TB, Livote EE, Penrod JD, & Nelson JE (2011). Training nurses for interdisciplinary communication with families in the intensive care unit: An intervention. Journal of Palliative Medicine, 14, 1325–1332. 10.1089/jpm.2011.0225 [DOI] [PMC free article] [PubMed] [Google Scholar]
- Lautrette A, Darmon M, Megarbane B, Joly LM, Chevret S, Adrie C, Barnoud D, Bleichner G, Bruel C, Choukroun G, Curtis JR, Fieux F, Galliot R, Garrouste-Orgeas M, Georges H, Goldgran-Toledano G, Jourdain M, Loubert G, Reignier J, Saidi F, Souweine B, Vincent F, Barnes NK, Pochard F, Schlemmer B, & Azoulay E (2007). A communication strategy and brochure for relatives of patients dying in the ICU. New England Journal of Medicine, 356, 469–478. 10.1056/NEJMoa063446 [DOI] [PubMed] [Google Scholar]
- Leung JM, Udris EM, Uman J, & Au DH (2012). The effect of end-of-life discussions on perceived quality of care and health status among patients with COPD. CHEST, 142, 128–133. 10.1378/chest.11-2222 [DOI] [PMC free article] [PubMed] [Google Scholar]
- Liaison Committee on Medical Education (n.d.). “Standards, publications, and notification forms” Retrieved from https://lcme.org/publications/
- McCarthy EP, Phillips RS, Zhong Z, Drews RE, & Lynn J (2000). Dying with cancer: Patients’ function, symptoms, and care preferences as death approaches. Journal of the American Geriatrics Society, 48, S110–S121. 10.1111/j.1532-5415.2000.tb03120.x [DOI] [PubMed] [Google Scholar]
- Menichetti J, Lie HC, Mellblom AV, Brembo EA, Eide H, Gulbrandsen P, Heyn L, Saltveit KH, Stromme H, Sundling V, Turk E, & Juvet LK (2021). Tested communication strategies for providing information to patients in medical consultations: A scoping review and quality assessment of the literature. Patient Education and Counseling, 104, 1891–1903. 10.1016/j.pec.2021.01.019 [DOI] [PubMed] [Google Scholar]
- Parker PA, Baile WF, de Moor C, Lenzi R, Kudelka AP, & Cohen L (2001). Breaking bad news about cancer: Patients’ preferences for communication. Journal of Clinical Oncology, 19, 2049–20. 10.1200/JCO.2001.19.7.2049 [DOI] [PubMed] [Google Scholar]
- Patrick DL, Curtis JR, Engelberg RA, Nielsen E, & McCown E (2003). Measuring and improving the quality of dying and death. Annals of Internal Medicine, 139, 410–415. 10.7326/0003-4819-139-5_Part_2-200309021-00006 [DOI] [PubMed] [Google Scholar]
- Ramani S, & Krackov SK (2012). Twelve tips for giving feedback effectively in the clinical environment. Medical Teacher, 34, 787–791. 10.3109/0142159X.2012.684916 [DOI] [PubMed] [Google Scholar]
- Roter D, & Larson S (2002). The Roter interaction analysis system (RIAS): Utility and flexibility for analysis of medical interactions. Patient Education and Counseling, 46, 243–251. 10.1016/s0738-3991(02)00012-5 [DOI] [PubMed] [Google Scholar]
- Roter DL, Hall JA, Kern DE, Barker LR, Cole KA, & Roca RP (1995). Improving physicians’ interviewing skills and reducing patients’ emotional distress: A randomized clinical trial. Archives of Internal Medicine, 155, 1877–1884. [PubMed] [Google Scholar]
- Sargeant JM, Mann KV, Van der Vleuten CP, & Metsemakers JF (2009). Reflection: A link between receiving and using assessment feedback. Advances in Health Sciences Education, 14, 399–410. 10.1007/s10459-008-9124-4 [DOI] [PubMed] [Google Scholar]
- Scheunemann LP, Ernecoff NC, Buddadhumaruk P, Carson SS, Hough CL, Curtis JR, Anderson WG, Steingrub J, Lo B, Matthay M, Arnold RM, & White DB (2019). Clinician-family communication about patients’ values and preferences in intensive care units. JAMA Internal Medicine, 179, 676–684. 10.1001/jamainternmed.2019.0027 [DOI] [PMC free article] [PubMed] [Google Scholar]
- Schnabl GK, Hassard TH, & Kopelow ML (1991). The assessment of interpersonal skills using standardized patients. Academic Medicine, 66, S34–36. 10.1097/00001888-199109000-00033 [DOI] [PubMed] [Google Scholar]
- Scott P, Thomson P, & Shepherd A (2019). Families of patients in ICU: A scoping review of their needs and satisfaction with care. Nursing Open, 6, 698–712. 10.1002/nop2.287 [DOI] [PMC free article] [PubMed] [Google Scholar]
- Shute VJ (2008). Focus on formative feedback. Review of Educational Research, 78, 153–189. 10.3102/0034654307313795 [DOI] [Google Scholar]
- Steinhauser KE, Christakis NA, Clipp EC, McNeilly M, McIntyre L, & Tulsky JA (2000). Factors considered important at the end of life by patients, family, physicians, and other care providers. JAMA, 284, 2476–2482. 10.1001/jama.284.19.2476 [DOI] [PubMed] [Google Scholar]
- Stewart MA (1995). Effective physician-patient communication and health outcomes: A review. CMAJ, 152, 1423. [PMC free article] [PubMed] [Google Scholar]
- Street RL, & Mazor KM (2017). Clinician-patient communication measures: Drilling down into assumptions, approaches, and analyses. Patient Education and Counseling, 100, 1612–1618. 10.1016/j.pec.2017.03.021 [DOI] [PubMed] [Google Scholar]
- Temel JS, Greer JA, Muzikansky A, Gallagher ER, Admane S, Jackson VA, Dahlin CM, Blinderman CD, Jacobsen J, Pirl WF, Billings A, & Lynch TJ (2010). Early palliative care for patients with metastatic non-small-cell lung cancer. New England Journal of Medicine, 363, 733–742. 10.1056/NEJMoa1000678 [DOI] [PubMed] [Google Scholar]
- Tulsky JA (2005a). Beyond advance directives: Importance of communication skills at the end of life. JAMA, 294, 359–365. 10.1001/jama.294.3.359 [DOI] [PubMed] [Google Scholar]
- Tulsky JA (2005b). Interventions to enhance communication among patients, providers, and families. Journal of Palliative Medicine, 8, S95–102. 10.1089/jpm.2005.8.s-95 [DOI] [PubMed] [Google Scholar]
- Uitterhoeve RJ, Bensing JM, Grol RP, Demulder PH, & T, V. A. N. A. (2010). The effect of communication skills training on patient outcomes in cancer care: A systematic review of the literature. European Journal of Cancer Care, 19, 442–457. 10.1111/j.1365-2354.2009.01082.x [DOI] [PubMed] [Google Scholar]
- Walczak A, Butow PN, Bu S, & Clayton JM (2016). A systematic review of evidence for end-of-life communication interventions: Who do they target, how are they structured and do they work? Patient Education and Counseling, 99, 3–16. 10.1016/j.pec.2015.08.017 [DOI] [PubMed] [Google Scholar]
- Watling C (2014). Resident teachers and feedback: Time to raise the bar. Journal of Graduate Medical Education, 6, 781–782. 10.4300/JGME-D-14-00493.1 [DOI] [PMC free article] [PubMed] [Google Scholar]
- Weiner JS, & Roth J (2006). Avoiding iatrogenic harm to patient and family while discussing goals of care near the end of life. Journal of Palliative Medicine, 9, 451–463. 10.1089/jpm.2006.9.451 [DOI] [PubMed] [Google Scholar]
- White DB, Braddock CH, Bereknyei S, & Curtis JR (2007). Toward shared decision making at the end of life in intensive care units: opportunities for improvement. Archives of Internal Medicine, 167, 461–467. 10.1001/archinte.167.5.461 [DOI] [PubMed] [Google Scholar]
- Wilson ME, Dobler CC, Zubek L, Gajic O, Talmor D, Curtis JR, Hinds RF, Banner-Goodspeed VM, Mueller A, Rickett DM, Elo G, Filipe M, Szucs O, Novotny PJ, Piers RD, & Benoit DD (2019). Prevalence of disagreement about appropriateness of treatment between ICU patients/surrogates and clinicians. CHEST, 155, 1140–1147. 10.1016/j.chest.2019.02.404 [DOI] [PubMed] [Google Scholar]
- Wittenberg-Lyles EM, Goldsmith J, Sanchez-Reilly S, & Ragan SL (2008). Communicating a terminal prognosis in a palliative care setting: deficiencies in current communication training protocols. Social Science & Medicine, 66, 2356–2365. 10.1016/j.socscimed.2008.01.042 [DOI] [PubMed] [Google Scholar]
- Wright AA, Zhang B, Ray A, Mack JW, Trice E, Balboni T, Mitchell SL, Jackson VA, Block SD, Maciejewski PK, & Prigerson HG (2008). Associations between end-of-life discussions, patient mental health, medical care near death, and caregiver bereavement adjustment. JAMA, 300, 1665–1673. 10.1001/jama.300.14.1665 [DOI] [PMC free article] [PubMed] [Google Scholar]
- Zhang B, Wright AA, Huskamp HA, Nilsson ME, Maciejewski ML, Earle CC, Block SD, Maciejewski PK, & Prigerson HG (2009). Health care costs in the last week of life: Associations with end-of-life conversations. Archives of Internal Medicine, 169, 480–488. 10.1001/archinternmed.2008.587 [DOI] [PMC free article] [PubMed] [Google Scholar]
Associated Data
This section collects any data citations, data availability statements, or supplementary materials included in this article.