Abstract
Ferroptosis is a new form of regulated cell death characterized by excessive iron accumulation and uncontrollable lipid peroxidation. The role of ferroptosis in metabolic dysfunction-associated fatty liver disease (MAFLD) is not fully elucidated. In this study we compared the therapeutic effects of ferroptosis inhibitor liproxstatin-1 (LPT1) and iron chelator deferiprone (DFP) in MAFLD mouse models. This model was established in mice by feeding a high-fat diet with 30% fructose in water (HFHF) for 16 weeks. The mice then received LPT1 (10 mg·kg−1·d−1, ip) or DFP (100 mg·kg−1·d−1, ig) for another 2 weeks. We showed that both LPT1 and DFP treatment blocked the ferroptosis markers ACSL4 and ALOX15 in MAFLD mice. Furthermore, LPT1 treatment significantly reduced the liver levels of triglycerides and cholesterol, lipid peroxidation markers 4-hydroxynonenal (4-HNE) and malondialdehyde (MDA), and ameliorated the expression of lipid synthesis/oxidation genes (Pparα, Scd1, Fasn, Hmgcr and Cpt1a), insulin resistance, mitochondrial ROS content and liver fibrosis. Importantly, LPT1 treatment potently inhibited hepatic apoptosis (Bax/Bcl-xL ratio and TUNEL+ cell number), pyroptosis (cleavages of Caspase-1 and GSDMD) and necroptosis (phosphorylation of MLKL). Moreover, LPT1 treatment markedly inhibited cleavages of PANoptosis-related caspase-8 and caspase-6 in MAFLD mouse liver. In an in vitro MAFLD model, treatment with LPT1 (100 nM) prevented cultured hepatocyte against cell death induced by pro-PANoptosis molecules (TNF-α, LPS and nigericin) upon lipid stress. On the contrary, DFP treatment only mildly attenuated hepatic inflammation but failed to alleviate lipid deposition, insulin resistance, apoptosis, pyroptosis and necroptosis in MAFLD mice. We conclude that ferroptosis inhibitor LPT1 protects against steatosis and steatohepatitis in MAFLD mice, which may involve regulation of PANoptosis, a coordinated cell death pathway that involves apoptosis, pyroptosis and necroptosis. These results suggest a potential link between ferroptosis and PANoptosis.
Keywords: ferroptosis, PANoptosis, MAFLD, liver disease
Introduction
Fatty liver disease associated with metabolic dysfunction is common worldwide, affecting one-quarter of the population, and has no approved drug therapy yet. Metabolic dysfunction-associated fatty liver disease (MAFLD), which formerly known as “nonalcoholic fatty liver disease (NAFLD)” [1–3] is a clinical syndrome consisting of a spectrum of disorders from simple hepatic steatosis with moderate fatty accumulation to advanced nonalcoholic steatohepatitis (NASH) with extensive hepatic inflammation. The prevalence of MAFLD in the general population worldwide is ~20%–30% [4]. The rapid growth in the MAFLD population, especially among younger individuals, indicates that more efforts are needed to address knowledge gaps and mitigate the onset and development of MAFLD. However, although a number of therapeutic strategies for MAFLD have been proposed and developed [5, 6], the molecular mechanisms underlying the pathophysiology of MAFLD are not fully understood [7].
Ferroptosis is a novel form of iron-dependent regulated cell death (RCD) characterized by uncontrollable lipid peroxidation [8–11]. Ferroptosis is morphologically, biochemically, and genetically distinct from other well-known cell death types such as necrosis and apoptosis [8–11]. Ferroptosis was first described in 2012 in cells exposed to erastin which was postulated to inhibit xCT (a cystine/glutamate antiporter encoded by SLC7A11) leading to glutathione depletion, inactivation of glutathione peroxidase 4 (GPX4), accumulation of polyunsaturated fatty acids, membrane damage and cell death [8–11]. Notably, an increase in intracellular Fe ions and subsequent follow-up, which elevates reactive oxygen species (ROS) levels, is a leading cause of GPX4 inactivation and ferroptotic cell death. Recently, numerous ferroptosis-regulating factors, including acyl-CoA synthetase long-chain family member 4 (ACSL4) [12], arachidonate 12/15-lipoxygenase (ALOX12/15) [13], ferroptosis suppressor protein 1 (FSP1) [14, 15], AMP-activated protein kinase [16] and dihydroorotate dehydrogenase [17], have been identified.
Iron accumulation and lipid peroxidation are the two most important features of ferroptosis [8–10]. Therefore, targeting the excess iron pool with an iron chelator or lipid peroxidation with a ferroptosis inhibitor is postulated to be a potent strategy to block ferroptosis. Recently, prophylactic administration of iron chelators and ferroptosis inhibitors was reported to prevent pathologies in mice fed a choline-deficient diet (CD) or methionine/choline-deficient diet (MCD) [18–20], which are frequently used to establish animal models of hepatotoxicity that mimic steatohepatitis [21, 22]. Notably, CD-/MCD-fed mice have almost always presented with significantly lower body weight and unaltered plasma insulin levels, highlighting the absence of key metabolic characteristics, such as insulin resistance and obesity in MAFLD. These missing ‘metabolic dysfunction’ features imply that these models may not be appropriate models for MAFLD [21, 22]. Hence, the precise role of ferroptosis in MAFLD has not been fully elucidated.
In the present study, we investigated the therapeutic effect of ferroptosis inhibition using two distinct methods (the ferroptosis inhibitor liproxstatin-1 [LPT1] and the iron chelator deferiprone [DFP]) in a well-established MAFLD mouse model induced via a high-fat and high-fructose diet (HFHF) for 16 weeks. This model recapitulates the obesogenic pathogenesis and insulin resistance of human MAFLD [22]. Our results indicate that these two distinct strategies led to different inhibitory effects on MAFLD pathologies. We found that LPT1 alleviated steatosis and steatohepatitis in our MAFLD model. Interestingly, we also found that LPT1 not only inhibited ferroptosis, but also repressed PANoptosis, a coordinated cell death pathway that is driven through a multiprotein complex involving pyroptosis, apoptosis, and necroptosis [23]. In contrast, DFP only mildly inhibited steatohepatitis but did not influence steatosis.
This is the first report showing a potential link between ‘PANoptosis’ and MAFLD, which may arouse the readers’ interest. Moreover, ferroptosis inhibitors but not iron chelators can suppress ‘PANoptosis’, suggesting a central role for lipid peroxidation in MAFLD development. These results reveal the complex roles of ferroptosis in MAFLD, and may shed new light mechanistic pathways and treatment strategies of MAFLD.
Materials and methods
Mice
Eight-week-old male C57BL/6 J mice were purchased from Sino-British SIPPR/BK Lab Animal Ltd. (Shanghai, China). All the mice were housed in temperature-controlled cages (23–25 oC) under a 12/12-h light/dark cycle with free access to water and chow in Animal Core. Food and water were available ad libitum. All experimental procedures in mice were reviewed and approved by Institutional Animal Care and Use Committee of Medical School of Tongji University and the Animal Care and Use Committee of Shanghai Tenth People’s Hospital of Tongji University.
Drug administration
In experiment with LPT1, mice were randomly divided into four groups: Chow, Chow+LPT1, HFHF and HFHF + LPT1. LPT1 was synthesized according to previously reported [10]. For LPT1 administration, LPT1 (dissolved in 2% DMSO + 30% PEG300 + 3% Tween 80 + ddH2O) was injected intraperitoneally (10 mg·kg−1·d−1) [18, 24] into mice in Chow+LPT1 and HFHF + LPT1 groups for additional two weeks (see Fig. 1a for experimental design). The same volume vehicle (2% DMSO + 30% PEG 300 + 3% Tween 80 + ddH2O) was injected into mice in Chow and HFHF groups. In experiment with the iron chelator DFP, mice were randomly divided into three groups: Chow, HFHF and HFHF + DFP. The mice in Chow group were fed with chow diet and the mice in HFHF group were fed with HFHF for 16 weeks. The mice in HFHF + DFP group were administered with DFP (100 mg·kg−1·d−1, Apotex Pharmachem INC, Ontario, Canada) [20, 25] dissolved in 0.9% saline water by oral gavage for additional two weeks (see Fig. 7a for experimental design).
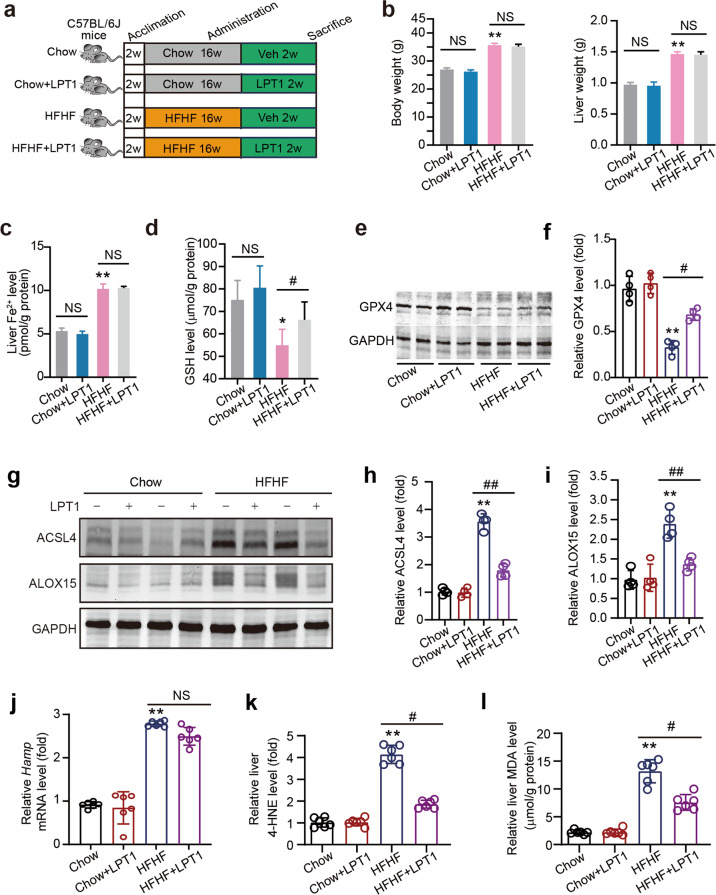
Fig. 1. The inhibitor LPT1 blocks ferroptosis without disrupting iron accumulation in a mouse MAFLD model.
a Schematic representation of experimental design illustrating the treatment protocol with liproxstatin-1 (LPT1) in a high-fat high-fructose diet (HFHF)-induced MAFLD mouse model. C57BL/6 J mice were divided into four groups: Chow, Chow+LPT1, HFHF and HFHF + LPT1 groups. MAFLD was induced by HFHF diet for 16 weeks. LPT1 was given intraperitoneally (10 mg·kg−1·d−1) for two weeks. b Effect of LPT1 treatment on body weight and liver weight. c, d Fe2+ levels and GSH levels in liver tissues of four groups of mice. e, f Representative immunoblot and quantitative analysis of GPX4 protein level in liver tissues of four groups of mice. GAPDH as loading control. n = 4 biologically independent experiments. g–i Representative immunoblot and quantitative analysis of ACSL4 and ALOX15 protein levels in liver tissues of four groups of mice. GAPDH as loading control. n = 4 biologically independent experiments. j The mRNA level of Hamp in liver tissues of four groups of mice. n = 6 biologically independent experiments. k Immunoblotting analysis of 4-hydroxynonenal (4-HNE)-adducted protein levels in liver tissues of four groups of mice. n = 6 biologically independent experiments. l Malondialdehyde (MDA) levels in liver tissues of four groups of mice. n = 6 biologically independent experiments. The data were presented as Means ± SEM and analyzed by One way-ANOVA followed by Tukey’s post hoc test. *P < 0.05, **P < 0.01 vs Chow; #P < 0.05, ##P < 0.01 vs HFHF. NS no significance.
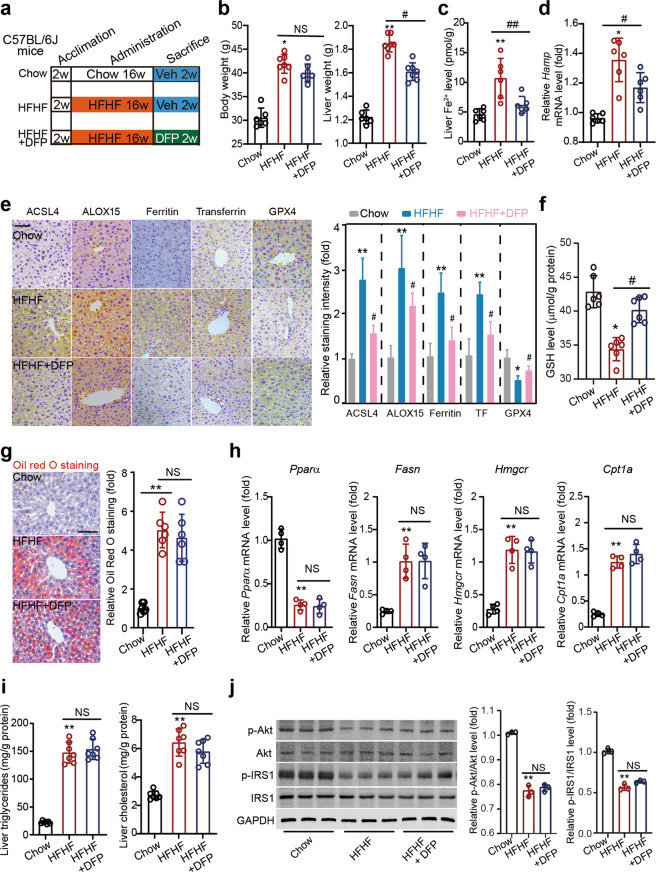
Fig. 7. An iron chelator DFP reduces ferroptosis but does not ameliorate steatosis.
a Schematic representation of experimental design illustrating the treatment protocol with deferiprone (DFP) in a HFHF-induced MAFLD mouse model. C57BL/6 J mice were divided into three groups: Chow, HFHF and HFHF + DFP groups. MAFLD was induced by HFHF diet for 16 weeks. Mice in HFHF + DFP group were given DFP by oral gavage (100 mg·kg−1·d−1) for two weeks. b The body and liver weight in three groups of mice. c The Fe2+ levels in liver tissues in three groups of mice. d The mRNA level of Hamp in liver tissues in three groups of mice. n = 6 biologically independent experiments. e Immunohistochemistry staining and quantitative analyses of ferroptosis markers (ACSL4, ALOX15, Ferritin, Transferrin and GPX4) in liver tissues in three groups of mice. f The GSH levels in liver tissues in three groups of mice. g Oil red O staining showing the lipid droplets (red) in liver tissues in three groups of mice. h The mRNA levels of Pparα, Fasn, Hmgcr and Cpt1a in liver tissues in three groups of mice. n = 4 biologically independent experiments. i Liver triglycerides and cholesterol contents in three groups of mice. j Representative immunoblot analysis of p-Akt, Akt, p-IRS1 and IRS-1 in liver tissues from three groups of mice. GAPDH was used as a loading control. The data were presented as Means ± SEM and analyzed by One way-ANOVA followed by Tukey’s post hoc test. *P < 0.05, **P < 0.01 vs Chow; #P < 0.05, ##P < 0.01 vs HFHF. NS no significance.
Animal MAFLD models
MAFLD model was induced using a high-fat diet (60% fat, 20% protein and 20% carbohydrates, Trophic Animal Feed High-Tech Co. Ltd, Nantong, China) with 30% fructose in water (HFHF) for 16 weeks. Mice fed a normal chow diet (10% fat, 20% protein, and 70% carbohydrate) served as controls. In some conditions, a NASH model was established by feeding the 8-week-old male mice with MCD (Trophic Animal Feed High-Tech Co. Ltd, Nantong, China) for four weeks.
Cell culture
AML12 cell line was purchased from ATCC (#CRL-2254) and cultured in DME/F-12 (Thermo Fisher Scientific, Waltham, MA) containing 10% FBS (Thermo Fisher Scientific), 1% ITS solution (Thermo Fisher Scientific) and 1% penicillin-streptomycin. Cells were maintained at 37 °C in 5% CO2 incubator. For LPT1-induced ferroptosis blockade in cells, LPT1 was added into the PA stimuli culture medium to reach the final concentration at 100 nmol/L for 24 h.
In vitro MAFLD model
Palmitic acid (PA) was dissolved in fatty acid-free BSA solution to a 5 mmol/L PA stock solution. PA was then conjugated in DME/F-12 with 0.5% FBS to a final concentration of 300 μmol/L for additional 48 h. The AML12 cells cultured in DME/F-12 with fatty acid-free BSA were used as a vehicle control.
PANoptosis model
For PANoptosis study, AML12 cells were treated with TNF-α (100 mg/mL, R&D System), lipopolysaccharide (LPS, 50 ng/mL, Sigma) and Nigericin (20 mmol/L, Selleckchem) for 24 h.
Tissue and blood collecting
After the drugs administration, mice were recorded for body weight and euthanized to obtain tissue and blood. At the day, phenobarbital sodium (40 mg/kg, ip) was injected to deeply anesthetize the mice. The blood was obtained from the right atrium and allowed to clot in an upright position at room temperature for ~60 min. The blood was centrifuged at 3500 r/min for 15 min to obtain serum. The liver was carefully isolated and weighted. The left lobe of liver was dissected and washed in ice-cold phosphate-buffered saline (PBS) to remove blood, and frozen swiftly in −80 °C for further examination.
LDH cytotoxicity assay
Cytotoxicity assay was performed using a commercial kit (C0016, Beyotime Biotechnology, Shanghai, China) that quantifies lactate dehydrogenase (LDH) content. In brief, AML12 cells were seeded in 96-well plates and exposed to PA stimuli culture medium for 48 h. LDH release was determined according to the manufacturer’s instructions and measured at OD490.
Cell viability assay
Cell viability was determined using a commercial CCK8 assay (C0037, Beyotime Biotechnology, Shanghai, China). Cells were seeded in 96-well plates and treated with stimuli for 48 h, followed by incubation with 10 μL CCK8 at 37 °C for 40 min. The absorbance was measured at 450 nm with a microplate reader.
Flow cytometry
Cell apoptosis and necrosis were determined using YO-PRO-1/propidium iodide (PI) assay (Thermo Scientific) in 6-well plates. AML12 cells were treated with specific compounds upon PA stimuli for 48 h. After digestion with trypsin, the cells were centrifuged at 500 × g for 5 min. The cells were re-suspended and stained with 500 μL YO-PRO-1/PI working solution at 37 °C for 20 min. The stained cells were detected by the flow cytometer (CytoFlex S, Beckman Coulter).
Iron quantification
For quantitation on the Fe2+ levels in tissues, liver tissues were lysed in iron assay buffer and a colorimetric assay kit from Sigma-Aldrich (#MAK025) was applied according to the manufacturer’s protocols.
Histological examination
Oil red O staining was performed to detect triglyceride (TG) level in the liver lobes based on frozen sections. The liver tissues were embedded in JUNG OCT cryogenic compound (Leica, Wetzlar, Germany), frozen at −80 °C, and sectioned to 12-μm-thick sections in a freezing microtome (Leica). The frozen sections were stained for lipid with 0.18% Oil red O (Sigma) in 60% isopropyl alcohol and, counterstained with hematoxylin to illustrate the nuclei [26, 27]. To examine collagen fibers in liver, Masson’s trichrome staining was performed as described previously [28]. The liver tissues were embedded in paraffin and sectioned to 8-μm-thick sections by a conventional rotary microtome (Leica). Then, the sections were stained with Masson’s trichrome staining kit (G1006, Servicebio, Wuhan, China) containing Weigert’s solution, Biebrich scarlet-acid fuchsin solution, phosphomolybdic acid solution and toluidine blue solution. The experiments were conducted according to standard procedures. The Masson trichrome stained slides were examined under a light microscopy (IX-81, Olympus Corp., Tokyo, Japan). The blue color indicated the presence of collagen. Hepatic collagen fibers were evaluated using another method Picrosirius red staining. The sections were reacted for 10 min in Picrosirius red staining solution according to standard procedures. Picrosirius red stained slides were examined under a light microscopy or a polarized light microscopy. The collagen fibers were visualized as red under light microscopy. When examined through polarized microscopy, the larger collagen fibers are bright yellow or orange, and the thinner ones are green.
Biochemical assays
Levels of serum triglyceride (TG), total-cholesterol (TC) and low-density lipoprotein- cholesterol (LDL-C) were determined using an automatic biochemistry analyzer (Beckman Coulter, Fullerton, CA) according to the manufacturer’s instructions. Liver TG and TC were determined using commercial kits (Nanjingjiancheng, Nanjing, China). Serum alanine aminotransferase (ALT) and aspartate aminotransferase (AST) activities were determined with commercial assay kits from Sigma-Aldrich (#MAK052 and #MAK055 respectively, St. Louis, MO). The concentrations of IL-6, IL-1β and IL-18 in the liver tissues were determined with ELISA Kit using mouse IL-6 ELISA Kit (ab222503, Abcam), mouse IL-1β ELISA Kit (ab197742, Abcam) and mouse IL-18 ELISA Kit (ab216165, Abcam). 4-Hydroxynonenal (4-HNE) was measured using a commercial kit (#ab238538, Abcam). Caspase-1 enzymatic activity was measured using a commercial kit (#C1101 respectively, Beyotime, Haimen, China) according to the manufacturer’s protocol. All the values obtained in the above-mentioned assays were further normalized to the protein concentration, which was determined using a BCA assay kit. Absorbance was measured at 562 nm using a microtiterplate reader (BioRad, Hercules, CA).
Immunoblotting
Immunoblotting was performed as descried previously [29]. For immunoblotting, liver tissues were lysed with RIPA buffer with protease/phosphatase inhibitors cocktail (Beyotime, Haimen, China). The sample proteins were loaded and separated in 10% SDS-PAGE, and transferred onto nitrocellulose membranes at 100 V for 60 min. Nonspecific protein binding was blocked by 5% powdered milk and 4% bovine serum albumin (BSA) in TBST solution for 60 min. The membranes were incubated with primary antibodies (Supplementary Table 1) for 4 h at room temperature. After being washed by TBST solution for three times, the membranes were incubated with infrared-conjugated secondary antibodies (Li-COR, Lincoln, NE) and then near-infrared fluorescent signals were detected by an Odyssey Infrared Fluorescence Imaging System (Li-COR, Lincoln, NE). All immunoblotting experiments were repeated at least three times.
Immunohistochemistry
Immunohistochemistry was performed as descried previously [30]. For immunohistochemistry (IHC) analysis, the liver tissue samples were fixed in 4% paraformaldehyde for 48 h, embedded in paraffin and cut into 8-μm-thick sections. The sections were mounted on slides and further fixed for 1 h at room temperature, washed twice with PBS, and incubated in 2 M HCl at 37 °C for 1 h and then neutralized in boric acid (pH 8.5) for 10 min. The slides were blocked by 8% normal goat serum for 1 h and incubated with specific primary antibodies (Supplementary Table 1) overnight in wet box. After being washed by PBST for three times, the slides were incubated with horseradish peroxidase-conjugated secondary antibodies. Controls included omitting or preabsorbing primary antibodies and omitting secondary antibodies. Staining is visualized using substrate diaminobenzidine and the images were captured using a BX51 microscopy (Olympus, Japan). Slides were counterstained with hematoxylin. To assess the protein expression level using IHC staining, Image J software (NIH) was used to identify the positive pixels and their intensity for IHC-positive staining (brown staining).
Real-time quantitative PCR
Real-time quantitative PCR was performed as descried previously [26]. To compare the gene expression at transcriptional level, real-time quantitative PCR was performed in a CFX96 Real-Time PCR System (Bio-Rad, Hercules, CA). Total RNA was extracted from tissues using RNAiso Plus reagent (Takara, Tokyo, Japan) and was treated with RNase-free DNase I (Gibco BRL) at 37 °C for 30 min to reduce the risk for genomic DNA contamination. The RNA sample was subjected to One Step PrimeScript™ III RT-qPCR Mix (Takara, Tokyo, Japan) with specific primers. The primer oligonucleotides were purchased from Sangon Biological Engineering Technology & Co., Ltd (Shanghai, China) and purified using high-performance liquid chromatography. The primers are listed in Supplementary Table 2. Each PCR reaction was performed in triplicate, and the comparative analysis was performed using 2−ΔΔCt method.
Terminal deoxynucleotidyl transferase-mediated dUTP nick end-labeling (TUNEL)
TUNEL assay was used to evaluate the DNA fragment using a commercial DeadEnd™ Colorimetric TUNEL System (#G7360, Promega). The assay was performed on the liver tissue section (8 μm) according to protocols from the manufacturer. The number of TUNEL+ cells in > 3 visual fields was counted by 2 independent observers and averaged. For each animal, at least five sections were examined.
Oxidative stress
Levels of MDA (#700870) and GSH (#703002) in liver tissue were determined with commercial kits from Cayman Chemical (Arbor, MI). To evaluate mitochondrial-ROS production in liver tissue, the liver sections were incubated with a MitoSOX Red Dye (#M36008, Thermo-Fisher, 200 nM) for 30 min at 37 °C, and then counterstained with Hoechst 33342 for 5 min and then washed with PBS by three times.
Statistical analysis
All values are presented as the mean ± SEM. The data were analyzed with GraphPad Prism-8 statistical software. Statistical analysis for multiple groups was performed via unpaired Student’s t-test or ANOVA followed by post hoc Tukey’s test. P < 0.05 was considered to be statistically significant.
Results
The inhibitor LPT1 blocks ferroptosis without disrupting iron accumulation in a mouse MAFLD model
We first evaluated LPT1, a commonly-used ferroptosis inhibitor that blocks lipid peroxidation through its action as a radical trapping antioxidant (RTA) [31], in a HFHF diet-induced MAFLD mouse model (Fig. 1a). Two-weeks of LPT1 treatment did not reduce the increase in body and liver weight in the MAFLD model (Fig. 1b). LPT1 treatment also did not alter the content of Fe2+ in liver tissue (Fig. 1c), suggesting that LPT1 does not influence iron accumulation in MAFLD. However, the level of glutathione (GSH), a cofactor and substrate for GPX4 that is required for lipid repair function [32], was reduced in the liver of MAFLD mice but partially restored by LPT1 treatment (Fig. 1d). The reduction in the liver GPX4 protein level in the MAFLD model was partially blocked by LPT1 (Fig. 1e-f). Two molecular markers of ferroptosis, ACSL4 and ALOX15 [33], were triggered in the liver tissue of MAFLD mice; however, these increases were significantly attenuated by LPT1 treatment (Fig. 1g–i). We also measured the Hamp gene, which encodes the hepatic hormone hepcidin, that regulates iron homeostasis [34]. Upregulation of the Hamp gene was found in the liver tissue of MAFLD mice, but LPT1 did not affect the Hamp gene (Fig. 1j). 4-HNE, a highly potent alkylating agent that reacts with proteins in phospholipid membranes to generate various forms of adducts, is a lipid peroxidation marker of ferroptosis [33]. We found that the amount of 4-HNE-adducted proteins was increased in the liver tissue of MAFLD mice, and that this increase was potently inhibited by LPT1 treatment (Fig. 1k). A similar change induced by LPT1 in the hepatic MDA level, another lipid peroxidation marker [33], was observed in liver tissues of mice (Fig. 1l). Together, these results demonstrated that LPT1 blockade of ferroptosis was associated with lipid peroxidation, but did not disrupt hepatic iron homeostasis or accumulation in a HFHF diet-induced murine MAFLD model.
The ferroptosis inhibitor LPT1 decreases steatosis and mitochondrial ROS in a mouse MAFLD model
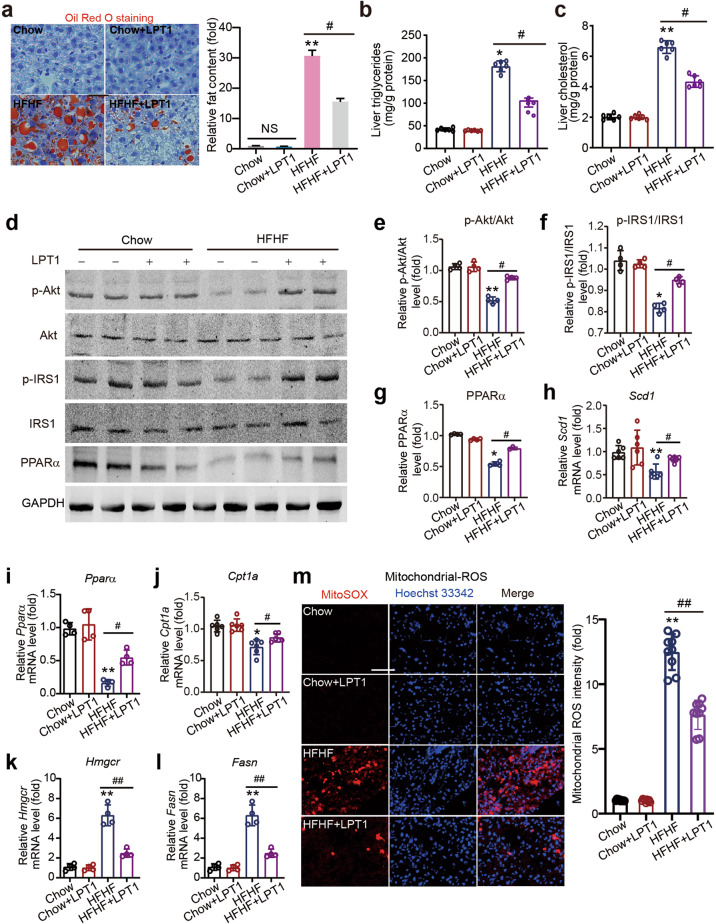
Lipid deposition and mitochondrial ROS were then determined. Oil red O staining showed that there was significant lipid deposition in liver tissue in the MAFLD mice, and LPT1 significantly reduced the lipid content in the liver tissue of these mice (Fig. 2a). In line with this, the increase in triglycerides and cholesterol levels in the liver was decreased by LPT1 treatment (Fig. 2b, c). MAFLD is closely associated with hepatic insulin resistance and obesity. We therefore examined the phosphorylation levels of insulin receptor substrate 1 (IRS1) and protein kinase B (Akt), two signaling molecules associated with insulin signaling pathway [35]. LPT1 corrected the impaired phosphorylation of IRS-1 and Akt (Fig. 2d–f). Accordingly, the protein level of lipid oxidation gene peroxisome proliferator activated receptor α (PPARα) was increased by LPT1 treatment (Fig. 2d, g). The mRNA expression levels of the lipid oxidation gene peroxisome proliferator activated receptor α (Pparα) and lipid synthesis genes, including fatty acid synthase (Fasn), 3-hydroxy-3-methylglutaryl-CoA reductase (Hmgcr), stearoy1-CoA desaturase-1 (Scd1) and carnitine palmitoyltransferase 1 A (Cpt1a), were then determined. Pparα, Scd1 and Cpt1a mRNAs were downregulated, whereas Fasn and Hmgcr mRNAs were upregulated in MAFLD mouse liver (Fig. 2h–l). However, LPT1 treatment significantly reversed these changes in mRNA expression (Fig. 2h–l). We also performed an immunofluorescent assay with MitoSOX dye to study mitochondrial ROS content. The mitochondrial ROS content was markedly increased in MAFLD mouse liver tissue but was partially reduced by LPT1 treatment (Fig. 2m). These data suggest that a ferroptosis inhibitor rescued malfunctions in lipid metabolism and mitochondrial ROS in the MAFLD model, suggesting an improvement towards steatosis by LPT1.
Fig. 2. The ferroptosis inhibitor LPT1 decreases steatosis and mitochondrial ROS in a mouse MAFLD model.
a Oil red O staining showing the lipid droplets (red) in liver tissues of four groups of mice. b Liver triglycerides levels in liver tissues of four groups of mice. n = 6 biologically independent experiments. c Liver cholesterol levels in liver tissues of four groups of mice. n = 6 biologically independent experiments. d–g Representative immunoblot analysis of p-Akt, Akt, p-IRS1, IRS-1 and PPARα in liver tissues from four groups of mice. GAPDH was used as loading control. h–l The mRNA levels of lipid oxidation gene Pparα and lipid synthesis genes including Scd1, Fasn, Hmgcr and Cpt1a in liver tissues of four groups of mice. n = 4–6 biologically independent experiments. m Mitochondrial ROS content measured by MitoSox Dye (red) in liver tissues of four groups of mice. Hoechst 33342 (blue) was used to label nuclei. n = 9 biologically independent experiments. The data were presented as Means ± SEM and analyzed by One way-ANOVA followed by Tukey’s post hoc test. *P < 0.05, **P < 0.01 vs Chow; #P < 0.05, ##P < 0.01 vs HFHF. NS no significance.
The ferroptosis inhibitor LPT1 mitigates liver injury and fibrosis in a mouse MAFLD models
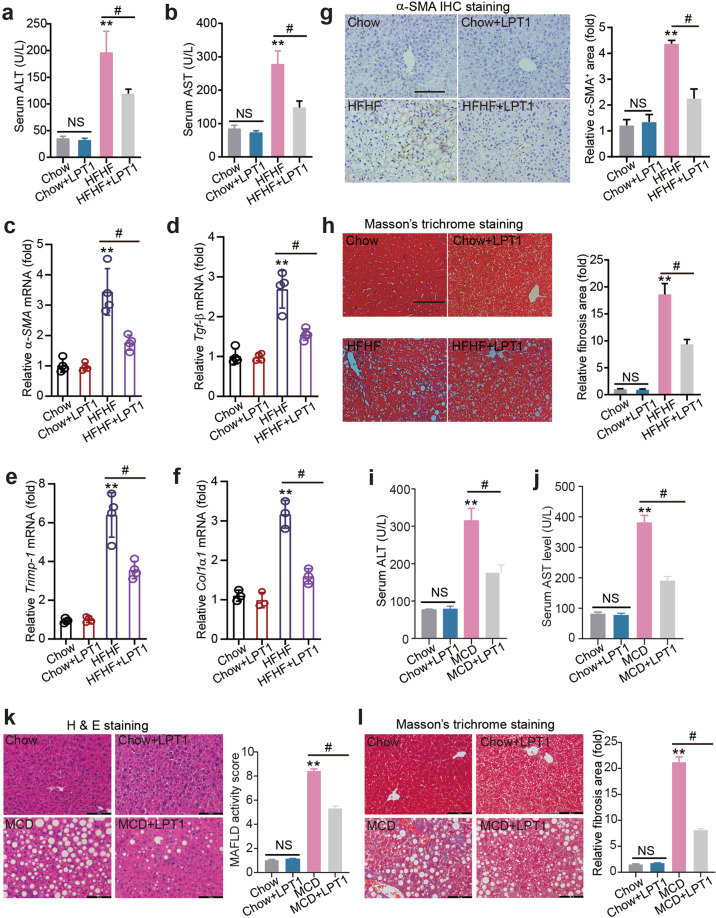
LPT1 treatment substantially reduced serum ALT and AST levels in the MAFLD model (Fig. 3a, b). LPT1 treatment significantly delayed the development of liver fibrosis, and a quantitative real-time PCR analysis showed that four profibrotic genes (alpha-smooth muscle actin [α-SMA], transforming growth factor-β [TGF-β], tissue inhibitor of matrix metalloproteinases 1 [Timp1] and collagen type I alpha 1 [Col1α1]) were upregulated in MAFLD mouse liver but were inhibited by LPT1 treatment (Fig. 3c–f). Immunohistochemistry staining of α-SMA confirmed that the liver fibrosis was attenuated by LPT1 (Fig. 3g). In agreement with this result, Masson’s trichrome staining demonstrated that the number of collagen fibers (blue filaments) in the MAFLD mice was reduced after LPT1 treatment (Fig. 3h). We also evaluated the effects of LPT1 on liver injury in mice fed MCD, which presented higher hepatic inflammation and cell death. We found that LPT1 treatment reduced serum ALT and AST levels in the MCD-fed mice (Fig. 3i-j). H&E staining demonstrated that liver steatosis was also alleviated by LPT1 treatment (Fig. 3k). Masson’s trichrome staining showed similar results (Fig. 3l). These results indicate that ferroptosis inhibitors mitigated liver injury and fibrosis in both HFHF-diet and MCD-fed MAFLD models.
Fig. 3. The ferroptosis inhibitor LPT1 mitigates liver injury and fibrosis in a mouse MAFLD models.
a, b Serum ALT and AST levels in four groups of mice. c–f The mRNA levels of pro-fibrotic genes α-SMA, Tgf-β, Timp-1 and Col1α1 in liver tissues from four groups of mice. n = 4 biologically independent experiments. g Immunohistochemistry staining of α-SMA and quantitative analysis in liver tissues from four groups of mice. Scale bars, 100 μm. h Masson’s trichrome staining showing the collagen fibers (blue) in liver tissues from four groups of mice. Scale bars, 100 μm. i, j Serum ALT and AST levels in four groups of mice fed with MCD for 4 weeks. LPT1 was given intraperitoneally (10 mg·kg−1·d−1) for two weeks. n = 6 per group. k MAFLD activity score calculated based on H&E staining in liver from four groups mice fed with MCD or normal chow diet. Scale bars, 100 μm. n = 6 per group. l Masson’s trichrome staining showing the liver fibrosis from four groups of mice fed with MCD or normal chow diet. Scale bars, 100 μm. n = 6 per group. The data were presented as Means ± SEM and analyzed by One way-ANOVA followed by Tukey’s post hoc test. **P < 0.01 vs Chow; #P < 0.05. NS no significance.
The ferroptosis inhibitor LPT1 suppresses steatohepatitis and ‘PANoptosis’ in a mouse MAFLD models
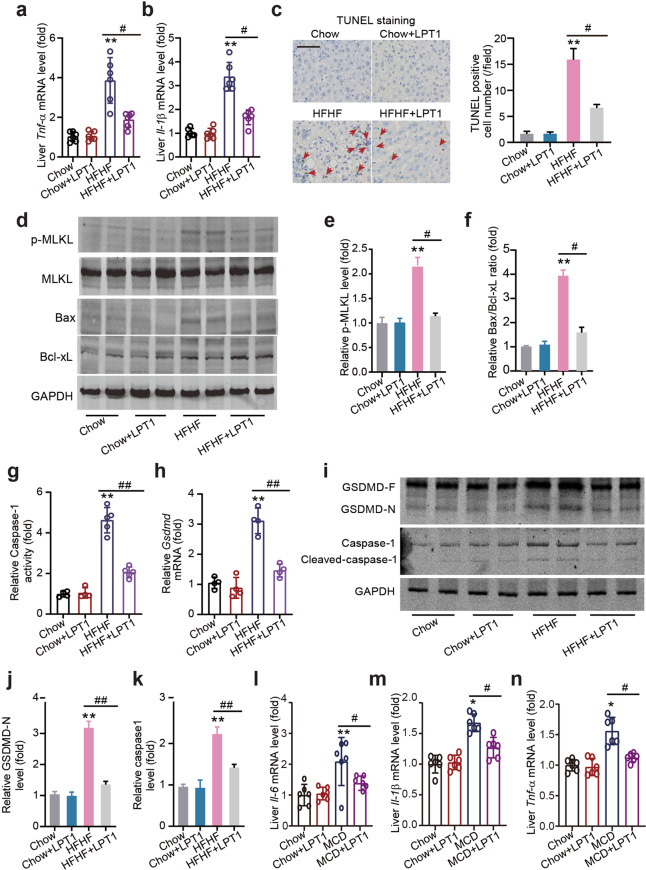
Next, we investigated whether LPT1 modulated other types of cell death. Interestingly, LPT1 treatment reduced the mRNA levels of tumor necrosis factor-α (Tnf-α) and interleukin1-β (Il-1β) in the HFHF diet-fed mice (Figs. 4a, b). Moreover, LPT1 treatment decreased the number of TUNEL-positive cells in MAFLD mouse liver tissue (Fig. 4c). Bax is a pro-apoptotic protein through which intrinsic apoptosis is mediated, and amplifies apoptosis via the extrinsic apoptotic pathway [36]. Notably, Bax protein expression was increased in MAFLD mouse liver but reduced by LPT1, while LPT1 slightly increased the protein expression of the anti-apoptotic protein Bcl-xL (Fig. 4d, f) [36]. These results suggest that LPT1 inhibits apoptosis in MAFLD liver tissue. We next found that the increased phosphorylation of mixed lineage kinase domain like pseudokinase (MLKL), a marker of necroptosis [37], in MAFLD mouse liver tissue was inhibited by LPT1 treatment (Fig. 4d, e). Finally, we investigated pyroptosis. We measured the activity and level of Caspase-1 and gasdermin D (GSDMD), two executors of pyroptosis involved in MAFLD development, respectively [38, 39]. We found that the Caspase-1 enzyme activity and Gsdmd mRNA levels were markedly increased in MAFLD mouse liver but significantly reduced by LPT1 treatment (Figs. 4g, h). Additionally, we analyzed the cleavage of Caspase-1 and GSDMD. In the liver tissue of MAFLD mice, the cleavage of Caspase-1 and GSDMD were significantly increased, but prevented by LPT1 treatment (Fig. 4i–k). We also evaluated the effects of LPT1 on liver inflammation in mice fed with MCD, and found that the mRNA levels of Il-6, Tnf-α and Il-1β were reduced by LTP1 in these mice (Fig. 4l–n). These results indicated that ferroptosis inhibitors suppressed PANoptosis, a novel concept that includes apoptosis, pyroptosis, and necroptosis in MAFLD animal models [40].
Fig. 4. The ferroptosis inhibitor LPT1 suppresses steatohepatitis and ‘PANoptosis’ in a mouse MAFLD models.
a, b The mRNA level of pro-inflammatory factor TNF-α and IL-1β in liver tissues from four groups of mice. n = 6 biologically independent experiments. c TUNEL staining showing apoptotic cells in liver tissues from four groups of mice. The arrows show TUNEL positive cells (brown). Scale bars, 100 μm. d–f Representative immunoblot images and quantitative analysis on phosphorylated MLKL (p-MLKL), total MLKL, Bax (a pro-apoptotic protein) and Bcl-xL (an anti-apoptotic protein) protein levels in liver tissues from four groups of mice. GAPDH as loading control. g The enzymatic activity of pyroptosis executor Caspase-1 in liver tissues from four groups of mice. n = 5 biologically independent experiments. h The mRNA level of pyroptosis executor Gsdmd in liver tissues from four groups of mice. n = 4 biologically independent experiments. i–k Representative immunoblot images and quantitative analysis on the cleavage of Caspase-1 and GSDMD in liver tissues from four groups of mice. GAPDH as loading control. l–n The mRNA level of IL-6, IL-1β and TNF-α in liver tissues from four groups of mice fed with MCD or normal chow diet for 4 weeks. n = 6 biologically independent experiments. The data were presented as Means ± SEM and analyzed by One way-ANOVA followed by Tukey’s post hoc test. *P < 0.05, **P < 0.01 vs Chow; #P < 0.05, ##P < 0.01. NS no significance.
The ferroptosis inhibitor LPT1 inhibits cleavage of PANoptosis-related Caspase-6 and Caspase-8
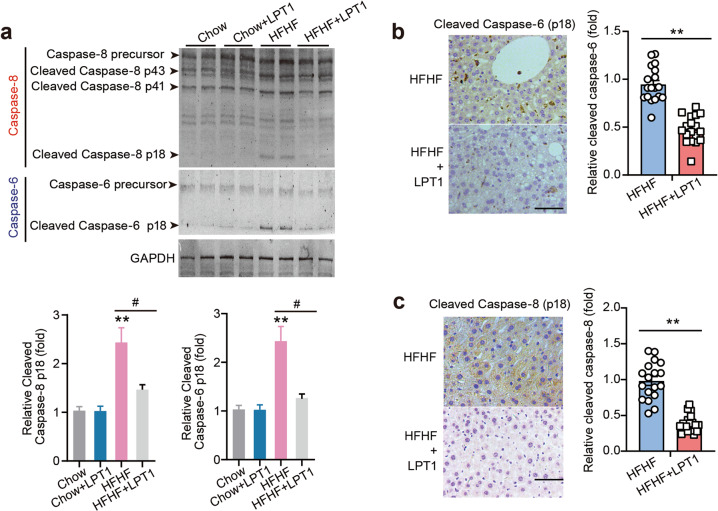
It has been reported that PANoptosis is largely controlled by PANoptosome formation, which may require activation of Caspase-8 [41] and Caspase-6 [42], two members of caspases whose functions remain to be delineated. Hence, we performed immunoblotting to measure Caspase-8 and Caspase-6 activation in the liver tissue of mice. Pro-caspase-8 is cleaved to generate a 41/43 kDa fragment (p41/43) and a mature 18 kDa fragment [41]. We found that the p41/43 and p18 fractions of Caspase-8 were obviously increased in MAFLD mouse liver but inhibited by LPT1 treatment (Fig. 5a). Pro-caspase-6 is cleaved to form an ~18 kDa fragment with mature function (Caspase p18) [42]. The level of the mature cleaved form of p18 of Caspase-6 in MAFLD mouse liver tissue was higher than that in the liver of chow-fed mouse; however, the active Caspase-6 was also prevented in LPT1-treated mouse liver (Fig. 5a). We confirmed the cleavage of Caspase-6 and Caspase-8 using immunohistochemistry with specific antibodies against cleaved Caspase-6 and Caspase-8. The result of cleaved Caspase-6 was significantly decreased by LPT1 treatment (Fig. 5b). Cleaved Caspase-8 seemed to be expressed diffusely in liver tissue, and LPT1 treatment indeed reduced its expression under MAFLD conditions (Fig. 5c). These results suggest that the ferroptosis inhibitor LPT1 limits the activation of Caspase-6/-8 in the MAFLD model.
Fig. 5. The ferroptosis inhibitor LPT1 inhibits cleavage of PANoptosis-related Caspase-6 and Caspase-8.
a Representative immunoblot analysis of Caspase-6 and Caspase-8 levels in liver tissues from four groups of mice. GAPDH as loading control. b Immunohistochemistry staining showing the effects of LPT1 treatment on cleaved Caspase-6 (p18 subunit) in MAFLD mice liver tissues. Scale bars, 100 μm. n = 18 biologically independent experiments. c Immunohistochemistry staining showing the effects of LPT1 treatment on cleaved Caspase-8 (p18 subunit) in MAFLD mice liver tissues. Scale bars, 100 μm. n = 18 biologically independent experiments. The data were presented as Means ± SEM and analyzed by One way-ANOVA followed by Tukey’s post hoc test. **P < 0.01 vs Chow; #P < 0.05 vs HFHF. NS no significance.
The ferroptosis inhibitor LPT1 directly blocks PANoptosis in hepatocytes upon lipid stress
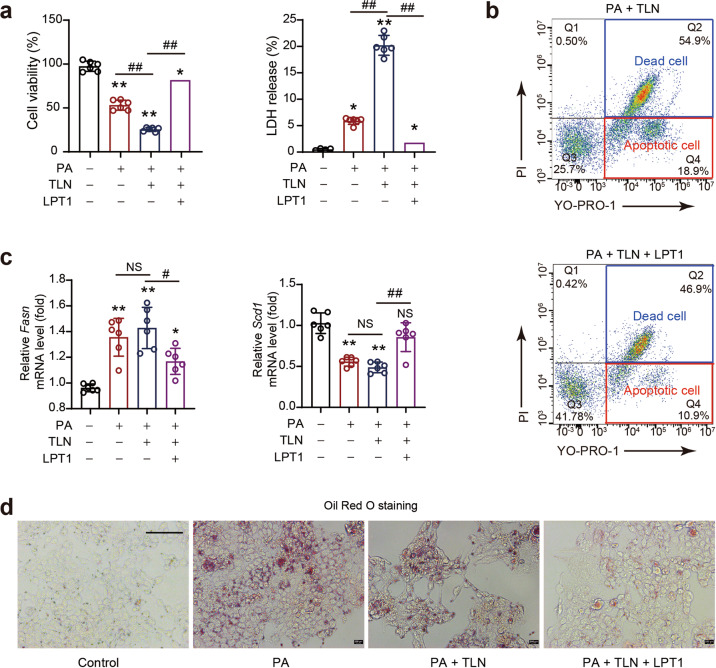
Next, we investigated whether LPT1 can directly inhibit PANoptosis in cultured AML12 cells in an in vitro MAFLD model induced by PA. PANoptosis was induced by TLN stimuli (a combination of TNF-α, LPS and Nigericin) [23, 43]. We observed that TLN potently aggravated cell injury under PA stress, as evidenced by a further decrease in cell viability and increase in the amount of LDH release (Fig. 6a). LPT1 treatment successfully blocked these changes induced by TLN (Fig. 6a). Additionally, we determined the number of apoptotic and necroptotic cells with a flow cytometer via the YO-PRO-1/PI assay. LPT1 treatment significantly inhibited both the apoptosis and necroptosis induced by TLN in the presence of PA (Fig. 6b). Moreover, we found that the Fasn and Scd1 mRNA levels in the presence of TLN were rescued by LPT1 (Fig. 6c). In support of this, LPT1 reduced lipid accumulation in AML12 cells after PA treatment in the presence of TLN (Fig. 6d). These results showed that the ferroptosis inhibitor LPT1 directly inhibited PANoptosis in an in vitro MAFLD model.
Fig. 6. The ferroptosis inhibitor LPT1 directly blocks PANoptosis in hepatocytes upon lipid stress.
a The effects of ferroptosis inhibitor LPT1 on cell viability and LDH release in an in vitro MAFLD model. AML12 cells were cultured in DME/F-12 medium and treated with PANoptosis-inducing molecules (TLN), a combination of TNF-α (100 mg/mL), LPS (50 ng/mL) and Nigericin (20 mmol/L), in the presence of PA stimuli (300 nmol/L). The LPT1 was added into the PA stimuli culture medium to reach the final concentration at 100 nmol/L. Cell viability and LDH release were measured using commercial kits. b The apoptosis and necroptosis induced by PANoptosis-inducing molecules TLN were measured by flow cytometry analysis with YO-PRO-1/PI staining. c The mRNA levels of Scd1 and Fasn in AML12 cells treated by PANoptosis-inducing molecules TLN in the presence of PA. d Oil red O staining showing the lipid content in AML12 cells treated by PANoptosis-inducing molecules TLN in the presence of PA. The data were presented as Means ± SEM and analyzed by One way-ANOVA followed by Tukey’s post hoc test. n = 6 per group. *P < 0.05, **P < 0.01 vs Control; #P < 0.05, ##P < 0.01. NS no significance.
An iron chelator DFP reduces ferroptosis but does not ameliorate steatosis
Next, we examined whether chelating iron alleviates steatosis and steatohepatitis. MAFLD mice were treated with the iron chelator DFP, which is widely used to treat thalassemia patients in the clinic, for 2 weeks (Fig. 7a). The mice were assigned into three groups: Chow, HFHF and HFHF + DFP groups. We did not establish a ‘Chow+DFP’ group because DFP does not induce a significant effect in normal animals. We found that although DFP did not lead to decreased body weight, it reduced the liver weight in MAFLD mice (Fig. 7b). DFP treatment also reduced the hepatic Fe2+ level (Fig. 7c). The increase in Hamp gene expression was abolished by DFP treatment (Fig. 7d). DFP also decreased the levels of ferroptosis molecular markers, including ACSL4, ALOX15, Ferritin and Transferrin (Fig. 7e). Meanwhile, DFP partially rescued GPX4 expression (Fig. 7e). We also found that GSH levels were slightly increased after DFP treatment (Fig. 7f). However, Oil red O staining showed that lipid deposition was not reduced by DFP, and was comparable between the MAFLD model mice and DFP-treated MAFLD mice (Fig. 7g). DFP treatment did not affect the changes of lipid oxidation and synthesis mRNA expression (including Pparα, Fasn, Hmgcr and Cpt1a levels) under MAFLD conditions (Fig. 7h). Liver triglycerides and cholesterol contents were increased in MAFLD liver tissue by ~3-fold and were not affected by DFP treatment (Fig. 7i). In addition, we found that DFP treatment failed to change the phosphorylation levels of IRS-1 and Akt (Fig. 7j). All these results indicate that an iron chelator does not ameliorate steatosis.
An iron chelator DFP alleviates steatohepatitis
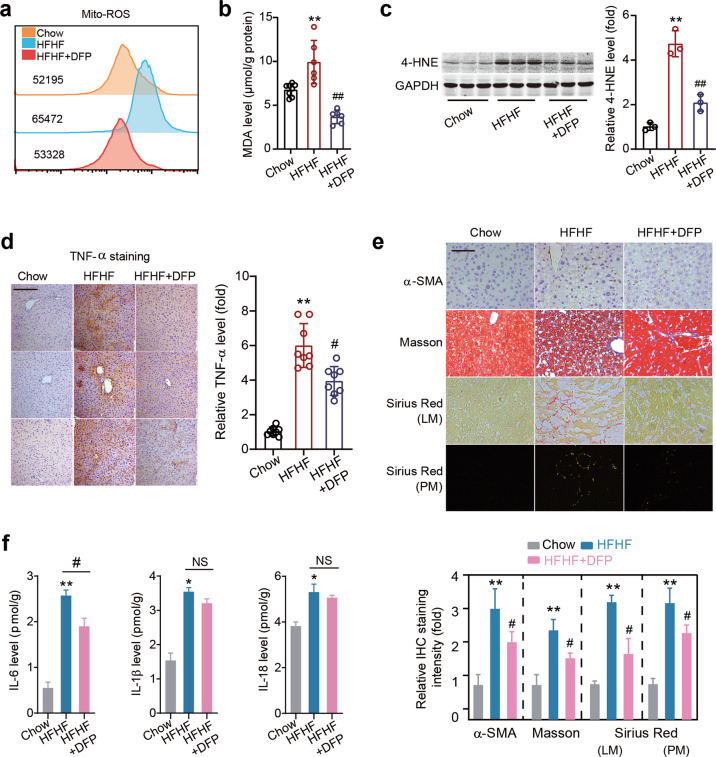
We further studied the effect of DFP on hepatic Mito-ROS and inflammation. DFP treatment slightly reduced mitochondrial ROS levels in the liver tissue of MAFLD mice (Fig. 8a). Similarly, the increase in the level of hepatic MDA was inhibited by DFP treatment (Fig. 8b). Next, we found that the 4-HNE protein level was decreased after DFP treatment (Fig. 8c). An immunohistochemistry analysis showed that the TNF-α level was reduced by DFP treatment (Fig. 8d). Immunohistochemistry staining of α-SMA, Masson’s staining and Sirius Red staining (red under light microscopy [LM]; orange/green under polarized microscopy [PM]) showed that DFP treatment inhibited liver fibrosis (Fig. 8e). DFP treatment moderately reduced IL-6 expression, but did not alter IL-1β or IL-18 expression (Fig. 8f). These data suggest that DFP alleviated steatohepatitis to some extent in our MAFLD model.
Fig. 8. An iron chelator DFP alleviates steatohepatitis.
a Mitochondrial ROS level was determined by flow cytometry with MitoSOX dye. b The MDA levels in liver tissues in three groups of mice. c Representative immunoblot images and quantitative analysis of 4-HNE protein level in liver tissues in three groups of mice. GAPDH as loading control. n = 3 biologically independent experiments. d Immunohistochemistry staining of TNF-α in liver tissues in three groups of mice. Scale bars, 100 μm. n = 8 biologically independent experiments. e Immunohistochemistry staining of α-SMA, Masson’s trichrome staining and Sirius Red staining (red under light microscopy [LM]; orange/green under polarized microscopy [PM]) in liver tissues in three groups of mice. Scale bars, 100 μm. f ELISA of IL-6, IL-1β and IL-18 levels in liver tissues of three groups of mice. The data were presented as Means ± SEM and analyzed by One way-ANOVA followed by Tukey’s post hoc. *P < 0.05, **P < 0.01 vs Chow; #P < 0.05, ##P < 0.01 vs HFHF. NS no significance.
An iron chelator DFP does not block PANoptosis
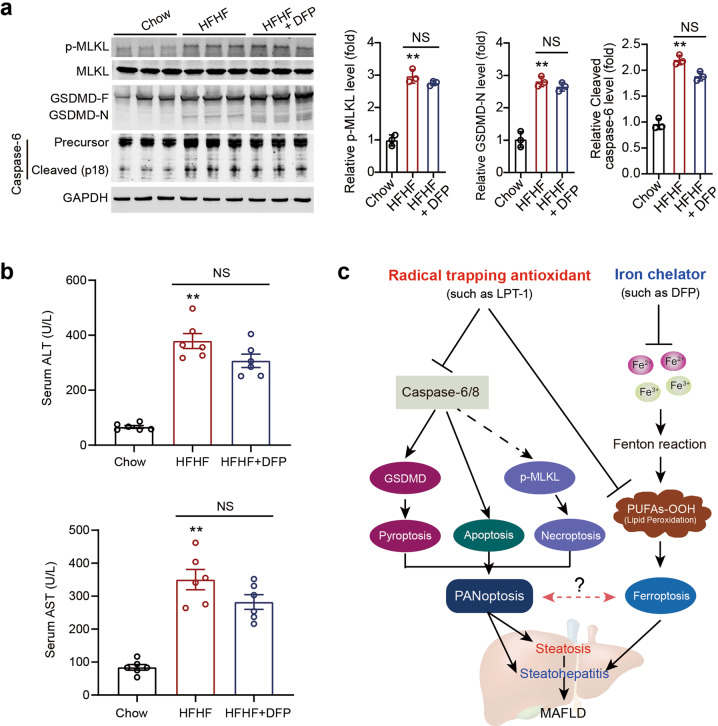
Given that DFP did not alter IL-1β and IL-18 expression, we further investigated the influence of DFP on PANoptosis in our MAFLD model. DFP did not exert a significant influence on the increased phosphorylation of MLKL, cleavage of GSDMD, or cleavage of Caspase-6 under MAFLD conditions (Fig. 9a). In line with this result, DFP failed to reduce serum ALT or AST levels (Fig. 9b). These results suggest that DFP does not affect PANoptosis or liver injury in MAFLD.
Fig. 9. An iron chelator DFP does not block PANoptosis.
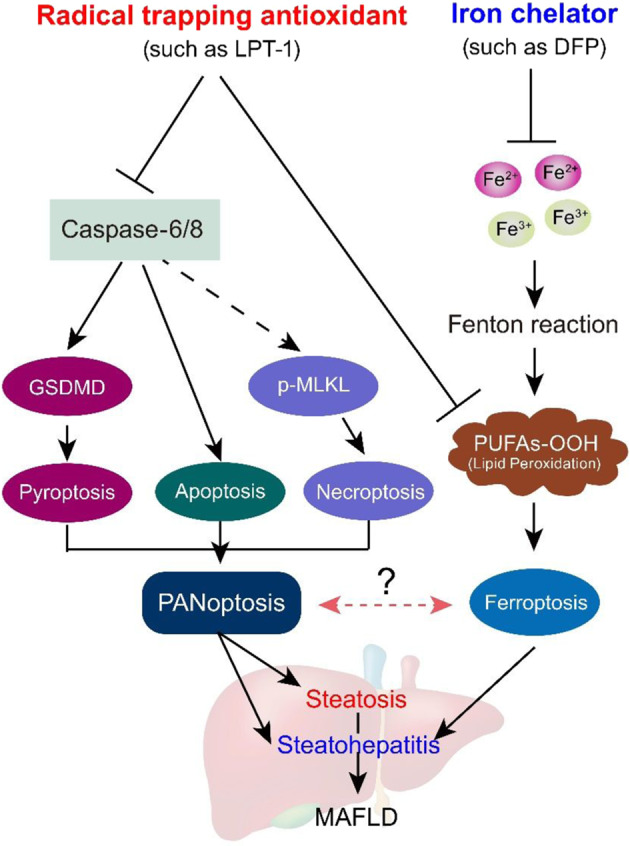
a Representative immunoblot images and quantitative analyses of p-MLKL, MLKL, GSDMD and Caspase-6 in liver tissues in three groups of mice. GAPDH as loading control. n = 3 biologically independent experiments. b Serum ALT and AST levels in three groups of mice which were induced by HFHF diet for 16 weeks. DFP was given by oral gavage (100 mg·kg−1·d−1) for two weeks. c A schematic representation depicting the different impacts of ferroptosis inhibitor (radical trapping antioxidant) and iron chelator on steatosis and steatohepatitis in MAFLD condition. Ferroptosis inhibitor not only inhibits ferroptosis, but also blocks apoptosis, pyroptosis and necroptosis (PANoptosis). By contrary, iron chelator does not affect PANoptosis process. The data were presented as Means ± SEM and analyzed by One way-ANOVA followed by Tukey’s post hoc. **P < 0.01 vs Chow. NS no significance.
Discussion
As a novel type of cell death, ferroptosis participates in the pathophysiology of a group of diseases, including neurodegenerative disorders, cardiovascular diseases, metabolic dysfunction and tumor biology [44]. Our findings clearly demonstrate that ferroptosis inhibitors and iron chelators exerted different influences on steatosis and steatohepatitis in our MAFLD mouse model. Moreover, the present study clarifies a novel molecular mechanism underlying the alleviation of MAFLD by ferroptosis inhibitors. Ferroptosis inhibitors not only inhibited ferroptosis but also blocked apoptosis, pyroptosis and necroptosis. Thus, we propose that a ferroptosis inhibitor may similarly inhibit ‘PANoptosis’, a unique, physiologically relevant, inflammatory programmed cell death pathway involving pyroptosis, apoptosis, and necroptosis and activated by specific triggers and regulated by the PANoptosome complex. However, an iron chelator did not impact PANoptosis. These results are summarized in Fig. 9c.
The major finding of this study, and the first evidence of its kind, showed that the ferroptosis inhibitor LPT1 protected against MAFLD pathologies by preventing comprehensive cell death including ferroptosis and PANoptosis (a combination of apoptosis, pyroptosis and necroptosis). PANoptosis is a newly described death program that refers to a combination of apoptosis, pyroptosis, and necroptosis [40]. Our findings strongly indicate that the ferroptosis inhibitors, especially compounds based on RTA function, not only inhibit ferroptosis, but also block PANoptosis. After the discovery of ferroptosis [8–11], ferroptosis inhibitors such as LPT1 and ferrostatin-1 were identified and thought to be lipoxygenases (LOX) inhibitors. Later, these inhibitors were shown to be RTAs, not LOX inhibitors [31]. The efficacy of RTAs relies greatly on the stable balance between fast H-atom transfer kinetics and one-electron oxidation mediated by peroxidic species. Recently, many synthetic chemical compounds, including tetrahydronaphthyridinol [31], thiosemicarbazone [45], phenoxazines/phenothiazines [46] and nitroxides [47], have been developed as ferroptosis inhibitors. These effective RTAs exert potent protective effects against lipid peroxidation-dependent ferroptosis without disrupting apoptosis, pyroptosis and necroptosis in cultured cells. However, it is an open question, though, whether these ferroptosis inhibitors would selectively inhibit ferroptosis but not impact on other types of cell death in vivo. Ferroptosis induces excessive phospholipid peroxidation to cause cytotoxicity, which triggers inflammatory reactions to further induce apoptosis, necroptosis, and pyroptosis in surrounding cells. Indeed, our results provide evidence showing that the ferroptosis inhibitor LPT1 can apparently block apoptosis, pyroptosis and necroptosis in MAFLD, a complex disorder involving insulin resistance, lipid metabolism dysfunction, oxidative stress, inflammation and various types of cell death. Notably, all types of cell death including ferroptosis, apoptosis, pyroptosis and necroptosis, might be closely associated with each other during the onset and progression of disease, highlighting the crosstalk and links between cell death and disease. A recent work has found a combined small molecule compound Nec-1 that derived from necroptotic receptor interacting protein kinase 1 (RIPK1) selective inhibitor blocked necroptosis and ferroptosis simultaneously via unknown mechanisms [48]. Similarly, the tumor suppressor protein p53 may simultaneously induce apoptosis and suppress ferroptosis [49]. These findings imply that there might be a potential link between ferroptosis and other types of cell death. Nevertheless, to determine whether all RTA-based ferroptosis inhibitors can prevent or block other types of cell death in addition to ferroptosis, further investigation is needed.
Our findings do not indicate that iron chelators attenuate hepatic steatosis. Recent studies have shown that prophylactic administration of iron chelators or ferroptosis inhibitors effectively prevented MCD-/CD-feeding-induced NASH development [18–20]. Qi et al. reported that preventive supplementation with the iron chelator deferoxamine mesylate or the ferroptosis inhibitor liproxstatin-1 comprehensively alleviated hepatic steatosis and inflammation by inhibiting lipid accumulation, inflammatory cytokine production and cell death in a NASH model induced by feeding an MCD [18]. Li et al. also reported that preventive supplementation with LPT1 attentuated steatosis and steatohepatitis in an MCD-fed model [19]. In the present study, we sought to determine whether inhibition of ferroptosis by two distinct-classes of agents (a ferroptosis inhibitor or iron chelator) reduced metabolic pathologies in a highly recognized MAFLD model induced by a HFHF diet. In terms of steatosis, our results differ from recent observations. Studying a mouse MAFLD model induced by 16-weeks of HFHF feeding, we found that the iron chelator DFP did not reduce hepatic lipid deposition, lipid-regulated gene expression and serum lipid levels. These results suggest that chelating iron alone may not reduce lipid metabolism or attenuate hepatic steatosis. Therefore, iron may be only the initiator of ferroptosis, but not the key player in the ferroptotic cascade, which results in serious liver damage. In contrast, excessive lipid peroxidation and membrane rupture are the vital events in liver injury and PANoptosis. Since the MCD/CD-induced animal model is used for studying hepatic injury and fibrosis in the short term but does not recapitulate characteristics of human metabolic syndrome [21, 22], the discrepancy between our results and previous findings [18, 19, 50], which showed that iron chelators alleviated steatosis, may be due to differences in animal models. Interestingly, DFP displayed an inhibitory action on steatohepatitis in our models. The asynchronous phenomenon between steatosis and steatohepatitis are common [51]. For example, aging does not promote the development of hepatic steatosis but leads to increased hepatocellular injury and inflammation [52]. Therefore, we may discover totally unique mechanisms underlying the remission induced by iron chelators and ferroptosis inhibitors in MAFLD.
In the past three years, ample experimental evidence has implied the involvement of ferroptosis in the onset and progression of MAFLD [19, 20, 53–55]. Some key molecular mechanisms or events have been proposed. Among the possible key molecular contributors, GPX4 is considered to be a vital player in ferroptosis in MAFLD. Qi et al. concluded that the downregulation of GPX4 might be a major cause of ferroptosis in MAFLD [18]. Zhu et al. found that thymosin beta 4, a multifunctional polypeptide, alleviated nonalcoholic fatty liver by inhibiting ferroptosis via GPX4 upregulation [54]. Wang et al. reported that bone morphogenetic protein 4, a member of the transforming growth factor beta (TGFβ) superfamily, interacted with GPX4 and thus increased GPX4 expression, which resulted in the inhibition of ferroptosis and amelioration of MAFLD [55]. In fact, we recently discovered evidence showing that an inducible isoform of GPX4 (iGPX4) triggered ferroptosis in MAFLD [28]. This unconventional GPX4 isoform interacted with canonical GPX4 (cGPX4) to facilitate the transformation of cGPX4 from an enzymatically-active monomer to an enzymatically-inactive oligomers upon lipid stress, which promoted ferroptosis [28]. Nevertheless, there might be other key triggers of ferroptosis involved in MAFLD, and this possibility needs to be investigated in the future.
In summary, ferroptosis contributes to MAFLD and ferroptosis inhibitors alleviate steatosis and steatohepatitis by blocking PANoptosis (combined apoptosis, pyroptosis, and necroptosis). In addition, the iron chelator only mildly inhibits steatohepatitis and does not ameliorate hepatic lipid metabolism or steatosis.
Supplementary information
Author contributions
JT: Writing-original draft, Methodology, Investigation. XTL: Methodology, Formal analysis, Investigation. ZZ: Formal analysis and Investigation. YL: Formal analysis, Investigation, Writing – review & editing. DYS: Formal analysis and Writing – review & editing. XJW: Investigation and Writing – review & editing. SXOY: Investigation and Writing – review & editing. CLZ: Resources (Synthesis of LPT1). FMS: Formal analysis, Resources and Writing – review & editing. PW: Conceptualization, Writing – original draft, Supervision, Funding acquisition, Writing-review & editing. DJL: Conceptualization, Writing – original draft, Supervision, Funding acquisition, Writing – review & editing.
Funding
This work was supported by the grants from National Natural Science Foundation (82073915, 82274030, 81971306, and 81773719), National Key Research and Development Program Stem Cell and Translational Research Key Projects (2018YFA0108301), Shanghai Talent Development Fund (2020091), Shanghai Science and Technology Commission Grants (21XD1424900, 2020-JMRH1-KJ12, 21S11901200 and 19140904700), Shanghai Shuguang Program (19SG32) and Shanghai Rising Stars of Medical Talent Development Program-Clinical Pharmacist Project [SHWRS(2020)_087].
Competing interests
The authors declare no competing interests.
Footnotes
These authors contributed equally: Jie Tong, Xiu-ting Lan, Zhen Zhang
Contributor Information
Pei Wang, Email: pwang@smmu.edu.cn.
Dong-jie Li, Email: djli@tongji.edu.cn.
Supplementary information
The online version contains supplementary material available at 10.1038/s41401-022-01010-5.
References
- 1.Eslam M, Sanyal AJ, George J, International Consensus P. MAFLD: a consensus-driven proposed nomenclature for metabolic associated fatty liver disease. Gastroenterology. 2020;158:1999–2014.e1. doi: 10.1053/j.gastro.2019.11.312. [DOI] [PubMed] [Google Scholar]
- 2.Eslam M, George J. MAFLD: a holistic view to redefining fatty liver disease. J Hepatol. 2021;74:983–5. doi: 10.1016/j.jhep.2020.12.027. [DOI] [PubMed] [Google Scholar]
- 3.Younossi ZM, Rinella ME, Sanyal AJ, Harrison SA, Brunt EM, Goodman Z, et al. From NAFLD to MAFLD: implications of a premature change in terminology. Hepatology. 2021;73:1194–8. doi: 10.1002/hep.31420. [DOI] [PubMed] [Google Scholar]
- 4.Paik JM, Golabi P, Younossi Y, Mishra A, Younossi ZM. Changes in the global burden of chronic liver diseases from 2012 to 2017: the growing impact of NAFLD. Hepatology. 2020;72:1605–16. doi: 10.1002/hep.31173. [DOI] [PubMed] [Google Scholar]
- 5.Friedman SL, Neuschwander-Tetri BA, Rinella M, Sanyal AJ. Mechanisms of NAFLD development and therapeutic strategies. Nat Med. 2018;24:908–22. doi: 10.1038/s41591-018-0104-9. [DOI] [PMC free article] [PubMed] [Google Scholar]
- 6.Trauner M, Fuchs CD. Novel therapeutic targets for cholestatic and fatty liver disease. Gut. 2022;71:194–209. doi: 10.1136/gutjnl-2021-324305. [DOI] [PMC free article] [PubMed] [Google Scholar]
- 7.Loomba R, Friedman SL, Shulman GI. Mechanisms and disease consequences of nonalcoholic fatty liver disease. Cell. 2021;184:2537–64. doi: 10.1016/j.cell.2021.04.015. [DOI] [PMC free article] [PubMed] [Google Scholar]
- 8.Dixon SJ, Lemberg KM, Lamprecht MR, Skouta R, Zaitsev EM, Gleason CE, et al. Ferroptosis: an iron-dependent form of nonapoptotic cell death. Cell. 2012;149:1060–72. doi: 10.1016/j.cell.2012.03.042. [DOI] [PMC free article] [PubMed] [Google Scholar]
- 9.Yang WS, SriRamaratnam R, Welsch ME, Shimada K, Skouta R, Viswanathan VS, et al. Regulation of ferroptotic cancer cell death by GPX4. Cell. 2014;156:317–31. doi: 10.1016/j.cell.2013.12.010. [DOI] [PMC free article] [PubMed] [Google Scholar]
- 10.Friedmann Angeli JP, Schneider M, Proneth B, Tyurina YY, Tyurin VA, Hammond VJ, et al. Inactivation of the ferroptosis regulator Gpx4 triggers acute renal failure in mice. Nat Cell Biol. 2014;16:1180–91. doi: 10.1038/ncb3064. [DOI] [PMC free article] [PubMed] [Google Scholar]
- 11.Ingold I, Berndt C, Schmitt S, Doll S, Poschmann G, Buday K, et al. Selenium utilization by GPX4 is required to prevent hydroperoxide-induced ferroptosis. Cell. 2018;172:409–22.e21. doi: 10.1016/j.cell.2017.11.048. [DOI] [PubMed] [Google Scholar]
- 12.Doll S, Proneth B, Tyurina YY, Panzilius E, Kobayashi S, Ingold I, et al. ACSL4 dictates ferroptosis sensitivity by shaping cellular lipid composition. Nat Chem Biol. 2017;13:91–8. doi: 10.1038/nchembio.2239. [DOI] [PMC free article] [PubMed] [Google Scholar]
- 13.Chu B, Kon N, Chen D, Li T, Liu T, Jiang L, et al. ALOX12 is required for p53-mediated tumour suppression through a distinct ferroptosis pathway. Nat Cell Biol. 2019;21:579–91. doi: 10.1038/s41556-019-0305-6. [DOI] [PMC free article] [PubMed] [Google Scholar]
- 14.Bersuker K, Hendricks JM, Li Z, Magtanong L, Ford B, Tang PH, et al. The CoQ oxidoreductase FSP1 acts parallel to GPX4 to inhibit ferroptosis. Nature. 2019;575:688–92. doi: 10.1038/s41586-019-1705-2. [DOI] [PMC free article] [PubMed] [Google Scholar]
- 15.Doll S, Freitas FP, Shah R, Aldrovandi M, da Silva MC, Ingold I, et al. FSP1 is a glutathione-independent ferroptosis suppressor. Nature. 2019;575:693–8. doi: 10.1038/s41586-019-1707-0. [DOI] [PubMed] [Google Scholar]
- 16.Lee H, Zandkarimi F, Zhang Y, Meena JK, Kim J, Zhuang L, et al. Energy-stress-mediated AMPK activation inhibits ferroptosis. Nat Cell Biol. 2020;22:225–34. doi: 10.1038/s41556-020-0461-8. [DOI] [PMC free article] [PubMed] [Google Scholar]
- 17.Mao C, Liu X, Zhang Y, Lei G, Yan Y, Lee H, et al. DHODH-mediated ferroptosis defence is a targetable vulnerability in cancer. Nature. 2021;593:586–90. doi: 10.1038/s41586-021-03539-7. [DOI] [PMC free article] [PubMed] [Google Scholar]
- 18.Qi J, Kim JW, Zhou Z, Lim CW, Kim B. Ferroptosis affects the progression of nonalcoholic steatohepatitis via the modulation of lipid peroxidation-mediated cell death in mice. Am J Pathol. 2020;190:68–81. doi: 10.1016/j.ajpath.2019.09.011. [DOI] [PubMed] [Google Scholar]
- 19.Li X, Wang TX, Huang X, Li Y, Sun T, Zang S, et al. Targeting ferroptosis alleviates methionine-choline deficient (MCD)-diet induced NASH by suppressing liver lipotoxicity. Liver Int. 2020;40:1378–94. doi: 10.1111/liv.14428. [DOI] [PubMed] [Google Scholar]
- 20.Tsurusaki S, Tsuchiya Y, Koumura T, Nakasone M, Sakamoto T, Matsuoka M, et al. Hepatic ferroptosis plays an important role as the trigger for initiating inflammation in nonalcoholic steatohepatitis. Cell Death Dis. 2019;10:449. doi: 10.1038/s41419-019-1678-y. [DOI] [PMC free article] [PubMed] [Google Scholar]
- 21.Nevzorova YA, Boyer-Diaz Z, Cubero FJ, Gracia-Sancho J. Animal models for liver disease - A practical approach for translational research. J Hepatol. 2020;73:423–40. doi: 10.1016/j.jhep.2020.04.011. [DOI] [PubMed] [Google Scholar]
- 22.Im YR, Hunter H, de Gracia Hahn D, Duret A, Cheah Q, Dong J, et al. A systematic review of animal models of nafld finds high-fat, high-fructose diets most closely resemble human NAFLD. Hepatology. 2021;74:1884–901. doi: 10.1002/hep.31897. [DOI] [PubMed] [Google Scholar]
- 23.Lee S, Karki R, Wang Y, Nguyen LN, Kalathur RC, Kanneganti TD. AIM2 forms a complex with pyrin and ZBP1 to drive PANoptosis and host defence. Nature. 2021;597:415–9. doi: 10.1038/s41586-021-03875-8. [DOI] [PMC free article] [PubMed] [Google Scholar]
- 24.Lei G, Zhang Y, Koppula P, Liu X, Zhang J, Lin SH, et al. The role of ferroptosis in ionizing radiation-induced cell death and tumor suppression. Cell Res. 2020;30:146–62. doi: 10.1038/s41422-019-0263-3. [DOI] [PMC free article] [PubMed] [Google Scholar]
- 25.Rao SS, Portbury SD, Lago L, McColl G, Finkelstein DI, Bush AI, et al. The iron chelator deferiprone improves the phenotype in a mouse model of tauopathy. J Alzheimers Dis. 2020;77:753–71. doi: 10.3233/JAD-200551. [DOI] [PubMed] [Google Scholar]
- 26.Li DJ, Tong J, Li YH, Meng HB, Ji QX, Zhang GY, et al. Melatonin safeguards against fatty liver by antagonizing TRAFs-mediated ASK1 deubiquitination and stabilization in a beta-arrestin-1 dependent manner. J Pineal Res. 2019;67:e12611. doi: 10.1111/jpi.12611. [DOI] [PubMed] [Google Scholar]
- 27.Li DJ, Liu J, Hua X, Fu H, Huang F, Fei YB, et al. Nicotinic acetylcholine receptor alpha7 subunit improves energy homeostasis and inhibits inflammation in nonalcoholic fatty liver disease. Metabolism. 2018;79:52–63. doi: 10.1016/j.metabol.2017.11.002. [DOI] [PubMed] [Google Scholar]
- 28.Tong J, Li D, Meng H, Sun D, Lan X, Ni M, et al. Targeting a novel inducible GPX4 alternative isoform to alleviate ferroptosis and treat metabolic-associated fatty liver disease. Acta Pharm Sin B. 2022;12:3650–66. [DOI] [PMC free article] [PubMed]
- 29.Chi C, Fu H, Li YH, Zhang GY, Zeng FY, Ji QX, et al. Exerkine fibronectin type-III domain-containing protein 5/irisin-enriched extracellular vesicles delay vascular ageing by increasing SIRT6 stability. Eur Heart J. 2022;ehac431. 10.1093/eurheartj/ehac431. [DOI] [PubMed]
- 30.Li DJ, Sun SJ, Fu JT, Ouyang SX, Zhao QJ, Su L, et al. NAD(+)-boosting therapy alleviates nonalcoholic fatty liver disease via stimulating a novel exerkine Fndc5/irisin. Theranostics. 2021;11:4381–402. doi: 10.7150/thno.53652. [DOI] [PMC free article] [PubMed] [Google Scholar]
- 31.Zilka O, Shah R, Li B, Friedmann Angeli JP, Griesser M, Conrad M, et al. On the mechanism of cytoprotection by Ferrostatin-1 and Liproxstatin-1 and the role of lipid peroxidation in ferroptotic cell death. ACS Cent Sci. 2017;3:232–43. doi: 10.1021/acscentsci.7b00028. [DOI] [PMC free article] [PubMed] [Google Scholar]
- 32.Ursini F, Maiorino M. Lipid peroxidation and ferroptosis: the role of GSH and GPx4. Free Radic Biol Med. 2020;152:175–85. doi: 10.1016/j.freeradbiomed.2020.02.027. [DOI] [PubMed] [Google Scholar]
- 33.Hadian K, Stockwell BR. SnapShot: ferroptosis. Cell. 2020;181:1188–e1. doi: 10.1016/j.cell.2020.04.039. [DOI] [PMC free article] [PubMed] [Google Scholar]
- 34.Wang J, Liu W, Li JC, Li M, Li B, Zhu R. Hepcidin downregulation correlates with disease aggressiveness and immune infiltration in liver cancers. Front Oncol. 2021;11:714756. doi: 10.3389/fonc.2021.714756. [DOI] [PMC free article] [PubMed] [Google Scholar]
- 35.Jeong SH, Kim HB, Kim MC, Lee JM, Lee JH, Kim JH, et al. Hippo-mediated suppression of IRS2/AKT signaling prevents hepatic steatosis and liver cancer. J Clin Invest. 2018;128:1010–25. doi: 10.1172/JCI95802. [DOI] [PMC free article] [PubMed] [Google Scholar]
- 36.Luna-Vargas MPA, Chipuk JE. Physiological and pharmacological control of BAK, BAX, and Beyond. Trends Cell Biol. 2016;26:906–17. doi: 10.1016/j.tcb.2016.07.002. [DOI] [PMC free article] [PubMed] [Google Scholar]
- 37.Murphy JM, Czabotar PE, Hildebrand JM, Lucet IS, Zhang JG, Alvarez-Diaz S, et al. The pseudokinase MLKL mediates necroptosis via a molecular switch mechanism. Immunity. 2013;39:443–53. doi: 10.1016/j.immuni.2013.06.018. [DOI] [PubMed] [Google Scholar]
- 38.Shi J, Zhao Y, Wang K, Shi X, Wang Y, Huang H, et al. Cleavage of GSDMD by inflammatory caspases determines pyroptotic cell death. Nature. 2015;526:660–5. doi: 10.1038/nature15514. [DOI] [PubMed] [Google Scholar]
- 39.Xu B, Jiang M, Chu Y, Wang W, Chen D, Li X, et al. Gasdermin D plays a key role as a pyroptosis executor of non-alcoholic steatohepatitis in humans and mice. J Hepatol. 2018;68:773–82. doi: 10.1016/j.jhep.2017.11.040. [DOI] [PubMed] [Google Scholar]
- 40.Samir P, Malireddi RKS, Kanneganti TD. The PANoptosome: a deadly protein complex driving pyroptosis, apoptosis, and necroptosis (PANoptosis) Front Cell Infect Microbiol. 2020;10:238. doi: 10.3389/fcimb.2020.00238. [DOI] [PMC free article] [PubMed] [Google Scholar]
- 41.Fritsch M, Gunther SD, Schwarzer R, Albert MC, Schorn F, Werthenbach JP, et al. Caspase-8 is the molecular switch for apoptosis, necroptosis and pyroptosis. Nature. 2019;575:683–7. doi: 10.1038/s41586-019-1770-6. [DOI] [PubMed] [Google Scholar]
- 42.Zheng M, Karki R, Vogel P, Kanneganti TD. Caspase-6 is a key regulator of innate immunity, inflammasome activation, and host defense. Cell. 2020;181:674–87. doi: 10.1016/j.cell.2020.03.040. [DOI] [PMC free article] [PubMed] [Google Scholar]
- 43.Li X, Zhang M, Huang X, Liang W, Li G, Lu X, et al. Ubiquitination of RIPK1 regulates its activation mediated by TNFR1 and TLRs signaling in distinct manners. Nat Commun. 2020;11:6364. doi: 10.1038/s41467-020-19935-y. [DOI] [PMC free article] [PubMed] [Google Scholar]
- 44.Jiang X, Stockwell BR, Conrad M. Ferroptosis: mechanisms, biology and role in disease. Nat Rev Mol Cell Biol. 2021;22:266–82. doi: 10.1038/s41580-020-00324-8. [DOI] [PMC free article] [PubMed] [Google Scholar]
- 45.Zilka O, Poon JF, Pratt DA. Radical-trapping antioxidant activity of copper and nickel bis(thiosemicarbazone) complexes underlies their potency as inhibitors of ferroptotic cell death. J Am Chem Soc. 2021;143:19043–57. doi: 10.1021/jacs.1c08254. [DOI] [PubMed] [Google Scholar]
- 46.Shah R, Margison K, Pratt DA. The potency of diarylamine radical-trapping antioxidants as inhibitors of ferroptosis underscores the role of autoxidation in the mechanism of cell death. ACS Chem Biol. 2017;12:2538–45. doi: 10.1021/acschembio.7b00730. [DOI] [PubMed] [Google Scholar]
- 47.Krainz T, Gaschler MM, Lim C, Sacher JR, Stockwell BR, Wipf P. A mitochondrial-targeted nitroxide is a potent inhibitor of ferroptosis. ACS Cent Sci. 2016;2:653–9. doi: 10.1021/acscentsci.6b00199. [DOI] [PMC free article] [PubMed] [Google Scholar]
- 48.Tonnus W, Meyer C, Steinebach C, Belavgeni A, von Massenhausen A, Gonzalez NZ, et al. Dysfunction of the key ferroptosis-surveilling systems hypersensitizes mice to tubular necrosis during acute kidney injury. Nat Commun. 2021;12:4402. doi: 10.1038/s41467-021-24712-6. [DOI] [PMC free article] [PubMed] [Google Scholar]
- 49.Tarangelo A, Magtanong L, Bieging-Rolett KT, Li Y, Ye J, Attardi LD, et al. p53 suppresses metabolic stress-induced ferroptosis in cancer cells. Cell Rep. 2018;22:569–75. doi: 10.1016/j.celrep.2017.12.077. [DOI] [PMC free article] [PubMed] [Google Scholar]
- 50.Xue H, Chen D, Zhong YK, Zhou ZD, Fang SX, Li MY, et al. Deferoxamine ameliorates hepatosteatosis via several mechanisms in ob/ob mice. Ann N Y Acad Sci. 2016;1375:52–65. doi: 10.1111/nyas.13174. [DOI] [PubMed] [Google Scholar]
- 51.Anderson N, Borlak J. Molecular mechanisms and therapeutic targets in steatosis and steatohepatitis. Pharmacol Rev. 2008;60:311–57. doi: 10.1124/pr.108.00001. [DOI] [PubMed] [Google Scholar]
- 52.Fontana L, Zhao E, Amir M, Dong H, Tanaka K, Czaja MJ. Aging promotes the development of diet-induced murine steatohepatitis but not steatosis. Hepatology. 2013;57:995–1004. doi: 10.1002/hep.26099. [DOI] [PMC free article] [PubMed] [Google Scholar]
- 53.Jadhav S, Protchenko O, Li F, Baratz E, Shakoury-Elizeh M, Maschek A, et al. Mitochondrial dysfunction in mouse livers depleted of iron chaperone PCBP1. Free Radic Biol Med. 2021;175:18–27. doi: 10.1016/j.freeradbiomed.2021.08.232. [DOI] [PMC free article] [PubMed] [Google Scholar]
- 54.Zhu Z, Zhang Y, Huang X, Can L, Zhao X, Wang Y, et al. Thymosin beta 4 alleviates non-alcoholic fatty liver by inhibiting ferroptosis via up-regulation of GPX4. Eur J Pharmacol. 2021;908:174351. doi: 10.1016/j.ejphar.2021.174351. [DOI] [PubMed] [Google Scholar]
- 55.Wang X, Ma B, Wen X, You H, Sheng C, Bu L, et al. Bone morphogenetic protein 4 alleviates nonalcoholic steatohepatitis by inhibiting hepatic ferroptosis. Cell Death Discov. 2022;8:234. doi: 10.1038/s41420-022-01011-7. [DOI] [PMC free article] [PubMed] [Google Scholar]
Associated Data
This section collects any data citations, data availability statements, or supplementary materials included in this article.


