Noncardiac arterial vascular disease is a significant contributor to morbidity and mortality. Conditions such as cerebral ischemia, renal vascular hypertension, peripheral vascular disease, aortic dissection, and pulmonary embolism require prompt and accurate diagnosis necessitating precise anatomic vascular characterization. Historically, contrast angiography has been the principal method of evaluation of arterial disease, although over the last 15 years there has been a rapid proliferation of less invasive techniques that can be applied to screening patients who are at risk.
Duplex sonography has been shown to be quite effective in the diagnosis of peripheral vascular disease affecting the extremities and the cervical carotid arteries. Its role as a comprehensive vascular screening tool is limited because of its inability to display the entire vascular system (e.g., it cannot display the thoracic, intracranial, and crural vessels).
The evolution of computed tomography from a device that required over 2 minutes to create a single poor-resolution image slice to one in which multiple slices can be obtained in less than 1 second and images displayed in a variety of presentations (multiplanar and 3-D) has propelled that technique into the forefront in the diagnosis of arterial vascular disease.
Similarly, magnetic resonance imaging has become a powerful noninvasive tool to define occlusive and dilating conditions that affect the vasculature. Stronger, faster magnetic gradients, creative radiofrequency pulsing maneuvers, and faster computing techniques have contributed to this success.
The intent of this article is to update the reader on the current status of magnetic resonance and computed tomographic techniques in the evaluation of a variety of vascular disorders and to provide clinical examples from our institution.
Magnetic Resonance Angiography
Magnetic resonance (MR) techniques developed to define vascular anatomy in magnetic resonance angiography (MRA) can be broadly divided into 2 categories depending on the appearance of flowing blood: black blood (Fig. 1) and bright blood (Fig. 2).
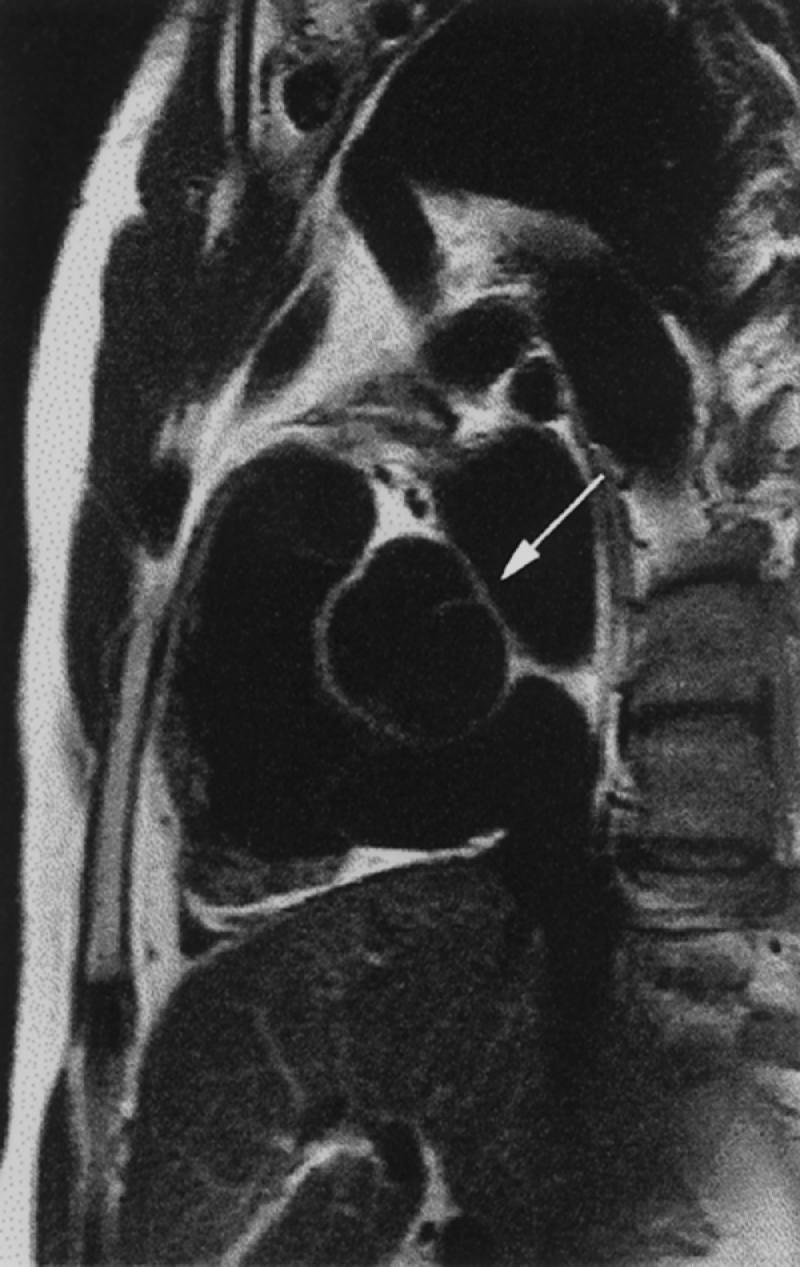
Fig. 1 Black blood magnetic resonance image. Sagittal spin-echo view of the heart, including a bicuspid aortic valve (arrow), with the pulmonary outflow tract noted ventrally.
(Courtesy of Scott D. Flamm, MD)
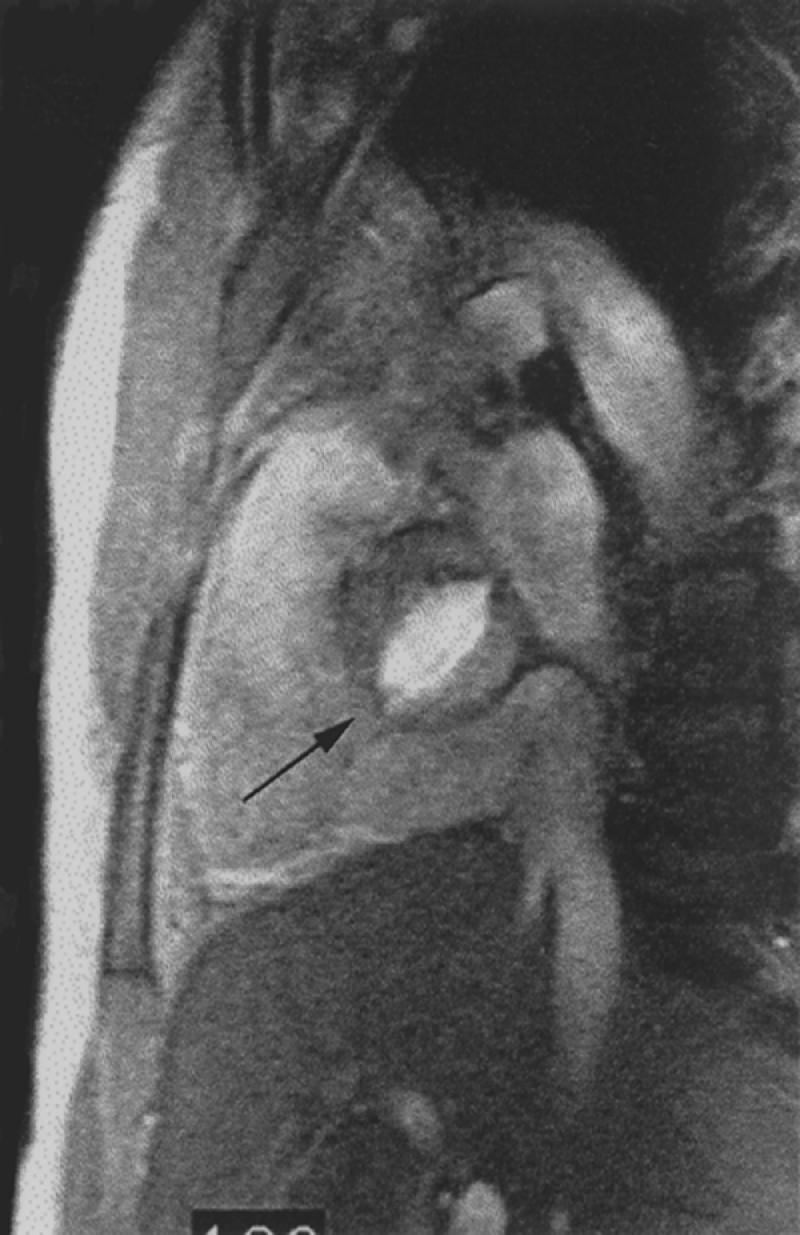
Fig. 2 Bright blood magnetic resonance image. Oblique sagittal gradient-echo image through the level of the aortic valve depicts flowing blood as bright signal. Note typical fish-mouth appearance of a bicuspid aortic valve (arrow).
(Courtesy of Scott D. Flamm, MD)
Flowing blood appears dark on black blood studies. Types of imaging that produce black blood display include spin echo (SE), half-Fourier rapid acquisition with relaxation enhancement (RARE), inversion recovery (IR), and other T1 weighted fast gradient-echo techniques. 1,2 The primary advantage of this display is visualization of the vascular wall.
Bright blood studies include the various gradient-recalled varieties: time of flight (TOF), phase contrast (PC), contrast-enhanced (CE), and cine magnetic resonance angiography. This format is the primary method currently used for MRA display.
Time of flight MRA produces images from flow-related enhancement, as fresh proton spins (non-saturated) of flowing blood enter the imaging slice (2 dimensional) or slab (3 dimensional).
Phase contrast MRA produces images from a different method. Blood flowing across the gradient of a magnetic field will accumulate phase or change in precession rate. Nonmoving tissue will not experience a phase change and can be subtracted, leaving an image which is encoded in both direction and velocity of flow. However, to provide display of blood in all 3 directions, 4 acquisitions are required, which results in long scan times. Phase contrast imaging, because of its inherent qualities, can be to used to determine the direction of flowing blood as well as to calculate its velocity (Fig. 3). This feature, which provides MR with an advantage unavailable with CT, enables accurate physiologic measurements to calculate blood flow, cardiac output, shunt quantification, and retrograde flow.
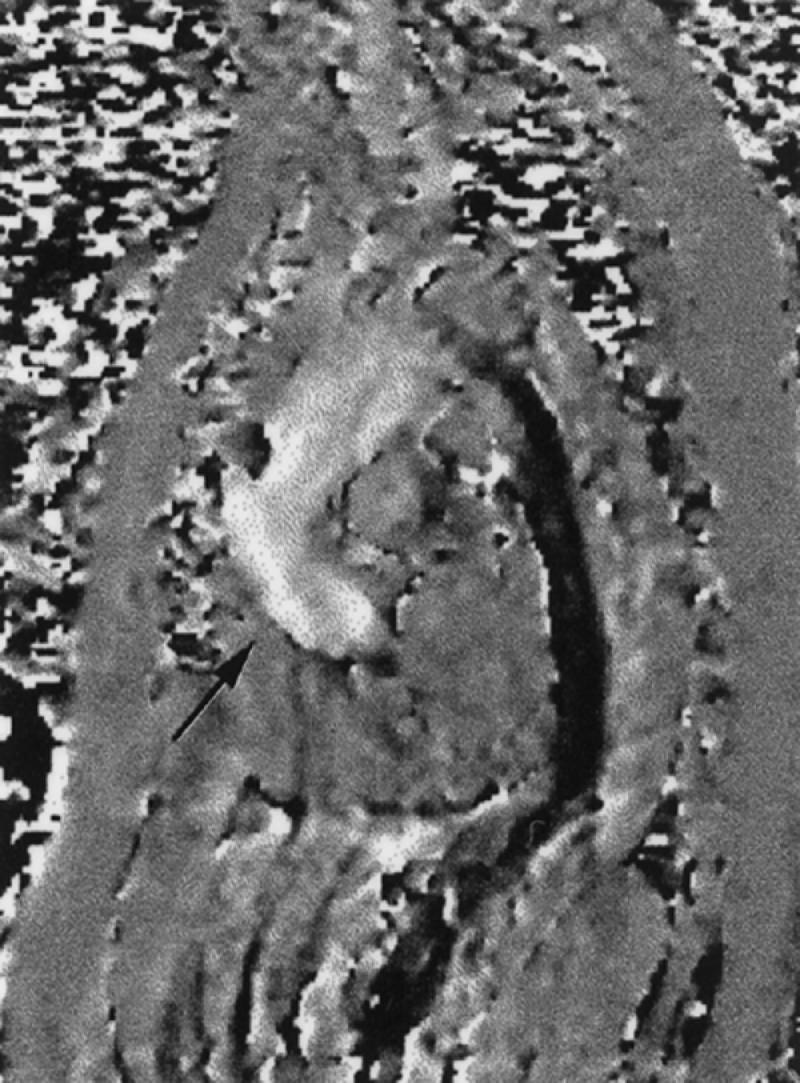
Fig. 3 Sagittal cine phase contrast image of the thoracic aorta. This single image is 1 of 18 images obtained at this same location during a cine phase contrast study. The blood flowing in a superior direction from the aortic valve in the ascending aorta is bright (arrow). Blood flow in the true lumen of a descending thoracic aortic dissection is depicted in black.
Both TOF and PC angiography suffer from signal loss as a result of saturation effects and complex flow (intravoxel dephasing), which can lead to an overestimation of stenoses. This disadvantage and the other disadvantage of long scan times can be offset by using techniques that combine a T1 shortening intravascular agent (gadolinium), which produces an increase in the signal of flowing blood, with a 3-D spoiled gradient-recalled sequence (contrast enhanced). 3,4 Large areas (>36 cm) can be studied during a single breath, providing contiguous high-resolution (1 mm) image production (Fig. 2). Further, gadolinium-based contrast agents are not nephrotoxic, which enables their use in patients with azotemia as well as in patients with iodine allergies. 5
Cine techniques provide snapshots of flowing blood at different phases of the cardiac cycle (usually 12 through 18) and, when displayed sequentially, project the appearance of active blood flow; in the case of the heart, they also display ventricular and atrial wall motion. This technique is useful in aortic dissections, wherein small intimal flaps and differential blood flow in the lumina are better demonstrated than with other techniques (Fig. 4). 6
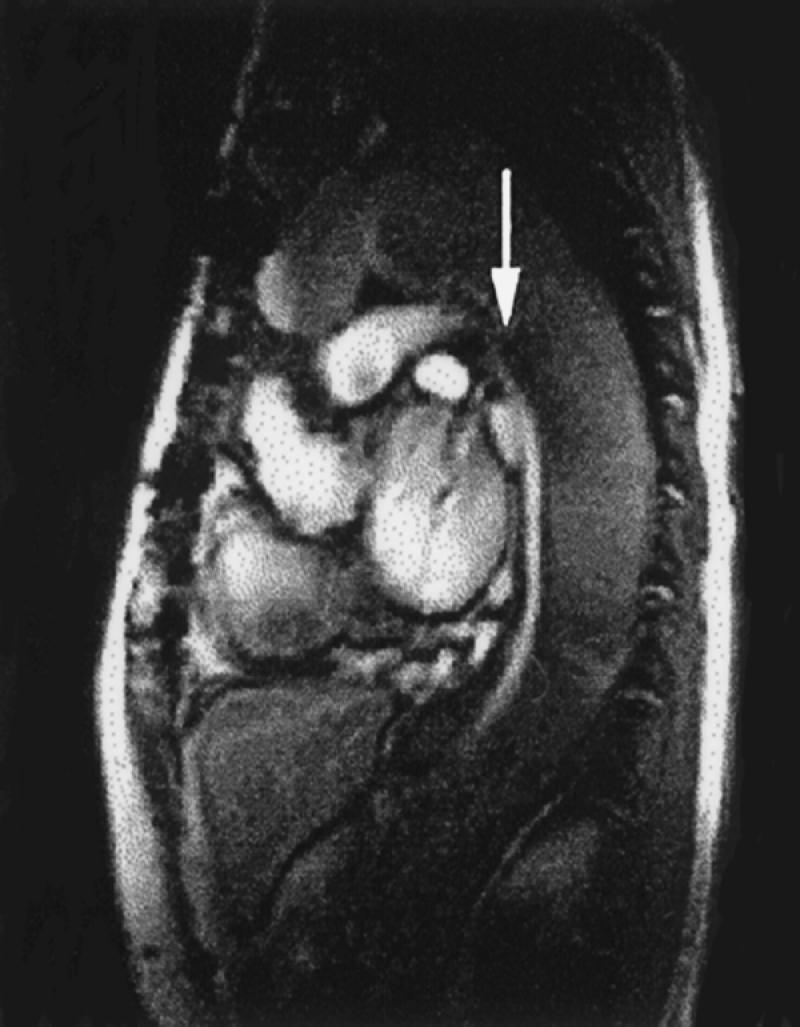
Fig. 4 Sagittal cine gradient-echo image of aortic dissection. Note bright signal in the cardiac chambers as well as in the fast-flowing true lumen in the descending thoracic aorta (arrow). There is relatively sluggish flow in the false lumen (L), characterized by a darker gray appearance.
Thoracic Aorta
Magnetic resonance imaging has become an important technique in the evaluation of patients with aortic disease. Its ability to provide multiplanar images and to acquire cine-type images makes MR a technique that offers comprehensive information, without use of an iodinated contrast agent. It can also depict the number of cusps and the competency of the aortic valve, which is important in thoracic aortic conditions such as coarctation and dissection.
Dissection. The value of MR in the diagnosis of aortic dissection has been proved. The sensitivity and specificity of SE and non-contrast-enhanced gradient-echo (GRE) protocols in published series ranges from 94% to 100%, 7–10 which is greater than that of contrast angiography and transesophageal echocardiography. Categorization of dissection into types A (ascending thoracic aortic involvement) and B (involvement beginning distal to the left subclavian artery) can be reliably displayed (Figs. 3 and 4), as can the extent and involvement of branch vessels. Even small intimal tears can be visualized, particularly when cine or contrast-enhanced techniques (or both) are used. 7–11 Associated pericardial effusion and aortic valvular insufficiency can also be identified.
Contrast-enhanced examination of the entire aorta can be performed over 1.5 to 4 minutes during quiet breathing with respiratory compensation 11,12 or, more recently, during a single breath-held examination, which is faster than other techniques and rapidly displays the aorta and major branch vessels (Fig. 5). Penetrating aortic ulcers, which may be associated, can also be demonstrated. 13
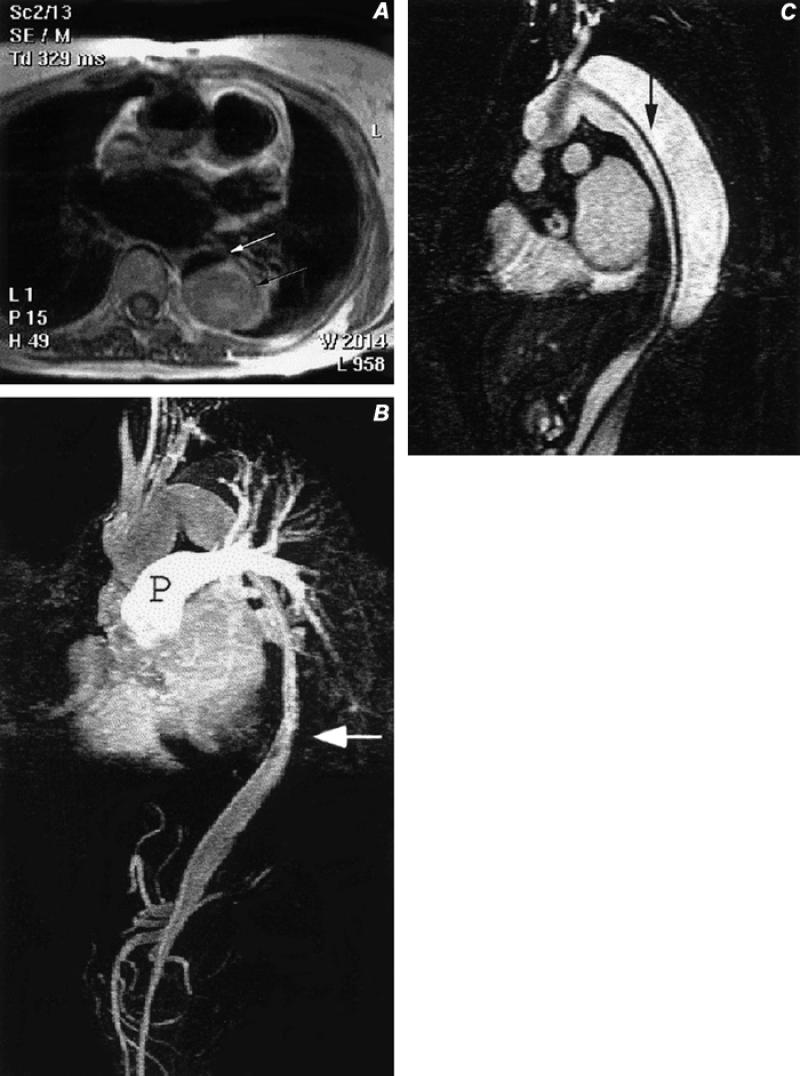
Fig. 5 Type A aortic dissection, after graft repair of the ascending aorta. A) Axial spin-echo image of the mid-thorax with bright signal (black arrow) in the false lumen of the descending thoracic aortic dissection, and with a small, dark, slit-like flow-void in the true lumen (white arrow). B) Sagittal, contrast-enhanced magnetic resonance image of the chest and upper abdomen, disclosing flow in the small ribbon-like true lumen (arrow) with residual contrast in the pulmonary artery (P). Also note opacification of the celiac and superior mesenteric arteries that arise from the true lumen. C) Sagittal image from a contrast-enhanced series of images obtained 15 seconds after image B, showing delayed opacification of the false lumen, which is separated from the true lumen by a dissection flap (arrow) that extends from the proximal aortic arch to below the diaphragm.
Disadvantages of MR include limitations in scanning certain populations (e.g., patients with pacemakers, surgical ear implants, or intracranial aneurysm clips, and patients who are claustrophobic or otherwise uncooperative). The inability to detect calcification is also a limiting factor, especially in patients with thrombosed false lumina. We currently reserve MR for patients with subacute or chronic disease or with renal insufficiency, and we perform computed tomographic angiography (CTA) in those with acute symptoms.
Aneurysm. Aneurysms of the thoracic aorta can be found in a number of locations and are easily seen with MR. 11,14 Sinus of Valsalva aneurysms are usually congenital and involve a single sinus (right). These lesions are best demonstrated with MR because of its multiplanar and cine capabilities. Associated conditions such as bicuspid aortic valve, ventricular septal defect, and coarctation, can also be defined.
Sinus of Valsava aneurysms of the acquired variety (Fig. 6) more commonly affect all 3 sinuses and are seen in patients with Marfan syndrome, osteogenesis imperfecta, Ehlers-Danlos syndrome, and homocysteinuria. Further, focal aneurysm formation can be a complication of aortic valvular surgery and bacterial endocarditis.
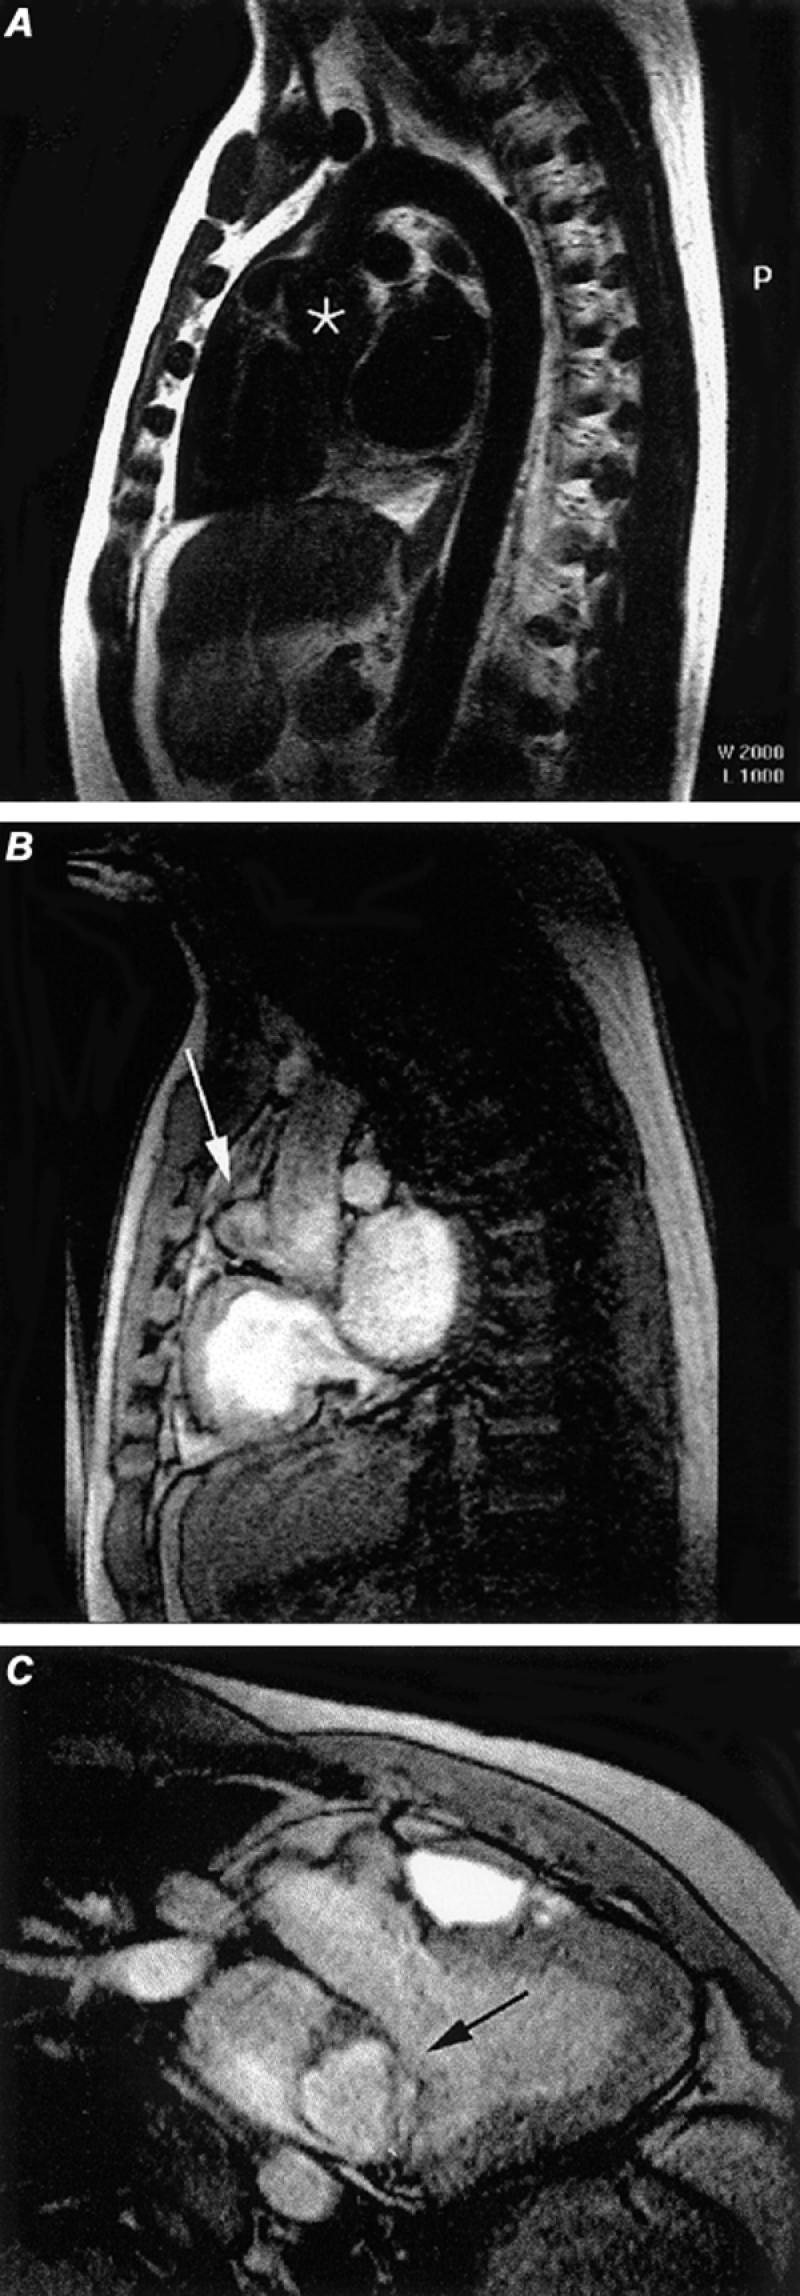
Fig. 6 Sinus of Valsalva aneurysm. A) Oblique spin-echo, black blood image discloses slight dilatation of the aortic root (asterisk). B) Cine gradient-echo sagittal image discloses a small aneurysm (arrow) arising along the anterior aspect of the aortic root. C) Oblique coronal cine gradient-echo image discloses the left ventricular outflow tract and the sinus of Valsalva aneurysm (arrow) arising from the aortic root.
(All images courtesy of Scott D. Flamm, MD)
Aneurysms of the ascending (non-sinus) aorta, aortic arch, and descending aorta are also well displayed with routine MR (Fig. 7).

Fig. 7 Aneurysm of the aortic arch. A) Sagittal spin-echo image discloses flowing blood (black blood technique) through the aneurysm (asterisk). B) Coronal spin-echo image through the aneurysm (asterisk). C) Gradient-echo sagittal oblique image through the aneurysm.
Traumatic aneurysms are less common. Approximately 20% affect the ascending aorta. Our preference for evaluation of acute trauma remains contrast angiography (CA), although CT shows considerable promise. Magnetic resonance has a lesser role in the evaluation for suspected aortic injuries.
There is some debate in the literature about the upper-normal limits of aortic size. At our institution, we use the following criteria for the upper limits of normal: sinus of Valsalva, 4.0 to 5.0 cm; tubular portion, 4.0 cm; and the descending aorta, 3.5 cm.
Coarctation. Coarctation accounts for about 5% of patients with congenital heart disease. In this condition, the aorta is congenitally narrowed by fibromuscular tissue, a process that affects primarily the media. The area affected is usually focal and located just distal to the aortic arch, near the ductus; but there is a spectrum of severity that ranges to complete interruption of the aortic arch. Occasionally, coarctation can be longer and affect much of the aortic arch. The degree of coarctation can be quantified with black blood or bright blood techniques (Fig. 8). Phase contrast studies can provide flow quantification.
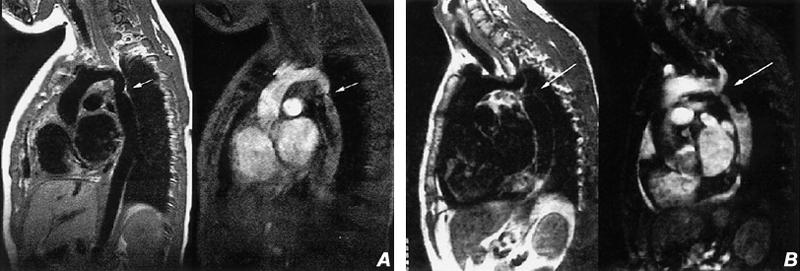
Fig. 8 Coarctation of the aorta. A) Sagittal spin-echo (left) and cine gradient-echo (right) images of a characteristic aortic coarctation with narrowing of the aorta (arrow) just distal to the left subclavian artery. B) Sagittal spin-echo (left) and cine gradient-echo (right) images obtained just slightly to the left of image A, disclosing the high-grade stenosis (arrow) just distal of the origin of the left subclavian artery. (All images courtesy of Scott D. Flamm, MD)
Magnetic resonance angiography can also display pseudocoarctation of the thoracic aorta, a condition seen in adults that is characterized by an elongated, buckled aortic arch. In these cases, there is no significant pressure gradient across the buckling stenosis (Fig. 9).
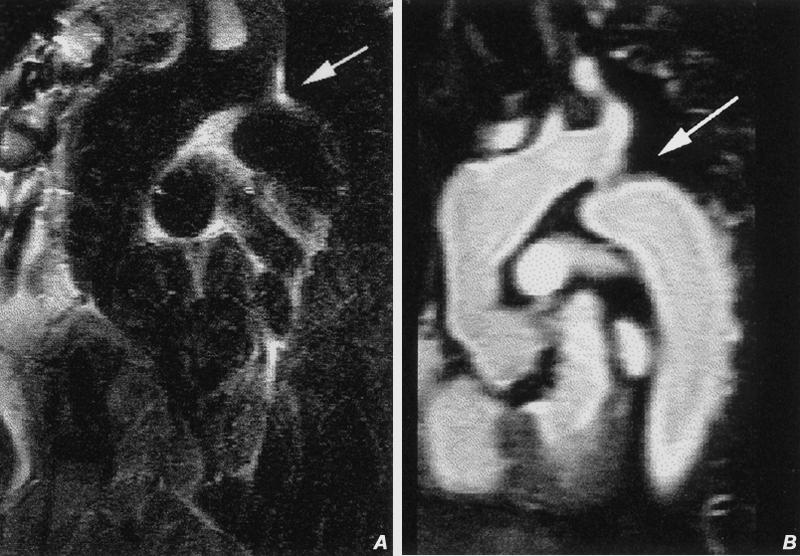
Fig. 9 Pseudo-coarctation of the thoracic aorta. A) Oblique sagittal spin-echo image of the thoracic aorta discloses mild ectasia of the distal ascending aorta and apparent narrowing just distal to the origin of the left subclavian artery (arrow). B) Contrast-enhanced oblique sagittal magnetic resonance image discloses apparent narrowing related to buckling (arrow) of the proximal descending ascending aorta.
Oblique sagittal images are the most useful and easily understood projections. Dephasing effects from the jet effect seen with cine gradient echo can be generally offset with the use of 3-D contrast enhancement. Aortic valve cine studies can also demonstrate an associated bicuspid aortic valve, which is found in up to 80% of patients (Figs. 1 and 2).
Other Conditions. Stenosing lesions of the aorta, such as Takayasu's arteritis, 14,15 and dilating lesions, such as temporal arteritis, relapsing polychondritis, and Behcet's syndrome, can also be shown. Magnetic resonance can be used to follow the activity of the disease. Edema of the wall seen in active inflammation is well shown on T2 weighted spin-echo images. 15
Pulmonary Emboli
Pulmonary emboli are a significant problem: it is estimated that over 600,000 cases occur each year in the United States. 16 Historically, pulmonary angiography has been the gold standard for diagnosis, but this technique is under-used because of its invasiveness, its cost, and various other factors. Ventilation/perfusion lung scanning has also been used as a screening procedure, but in the PIOPED study (Prospective Investigation of Pulmonary Embolism Diagnosis) only 27% of patients had definite diagnoses established through non-indeterminate scans. 17
Early attempts at MR evaluation have shown promise but medium-to-small emboli and adjacent pulmonary densities remain problematic. Spin-echo imaging can display moderate and large pulmonary emboli (Fig. 10). Recently, 3-D SPGR (spoiled gradient-recalled) breath-hold contrast-enhanced studies have proved more useful in diagnosing acute and chronic pulmonary embolism. 18–21 In a prospective study of 30 patients with suspected pulmonary embolism who underwent examination with contrast-enhanced MRA and conventional angiography, MRA had sensitivities of 100%, 87%, and 75% and specificities of 95%, 100%, and 95% for main, lobar, and segmental pulmonary emboli, respectively. 18 However, as with other MRA contrast techniques, the patient must be cooperative and able to breath-hold for 20 seconds to enable high-resolution imaging. Therefore, we limit the use of MRA to cooperative patients who, because of allergy or azotemia, cannot receive iodine contrast solution. Our current preference is computed tomography or contrast angiography.
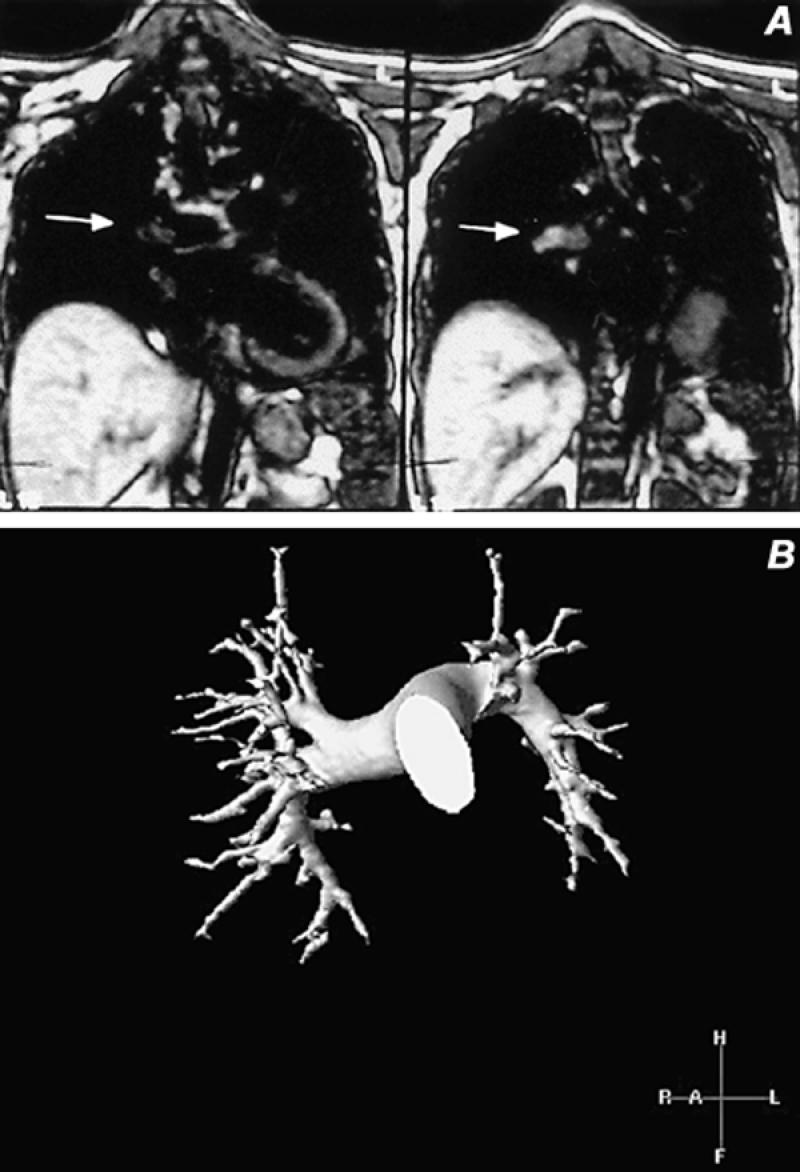
Fig. 10 Pulmonary artery magnetic resonance images. A) Coronal spin-echo image demonstrates an area of increased signal in an embolus within the right pulmonary artery extending into the intralobar artery (arrow) B) Volume-rendered contrast-enhanced study in a normal pulmonary arterial system. This 3-D technique enables rotation about all 3 axes in space to provide comprehensive evaluation of the entire pulmonary arterial system.
Abdominal Aorta and Its Branches
Aneurysm. Abdominal aortic aneurysms (AAA) are common. Precise anatomic display (of size and length of neck, number and integrity of renal arteries, overall length of aneurysm, and sizes of iliac arteries) is crucial in selecting patients for non-operative (endovascular) stent placement. Computed tomography has become the mainstay in pre- and post-stent graft evaluation, although MR is also a useful technique, especially in azotemic patients.
Initial reports indicate MR's accuracy, using black blood techniques, in depicting aneurysms, although information about branch vessels is not detailed (Fig. 11). In subsequent studies using black blood and TOF protocols, Kandarpa, 22 Dunham, 23 and Kaufman 24 indicated that the aneurysm's neck and length were well seen and the main renal and mesenteric vessels could be determined to be patent; however, the accessory renal arteries were not reliably imaged (sensitivity 24% to 67%). Prince 25 1st used contrast-enhanced studies, which increased the detection of accessory arteries to over 90%. 3,4,26 Subsequent articles have confirmed the high sensitivity of contrast-enhanced MR. Magnetic resonance angiography offers comprehensive preoperative evaluation of AAA that compares favorably with that of catheter angiography (Fig. 12). 11,22–29
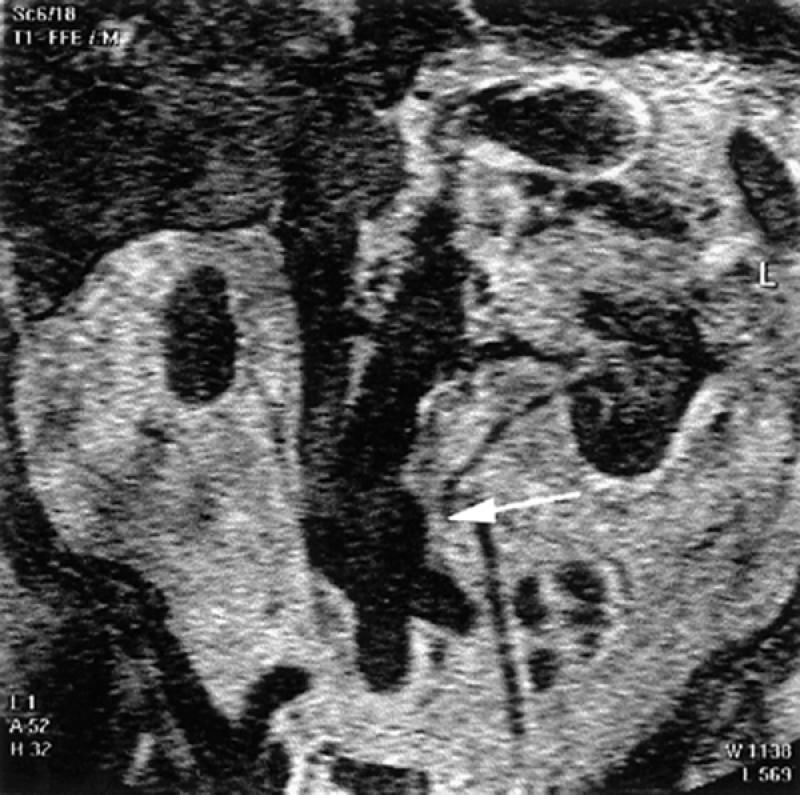
Fig. 11 Spin-echo, coronal magnetic resonance image displays a distal abdominal aortic aneurysm (arrow). The renal arteries are also seen, in part.
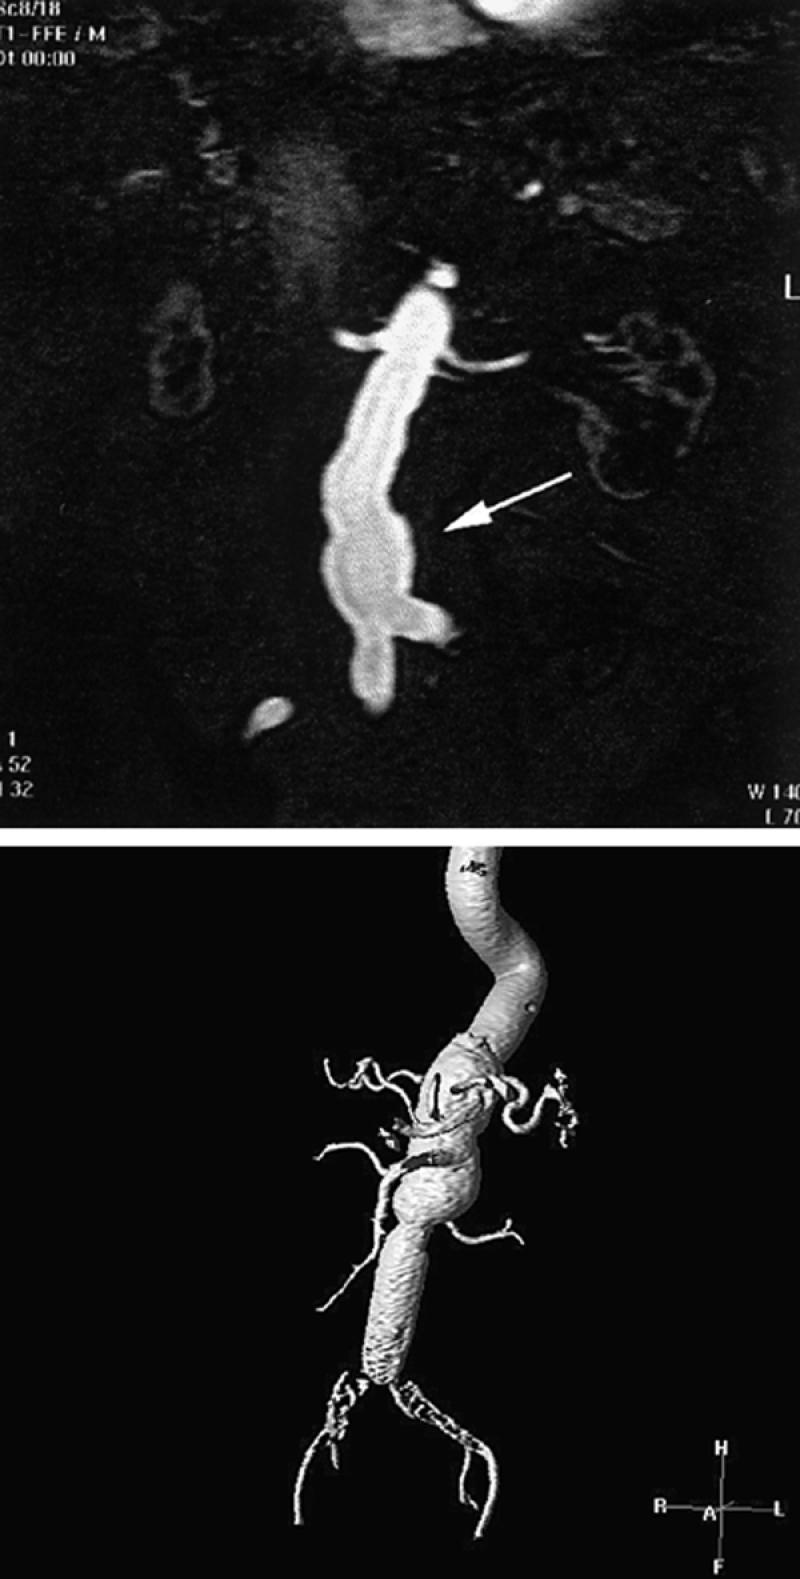
Fig. 12 Contrast-enhanced magnetic resonance angiogram of abdominal aortic aneurysms. A) Single 2-mm-thick coronal image discloses the proximal portions of the single renal arteries as well as opacification of a portion of the distal abdominal aortic aneurysm. Thirty to 40 of these contiguous images can be stacked together and displayed in a variety of 3-D views. These single images (source images) provide useful information on the status of branch vessels. B) Contrast-enhanced 3-D display (using volume rendering) of an abdominal aortic aneurysm in another patient. Typically, these images are rotated around the x, y, and z axes every 10 degrees, for comprehensive display of branch vessels. Note that large areas can be examined.
Magnetic resonance evaluation of patients who have undergone prior surgical or endovascular aneurysm repair has been tried but suffers from varying amounts of image degradation in accordance with the number of surgical clips that are present or the type of metal that is used in the stent-graft. Grafts supported by stainless steel produce severe artifacts, which renders them incapable of successful visualization, but nitinol-based stent grafts can be imaged without difficulty. 30–32 Our preference for post-stent graft evaluation is contrast-enhanced CT, because it is the proven standard for detection of endoleaks, but MRA can be applied to patients who are azotemic and have nitinol-based grafts.
Mesenteric Vessels. Chronic symptomatic mesenteric ischemia is related to significant in-flow reduction that usually involves at least 2 of the 3 major arteries. 33,34 Acute symptomatic ischemia may affect only 1 artery, or even a branch.
Contrast angiography remains the primary technique for assessing patients with acute ischemia because of its reliable ability to display main and branch occlusive disease. Also, CA may serve as a starting point for endovascular treatment, such as angioplasty or thrombolysis. However, for chronic mesenteric ischemia, MRA and CTA have been shown to have accuracies approaching that of CA.
Magnetic resonance angiography techniques using contrast enhancement are superior to TOF and even phase-contrast studies (100% sensitivity and 95% specificity versus 80% sensitivity and 66% specificity, respectively) (Figs. 13 and 14). 35–38 Unfortunately, CE MR techniques have limitations in evaluating the inferior mesenteric artery: in 1 study, 36 only 9 of 14 mesenteric vessels were demonstrated. Current CTA studies provide a higher degree of confidence of patency of the inferior mesenteric artery than does MRA, but they too are limited in spatial resolution, which makes precise stenosis-grading difficult.
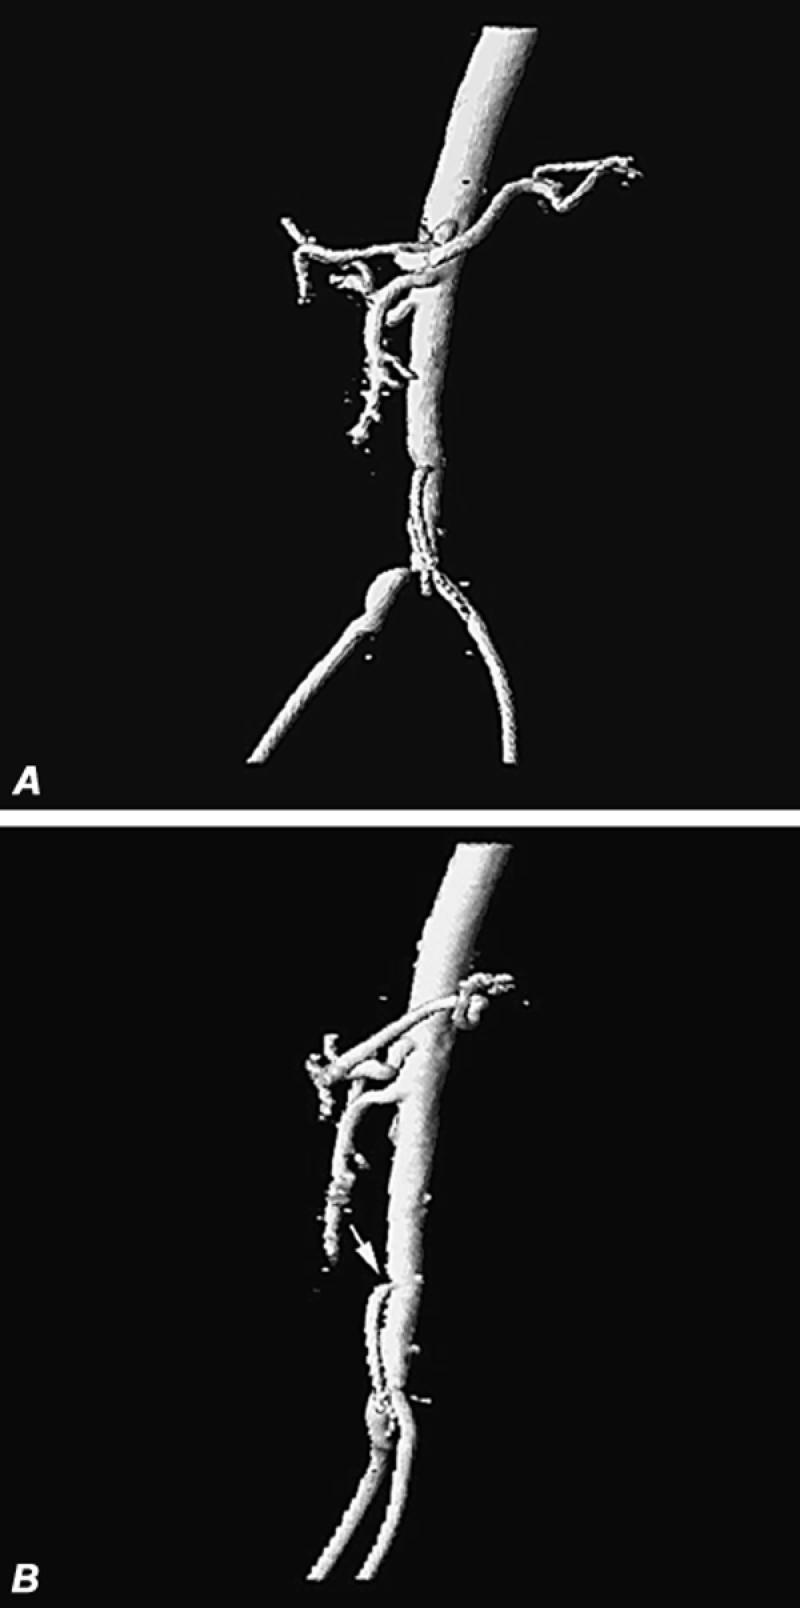
Fig. 13 Contrast magnetic resonance angiography of patient with suspected mesenteric ischemia and with claudication, iodine allergy, and renal failure. A) Oblique volume-rendered 3-D display of aorta and proximal iliac vessels discloses patency of the superior mesenteric artery, poor visualization of the inferior mesenteric artery, moderate stenosis of the distal abdominal aorta, and high-grade stenosis of the origin of the right common iliac artery. B) Lateral volume-rendered display of same patient discloses patency of the celiac and superior mesenteric arteries and moderately severe stenosis of the origin of the inferior mesenteric artery (arrow).
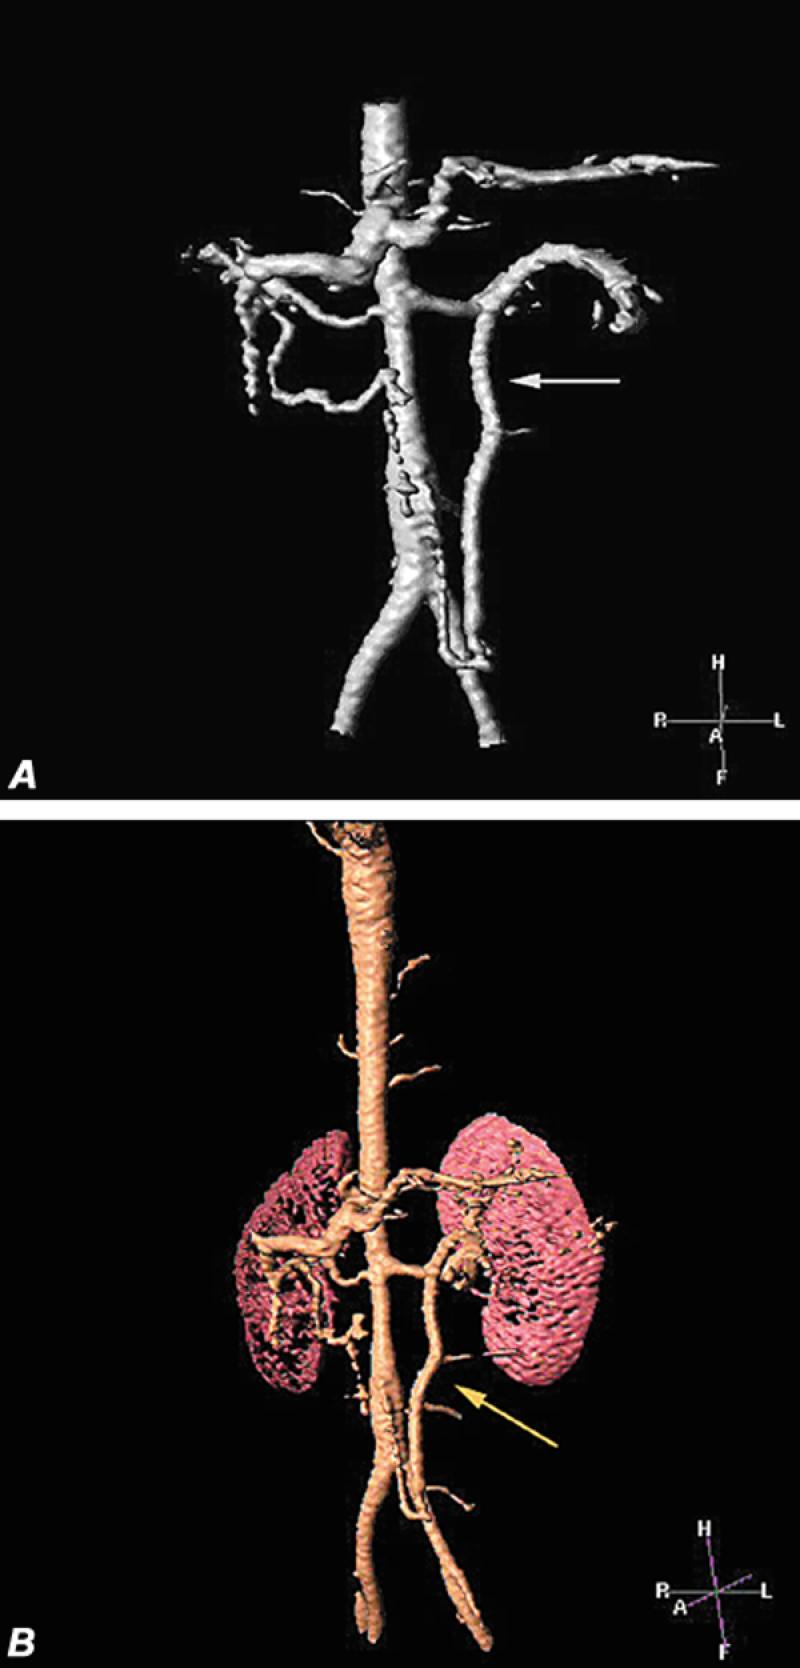
Fig. 14 Superior mesenteric artery occlusion in patient with Takayasu's arteritis. A and B) Volume-rendered images disclose stenosis of the mid-aortic segment, patency of the celiac and single renal arteries, and an enlarged inferior mesenteric artery (arrow) supplying the transverse colon and the superior mesenteric circulation.
Iliofemoral Vessels. The 1st descriptions of MR angiography in the evaluation of peripheral occlusive disease were reported in 1992 and 1993. 39–41 The initial techniques used 2-D time of flight protocols with the body coil. These reports required at least 1 hour of scanning, from the abdominal aorta to the feet; sensitivity for the detection of significant stenosis or occlusion ranged from 43% to 100%, and specificity ranged from 47% to 100%, with an average of 85% to 90%. 29 An improvement in image quality occurred when dedicated extremity or head receiving coils were used, at the expense of even longer scan times. 42,43 As in other vessels, TOF MRA tended to overestimate the degree of stenosis as a consequence of intravoxel dephasing, saturation (caused by slow-flow or inplane effects), or artifacts (caused by adjacent ferromagnetic clips). Other problems were the length of the scan time required and the fact that vessels flowing in a retrograde fashion were not seen, secondary to saturation band effects. 42–44
Recently, 3-D contrast enhancement has been applied to evaluation of the peripheral circulation, and several techniques have been described. 45–50 The most common method involves the subtraction of an initial non-contrast 3-D coronal image set from subsequent image sets performed following intravenous gadolinium injections (Figs. 13 and 15). This process is repeated at several locations, until both lower extremities have been examined in their entirety. Typically, 3 injections are made to evaluate the arterial system from the lower aorta to the feet. Newer, bolus-chase techniques enable the use of a single longer injection, with the aid of automated or semi-automated table movement. 28,48,49 Our experience with 1 of the automated commercially available systems (Philips-Mobitrack; Best, Netherlands) has been positive in the 1st 25 patients we have studied (Fig. 16). This technique yields good visualization of the vascular system from the aorta to the feet in less than 2 minutes. However, there are some limitations. For example, the relatively slow rate of contrast infusion (0.3 to 0.6 mL/sec) does not provide sufficiently high signal-to-noise ratios to reliably image the renal arteries (as a dedicated renal MRA study would do). Further, in patients with relatively fast arterial flow, there is some venous overlap below the knees. Several possible solutions to these shortfalls include additional gadolinium-contrast injection or supplementation with 2-D or 3-D TOF images. 47 Published studies comparing contrast-enhanced MRA with digital subtraction angiography have revealed sensitivities and specificities of at least 90% for CE MRA. 28,45–50,51
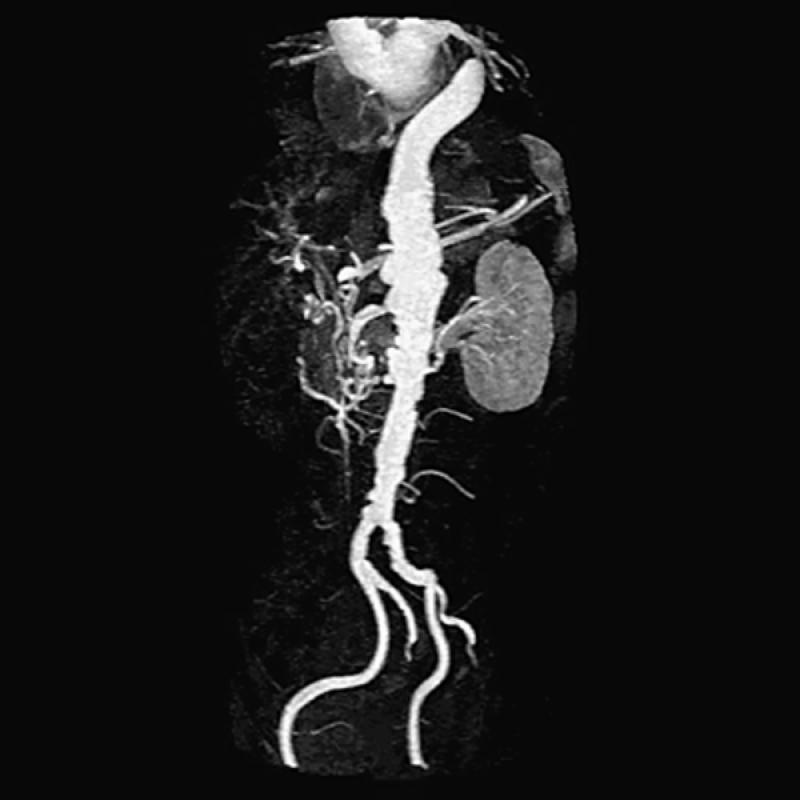
Fig. 15 Three-dimensional contrast-enhanced oblique image (maximum intensity projection) of 1st of 3 separate image set acquisitions (1 of the abdominal aorta and subsequent images obtained in the thighs and calves). Note poor delineation of the renal arteries and an ectasia of the aorta above the level of the kidneys. This is an oblique 3-D projection, which displays the tortuous but patent iliac vessels quite well.
Note: Contrast-enhanced images display only the patent lumen. In patients with abdominal aortic aneurysm, spin-echo images must also be obtained to delineate the outer limits of the aneurysmal wall.

Fig. 16 Automated digital subtraction contrast-enhanced magnetic resonance run-off angiograms. A, B, and C) Note complete occlusion of the right superficial femoral artery (arrow) with moderate (50% to 60%) stenosis in the left superficial femoral artery. Also notice venous opacification of the lower deep-calf veins in the lowest image set (C). These are maximum intensity projection (MIP) displays.
Renal Arteries. There are a number of noninvasive methods for evaluating the renal arteries. Published results of traditional techniques, such as Doppler ultrasonography and renal scans, have varied considerably. A number of MR methods have been used with relatively good success. Johnson 29 reviewed 15 studies that used a variety of MRA techniques in the detection of significant renal arterial disease. In this collective group of 148 patients, 2-D TOF yielded a sensitivity of 80% (range, 70% to 100%) and a specificity of 80% (range, 78% to 98%). In 163 patients (whose results are also summarized in Johnson's review), 29 phase contrast studies—including 2-D, 3-D and cine—averaged 91% (80% to 100%) sensitivity and 93% (91% to 96%) specificity for significant renal artery stenosis. Several other studies summarized by Johnson comprised a total of 301 patients who underwent 3-D CE breath-hold exams (Fig. 17); these had an average sensitivity of 95% (88% to 100%) and specificity of 94% (88% to 100%).
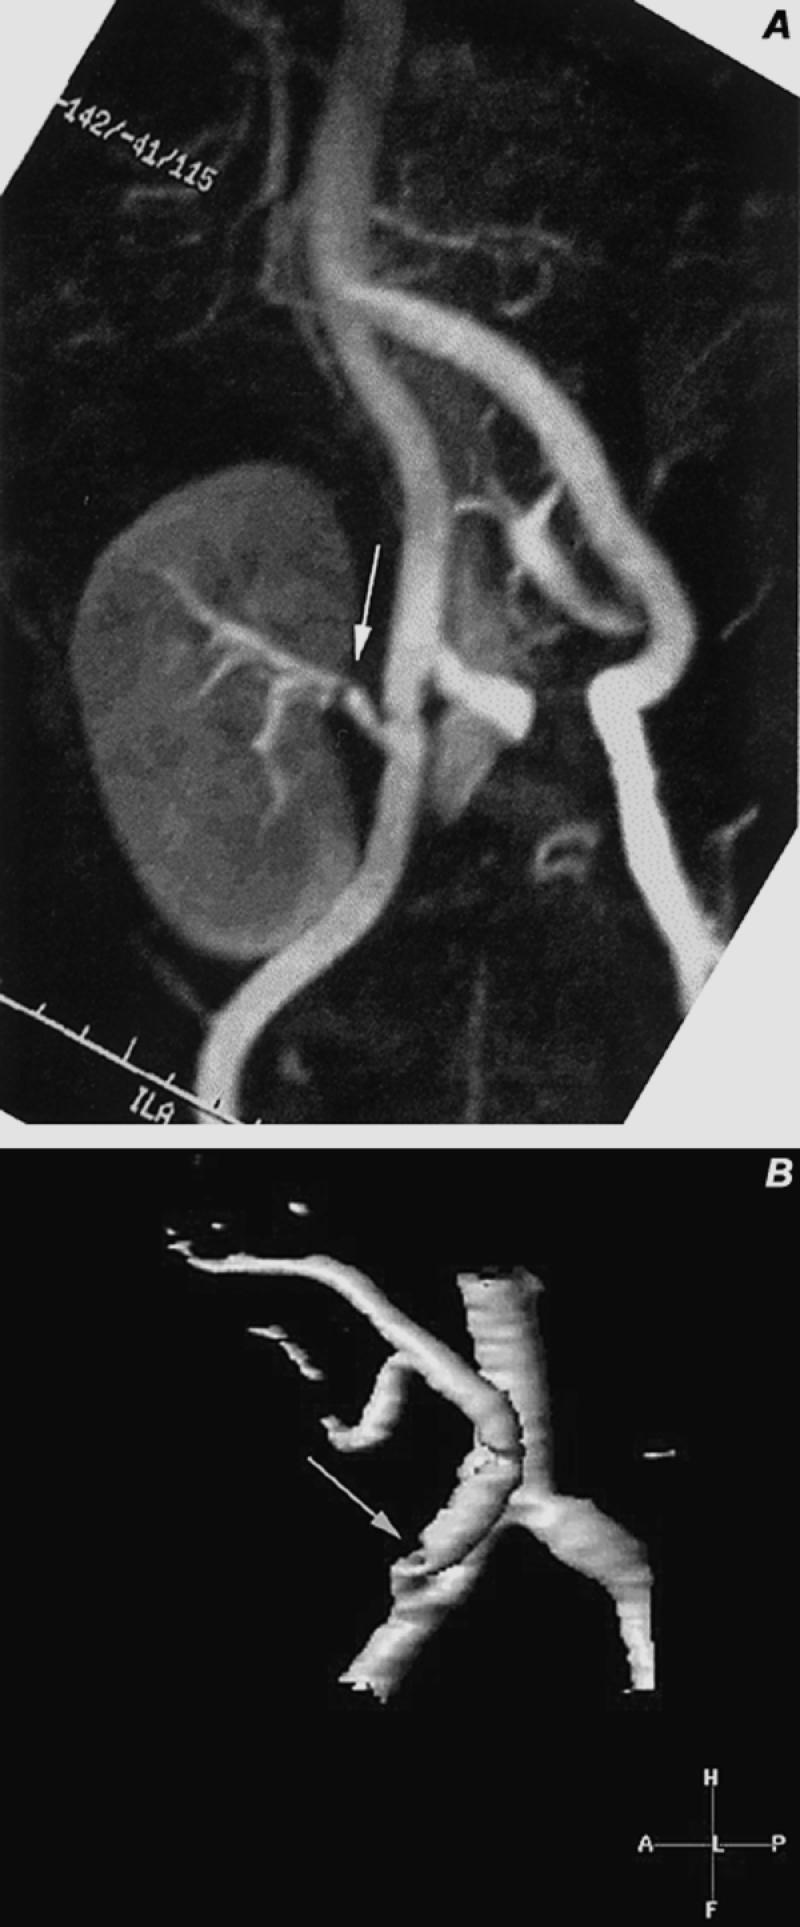
Fig. 17 Contrast-enhanced magnetic resonance angiography of renal transplant stenoses. A) Maximum intensity projection (MIP) image of right iliac fossa shows a transplanted kidney with a moderately severe stenosis in the mid-renal artery (arrow). B) Volume-rendered display of another patient shows a high-grade stenosis of the origin of the transplanted renal artery (arrow) as it arises from the right external iliac artery. Portions of the right common and internal iliac arteries are also seen.
Gilfeather 52 compared conventional digital subtraction angiography with 3-D CE MRA and found similar variability between observers, in the assessment of renal stenoses (6.9% at MRA vs 7.4% at conventional angiography). Magnetic resonance angiography, however, overestimated the degree of narrowing by at least 10% in 21% of all cases and underestimated it by more than 10% in 14% of all cases.
Although MRA is useful in the evaluation of renal artery stenosis, its ability to define accessory arteries is limited. In a study of 25 patients that compared 3-D CE MRA with angiography in the evaluation of prospective renal donors, MRA had an accuracy of 90% in the detection of accessory renal artery branches, but a sensitivity of only 70% (Fig. 18). 53
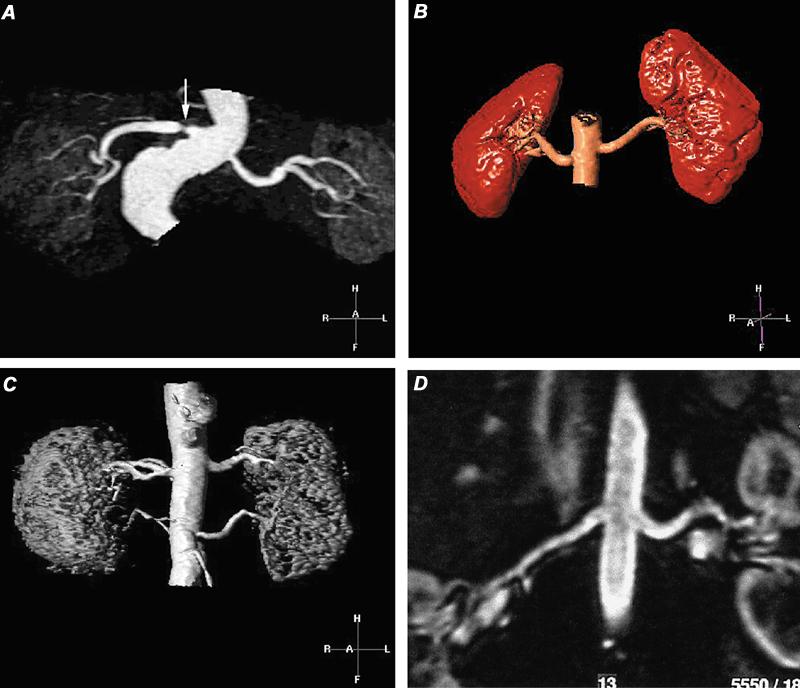
Fig. 18 Contrast-enhanced magnetic resonance angiograms of renal arteries. A) Evaluation by maximum intensity projection (MIP) of hypertensive patient, which discloses a high-grade stenosis (arrow) in the proximal portion of the single right renal artery. The left renal artery appears to be patent. B) Volume-rendered display of normal renal arteries in a renal transplant donor. C) Volume-rendered magnetic resonance angiogram in a hypertensive patient shows patent duplicated renal arteries. D) Curved multiplanar coronal reconstruction with display along the courses of the renal arteries demonstrates patency of the main renal arteries.
On the basis of the data cited above and our own experience with over 50 patients, we use 3-D CE MR only in screening selected patients for renal artery stenosis, and we add 3-D phase contrast images when they are needed for clarification.
Carotid Arteries. Duplex color-flow sonography and power-imaging sonography, with and without intravenous contrast agents, are proven and effective screening tools for identification and categorization of extracranial carotid stenoses. 54 Magnetic resonance angiography is routinely applied to patients with ischemic neurologic symptoms, as a part of a comprehensive MRI examination of the brain. Historically, MRA of the cervical carotid arteries has been performed with 2-D and 3-D TOF and occasionally with 3-D phase contrast techniques. Because of inherent artifacts, these techniques tend to overestimate the degree of stenosis. Despite this, accuracies above 90% (sensitivity of 84% to 94% and specificity of 94% to 100%) have been reported in each of the 3 techniques when compared with CA. 55–57
The use of gadolinium-contrast-enhanced spoiled gradient-recalled techniques (CE) has improved the success of MRA by decreasing not only artifacts but also the scanning time. 56,58 This technique, unlike TOF imaging, can begin visualization at the aortic arch. In 1 study of 21 patients, the correlation value between CE MRA and CA was 92%. 58 Contrast-enhanced MRA is quite good (>90%) at categorizing severe stenosis (over 70%) and occlusions. 57–59 Differentiation of near-total (pseudo) occlusions from total occlusions has been variable: some reports indicate that MRA has difficulty in these cases 59,60 while others 58 publicize CE MRA's uniform success. For non-dedicated combined imaging of the carotid and vertebral arteries with brain MRI, we use non-CE techniques (2-D or 3-D TOF of the cervical carotids and 3-D PC of the intracranial vessels). For dedicated vascular studies of the carotids, CE MRA is used to better visualize the entire carotid system from its origins at the aortic arch (Fig. 19).
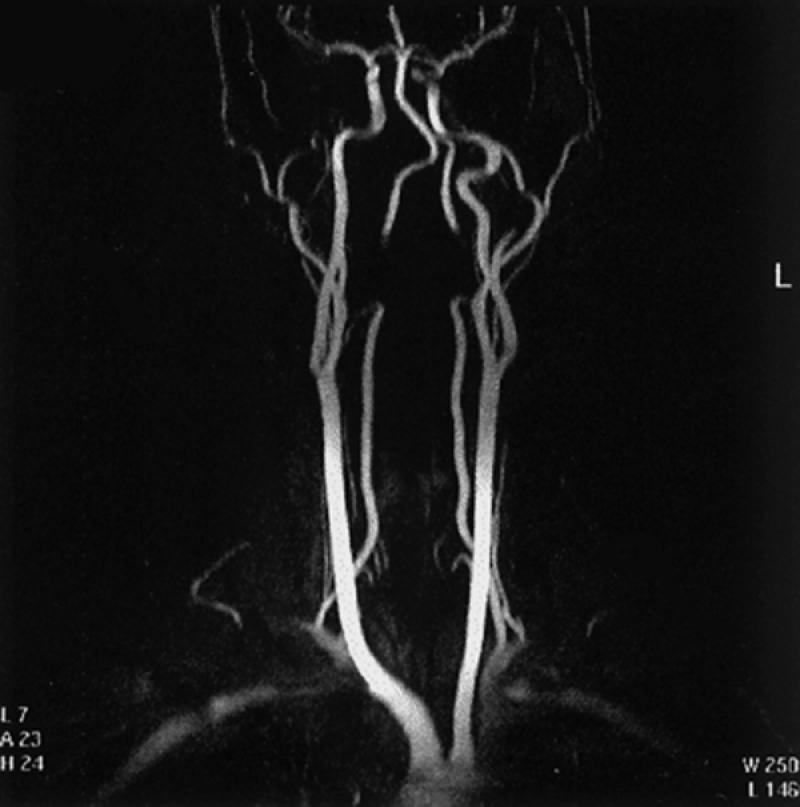
Fig. 19 Contrast-enhanced 3-D display (maximum intensity projection) of the brachiocephalic vessels. This is only 1 of 18 views that are usually displayed and rotated every 10 degrees along the vertical axis of the body, to exhibit all aspects of the cervical and proximal intracranial vasculature. Note: There is signal loss in the distal cervical portions of both vertebral arteries because these segments of the arteries were excluded from the imaging field.
Computed Tomographic Angiography
Computed tomographic angiography (CTA) applies current helical technology with a sustained high flow of iodinated contrast material via intravenous injection. The resultant data can be processed into thin axial images (source images), as well as into 3-D or multiplanar images (or both). Before helical (spiral) scanners became available, CT provided minimal coverage and 3-D volume techniques were primitive. As in 3-D CE MRA, a relatively large volume can be covered in a single breath, which provides spatial resolution free of respiratory motion artifact.
Technique. Good CTA requires contrast agent to be present in the vascular system of interest throughout the time that the CT images are acquired. This is accomplished by beginning CT imaging when adequate contrast levels are present and by ensuring sustained contrast throughout the scan. Two techniques are used to determine the time at which scanning should begin, relative to the initiation of contrast injection. In the test bolus technique, multiple scans are obtained at a single area of interest after a small injection of contrast agent and the arrival time is calculated. In the 2nd technique, an automated bolus-tracking system begins scanning when the density or intensity of an area defined by the operator exceeds a prescribed threshold. Like MRA, CTA display comprises the actual scan slices, reconstructed thinner slices, and 3-D techniques: maximum intensity projection, or MIP (Fig. 20A); shaded surface display, or SSD (Fig. 20B); and volume rendering, or VR (Figs. 20 C and D). Reconstructed thinner slices (smaller than beam collimation) and 3-D techniques are generally produced on a workstation.
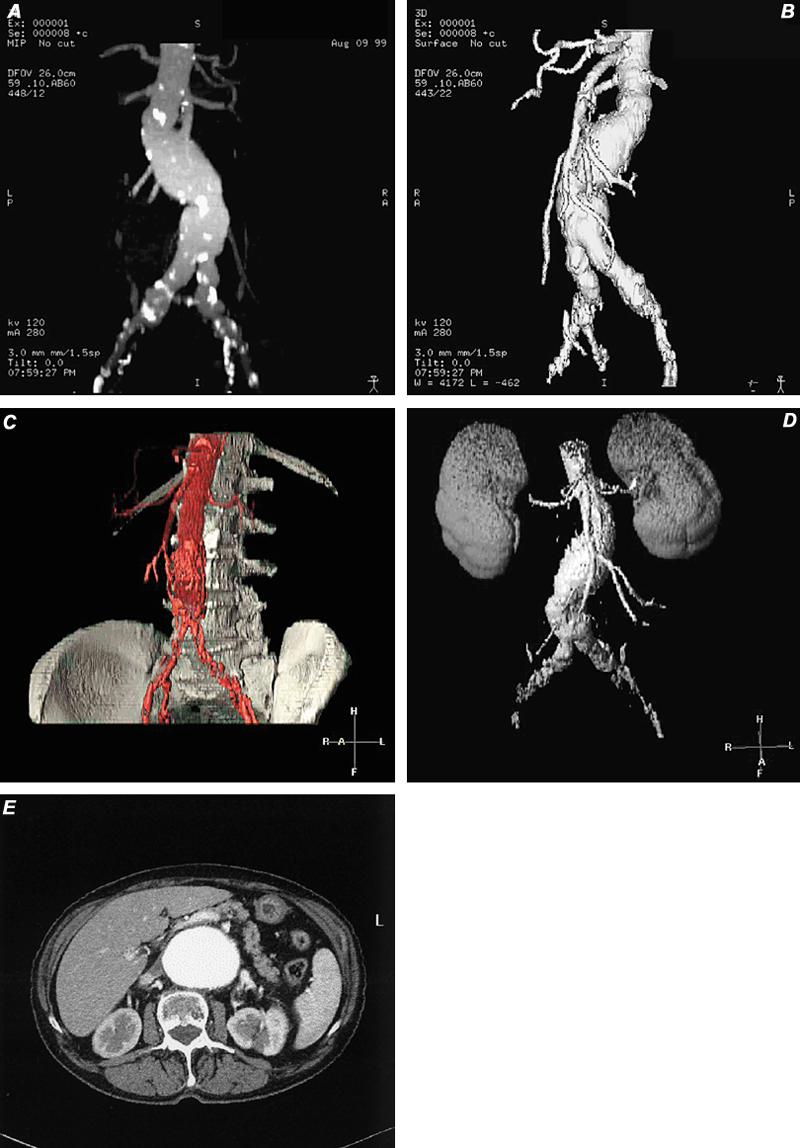
Fig. 20 Types of 3-D display. A) Computed tomographic angiogram using maximum intensity projection (MIP) technique, which discloses a partially calcified fusiform abdominal aortic aneurysm. B) Computed tomographic angiogram with shaded surface display (SSD) depicts the same abdominal aortic aneurysm that appears in image A. Notice that the calcifications are not visible, as they were in MIP imaging. C and D) Two types of volume-rendered images in patients with abdominal aortic aneurysm. E) Axial computed tomographic image of abdominal aortic aneurysm (source image for A-D). Note: A variety of tissues can be presented with this technique.
Recently, several manufacturers of CT equipment have introduced a new generation of CT scanners (multi-detector array or multislice) that enable 2 to 4 image slices to be obtained during a single revolution of the scanner (0.5 to 1.0 sec). This advance produces much faster CT studies, with resolution similar or superior to the resolution achieved by the older equipment. Moreover, areas 3 to 6 times larger can be scanned without significant image degradation. This advance will enable wider application of CT in the diagnosis of peripheral vascular disease.
Thoracic Aorta
In contrast to the abdominal aorta, CTA of the thoracic aorta can be challenging. Pulsatile motion of the aorta (from transmitted cardiac motion) and streak artifacts produced by adjacent high-contrast structures (the pulmonary artery and vein, the heart, and the brachiocephalic veins) can mimic aortic disease, such as dissection flaps, and can prevent good 3-D or multiplanar reconstruction algorithms. These limitations not withstanding, CTA is a rapid and accurate tool in the diagnosis of variety of aortic lesions.
Aneurysm. Computed tomographic angiography provides a reproducible and reliable delineation of the extent, size, and thrombus-load of aneurysms of the aorta (Fig. 21). 61–63 Involvement of branch vessels is also reliably defined. The ability of CT to display associated calcification is also sometimes quite useful in following aneurysm size and in helping to determine whether there is associated dissection.
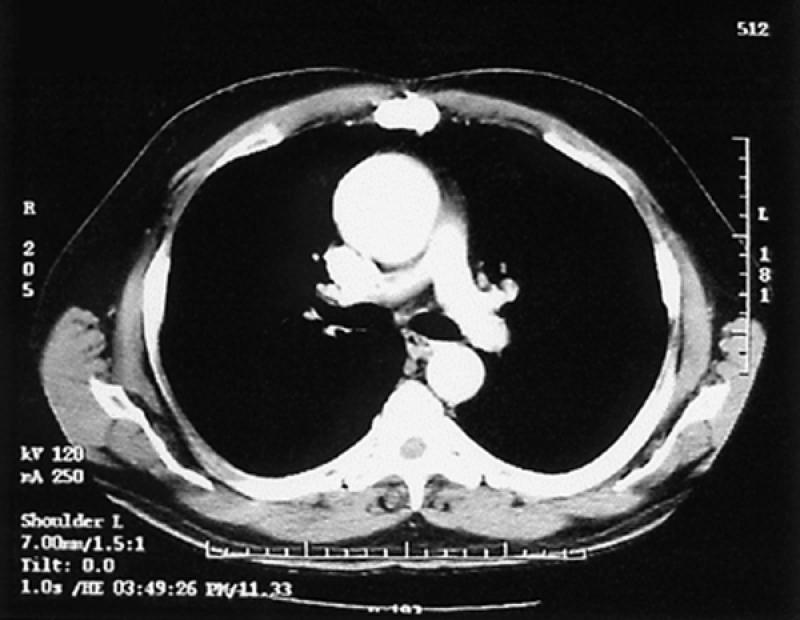
Fig. 21 Computed tomographic angiogram of ascending thoracic aortic aneurysm.
We use CT as our primary technique in the diagnosis and follow-up evaluation of patients with aneurysms. Three-dimensional and multiplanar displays provide a better spatial understanding of the aneurysmal sac, which can be useful in planning treatment.
Dissection. Computed tomographic angiography is the most rapid invasive technique for defining aortic dissections. Studies that compare CT with MR and transesophageal echocardiography (TEE) have confirmed the similar accuracy of CT. 64,65 Although TEE and MR may be more sensitive in detecting small intimal flaps and (unlike CT) can detect aortic regurgitation, the display of branch vessels and pseudoaneurysms is apparently better with CT than with TEE. Further, CT can be used to determine the distal extent of the dissection, while TEE cannot when the dissection extends below the diaphragm. Possible findings on CT are those of intimal flaps, with or without calcification, flow in 1 or both lumina, and mural thickening (Fig. 22).
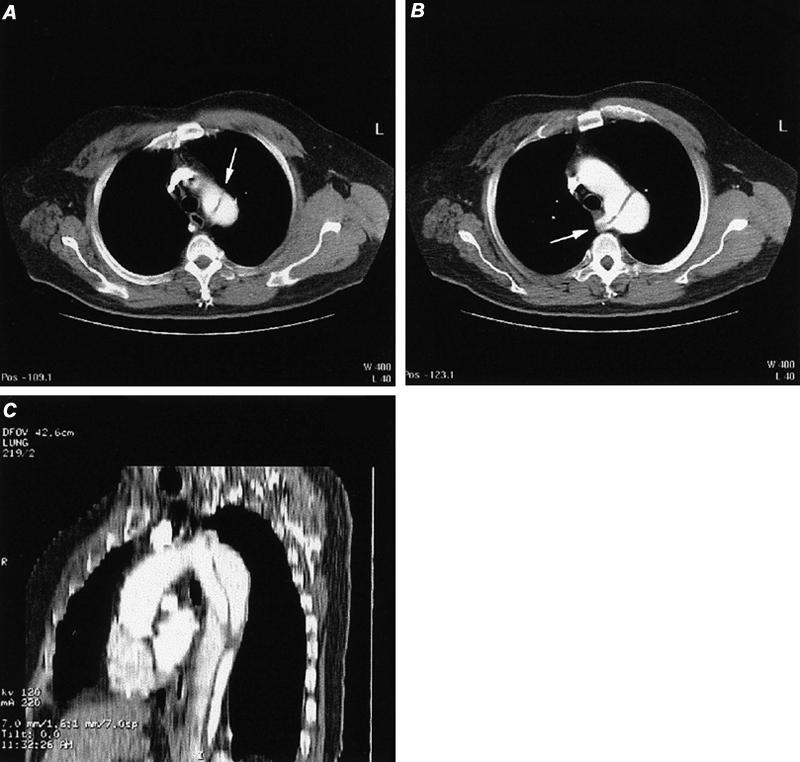
Fig. 22 Computed tomographic angiography of aortic dissection (type B) in a patient with aberrant right subclavian artery. A) Axial image at the apex of the aortic arch discloses an intimal flap in the proximal descending thoracic aorta (arrow). B) Axial image obtained slightly inferior to image A discloses normal appearance of the proximal aortic arch and a dissection flap in the distal aortic arch that extends into the origin of an aberrant right subclavian artery (arrow). C) Reformatted sagittal oblique maximum intensity projection image of thoracic aortic dissection.
Other Conditions. Other conditions, such as Takayasu's arteritis, can be accurately displayed in CT without the need for CA. In comparing CT with CA in 25 patients with Takayasu's aortitis, Yamada 66 found that CT accurately depicted 195 of 200 arterial segments. Sensitivity and specificity for CTA were 95% and 100%, respectively. Stenoses, aneurysms, and occlusions can be observed.
Abdominal Aorta
Aneurysm. The diagnosis of abdominal aortic aneurysm is established primarily with sonography. Sonography is relatively inexpensive and reproducible and can be used to follow an aneurysm's size. When aneurysms become large enough to warrant treatment, many surgeons require a more detailed anatomic study, which historically took the form of coronary angiography (CA). Associated renal artery stenoses, accessory renal branches, iliac artery extension, and stenotic-occlusive disease of the superior and inferior mesenteric arteries can be defined by CA.
The high-resolution capability of spiral CTA has been found to be equivalent to that of CA in virtually every area and superior in others (e.g., aneurysm diameter and length). 67–69 Computed tomographic angiography is now the standard technique used to evaluate thoracic and abdominal aneurysms before and after stent-graft placement. Source images and multiplanar and 3-D reconstruction algorithms enable precise delineation of the proximal neck's diameter and length, the sac size and length, the angulation between the proximal and distal necks and the sac, the distal neck (if any), and the access route (iliac vessels) (Fig. 20). 70
After stent-graft placement, evaluation of patients for integrity of the graft and for endovascular leaks is also best accomplished with CTA. Small endoleaks might not be easily seen with early arterial phase imaging, so a slightly delayed sequence at 60 to 70 seconds following contrast injection may be required. 71 In a comparison study of CTA and CA in patients with stent-grafts, CTA was more sensitive and specific by approximately 20% than CA in the detection of endoleaks (Fig. 23). 70 Graft-related endoleaks may occur for a variety of reasons, but usually from poor fitting of the device. Other graft-related leaks may occur from loss of integrity of the stent-graft material, including defects in stent material and suture material.
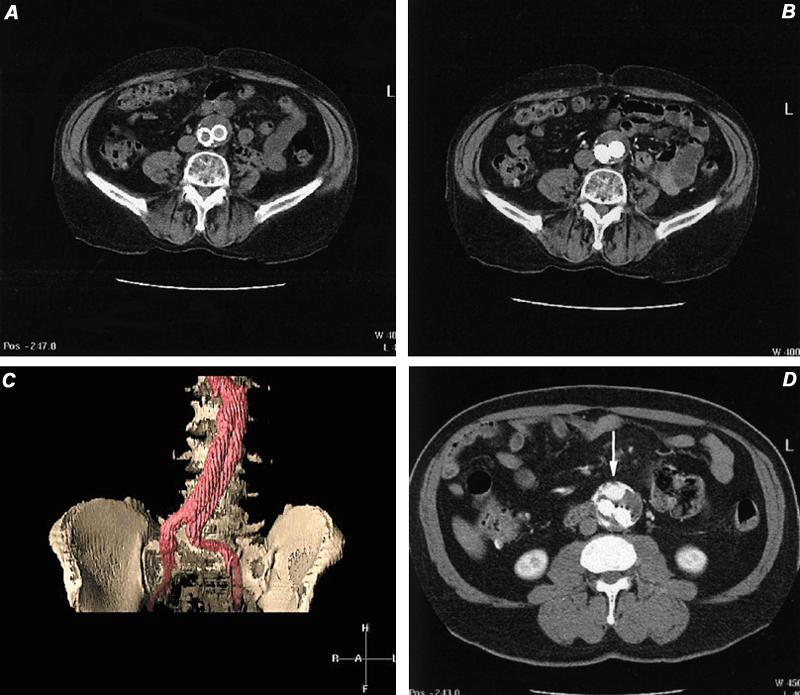
Fig. 23 Computed tomographic angiography in the evaluation of stent-grafts. A) Computed tomographic image of distal abdominal aorta, 6 months following AneuRx™ stent-graft placement. This image was obtained before contrast administration. B) Same location as image A, but during intravascular contrast infusion. Note opacification of both iliac limbs and no contrast extravasation. C) Volume-rendered display of stent-graft discloses no evidence of endoleak. D) Axial computed tomographic image in another patient discloses a leak characterized by contrast pooling (arrow) ventral to the 2 iliac limbs. This was documented to be a non-stent-related endoleak arising from the inferior mesenteric artery. This vessel was embolized successfully.
Non-stent-related endoleaks arise from continued patency of branch vessels (usually inferior mesenteric or lumbar arteries). These are readily detected with CT, although a delayed phase scan should be obtained 60 to 70 seconds after the contrast infusion has begun, in order to find small leaks. 71
Aneurysm size usually diminishes after successful stent-graft placement. Increases in sac diameter are seen in 53% to 93% of patients with endoleaks and in 11% to 20% of patients without demonstrable leak. 71,72
Renal Arteries. Thin-section helical contrast-enhanced CTA readily and accurately displays the renal arteries. Beam collimation of 3 mm or less is used, with reconstruction at 1.5 to 2.0 mm intervals; images are then displayed with 3-D techniques. However, as with other techniques, evaluation must include the source images (Fig. 24).

Fig. 24 Computed tomographic angiography source films in patient with suspected renal artery stenosis. A and B) Sequential axial images disclosing patency of the proximal portion of the left renal artery (arrow). C) Stenosis of the origin of the right renal artery (arrow).
Volume rendering (Fig. 20D)—1 of the 3 main types of 3-D display—appears to be the optimal method of display for renal stenosis, although curved multiplanar depictions are very useful (Fig. 25). In a study of 25 patients who had undergone angiography and CTA with 3-D maximum intensity projection (MIP) and volume-rendering (VR) display, VR exhibited sensitivity similar to that of MIP (92% vs 92%) but had better specificity than MIP (99% vs 87%), when both were compared with digital subtraction angiography. 73
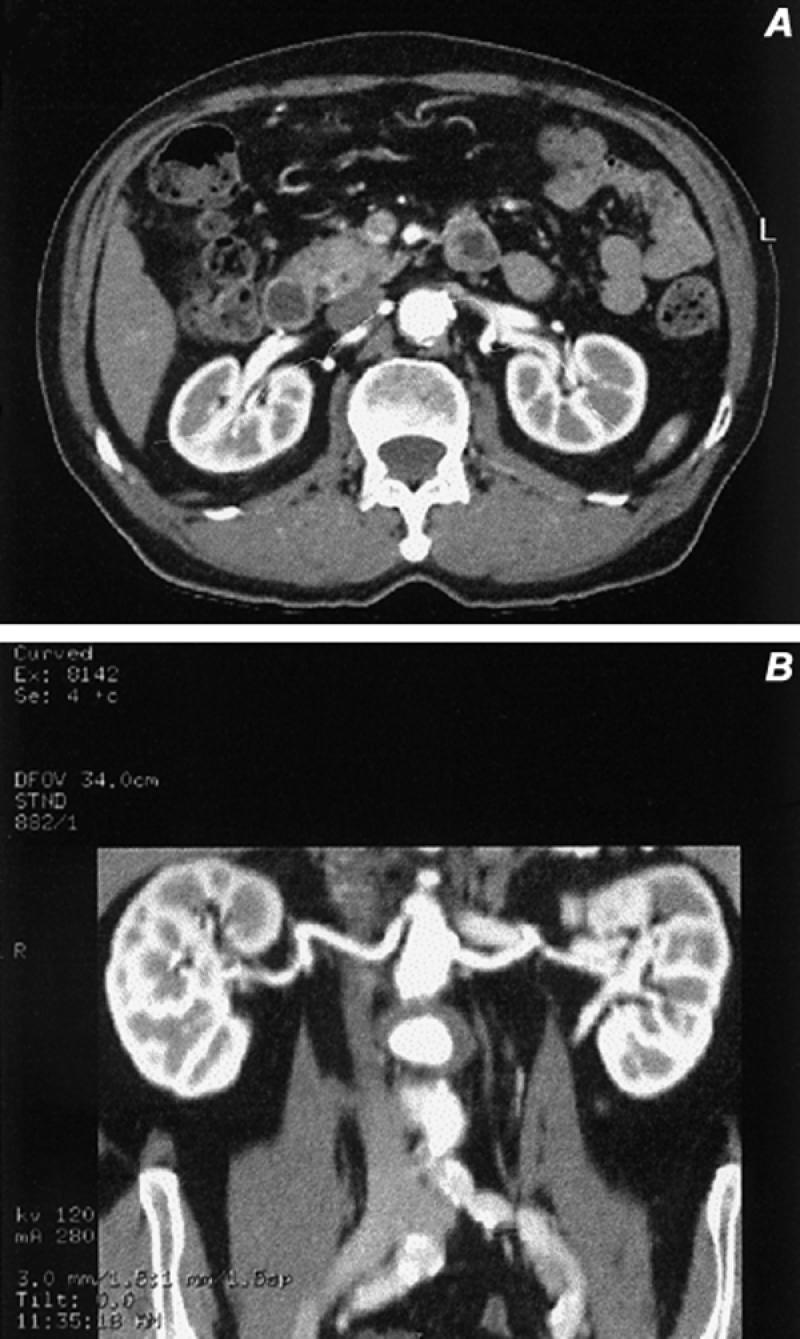
Fig. 25 Curved coronal reformatted images obtained from a 3-D data set. A and B) The courses of the renal arteries were traced individually and displayed in a modified coronal presentation, which shows no evidence of renal artery stenosis in this patient with hypertension.
Accuracy of CT in the detection of main renal artery stenosis has been variable. In the best published reports, categorization of renal stenosis into mild (<49%), significant (50% to 99%), and occlusive, sensitivities of 92% to 100% were found. 74,75 In these studies, which compared CTA with optimized digital subtraction angiography, all accessory arteries, as well, were identified by means of CTA. Other studies have shown CTA to be slightly less accurate. 76,77 Detection of fibromuscular disease is also difficult, especially in its mild-to-moderate forms, because the maximum resolution of CTA is 1 to 2 mm.
Computed tomographic angiography can also be used successfully in screening potential renal donors. 78–80 In these studies of potential donors, a high degree of correlation (>90%) between the total numbers of arteries and veins has been shown, when CTA was compared with CA and surgery. Aneurysms, stenoses, and occlusions are reliably demonstrated, but evaluation of smaller accessory arteries for stenosis is more difficult.
Iliofemoral Arteries. The diagnosis of aneurysms is easily established with CTA in the iliofemoral arteries. However, the large coverage areas required for iliofemoral, popliteal, and crural stenoses present major problems for CTA. To maintain adequate spatial resolution, only about 25 to 30 cm can be covered with monoslice helical scanning. Accuracies are competitive with MRA, again with the caveat that maximum resolution is 1 to 2 mm. 81 Multidetector array CTA is able to scan 3 to 4 times more coverage area than monoslice CTA, without a loss in resolution (Fig. 26). This technique is just now being evaluated for iliofemoral occlusive disease and will compete with MRA. However, for other CTA applications, resolution will be limited to the maximum of 1 to 2 mm, given the large coverage areas.
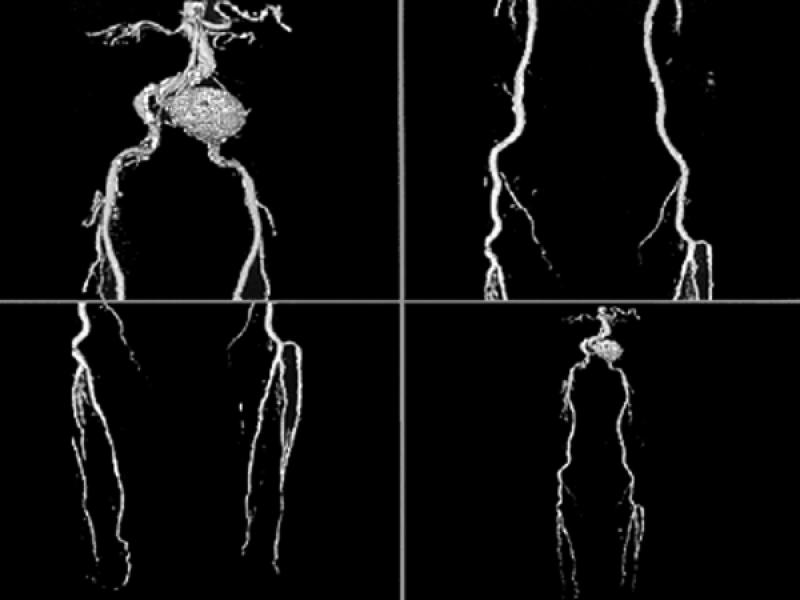
Fig. 26 Volume-rendered computed tomographic runoff angiography with multi-detector array computed tomographic scanner. Notice left common iliac artery aneurysm. These volume-rendered images disclose vascular patency and can also depict (in lighter shades) the presence of calcifications. This technique offers promise in the evaluation of selected patients with suspected peripheral vascular disease. (Courtesy of General Electric Medical Systems; Milwaukee, Wis)
Pulmonary Arteries. Computed tomographic angiography has replaced radionuclide imaging and pulmonary arteriography in many centers as the primary screening tool for patients suspected of having pulmonary emboli. 21,82 The rapid acquisition and anatomic display of vessels down to 2 to 3 mm makes CT ideal for this type of evaluation. Remy-Jardin, 82 in his analysis of studies that used optimal beam thicknesses (collimation), found an average sensitivity of 90% and average specificity of 93% for pulmonary emboli involving segmental or larger pulmonary arteries. There was also a tendency to improve accuracy of CTA when thinner image slices (2 or 3 mm collimation) were used, in comparison with 5 mm. In fact, Baghaie 83 found an accuracy of 98% (sensitivity 96%, specificity 100%) of CTA in detecting sub-segmental emboli while using collimation of 2 to 3 mm.
Computed tomographic angiography appears to be superior to lung scanning in virtually every area. Data from the European multicenter trial (ESTIPEP) 84 demonstrated that CTA had greater sensitivity than did ventilation-perfusion (VQ) scans (mean values, 80% vs 50%). Additionally, other chest structures (lungs, heart, pleural spaces, etc.) are displayed with CTA, which can elucidate symptoms of non-embolic cause in up to 1/3 of patients (Fig. 27). 82 Further, interobserver variability in CTA interpretation was considerably less than in lung-scan interpretation (K values of 0.72 versus 0.39 and of 0.85 versus 0.61, respectively). 85
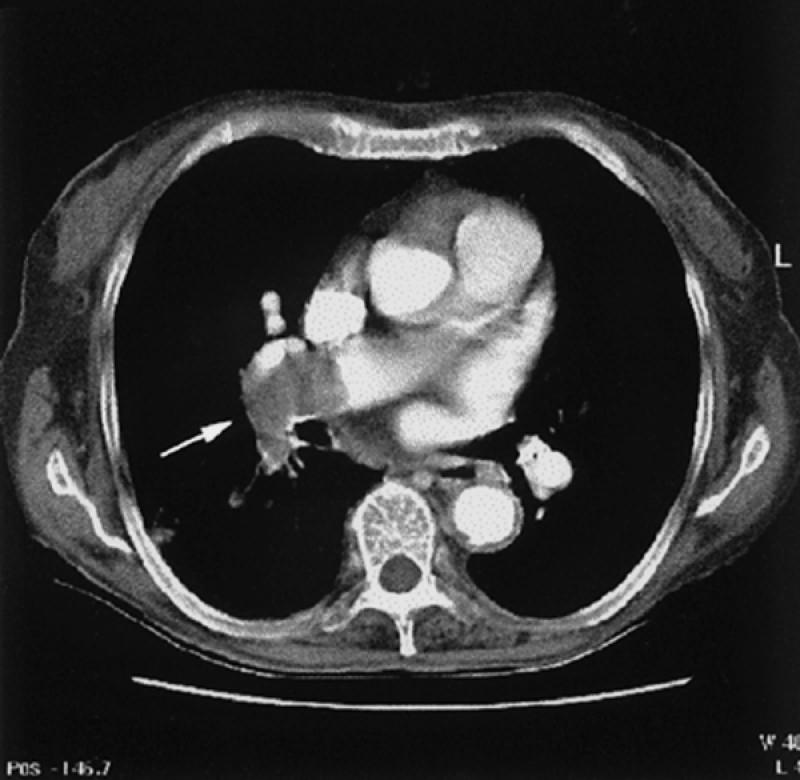
Fig. 27 Computed tomographic angiogram of pulmonary embolus. Notice large embolus in the distal portion of the right pulmonary artery (arrow) extending into the superior segment of the right lower lobe.
Follow-up study was performed for 6 to 19 months in 275 patients who had negative CTA scans when evaluated for pulmonary embolism. 86,87 Only 1 of these patients had a subsequent event that was almost certainly a consequence of pulmonary embolism. Computed tomographic angiography can display acute and chronic changes of pulmonary thromboembolic disease and can depict a variety of other pulmonary vascular diseases such as sarcomas, arteriovenous malformations, aneurysms, and stenoses.
Carotid Arteries. Computed tomographic angiography can provide important information in carotid occlusive disease, but its use is limited because other proven noninvasive techniques are available. Thin section (2 to 3 mm) collimation, coupled with iodine injection, is used to generate this study, which can depict the great vessels from the aortic arch to the intracranial vessels. In a study of 19 patients, 88 CTA source images accurately detected stenoses in 87%: 3-D volume rendering (Fig. 28) was superior to MIP displays, but both 3-D techniques were inferior to source image evaluation. Eccentric, small, web-like plaques are also difficult to see with CT. 89 Our preference is to use CT in rare cases, when duplex sonography is questionable and MRA and CA cannot be performed.
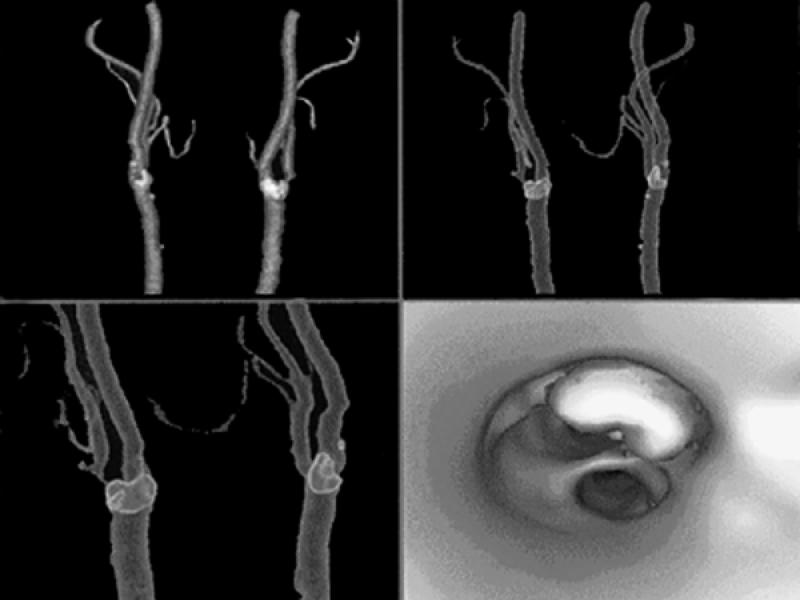
Fig. 28 Computed tomographic angiography of the carotid bifurcations using multi-detector array high-resolution technique. The 1st 3 images are volume-rendered displays of the carotid bifurcations, with calcification in the bifurcations outlined in lighter colors. The last image is a virtual angioscopic display that shows the carotid bifurcation from below, with depiction of a large calcified plaque in the ostium of the internal carotid artery. (Courtesy of General Electric Medical Systems; Milwaukee, Wis)
Footnotes
Address for reprints: Barry D. Toombs, MD, Department of Radiology, Texas Heart Institute at St. Luke's Episcopal Hospital, P.O. Box 20345, MC 2-256, Houston, TX 77225-0345
Presented at the Texas Heart® Institute's symposium on Peripheral Interventions for the Cardiovascular Specialist, held on 4–5 November 1999, at the Marriott Medical Center Hotel, Houston, Texas
References
- 1.Stemerman DH, Krinsky GA, Lee VS, Johnson G, Yang BM, Rofsky BN. Thoracic aorta: rapid black-blood MR imaging with half-Fourier rapid acquisition with relaxation enhancement with or without electrocardiographic triggering. Radiology 1999;213:185–91. [DOI] [PubMed]
- 2.Melhem ER, Jara H, Yucel EK. Black blood MR angiography using multislab three-dimensional T1-weighted turbo spin-echo technique: imaging of intracranial circulation. AJR Am J Roentgenol 1997;169:1418–20. [DOI] [PubMed]
- 3.Prince MR, Yucel EK, Kaufman JA, Harrison DC, Geller SC. Dynamic gadolinium-enhanced three-dimensional abdominal MR arteriography. J Magn Reson Imaging 1993;3:877–81. [DOI] [PubMed]
- 4.Prince MR. Gadolinium-enhanced MR aortography. Radiology 1994;191:155–64. [DOI] [PubMed]
- 5.Prince MR, Arnoldus C, Frisoli JK. Nephrotoxicity of high-dose gadolinium compared with iodinated contrast. J Magn Reson Imaging 1996;1:162–6. [DOI] [PubMed]
- 6.Hartnell GG, Finn JP, Zenni M, Cohen MC, Dupuy DE, Wheeler HG, et al. MR imaging of the thoracic aorta comparison spin-echo, angiographic, and breath-hold techniques. Radiology 1994;191:697–704. [DOI] [PubMed]
- 7.Nienaber CA, von Kodolitsch Y, Nicholas V, Siglow V, Piepho A, Brockhoff C, et al. The diagnosis of thoracic aorta dissection by noninvasive imaging produces. N Engl J Med 1993;328:1–9. [DOI] [PubMed]
- 8.Deutsch HJ, Sechtem U, Meyer H, Theissen P, Schicha H, Erdmann E. Chronic aortic dissection: comparison of MR Imaging and transesophageal echocardiography. Radiology 1994;192:645–50. [DOI] [PubMed]
- 9.Laissy JP, Blanc F, Soyer P, Assayag P, Siebert A, Tebboune D, et al. Thoracic aortic dissection: diagnosis with transesophageal echocardiography versus MR imaging. Radiology 1995;194:331–6. [DOI] [PubMed]
- 10.Sommer T, Fehske W, Holzknecht N, Smekal AV, Keller E, Lutterbey G, et al. Aortic dissection: a comparative study of diagnosis with spiral CT, multiplanar transesophageal echocardiography, and MR imaging. Radiology 1996;199:347–52. [DOI] [PubMed]
- 11.Prince MR, Narasimham DL, Jacoby WT, Williams DM, Cho KJ, Marx MV, et al. Three-dimensional gadolinium-enhanced MR angiography of the thoracic aorta. AJR Am J Roentgenol 1996;166:1387–97. [DOI] [PubMed]
- 12.Krinsky G, Rofsky N, Flyer M, Giangola G, Maya M, DeCoroto D, et al. Gadolinium-enhanced three-dimensional MR angiography of acquired arch vessel disease. AJR Am J Roentgenol 1996;167:981–7. [DOI] [PubMed]
- 13.Williams DM, Kirsh MM, Abrams GD. Penetrating atherosclerotic aortic ulcer with dissecting hematoma: control of bleeding with percutaneous embolization. Radiology 1991;181:85–8. [DOI] [PubMed]
- 14.Link KM, Lesko NM. The role of MR imaging in the evaluation of acquired diseases of the thoracic aorta. AJR Am J Roentgenol 1992;158:1115–25. [DOI] [PubMed]
- 15.Matsunaga N, Hayashi K, Sakamoto I, Matsuoka Y, Ohawa Y, Honjo K, et al. Takayasu arteritis: MR manifestations and diagnosis of acute and chronic phase. J Magn Reson Imaging 1998;8:406–16. [DOI] [PubMed]
- 16.Weg JG. Pulmonary embolism: diagnosis and treatment. Appl Cardiopulm Pathphysiol 1988;2:23–5.
- 17.The PIOPED investigators. Value of the ventilation/perfusion scan in acute pulmonary embolism: results of the prospective investigation of pulmonary embolism diagnosis (PIOPED). JAMA 1990;263:2753–9. [DOI] [PubMed]
- 18.Meaney JF, Weg JG, Chenevert TL, Stafford-Johnson D, Hamilton BH, Prince MR. Diagnosis of pulmonary embolism with magnetic resonance angiography. N Engl J Med 1997;336:1422–7. [DOI] [PubMed]
- 19.Steiner P, McKinnon GC, Romanowski B, Goehde SC, Hany T, Debatin JF. Contrast-enhanced, ultrafast 3D pulmonary MR angiography in a single breath-hold: initial assessment of imaging performance. J Magn Reson Imaging 1997;7:177–82. [DOI] [PubMed]
- 20.Bergin CJ, Sirlin CB, Hauschildt JP, Huynh TV, Auger WR, Fedullo PF, et al. Chronic thromboembolism: diagnosis with helical CT and MR imaging with angiographic and surgical correlation. Radiology 1997;204:695–702. [DOI] [PubMed]
- 21.Woodard PK, Yusen RD. Diagnosis of pulmonary embolism with spiral computed tomography and magnetic resonance angiography. Curr Opin Cardiol 1999;14:442–7. [DOI] [PubMed]
- 22.Kandarpa K, Piwnica-Worms D, Chopra PS, Admas DF, Hunink MG, Donaldson MC, et al. Prospective double-blinded comparison of MR imaging and aortography in the preoperative evaluation of abdominal aortic aneurysms. J Vasc Interv Radiol 1992;3:83–9. [DOI] [PubMed]
- 23.Durham JR, Hackworth CA, Tober JC, Bova JG, Bennett WF, Schmalbrock P, et al. Magnetic resonance angiography in the preoperative evaluation of abdominal aortic aneurysms. Am J Surg 1993;166:173–8. [DOI] [PubMed]
- 24.Kaufman JA, Geller SC, Petersen MJ, Cambria RP, Prince MR, Waltman AC. MR imaging (including MR angiography) of abdominal aortic aneurysms: comparison with conventional angiography. AJR Am J Roentgenol 1994;163:203–10. [DOI] [PubMed]
- 25.Prince MR, Narasimham DL, Stanley JC, Wakefield TW, Messina LM, Zelenock GB, et al. Gadolinium-enhanced magnetic resonance angiography of abdominal aneurysms. J Vasc Surg 1995;21:656–69. [DOI] [PubMed]
- 26.Prince MR, Narasimham DL, Stanley JC, Chenevert TL, Williams DM, Marx MV, et al. Breath-hold gadolinium-enhanced MR angiography of abdominal aorta and its branches. Radiology 1995;197:785–92. [DOI] [PubMed]
- 27.Holland GA, Dougherty L, Carpenter JP, Golden MA, Gilfeather M, Slossman, et al. Breath-hold ultrafast three-dimensional gadolinium-enhanced MR angiography of the aorta and the renal and other visceral abdominal arteries. AJR Am J Roentgenol 1996;166:971–81. [DOI] [PubMed]
- 28.Earls JP, DeSena S, Bluemke DA. Gadolinium-enhanced three-dimensional MR angiography of the entire aorta and iliac arteries with dynamic manual table translation. Radiology 1998:209:844–9. [DOI] [PubMed]
- 29.Johnson DB, Prince MR, Chenevert TL. Magnetic resonance angiography: a review. Acad Radiol 1998;5:289–305. [DOI] [PubMed]
- 30.Thurnher SA, Dorffner R, Thurnher MM, Winklebauer FW, Kretschmer G, Polterauer P, et al. Evaluation of abdominal aortic aneurysm for stent-graft placement: comparison of gadolinium-enhanced MR angiography versus helical CT angiography and digital subtraction angiography. Radiology 1997;205:341–52. [DOI] [PubMed]
- 31.Muller-Hulsbeck S, Link J, Schwarzenberg H, Steffens JC, Brossmann J, Hulsbeck A, et al. MR imaging signal-intensity abnormalities after placement of arterial endoprostheses. AJR Am J Roentgenol 1997;169:743–8. [DOI] [PubMed]
- 32.Link J, Steffens JC, Brossmann J, Graessner J, Hackethal S, Heller M. Iliofemoral arterial occlusive disease: contrast-enhanced MR angiography for preinterventional evaluation and follow-up after stent placement. Radiology 1999;212:371–7. [DOI] [PubMed]
- 33.Crawford ES, Morris GC Jr, Myhre HO, Roehm JO Jr. Celiac axis, superior mesenteric artery, and inferior mesenteric artery occlusion: surgical considerations. Surgery 1977;82:856–66. [PubMed]
- 34.Stanton PE Jr, Hollier PA, Seidel TW, Rosenthal D, Clark M, Lamis PA. Chronic intestinal ischemia: diagnosis and therapy. J Vasc Surg 1986;4:338–44. [PubMed]
- 35.Wasser MN, Geelkerken RH, Kouwenhoven M, van Bockel JH, Hermans J, Schultze Kool LJ, et al. Systolically gated 3D phase contrast MRA of mesenteric arteries in suspected mesenteric ischemia. J Comput Assist Tomogr 1996;20:262–8. [DOI] [PubMed]
- 36.Meaney JF, Prince MR, Nostrant TT, Stanley JC. Gadolinium-enhanced MR of angiography of visceral arteries in patients with suspected chronic mesenteric ischemia. J Magn Reson Imaging 1997;7:171–6. [DOI] [PubMed]
- 37.Shirkhoda A, Konez O, Shetty AN, Bis KG, Ellwood RA, Kirsch MJ. Mesenteric circulation three-dimensional MR angiography with a gadolinium-enhanced multiecho gradient-echo technique. Radiology 1997;202:257–61. [DOI] [PubMed]
- 38.Li KC. MR angiography of abdominal ischemia. Semin Ultrasound CT MR 1996;17:352–9. [DOI] [PubMed]
- 39.Owen RS, Carpenter JP, Baum RA, Perloff LJ, Cope C. Magnetic resonance imaging of angiographically occult runoff vessels in peripheral arterial occlusive disease. N Engl J Med 1992;326:1577–81. [DOI] [PubMed]
- 40.Owen RS, Baum RA, Carpenter JP, Holland GA, Cope C. Symptomatic peripheral vascular disease: selection of imaging parameters and clinical evaluation with MR angiography. Radiology 1993;187:627–35. [DOI] [PubMed]
- 41.Yucel EK, Kaufman JA, Geller SC, Waltman AC. Atherosclerotic occlusive disease of the lower extremity: prospective evaluation with two-dimensional time-of-flight MR angiography. Radiology 1993;187:637–41. [DOI] [PubMed]
- 42.Glickerman DJ, Obregon RG, Schmiedl UP, Harrison SD, Macaulay SE, Simon HE, et al. Cardiac-gated MR angiography of the entire lower extremity: a prospective comparison with conventional angiography. AJR Am J Roentgenol 1996;167:445–51. [DOI] [PubMed]
- 43.McCauley TR, Monib A, Dickey KW, Clemett J, Meier GH, Egglin TK, et al. Peripheral vascular occlusive disease: accuracy and reliability of time-of-flight MR angiography. Radiology 1994:192:351–7. [DOI] [PubMed]
- 44.Steffens JC, Link J, Muller-Hulsbeck S, Freund M, Brinkmann G, Heller M. Cardiac-gated two-dimensional phase-contrast MR angiography of lower extremity occlusive disease. AJR Am J Roentgenol 1997:169:749–54. [DOI] [PubMed]
- 45.Douek PC, Revel D, Chazel S, Falise B, Villard J, Amiel M. Fast MR angiography of the aortoiliac arteries and arteries of the lower extremity: value of bolus-enhanced, whole-volume subtraction technique. AJR Am J Roentgenol 1995;165:431–7. [DOI] [PubMed]
- 46.Lee HM, Wang Y, Sostman HD, Schwartz LH, Khilnani NM, Trost DW, et al. Distal lower extremity arteries: evaluation with two-dimensional MR digital subtraction angiography. Radiology 1998;207:505–12. [DOI] [PubMed]
- 47.Watanabe Y, Dohke M, Okumura A, Amoh Y, Ishimori T, Oda K, et al. Dynamic subtraction MR angiography: first-pass imaging of the main arteries in the lower body. AJR Am J Roentgenol 1998;170:357–60. [DOI] [PubMed]
- 48.Quinn SF, Sheley RC, Semonson KG, Leonardo VJ, Kojima K, Szumowski J. Aortic and lower-extremity arterial disease: evaluation with MR angiography versus conventional angiography. Radiology 1998;206:693–701. [DOI] [PubMed]
- 49.Wang Y, Lee HM, Khilnani NM, Trost DW, Jagust MB, Winchester PA, et al. Bolus-chase MR digital subtraction angiography in the lower extremity. Radiology 1998;207:263–9. [DOI] [PubMed]
- 50.Sueyoshi E, Sakamoto I, Matsuoka Y, Ogawa Y, Hayashi H, Hashmi R, et al. Aortoiliac and lower extremity arteries: comparison of three-dimensional dynamic contrast-enhanced subtraction MR angiography and conventional angiography. Radiology 1999;210:683–8. [DOI] [PubMed]
- 51.Meaney JF, Ridgway JP, Chakraverty S, Robertson I, Kessel D, Radjenovic A, et al. Stepping-table gadolinium-enhanced digital subtraction MR angiography of the aorta and lower extremity arteries: preliminary experience. Radiology 1999;211:59–67. [DOI] [PubMed]
- 52.Gilfeather M, Yoon HC, Seigelman ES, Axel L, Stolpen AH, Shlansky-Goldberg RD, et al. Renal artery stenosis: evaluation with conventional angiography versus gadolinium-enhanced MR angiography. Radiology 1999;210:367–72. [DOI] [PubMed]
- 53.Nelson HA, Gilfeather M, Holman JM, Nelson EW, Yoon HC. Gadolinium-enhanced breathhold three-dimensional time-of-flight renal MR angiography in the evaluation of potential renal donors. J Vasc Interv Radiol 1999;10(2 Pt 1):175–81. [DOI] [PubMed]
- 54.Furst G, Saleh A, Wenserski F, Malms J, Cohnen M, Aulich A, et al. Reliability and validity of noninvasive imaging of internal carotid artery pseudo-occlusion. Stroke 1999;30:1444–9. [DOI] [PubMed]
- 55.Scarabino T, Carriero A, Magarelli N, Florio F, Giannatempo GM, Bonomo L, et al. MR angiography: a comparison of three techniques. Euro J Radiol 1998;28:117–25. [DOI] [PubMed]
- 56.Magarelli N, Scarabino T, Simeone AL, Florio F, Carriero A, Salvolini U, et al. Carotid stenosis: a comparison between MR and spiral CT angiography. Neuroradiology 1998;40:367–73. [DOI] [PubMed]
- 57.Levy RA, Prince MR. Arterial-phase three-dimensional contrast-enhanced MR angiography of the carotid arteries. AJR Am J Roentgenol 1996;167:211–5. [DOI] [PubMed]
- 58.Remonda L, Heid O, Schroth G. Carotid artery stenosis, occlusion, and pseudo-occlusion: first-pass, gadolinium-enhanced, three-dimensional MR angiography—preliminary study. Radiology 1998;209:95–102. [DOI] [PubMed]
- 59.Sameshina T, Futami S, Morita Y, Yokogami K, Miyahara S, Sameshima Y, et al. Clinical usefulness of and problems with three-dimension CT angiography for the evaluation of arteriosclerotic stenosis of the carotid artery: comparison with conventional angiography, MRA and ultrasound sonography. Surg Neurol 1999;51:301–9. [DOI] [PubMed]
- 60.Link J, Steffans JC, Wesner FO, Graessner J, Heller M. Contrast enhanced MR angiography for occlusion of carotid artery stenosis abstract. J Vasc Interv Radiol 1999;10(P):299.
- 61.Rubin GD. Helical CT angiography of the thoracic aorta. J Thorac Imaging 1997;12:128–49. [DOI] [PubMed]
- 62.Costello P, Ecker CP, Tello R, Hartnell GG. Assessment of the thoracic aorta by spiral CT. AJR Am J Roentgenol 1992;158:1127–30. [DOI] [PubMed]
- 63.Rubin GD, Piak DS, Johnston PC, Napel S. Measurement of the aorta and its branches with helical CT. Radiology 1998;206:823–9. [DOI] [PubMed]
- 64.Sommer T, Fehske W, Holzknecht N, Smekal AV, Keller E, Lutterbey G, et al. Aortic dissection: a comparative study of diagnosis with spiral CT, multiplanar transesophageal echocardiography and MR imaging. Radiology 1996;199:347–52. [DOI] [PubMed]
- 65.Maffei S, Baroni M, Terrazzi M, Piacenti M, Paoli, F, Camerini E, et al. Ambulatory follow-up of aortic dissection: comparison between CT and biplane transesophageal echocardiography. Int J Card Imaging 1996;12:105–11. [DOI] [PubMed]
- 66.Yamada I, Nakagawa T, Himeno Y, Numano F, Shibuya H. Takayasu arteritis: evaluation of the thoracic aorta with CT angiography. Radiology 1998;209:103–9. [DOI] [PubMed]
- 67.Rubin GD, Dake MD, Napel SA, McDonnell CH, Jeffrey RB Jr. Three-dimensional spiral CT angiography of the abdomen: initial clinical experience. Radiology 1993;186:147–52. [DOI] [PubMed]
- 68.Rubin GD, Walker PJ, Dake MD, Napel S, Jeffrey RB, McDonnell CH, et al. Three-dimensional spiral computed tomographic angiography: an alternative imaging modality for the abdominal aorta and its branches. J Vasc Surg 1993;18:656–65. [PubMed]
- 69.Rieker O, Duber C, Schmiedt W, von Zitzewitz H, Schweden F, Thelen M. Prospective comparison of CT angiography of the legs with intraarterial digital subtraction angiography. AJR Am J Roentgenol 1996;166:269–76. [DOI] [PubMed]
- 70.Rubin GD. Computed tomography before and after aortic stent-grafting. J Vasc Interv Radiol 1999;10:88–92.
- 71.Golzarian J, Dussaussois L, Abada HT, Gevenois PA, Van Gansbeke D, F, Ferreira J, et al. Helical CT of aorta after endoluminal stent-graft therapy: value of biphasic acquisition. AJR Am J Roentgenol 1998;171:329–31. [DOI] [PubMed]
- 72.Edwards RD. Eurostar registry results 1994–1998. J Vasc Interv Radiol 1999;10:92–95.10872496
- 73.Johnson PT, Halpern EJ, Kuszyk BS, Heath DG, Wechsler RJ, Nazarian LN, et al. Renal artery stenosis: CT angiography—comparison of real-time volume-rendering and maximum intensity projection algorithms. Radiology 1999;211:337–43. [DOI] [PubMed]
- 74.Kaatee R, Beek FJ, de Lange EE, van Leeuwen MS, Smits HF, van der Ven PJ, et al. Renal artery stenosis: detection and quantification with spiral CT angiography versus optimized digital subtraction angiography. Radiology 1997;205:121–7. [DOI] [PubMed]
- 75.Wittenberg G, Kenn W, Tschammler A, Sandstede J, Hahn D, et al. Spiral CT angiography of the renal arteries: comparison with angiography. Eur Radiol 1999;9:546–51. [DOI] [PubMed]
- 76.Farres MT, Lammer J, Schima W, Wagner B, Wildling R, Winkelbauer F, et al. Spiral computed tomographic angiography of the renal arteries: prospective comparison with intravenous and intraarterial digital subtraction angiography. Cardiovasc Intervent Radiol 1996;19:101–6. [DOI] [PubMed]
- 77.Rubin GD, Dake MD, Napel S, Jeffrey RB Jr, McDonnell CH, Sommer FG, et al. Spiral CT of renal artery stenosis: comparison of three-dimensional rendering techniques. Radiology 1994;190:181–9. [DOI] [PubMed]
- 78.Beregi JP, Elkohen M, Deklunder G, Artaud D, Coullet JM, Wattinne L. Helical CT angiography compared with arteriography in the detection of renal artery stenosis. AJR Am J Roentgenol 1996;167:495–501. [DOI] [PubMed]
- 79.Pozniak MA, Balison DJ, Lee FT Jr, Tambeaux RH, Uehling DT, Moon TD. CT angiography of potential renal transplant donors. Radiographics 1998;18:565–87. [DOI] [PubMed]
- 80.Slakey DP, Florman S, Lovretich J, Zarifian AA, Cheng SS. Utility of CT angiography for evaluation of living kidney donors. Clin Transplant 1999;13(1 Pt 2):104–7. [DOI] [PubMed]
- 81.Rankin SC. CT angiography. Eur Radiol 1999;9:297–310. [DOI] [PubMed]
- 82.Remy-Jardin M, Remy J. Spiral CT of the pulmonary circulation. Radiology 1999;212:615–36. [DOI] [PubMed]
- 83.Baghaie F, Remy-Jardin M, Remy J, et al. Diagnosis of peripheral acute pulmonary emboli: optimization on spiral CT acquisition protocol abstract. Radiology 1998;209(P):299.
- 84.Harold C, Remy-Jardin M, Grenier PH, et al. Prospective evaluation of pulmonary embolism: initial results of the European multicenter trial (ESTIPEP) abstract. Radiology 1998;209(P):299.
- 85.Mayo JR, Remy-Jardin M, Muller NL, Remy J, Worsley DF, Hossein-Fouchere C, et al. Pulmonary embolism: prospective comparison of spiral CT and ventilation-perfusion scintigraphy. Radiology 1997;205:447–52. [DOI] [PubMed]
- 86.Lomis NN, Yoon HC, Moran AG, Miller FJ. Clinical outcomes of patients after a negative spiral CT pulmonary arteriogram in the evaluation of acute pulmonary embolism. J Vasc Interv Radiol 1999;10:707–12. [DOI] [PubMed]
- 87.Garg K, Sieler H, Welsh CH, Johnston RJ, Russ PD. Clinical validity of helical CT being interpreted as negative for pulmonary embolism: implications for patient treatment. AJR Am J Roentgenol 1999;172:1627–31. [DOI] [PubMed]
- 88.Verhoek G, Costello P, Khoo EW, Wu R, Kat E, Fitridge RA. Carotid bifurcation CT angiography: assessment of interactive volume rendering. J Comput Assist Tomogr 1999;23:590–6. [DOI] [PubMed]
- 89.Wise SW, Hopper KD, Ten Have T, Schwartz T. Measuring carotid artery stenosis using CT angiography: the dilemma of artifactual lumen eccentricity. AJR Am J Roentgenol 1998;170:919–23. [DOI] [PubMed]


