

Abstract
In prior research, perceived low neighborhood social cohesion (nSC) has been associated with prevalence of type 2 diabetes mellitus (T2DM); however, few studies have investigated the nSC-T2DM relationship among a large, racially/ethnically diverse, and nationally representative sample of the U.S. population. We used National Health Interview Survey (2013–2018) data to determine overall, age-, sex/gender-, and racial/ethnic-specific associations between nSC and T2DM among 170,432 adults. Self-reported nSC was categorized as low, medium, and high. T2DM was determined by participants being told they had diabetes by a health professional. We used Poisson regression with robust variance to estimate prevalence ratios (PRs) and 95% confidence intervals (CI) while adjusting for confounders. Mean age was 47.4 ± 0.1 years, 52% were women, and 68.8% self-identified as Non-Hispanic (NH)-White. Low vs. high nSC was associated with a higher prevalence of T2DM (PR=1.17 [95% CI: 1.11–1.22]), after adjustment. A higher prevalence of T2DM was observed among participants 31–49 years old who perceived low vs. high nSC (PR=1.36 [95% CI: 1.20–1.54]) and among participants ≥50 years old (PR=1.18 [95% CI: 1.13–1.24]). Hispanic/Latinx women 18–30 years old in neighborhoods with low vs. high nSC had a higher prevalence of T2DM (PR=3.70 [95% CI: 1.40–9.80]), whereas NH-Black women 18–30 years old in neighborhoods with medium vs. high nSC had a lower prevalence of T2DM (PR=0.35 [95% CI: 0.14–0.89]). Our findings support the literature by demonstrating an association between neighborhood environment and T2DM as well as extend it by identifying determinants for intervention for T2DM.
Keywords: Residence characteristics, Community support, Social support, Type 2 Diabetes Mellitus, Minoritized Groups
INTRODUCTION
Approximately one in ten Americans have diabetes and, among them, an estimated 95% have type 2 diabetes mellitus (T2DM)1. Additionally, in 2015, 35% of American adults, equivalent to 88 million people, had prediabetes and were at risk of T2DM1,2. The prevalence of T2DM is particularly high among older adults (≥65 years old), men, and Non-Hispanic (NH)-Black, NH-Asian, and Hispanic/Latinx adults1. While individual risk factors of T2DM (e.g., physical inactivity, high glycemic diets, and higher body mass index) have been identified3,4, a growing body of research has linked health behaviors and risk factors for chronic disease, including T2DM, to the neighborhood environment5–9, which is important to consider as a potential target for intervention.
Physical and social features of the neighborhood environment may contribute to the prevalence of T2DM through health constraining or enhancing factors, such as access to grocery stores and parks with green space, perceived neighborhood safety, neighborhood violence, and neighborhood social cohesion (nSC)5,8. nSC, or the degree of connectedness, solidarity, and trust among people within a community10, may reduce the prevalence of T2DM by increasing perceived safety, reinforcing social norms of positive health behaviors, and reducing stress5. Research has shown that neighborhoods perceived as having high social cohesion are associated with higher rates of physical activity11, lower incidence of T2DM12, and lower prevalence of chronic illnesses including myocardial infarction13 and stroke14. Conversely, neighborhoods perceived as less cohesive are associated with greater exposure to daily stressors and higher prevalence of T2DM12,15. Since structural patterns of privilege and oppression operate and produce social and economic inequalities along the axes of age, gender, and race, we adopted an intersectional approach to evaluate how the relationship between nSC and T2DM may differentially impact individuals with intersecting social identities16–20. For instance, residential segregation relegated Black women to neighborhoods with underfunded public schools, which limited their job prospects to lower paid service positions, subsequently increasing their economic insecurity as they age due to the wage gap21–25.
To our knowledge, no study has examined the nSC-T2DM relationship at the intersection of age, sex/gender, and race/ethnicity. Therefore, it is important to explicitly study how nSC and T2DM may differ by age, sex/gender, and race/ethnicity. We used data from the National Health Interview Survey to address these gaps in the literature by estimating the overall, age-, sex/gender-, and race/ethnic-specific cross-sectional associations between nSC and T2DM. We hypothesized that living in a neighborhood perceived as having low and medium social cohesion compared to high social cohesion would be associated with a higher prevalence of T2DM among all participants. In addition, we hypothesized the magnitude of the association will be stronger for ≥50 years old participants, women, and minoritized racial/ethnic groups. We also hypothesized that the associations between nSC and T2DM would be stronger among women of minoritized racial/ethnic groups who are ≥50 years old compared to their NH-White counterparts. Lastly, we hypothesized that the associations between nSC and T2DM would be stronger among men of minoritized racial/ethnic groups who are ≥50 years old compared to NH-White men who are ≥50 years old.
METHODS
Data Source: National Health Interview Survey
National Health Interview Survey (NHIS) data from survey years 2013 to 2018 were retrieved from the IPUMS Health Surveys database26. The details of the NHIS are discussed elsewhere27. Briefly, NHIS is an annual cross-sectional household survey conducted in English and Spanish that covers topics such as general health status, the distribution of acute and chronic illness, access to and use of medical services, and health behaviors among civilian non-institutionalized U.S. population. Trained interviewers conduct computer-assisted face-to-face interviews among each randomly sampled household. Health-related information is collected from a randomly selected adult and child, if present although not included in the current study, within a household. The response rate for the adult sample is 56.1%, ranging from 61.2% (2013) to 53.1% (2018). NHIS uses a multistage sample design that involves stratification, clustering, and oversampling of specific population subgroups to obtain a national representative sample. Sampling weights were used in all analyses to account for the complex research design, nonresponse, and oversampling of certain groups (e.g., minoritized races/ethnicities, older adults). The National Center for Health Statistics Review Board approved NHIS protocols. Each study participant provided informed consent to the NHIS, and the National Institute of Environmental Health Sciences’ Institutional Review Board waived approval for publicly available, secondary data with no identifiable information.
Study Population
Adult participants (≥18 years of age) from all 50 states and the District of Columbia were included in this study. Of the 190,113 participants, individuals with missing data for race/ethnicity (n=3,612), T2DM (n=223), or nSC (n=14,385) were excluded. Native American participants (n=1,367) were excluded due to small sample size. Also, participants 25 years of age or younger who reported taking insulin for diabetes (n=94) were excluded from the analysis to minimize the possibility of including type 1 diabetes cases. The final analytical sample included 170,432 participants (Supplemental Figure 1). We compared sociodemographic characteristics of participants included vs. excluded from the study (Supplemental Table 1).
Exposure Assessment: Neighborhood Social Cohesion
Perceived nSC was measured using a modified version of the four-item scale developed for the Project on Human Development in Chicago Neighborhoods Community Survey28. Participants were asked based on their perception, how much they agreed or disagreed with the following statements: 1) people in this neighborhood help each other out; 2) there are people I can count on in this neighborhood; 3) people in this neighborhood can be trusted; and 4) this is close-knit neighborhood. Responses were reported on a Likert scale: 1= definitely agree, 2=somewhat agree, 3=somewhat disagree, and 4=definitely disagree. The responses were reverse coded and summed to create a scale with higher values representing greater perceived levels of nSC (range of 4 – 16; Cronbach’s alpha=0.921 suggesting high internal consistency). nSC scores were further categorized into three groups based on previous literature29: low (<12), medium (12–14), and high (≥15).
Outcome Assessment: Self-report Type 2 Diabetes Mellitus
T2DM was measured by asking participants, “Have you ever been told by a doctor or health professional that you have diabetes or sugar diabetes?”. Responses were yes, no, or borderline. We limited the sample to those who responded yes or no. Responses labeled as borderline (n = 3,695, 2%) were combined with participants’ response to the following prediabetes question, “Have you ever been told by a doctor or other health professional that you have any of the following: prediabetes; impaired fasting glucose; impaired glucose tolerance; borderline diabetes; or high blood sugar?” These responses were categorized as prediabetes and included in a sensitivity analysis combined with T2DM as the outcome variable (Supplemental Tables 2 and 3).
Potential Confounders
Sociodemographic characteristics of participants considered potential confounders based on prior literature30,31 included age (18–30, 31–49, and ≥50 years old), sex/gender (women or men), race/ethnicity (NH-White, NH-Black, Hispanic/Latinx, Asian), educational attainment (<high school, high school graduate or General Educational Development (GED), some college, and ≥college), poverty status (above or below), marital status (married/living with partner/cohabitating, divorced/widowed/separated, or single/no live-in partner), region of residence (Northeast, Midwest, South, West), and U.S. nativity status/born in the U.S. (yes, no).
Potential Modifiers: Age, Sex/Gender, and Race/Ethnicity
Participants self-identified their age, sex/gender, and race/ethnicity. Age was categorized as 18–30, 31–49, and ≥50 years old. Sex/Gender was measured in a binary manner (i.e., woman or man). Since the NHIS uses self-reported data for sex where it is unclear how participants perceived this question in terms of biological sex or the social construct of gender, we combined sex and gender. Race/ethnicity was categorized as NH-White, NH-Black, Hispanic/Latinx (of any race), and Asian.
Statistical Analyses
For descriptive statistics, we estimated means with standard error of continuous variables and weighted percentages of categorical variables after applying direct age standardization using the 2010 U.S. Census as the standard population. We compared three levels of nSC across sociodemographic characteristics for all participants using ANOVA and chi-square tests. We employed Poisson regression with robust variance to directly estimate prevalence ratios (PR) and 95% confidence intervals (CIs) of perceived low and medium vs. high (reference) nSC for T2DM overall, by age, sex/gender, race/ethnicity, and age-sex/gender-race/ethnicity. To test for differences by age, sex/gender, and race/ethnicity, we included respective interaction terms (e.g., nSC*race/ethnicity) to the overall model. All analyses were weighted for the survey’s complex sampling design. Based on our review of prior literature and construction of directed acyclic graphs (DAGs), the models were adjusted for the following confounders (when not stratified by the factor): age, sex/gender, race/ethnicity, educational attainment, poverty status, marital/co-habiting status, region of residence, and U.S. nativity. Analyses were conducted in SAS version 9.4 for Windows (Cary, North Carolina), and a two-sided p-value of 0.05 was used to determine statistical significance.
In sensitivity analyses, we first combined prediabetes and T2DM as our outcome (Supplemental Table 2). Second, we – in an exploratory manner – investigated the following characteristics after identifying them as potential mediators between nSC and T2DM in our DAG. Health behaviors included sleep duration (<6 hours, <7 hours, 7–9 hours, >9 hours), trouble falling asleep (≥3 nights per week), trouble staying asleep (≥3 nights per week), insomnia symptoms (trouble staying or falling asleep ≥3 nights per week), woke up feeling unrested (≥3 nights per week), take sleep medication (≥3 nights per week), and alcohol consumption (never, former, or current)32–35 (Supplemental Table 3). Clinical characteristics included general health status (excellent/very good, food, or fair/poor) and serious mental illness defined as a score ≥13 on the Kessler-6 psychological distress scale36 (yes or no). Lastly, a dichotomized measure of “ideal” cardiovascular health was estimated based on meeting all of the following health behavior and clinical characteristics: never smoked or former smoker (including quitting smoking >12 months prior to interview); meeting physical activity guidelines defined as ≥150 minutes/week of moderate intensity, ≥75 minutes/week of vigorous intensity, or ≥150 minutes/week of moderate and vigorous intensity; recommended BMI (i.e., 18.5–<25 kg/m2); and reported no prior diagnosis of dyslipidemia or hypertension by a healthcare provider37.
RESULTS
Study Population Characteristics
Among 170,432 participants, approximately one third perceived their neighborhoods as low (32%), medium (33%), or high (35%) nSC (Table 1). The mean age was 47.4±0.10 years. Approximately 52% were women and 68.8% self-identified as NH-White, 11.2% as NH-Black, 14.6% Hispanic/Latinx, and 5.4% Asian. The prevalence of reported T2DM was 11.1%.
Table 1.
Age-standardized Sociodemographic, Health Behavior, and Clinical Characteristics among U.S. Adults Reporting Low, Medium, and High Neighborhood Social Cohesion, National Health Interview Survey, 2013–2018 (N=170,432)a
| Neighborhood Social Cohesion | ||||
|---|---|---|---|---|
| Low n=54,603 (32%) | Medium n=56,172 (33%) | High n=59,657 (35%) | Overall N=170,432 | |
| Sociodemographic Characteristics | ||||
| Age in years, mean (S.D.) * | 44.1 (0.13) | 47.2 (0.13) | 50.8 (0.14) | 47.4 (0.10) |
| 18–30 | 18.6% | 16.1% | 13.7% | 16.3% |
| 31–49 | 21.0% | 23.5% | 26.0% | 23.4% |
| ≥50 | 60.3% | 60.3% | 60.3% | 60.3% |
| Sex/Gender * | ||||
| Women | 53.2% | 49.5% | 53.0% | 51.9% |
| Race/ethnicity * | ||||
| NH-White | 61.2% | 67.8% | 76.8% | 68.8% |
| NH-Black | 14.2% | 11.7% | 7.9% | 11.2% |
| Hispanic/Latinx | 19.4% | 14.2% | 10.4% | 14.6% |
| Asian | 5.2% | 6.2% | 4.9% | 5.4% |
| Occupation class * | ||||
| Professional/management | 17.4% | 22.7% | 23.5% | 21.4% |
| Support services | 44.1% | 44.3% | 46.4% | 45.1% |
| Laborers | 38.5% | 33.0% | 30.1% | 33.6% |
| Educational attainment * | ||||
| <High school | 13.8% | 9.6% | 8.4% | 10.5% |
| High school graduate | 30.0% | 26.5% | 26.2% | 27.5% |
| Some college | 30.9% | 29.6% | 29.7% | 30.1% |
| ≥College | 25.3% | 34.2% | 35.8% | 31.9% |
| Annual household income * | ||||
| <$35,000 | 37.6% | 26.7% | 23.0% | 28.9% |
| $35-$74,999 | 32.0% | 30.1% | 28.0% | 30.1% |
| ≥$75,000 | 30.4% | 43.3% | 49.0% | 41.0% |
| Unemployed/not in labor force * | 44.0% | 40.0% | 39.8% | 41.2% |
| Living in poverty (<100% Fed Poverty Level) * | 15.6% | 9.9% | 8.2% | 11.1% |
| Food security * | ||||
| Very low to low | 14.2% | 7.8% | 5.4% | 8.9% |
| Marginal | 8.5% | 6.0% | 4.5% | 6.3% |
| High | 77.3% | 86.2% | 90.1% | 84.8% |
| Marital status/co-habiting status * | ||||
| Married/living with partner/co-habited | 55.1% | 62.2% | 66.5% | 61.5% |
| Divorced/widowed | 24.1% | 19.8% | 18.5% | 20.5% |
| Single/no live-in partner | 20.8% | 18.0% | 15.0% | 17.9% |
| Region of residence * | ||||
| Northeast | 18.0% | 18.9% | 18.0% | 18.2% |
| Midwest | 21.1% | 22.5% | 23.7% | 22.5% |
| South | 36.3% | 35.7% | 37.9% | 36.7% |
| West | 24.5% | 22.9% | 20.5% | 22.6% |
| U.S. Nativity/Born in the U.S. (yes) * | 78.1% | 81.8% | 86.3% | 82.2% |
| Health Behaviors | Low | Medium | High | Overall |
| Sleep duration * | ||||
| <6 hours | 11.8% | 7.9% | 7.6% | 9.0% |
| <7 hours | 36.2% | 30.5% | 27.9% | 31.3% |
| 7–9 hours (recommended) | 59.2% | 65.8% | 68.1% | 64.6% |
| >9 hours | 4.6% | 3.7% | 3.9% | 4.0% |
| Trouble falling asleep (≥3 nights) * | 25.6% | 18.7% | 16.7% | 20.1% |
| Trouble staying asleep (≥3 nights) * | 32.4% | 26.4% | 24.5% | 27.5% |
| Insomnia symptomsb * | 39.3% | 31.8% | 29.4% | 33.2% |
| Woke up feeling unrested (≥3 days) * | 50.8% | 42.2% | 37.1% | 43.0% |
| Sleep medication (≥3 nights) * | 11.5% | 9.0% | 9.2% | 9.8% |
| Smoking status * | ||||
| Never/quit >12 months prior | 80.4% | 84.7% | 85.6% | 83.7% |
| Former | 1.5% | 1.3% | 1.2% | 1.3% |
| Current | 18.2% | 14.0% | 13.2% | 15.0% |
| Alcohol consumption * | ||||
| Never | 20.5% | 18.7% | 19.5% | 19.6% |
| Former | 17.7% | 14.6% | 14.1% | 15.2% |
| Current | 61.8% | 66.6% | 66.5% | 65.2% |
| Leisure-time physical activity (PA) * | ||||
| Never/unable | 38.4% | 30.7% | 28.7% | 32.3% |
| Does not meet PA guidelines | 19.3% | 19.0% | 18.2% | 18.8% |
| Meets PA guidelinesc | 42.4% | 50.3% | 53.1% | 48.9% |
| Clinical Characteristics | Low | Medium | High | Overall |
| Health status * | ||||
| Excellent/very good | 49.4% | 59.4% | 65.1% | 58.4% |
| Good | 30.5% | 27.6% | 23.9% | 27.3% |
| Fair/poor | 20.1% | 13.0% | 11.0% | 14.3% |
| Mental illnessd * | 5.9% | 2.7% | 2.3% | 3.5% |
| Body Mass Index (BMI) * | ||||
| Recommended (18.5-<25 km/m2) | 30.8% | 33.1% | 34.8% | 33.0% |
| Overweight (25–29.9 km/m2) | 34.6% | 36.6% | 36.5% | 36.0% |
| Obesity (≥30 kg/m2) | 34.6% | 30.3% | 28.7% | 31.0% |
| Dyslipidemiae * | 50.9% | 48.6% | 50.2% | 49.8% |
| Hypertensionf * | 38.7% | 35.3% | 33.8% | 35.7% |
| Prediabetesg * | 7.4% | 6.7% | 5.6% | 6.5% |
| Type 2 Diabetes Mellitush * | 13.5% | 10.6% | 9.8% | 11.1% |
| “Ideal” cardiovascular healthi * | 9.0% | 12.1% | 13.6% | 11.6% |
Note all estimates are weighted for the survey’s complex sampling design. All estimates are age-standardized to the U.S. 2010 population, except for age. Percentage may not sum to 100 due to missing values or rounding. SE= standard error.
Insomnia symptoms defined as either trouble staying or falling asleep 3+ times/week.
Meets physical activity guidelines defined as ≥150 minutes/week of moderate intensity or ≥75 minutes/week of vigorous intensity or ≥150 minutes/week of moderate and vigorous intensity.
Kessler 6-psychological distress scale score ≥13.
Dyslipidemia defined as high cholesterol in the 12 months prior to interview. Available for survey years 2011–2017.
Hypertension defined as ever told by a doctor had hypertension.
Prediabetes defined as ever told by a doctor had prediabetic condition or told they were borderline.
Type 2 Diabetes Mellitus (T2DM) defined as ever told by a doctor or health professional that you have diabetes or sugar diabetes
“Ideal” cardiovascular health includes never smoking/quit >12 months prior to interview, body mass index 18.5 - <25 kg/m2, meeting physical activity guidelines, and no prior diagnosis of dyslipidemia, hypertension, or prediabetes.
two-sided p<0.05 for ANOVA test or Chi-Square test for differences between neighborhood social cohesion categories.
A higher percentage of participants aged 18–30 years old (18.6%) lived in a neighborhood with low compared to medium (16.1%) and high (13.7%) nSC. Alternatively, a higher percentage of participants aged 31–49 years old (26.0%) lived in a neighborhood with high compared to medium (23.5%) and low (21.0%) nSC. Participants aged ≥50 years comprised 60% of the population across low, medium, and high nSC. There were no substantial differences in the proportion of women and men living in neighborhoods with low and high nSC. A higher percentage of NH-Black (14.2%) and Hispanic/Latinx (19.4%) participants lived in a neighborhood with low nSC compared to medium (11.7% and 14.2%, respectively) and high (7.9% and 10.4%, respectively) nSC. A higher percentage of participants experiencing very low to low (14.2%) food security lived in a neighborhood with low nSC compared to medium (7.8%) and high (5.4%) nSC. Overall, the prevalence of T2DM was higher among participants who reported living in a neighborhood with low (13.5%) compared to medium (10.6%) and high (9.8%) nSC (Figure 1). Additional sociodemographic characteristics as well as distributions of nSC by age, sex/gender, and race/ethnicity are provided in the Supplemental Tables 4–8.
Figure 1.
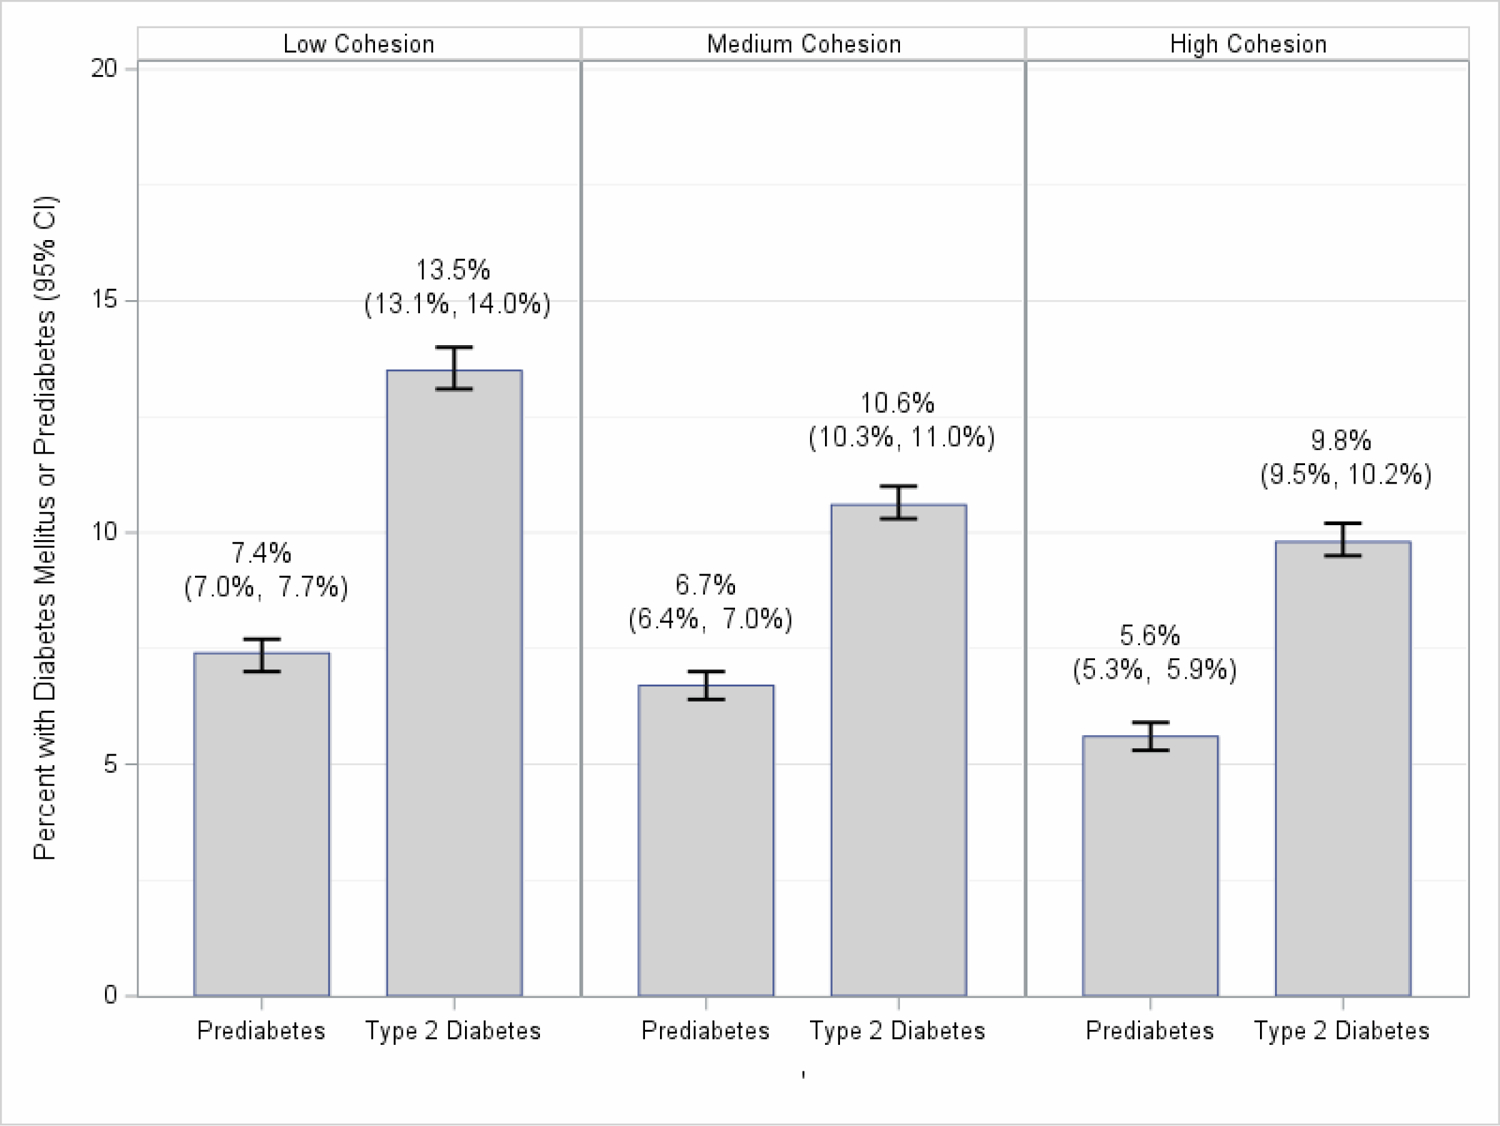
Percentage of Participants with Type 2 Diabetes Mellitus or Prediabetes and 95% Confidence Intervals by Low, Medium, and High Neighborhood Social Cohesion among U.S. Adults, National Health Interview Survey, 2013–2018 (N=170,432)
Neighborhood Social Cohesion and Type 2 Diabetes Mellitus in the Overall Population
Participants who lived in a neighborhood with low vs. high nSC had a 22% (PR=1.22 [95% CI: 1.16–1.27]) higher prevalence of T2DM, after adjustment (Table 2). In our sensitivity analyses, where we combined prediabetes and T2DM, there were no substantial differences between these results (Supplemental Table 2) and our main findings. However, we did observe attenuated estimates after additionally adjusting for potential mediators (i.e., health behaviors and clinical characteristics) (Supplemental Table 3). For example, those living in low nSC had 5% (PR=1.05 [95% CI: 1.02–1.09]) higher prevalence of prediabetes/T2DM while adjusting for potential mediators compared to the 25% higher prediabetes/T2DM prevalence without adjustment for potential mediators (PR=1.25 [95% CI: 1.20–1.29]; Supplemental Table 2).
Table 2.
Prevalence Ratios of Type 2 Diabetes Mellitus by Low and Medium Compared to High Neighborhood Social Cohesion among U.S. Adults, Overall and within Racial/Ethnic Groups by Sex/Gender and Age, National Health Interview Survey, 2013–2018 (N=170,432)
| Type 2 Diabetes Mellitus | ||||||
|---|---|---|---|---|---|---|
| Neighborhood Social Cohesion | Low | Medium | ||||
| Women N=30,575 | Men N=24,028 | All N=54,603 | Women N=29,579 | Men N=26,593 | All N=56,172 | |
| Overall 1 | 1.24 (1.17–1.32) | 1.19 (1.11–1.27) | 1.22 (1.16–1.27) | 1.02 (0.96–1.08) | 1.04 (0.98–1.10) | 1.03 (0.99–1.08) |
| 18–30 years old | 1.55 (0.94–2.57) | 1.01 (0.50–2.03) | 1.33 (0.87–2.01) | 1.32 (0.77–2.26) | 1.04 (0.50–2.16) | 1.20 (0.77–1.87) |
| 31–49 years old | 1.30 (1.10–1.53) | 1.43 (1.18–1.73) | 1.36 (1.20–1.54) | 1.02 (0.86–1.21) | 1.21 (1.00–1.46) | 1.12 (0.99–1.26) |
| ≥50 years old | 1.22 (1.14–1.29) | 1.15 (1.07–1.23) | 1.18 (1.13–1.24) | 1.01 (0.95–1.08) | 1.01 (0.95–1.08) | 1.01 (0.97–1.06) |
| NH-White 2 | 1.32 (1.22–1.43) | 1.22 (1.13–1.33) | 1.27 (1.20–1.34) | 1.01 (0.93–1.10) | 1.04 (0.96–1.11) | 1.03 (0.97–1.08) |
| NH-White 18–30 | 1.69 (0.82–3.48) | 1.05 (0.47–2.35) | 1.35 (0.78–2.35) | 1.70 (0.81–3.58) | 0.70 (0.27–1.78) | 1.11 (0.61–2.04) |
| NH-White 31–49 | 1.39 (1.10–1.74) | 1.79 (1.42–2.25) | 1.56 (1.33–1.83) | 1.01 (0.79–1.28) | 1.52 (1.19–1.92) | 1.24 (1.05–1.46) |
| NH-White ≥50 | 1.30 (1.19–1.41) | 1.16 (1.06–1.26) | 1.22 (1.15–1.30) | 1.00 (0.92–1.09) | 0.99 (0.91–1.07) | 1.00 (0.94–1.06) |
| NH-Black 3 | 1.02 (0.89–1.17) | 1.15 (0.97–1.37) | 1.07 (0.96–1.20) | 0.90 (0.78–1.04) | 1.09 (0.92–1.30) | 0.98 (0.87–1.09) |
| NH-Black 18–30 | 0.75 (0.32–1.76) | 1.16 (0.27–4.93) | 0.91 (0.41–2.01) | 0.35 (0.14–0.89) | 1.30 (0.31–5.49) | 0.60 (0.26–1.36) |
| NH-Black 31–49 | 1.05 (0.72–1.53) | 0.99 (0.59–1.67) | 0.99 (0.73–1.34) | 1.17 (0.81–1.71) | 0.92 (0.55–1.52) | 1.01 (0.73–1.39) |
| NH-Black ≥50 | 1.03 (0.89–1.19) | 1.19 (0.99–1.43) | 1.09 (0.97–1.22) | 0.88 (0.75–1.03) | 1.12 (0.93–1.36) | 0.98 (0.86–1.11) |
| Hispanic/Latinx 4 | 1.23 (1.04–1.44) | 1.12 (0.95–1.33) | 1.18 (1.04–1.33) | 1.08 (0.92–1.27) | 1.01 (0.84–1.21) | 1.05 (0.92–1.19) |
| Hispanic/Latinx 18–30 | 3.70 (1.40–9.80) | 1.41 (0.21–9.45) | 2.56 (0.98–6.65) | 2.26 (0.73–7.01) | 2.81 (0.55–14.50) | 2.60 (0.94–7.20) |
| Hispanic/Latinx 31–49 | 1.23 (0.87–1.76) | 1.07 (0.72–1.61) | 1.17 (0.89–1.55) | 0.83 (0.57–1.20) | 0.89 (0.58–1.35) | 0.87 (0.67–1.14) |
| Hispanic/Latinx ≥50 | 1.16 (0.97–1.40) | 1.13 (0.95–1.35) | 1.15 (1.01–1.30) | 1.15 (0.96–1.37) | 1.02 (0.85–1.22) | 1.08 (0.94–1.24) |
| Asian 5 | 1.15 (0.84–1.56) | 1.13 (0.86–1.50) | 1.12 (0.90–1.40) | 1.17 (0.87–1.58) | 0.99 (0.75–1.31) | 1.07 (0.86–1.32) |
| Asian 18–30 | NE | NE | NE | NE | NE | NE |
| Asian 31–49 | 1.20 (0.58–2.48) | 1.24 (0.63–2.41) | 1.25 (0.76–2.07) | 1.18 (0.57–2.41) | 0.68 (0.37–1.27) | 0.92 (0.55–1.53) |
| Asian ≥50 | 1.12 (0.80–1.56) | 1.09 (0.79–1.49) | 1.09 (0.85–1.39) | 1.08 (0.78–1.50) | 1.09 (0.80–1.50) | 1.07 (0.85–1.35) |
PR=Prevalence Ratio; CI=Confidence Interval; NE-Not Estimable All models were adjusted for age (18–30, 31–49, 50+ years), sex/gender (women, men), race/ethnicity (NH-White, NH-Black, Hispanic/Latinx, and Asian) (where appropriate), educational attainment (<high school, high school graduate, some college, ≥college), poverty status, marital/co-habiting status (married/living with partner or cohabitating, divorced/widowed/separated, single/no live-in partner), region of residence (Northeast, Midwest, South, West), and U.S, nativity.
Reference level: high neighborhood cohesion
Note. All estimates are weighted for the survey’s complex sampling design. Boldface indicates statistically significant results at the 0.05 level.
pint[nSC*gender]=0.011; pint[nSC*age]=0.803; pint[nSC*race/ethnicity]=0.066
pint[nSC*gender]=0.041; pint[nSC*age]=0.059
pint[nSC*gender]=0.211; pint[nSC*age]=0.418
pint[nSC*gender]=0.530; pint[nSC*age]=0.177
pint[nSC*gender]=0.672; pint[nSC*age]=0.239
Neighborhood Social Cohesion and Type 2 Diabetes Mellitus by Age Groups
Among participants aged ≥50 years old, 27%, 34%, and 40% of participants perceived low, medium and high nSC, respectively (Supplemental Table 8); those who lived in a neighborhood with low nSC had a 18% higher prevalence of T2DM (PR=1.18 [95% CI: 1.13–1.24]), after adjustment (Table 2). Participants aged 31–49 years old (33%) who lived in a neighborhood with low nSC had a 36% higher prevalence of T2DM (PR=1.36 [95% CI: 1.20–1.54]), after adjustment. There were no significant associations among participants aged 18–30 years old or among age groups who lived in a neighborhood with medium nSC and prevalence of T2DM.
Neighborhood Social Cohesion and Type 2 Diabetes Mellitus by Sex/Gender
After adjustment, the prevalence of T2DM was 24% (PR=1.24 [95% CI:1.17–1.32]) higher among women and 19% (PR=1.19 [95% CI: 1.11–1.27]) higher among men who lived in a neighborhood with low nSC (Table 2). There were no significant associations among women and men who lived in a neighborhood with medium nSC.
Neighborhood Social Cohesion and Type 2 Diabetes Mellitus by Race/Ethnicity
NH-White participants who lived in a neighborhood with low nSC had 27% higher prevalence of T2DM, after adjustment (PR=1.27 [95% CI:1.20–1.34]), which was comparable to estimates among Hispanic/Latinx participants (PR=1.18 [95% CI: 1.04–1.33]) but different from no association observed among NH-Black participants (PR=1.07 [95% CI:0.96–1.20]) (Table 2). There were no significant associations between nSC and T2DM among Asian participants.
Neighborhood Social Cohesion and Type 2 Diabetes Mellitus by Age Group, Sex/Gender, and Race/Ethnicity
Based on within-group comparisons, NH-White men 31–49 years old who perceived low nSC had a 79% higher prevalence of T2DM (PR=1.79 [95% CI: 1.42–2.25]), and NH-White women 31–49 years with low perceived nSC had a 39% higher prevalence (PR=1.39 [95% CI: 1.10–1.74]) (Table 2). Conversely, among NH-White participants ≥50 years old, PRs associated with low nSC were higher among women (PR=1.30 [95% CI:1.19–1.41]) compared to men (PR=1.16 [95% CI:1.06–1.26]). Hispanic/Latinx women 18–30 years old who lived in a neighborhood with perceived low nSC were 3.70 times higher prevalence (PR=3.70 [95% CI:1.40–9.80]); however, Hispanic/Latinx men in the same age group with low nSC had a lower yet non-significant prevalence of T2DM (PR=1.41 [95% CI: 0.21–9.45]). NH-Black women 18–30 years old who lived in a neighborhood with perceived medium nSC had lower prevalence of T2DM (PR=0.53 [95% CI:0.14–0.89]); however, NH-Black men in the same age group with medium nSC had a higher yet non-significant prevalence of T2DM (PR=1.30 [95% CI:0.31–5.49], p-interactions >0.05).
DISCUSSION
Our study investigated the association between perceived nSC and prevalence of T2DM overall and by age, sex/gender, and race/ethnicity – an important area of research considering the growing prevalence of T2DM and its differential impact across the aforementioned social groups. We found that participants who reported living in less cohesive neighborhoods had higher prevalence of T2DM, as anticipated. Consistent with our hypothesis, age, sex/gender, and race/ethnicity are important modifiers of the nSC and T2DM relationship. We found evidence of effect modification between nSC and T2DM by age, sex/gender, and race/ethnicity separately and jointly, although not always in the direction we hypothesized. For example, since men have higher rates of T2DM than women1 and women are more impacted by the neighborhood social environment38–42, we hypothesized that we would observe effect modification by sex/gender. While our results indicate that the prevalence of T2DM is generally higher among women, the associations across sex/gender were similar.
Although previous studies have found that minoritized racial/ethnic groups are more likely to be exposed to neighborhood social features that can compromise social cohesion among neighbors and ultimately contribute to a higher prevalence of T2DM in the affected population5,8,12,43, in general we did not find statistically significant effect modifications among minoritized groups, except among Hispanic/Latinx adults. We also observed interesting and significant associations by age-sex/gender-race/ethnicity among NH-Black and Hispanic/Latinx women, although not all results were statistically significant. These findings could demonstrate that within a given context there could be a continuum of perspectives or experiences that could be influencing this relationship among minoritized racial/ethnic groups. For example, the current measurement of nSC does not account for interactions within public spaces that can create a sense of safety and social cohesion among strangers due to shared racial/ethnic experiences44. There is another perspective of selective solidarity - where distrust influences people to be individualistic, even within racial groups, due to historical and recent experiences of marginalization causing them to be wary of potentially new harmful interactions45. Applying an intersectional approach illuminates not only the context-specific realities of individuals with multiple and intersecting marginalized identities it also provides insight on how multiple and potentially competing embodied experiences can influence health behaviors and lifestyles.
Our study findings regarding the relationship between nSC and T2DM by age-sex/gender-race/ethnic groups suggest that multiple social categories intersect to influence the prevalence of T2DM. In supplemental analyses, we also observed attenuated associations when additionally adjusting for health behaviors and clinical confounders suggesting the potential pathways nSC can influence prediabetes/T2DM through lifestyle factors. nSC likely directly and indirectly influences prediabetes/T2DM by impacting established risk factors for T2DM, such as physical inactivity, high glycemic diet, and perceived stressors3,4,46. For example, cohesive neighborhoods with high perceived neighborhood safety and low neighborhood violence, may promote physical activity5,8. Similarly, neighbors observing others engaging in physical activity (e.g., walking outside, cycling, and playing basketball) may reinforce social norms and thus encourage physical activity. On the other hand, less cohesive neighborhoods shaped by low perceived safety and high neighborhood violence and crime, may increase stress, which subsequently impacts T2DM33,47.
This study has limitations. The cross-sectional design does not allow for causal inference nor a mediation analysis regarding nSC and prevalence of T2DM. Selection bias is possible since included and excluded participants differed; however, included participants had a lower prevalence of T2DM and had higher socioeconomic status as well as better health, suggesting our results may be underestimating this relationship. Further, the self-report data may introduce measurement error although numerous studies report a high percent of agreement between self-reported T2DM and medically diagnosed T2DM (≥93.3%)48–50. Given the NHIS is conducted in English and Spanish, this excludes participation from other language speakers. Additionally, this study did not account for neighborhood-level contextual factors, such as neighborhood socioeconomic status, urban-rural classification, and changes in the neighborhood environment and participants’ residential history, which are factors that may impact participants’ perceptions of nSC and prevalence of T2DM. We suggest future studies should employ longitudinal designs that account for 1) neighborhood-level characteristics, 2) the cumulative effect of residing in a neighborhood, 3) physical and social changes within the neighborhood environment, and 4) residential mobility among participants. Further, the small sample size among Native Americans as well as sex/gender being collected as a binary characteristic (i.e., man/woman) as opposed to a non-binary continuum, precluded potential investigations of these subpopulations in our analysis. Similarly, we did not examine intragroup differences within racial/ethnic groups (e.g., Asian, Hispanic/Latinx) due to data limitations but acknowledge that no racial/ethnic group is a monolith. Lastly, although our study is strengthened by the investigation of intersectional identities, small sample sizes resulting from stratifying by multiple characteristics limited our power to detect certain associations (e.g., Asian adults within sex/gender and age strata). Additional studies with more representation of diverse populations are warranted.
Strengths of the study include using a nationally representative sample generalizable to the U.S. population of NH-White, NH-Black, Hispanic/Latinx, and Asian adults. Further, this large sample size allowed robust stratification by age, sex/gender, and race/ethnicity, separately and jointly although we were unable to estimate associations among Asian subgroups due to a small sample size. Our estimated prevalence of T2DM (11.1%) is similar to the national estimate (10.2%)1. Moreover, our sensitivity analysis combining participants with pre-diabetes and T2DM generally showed similar results. An additional strength is the use of a validated scale to measure perceived nSC28 because subjective neighborhood measures (e.g., perceived nSC) have been shown to play an important role in explaining the relationship between neighborhood conditions and health51.
Our findings contribute to the literature by demonstrating an association between a modifiable feature of the neighborhood social environment and T2DM, which may serve as an effective intervention target. Observing different directions of the association between nSC and T2DM demonstrates the importance of considering how multiple social identities intersect and interact with the neighborhood environment to influence health. Not only should future studies employ an intersectional perspective but also policies and programs should consider subgroups in their design52. Future studies can benefit by adopting an intersectional approach to map the pathways between multiple identities and neighborhood conditions to create a healthier, more equitable society.
Supplementary Material
HIGHLIGHTS.
We examined neighborhood social cohesion and diabetes using cross-sectional NHIS data
Participants reported perceived neighborhood social cohesion (nSC) and diabetes
Lower perceived nSC is associated with a higher prevalence of type 2 diabetes
Age, sex/gender, and race/ethnicity modified the relationship
An intersectional approach reveals environmental influences on health disparities
Acknowledgements:
The authors would like to thank the National Center for Health Statistics for designing, conducting, and disseminating the survey and data files. We would like to thank all respondents who participated in the survey.
Disclosure of funding and Conflicts of interest:
This work was funded by the Intramural Program at the NIH, National Institute of Environmental Health Sciences (Z1AES103325). The funder had no role in the design, data collection, analysis or interpretation of data; writing the manuscript; or in the decision to submit the article for publication. The authors have no conflicts of interest to declare.
Footnotes
Publisher's Disclaimer: This is a PDF file of an unedited manuscript that has been accepted for publication. As a service to our customers we are providing this early version of the manuscript. The manuscript will undergo copyediting, typesetting, and review of the resulting proof before it is published in its final form. Please note that during the production process errors may be discovered which could affect the content, and all legal disclaimers that apply to the journal pertain.
Declaration of interests
The authors declare that they have no known competing financial interests or personal relationships that could have appeared to influence the work reported in this paper.
REFERENCES
- 1.Centers for Disease Control and Prevention. National Diabetes Statistics Report. 2020. Accessed November 10, 2020. https://www.cdc.gov/diabetes/data/statistics-report/index.html.
- 2.American Diabetes Association. Statistics About Diabetes. Accessed September 1, 2020. https://www.diabetes.org/resources/statistics/statistics-about-diabetes
- 3.Hu FB, Manson JE, Stampfer MJ, et al. Diet, Lifestyle, and the Risk of Type 2 Diabetes Mellitus in Women. New England Journal of Medicine. 2001;345(11):790–797. doi: 10.1056/NEJMoa010492 [DOI] [PubMed] [Google Scholar]
- 4.Mozaffarian D, Kamineni A, Carnethon M, Djoussé L, Mukamal KJ, Siscovick D. Lifestyle risk factors and new-onset diabetes mellitus in older adults: the cardiovascular health study. Arch Intern Med. 2009;169(8):798–807. doi: 10.1001/archinternmed.2009.21 [DOI] [PMC free article] [PubMed] [Google Scholar]
- 5.Diez Roux AV, Mair C. Neighborhoods and health. Annals of the New York Academy of Sciences. 2010;1186(1):125–145. doi: 10.1111/j.1749-6632.2009.05333.x [DOI] [PubMed] [Google Scholar]
- 6.Bilal U, Auchincloss AH, Diez-Roux AV. Neighborhood Environments and Diabetes Risk and Control. Current Diabetes Reports. 2018/07/11 2018;18(9):62. doi: 10.1007/s11892-018-1032-2 [DOI] [PubMed] [Google Scholar]
- 7.Piccolo RS, Duncan DT, Pearce N, McKinlay JB. The role of neighborhood characteristics in racial/ethnic disparities in type 2 diabetes: Results from the Boston Area Community Health (BACH) Survey. Social Science & Medicine. 2015/04/01/ 2015;130:79–90. doi: 10.1016/j.socscimed.2015.01.041 [DOI] [PMC free article] [PubMed] [Google Scholar]
- 8.Christine PJ, Auchincloss AH, Bertoni AG, et al. Longitudinal Associations Between Neighborhood Physical and Social Environments and Incident Type 2 Diabetes Mellitus: The Multi-Ethnic Study of Atherosclerosis (MESA). JAMA Intern Med. 2015;175(8):1311–1320. doi: 10.1001/jamainternmed.2015.2691 [DOI] [PMC free article] [PubMed] [Google Scholar]
- 9.Ludwig J, Sanbonmatsu L, Gennetian L, et al. Neighborhoods, Obesity, and Diabetes — A Randomized Social Experiment. New England Journal of Medicine. 2011;365(16):1509–1519. doi: 10.1056/NEJMsa1103216 [DOI] [PMC free article] [PubMed] [Google Scholar]
- 10.Kawachi I, Subramanian SV, Kim D. Social Capital and Health: A Decade of Progress and Beyond. In: Kawachi I, Subramanian SV, Kim D, eds. Social Capital and Health. Springer Science+Business Media, LLC; 2008:1–26. [Google Scholar]
- 11.Quinn TD, Wu F, Mody D, et al. Associations Between Neighborhood Social Cohesion and Physical Activity in the United States, National Health Interview Survey, 2017. Preventing Chronic Disease. 2019;16:E163. doi: 10.5888/pcd16.190085 [DOI] [PMC free article] [PubMed] [Google Scholar]
- 12.Gebreab SY, Hickson DA, Sims M, et al. Neighborhood social and physical environments and type 2 diabetes mellitus in African Americans: The Jackson Heart Study. Health Place. 2017;43:128–137. doi: 10.1016/j.healthplace.2016.12.001 [DOI] [PMC free article] [PubMed] [Google Scholar]
- 13.Kim ES, Hawes AM, Smith J. Perceived neighbourhood social cohesion and myocardial infarction. J Epidemiol Community Health. 2014;68(11):1020–1026. doi: 10.1136/jech-2014-204009 [DOI] [PMC free article] [PubMed] [Google Scholar]
- 14.Kim ES, Park N, Peterson C. Perceived neighborhood social cohesion and stroke. Social Science & Medicine. 2013/11/01/ 2013;97:49–55. doi: 10.1016/j.socscimed.2013.08.001 [DOI] [PubMed] [Google Scholar]
- 15.Robinette JW, Charles ST, Mogle JA, Almeida DM. Neighborhood cohesion and daily well-being: results from a diary study. Soc Sci Med. 2013;96:174–182. doi: 10.1016/j.socscimed.2013.07.027 [DOI] [PMC free article] [PubMed] [Google Scholar]
- 16.Bailey ZD, Krieger N, Agénor M, Graves J, Linos N, Bassett MT. Structural racism and health inequities in the USA: evidence and interventions. The Lancet. 2017;389(10077):1453–1463. doi: 10.1016/S0140-6736(17)30569-X [DOI] [PubMed] [Google Scholar]
- 17.Harris CI. Whiteness as Property. Harvard Law Review. 1993;106(8):1707–1791. doi: 10.2307/1341787 [DOI] [Google Scholar]
- 18.Bonilla-Silva E. Rethinking Racism: Toward a Structural Interpretation. American Sociological Review. 1997;62(3):465–480. doi: 10.2307/2657316 [DOI] [Google Scholar]
- 19.Bowleg L. The Problem With the Phrase Women and Minorities: Intersectionality—an Important Theoretical Framework for Public Health. Am J Public Health. 2012;102(7):1267–1273. doi: 10.2105/ajph.2012.300750 [DOI] [PMC free article] [PubMed] [Google Scholar]
- 20.Collins PH. Intersectionality’s Definitional Dilemmas. Annual Review of Sociology. 2015;41(1):1–20. doi: 10.1146/annurev-soc-073014-112142 [DOI] [Google Scholar]
- 21.Brown T. The Intersection and Accumulation of Racial and Gender Inequality: Black Women’s Wealth Trajectories. The Review of Black Political Economy. 2012;39(2):239–258. doi: 10.1007/s12114-011-9100-8 [DOI] [Google Scholar]
- 22.Collins PH. Black Feminist Thought: Knowledge, consciousness, and the politics of empowerment. Routledge; 2000. [Google Scholar]
- 23.Duffy M. Reproducing Labor Inequalities:Challenges for Feminists Conceptualizing Care at the Intersections of Gender, Race, and Class. Gender & Society. 2005;19(1):66–82. doi: 10.1177/0891243204269499 [DOI] [Google Scholar]
- 24.Wingfield AH. About Those 79 Cents. The Atlantic. https://www.theatlantic.com/business/archive/2016/10/79-cents/504386/ [Google Scholar]
- 25.Moore KK, Ghilarducci T. Intersectionality and Stratification in the Labor Market. Generations: Journal of the American Society on Aging. 2018;42(2):34–40. [Google Scholar]
- 26.Blewett LA, Drew JAR, King ML, Williams. KCW. Data from: IPUMS Health Surveys: National Health Interview Survey, Version 6.4 2019. Minneapolis, MN. doi: 10.18128/D070.V6.4 [DOI] [Google Scholar]
- 27.National Center for Health Statistics. National Health Interview Survey. Centers for Disease Control and Prevention; 2013–2018. p. https://www.cdc.gov/nchs/nhis/index.htm.
- 28.Sampson RJ, Raudenbush SW, Earls F. Neighborhoods and Violent Crime: A Multilevel Study of Collective Efficacy. Science. 1997;277(5328):918. doi: 10.1126/science.277.5328.918 [DOI] [PubMed] [Google Scholar]
- 29.Young MC, Gerber MW, Ash T, Horan CM, Taveras EM. Neighborhood social cohesion and sleep outcomes in the Native Hawaiian and Pacific Islander National Health Interview Survey. Sleep. 2018;41(9)doi: 10.1093/sleep/zsy097 [DOI] [PubMed] [Google Scholar]
- 30.Jennings V, Bamkole O. The Relationship between Social Cohesion and Urban Green Space: An Avenue for Health Promotion. Int J Environ Res Public Health. 2019;16(3):452. [DOI] [PMC free article] [PubMed] [Google Scholar]
- 31.Kim ES, Chen Y, Kawachi I, VanderWeele TJ. Perceived neighborhood social cohesion and subsequent health and well-being in older adults: An outcome-wide longitudinal approach. Health Place. 2020/11/01/ 2020;66:102420. doi: 10.1016/j.healthplace.2020.102420 [DOI] [PMC free article] [PubMed] [Google Scholar]
- 32.Piercy KL, Troiano RP, Ballard RM, et al. The Physical Activity Guidelines for Americans. JAMA. 2018;320(19):2020–2028. doi: 10.1001/jama.2018.14854 [DOI] [PMC free article] [PubMed] [Google Scholar]
- 33.Alhasan DM, Gaston SA, Jackson WB 2nd, Williams PC, Kawachi I, Jackson CL. Neighborhood Social Cohesion and Sleep Health by Age, Sex/Gender, and Race/Ethnicity in the United States. Int J Environ Res Public Health. 2020;17(24):9475. doi: 10.3390/ijerph17249475 [DOI] [PMC free article] [PubMed] [Google Scholar]
- 34.Anothaisintawee T, Reutrakul S, Van Cauter E, Thakkinstian A. Sleep disturbances compared to traditional risk factors for diabetes development: Systematic review and meta-analysis. Sleep Medicine Reviews. 2016/12/01/ 2016;30:11–24. doi: 10.1016/j.smrv.2015.10.002 [DOI] [PubMed] [Google Scholar]
- 35.Cappuccio FP, D’Elia L, Strazzullo P, Miller MA. Quantity and quality of sleep and incidence of type 2 diabetes: a systematic review and meta-analysis. Diabetes care. 2010;33(2):414–420. doi: 10.2337/dc09-1124 [DOI] [PMC free article] [PubMed] [Google Scholar]
- 36.Kessler RC, Barker PR, Colpe LJ, et al. Screening for Serious Mental Illness in the General Population. Archives of General Psychiatry. 2003;60(2):184–189. doi: 10.1001/archpsyc.60.2.184 [DOI] [PubMed] [Google Scholar]
- 37.Lloyd-Jones DM, Hong Y, Labarthe D, et al. Defining and Setting National Goals for Cardiovascular Health Promotion and Disease Reduction. Circulation. 2010;121(4):586–613. doi:doi: 10.1161/CIRCULATIONAHA.109.192703 [DOI] [PubMed] [Google Scholar]
- 38.Belle D. Gender differences in the social moderators of stress. In: Barnett R, Biener L, Baruch G, eds. Gender and Stress. The Free Press; 1987:257–277. [Google Scholar]
- 39.Michael YL, Berkman LF, Colditz GA, Kawachi I. Living Arrangements, Social Integration, and Change in Functional Health Status. Am J Epidemiol. 2001;153(2):123–131. doi: 10.1093/aje/153.2.123 [DOI] [PubMed] [Google Scholar]
- 40.Molinari C, Ahern M, Hendryx M. The relationship of community quality to the health of women and men. Social Science & Medicine. 1998/10/01/ 1998;47(8):1113–1120. doi: 10.1016/S0277-9536(98)00114-2 [DOI] [PubMed] [Google Scholar]
- 41.Guilcher SJT, Kaufman-Shriqui V, Hwang J, et al. The association between social cohesion in the neighborhood and body mass index (BMI): An examination of gendered differences among urban-dwelling Canadians. Prev Med. 2017/06/01/ 2017;99:293–298. doi: 10.1016/j.ypmed.2017.02.022 [DOI] [PubMed] [Google Scholar]
- 42.Kavanagh AM, Bentley R, Turrell G, Broom DH, Subramanian SV. Does gender modify associations between self rated health and the social and economic characteristics of local environments? J Epidemiol Community Health. 2006;60(6):490–495. doi: 10.1136/jech.2005.043562 [DOI] [PMC free article] [PubMed] [Google Scholar]
- 43.Lagisetty PA, Wen M, Choi H, Heisler M, Kanaya AM, Kandula NR. Neighborhood Social Cohesion and Prevalence of Hypertension and Diabetes in a South Asian Population. J Immigr Minor Health. 2016;18(6):1309–1316. doi: 10.1007/s10903-015-0308-8 [DOI] [PMC free article] [PubMed] [Google Scholar]
- 44.Raudenbush DT. Race and Interactions on Public Transportation: Social Cohesion and the Production of Common Norms and a Collective Black Identity. Symbolic Interaction. 2012;35(4):456–473. doi: 10.1002/symb.36 [DOI] [Google Scholar]
- 45.Raudenbush D. “I Stay by Myself”: Social Support, Distrust, and Selective Solidarity Among the Urban Poor. Sociological Forum. 2016;31(4):1018–1039. [Google Scholar]
- 46.Harris ML, Oldmeadow C, Hure A, Luu J, Loxton D, Attia J. Stress increases the risk of type 2 diabetes onset in women: A 12-year longitudinal study using causal modelling. PLoS One. 2017;12(2):e0172126–e0172126. doi: 10.1371/journal.pone.0172126 [DOI] [PMC free article] [PubMed] [Google Scholar]
- 47.Henderson H, Child S, Moore S, Moore JB, Kaczynski AT. The Influence of Neighborhood Aesthetics, Safety, and Social Cohesion on Perceived Stress in Disadvantaged Communities. American Journal of Community Psychology. 2016;58(1–2):80–88. doi: 10.1002/ajcp.12081 [DOI] [PubMed] [Google Scholar]
- 48.Okura Y, Urban LH, Mahoney DW, Jacobsen SJ, Rodeheffer RJ. Agreement between self-report questionnaires and medical record data was substantial for diabetes, hypertension, myocardial infarction and stroke but not for heart failure. Journal of Clinical Epidemiology. 2004/10/01/ 2004;57(10):1096–1103. doi: 10.1016/j.jclinepi.2004.04.005 [DOI] [PubMed] [Google Scholar]
- 49.El Fakiri F, Bruijnzeels MA, Hoes AW. No evidence for marked ethnic differences in accuracy of self-reported diabetes, hypertension, and hypercholesterolemia. Journal of Clinical Epidemiology. 2007/12/01/ 2007;60(12):1271–1279. doi: 10.1016/j.jclinepi.2007.02.014 [DOI] [PubMed] [Google Scholar]
- 50.Kriegsman DM, Penninx BW, van Eijk JT, Boeke AJ, Deeg DJ. Self-reports and general practitioner information on the presence of chronic diseases in community dwelling elderly. A study on the accuracy of patients’ self-reports and on determinants of inaccuracy. J Clin Epidemiol. Dec 1996;49(12):1407–17. doi: 10.1016/s0895-4356(96)00274-0 [DOI] [PubMed] [Google Scholar]
- 51.Weden MM, Carpiano RM, Robert SA. Subjective and objective neighborhood characteristics and adult health. Social Science & Medicine. 2008;66(6):1256–1270. doi: 10.1016/j.socscimed.2007.11.041 [DOI] [PubMed] [Google Scholar]
- 52.Williams PC, Binet A, Alhasan DM, Riley NM, Jackson CL. Urban Planning for Health Equity Must Employ an Intersectionality Framework. Journal of the American Planning Association. 2022:1–8. doi: 10.1080/01944363.2022.2079550 [DOI] [Google Scholar]
Associated Data
This section collects any data citations, data availability statements, or supplementary materials included in this article.