

Summary
Background:
Quantification of chamber size and systolic function is a fundamental component of cardiac imaging. However, the human heart is a complex structure with significant uncharacterized phenotypic variation beyond traditional metrics of size and function. Examining variation in cardiac shape can add to our ability to understand cardiovascular risk and pathophysiology.
Methods:
We measured the left ventricle (LV) sphericity index (short axis length / long axis length) using deep learning enabled image segmentation of cardiac magnetic resonance imaging data from the UK Biobank. Subjects with abnormal LV size or systolic function were excluded. The relationship between LV sphericity and cardiomyopathy was assessed using Cox analyses, genome-wide association studies, and two-sample Mendelian randomization.
Findings:
In a cohort of 38,897 subjects, we show that a one standard deviation increase in sphericity index is associated with a 47% increased incidence of cardiomyopathy (hazard ratio [HR] 1.47, 95% CI 1.10-1.98, P 0.01) and a 20% increased incidence of atrial fibrillation (HR 1.20, 95% CI 1.11-1.28, P <0.001), independent of clinical factors and traditional MRI measurements. We identify four loci associated with sphericity at genome-wide significance, and Mendelian randomization supports non-ischemic cardiomyopathy as causal for LV sphericity.
Conclusions:
Variation in LV sphericity in otherwise normal hearts predicts risk for cardiomyopathy and related outcomes and is caused by non-ischemic cardiomyopathy.
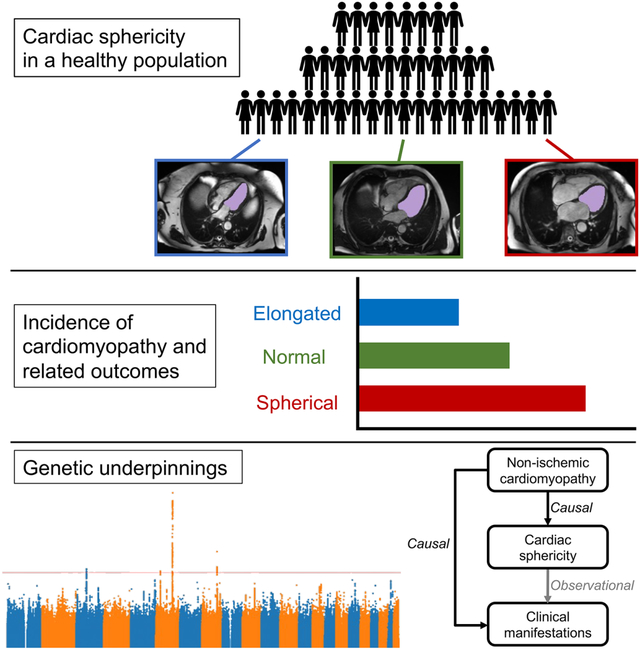
Graphical Abstract
eTOC
Vukadinovic et al. study cardiac sphericity in a population of over 30,000 healthy adults using deep learning-enabled automated image segmentation. They show that sphericity predicts risk for cardiomyopathy in otherwise normal hearts independent of traditional clinical and imaging factors.
Introduction
The heart is a complex three-dimensional structure exposed to continuous dynamic stress. Genetic risk factors, environmental stressors, and age-associated changes impact cardiac morphology and function over the lifespan in a multitude of ways. Dilation of cardiac chambers and/or decline in systolic function are key indicators of disease, and conventional imaging assessments aim to quantify such changes. In turn, there has been significant interest in understanding the genetic basis for variation in such phenotypes1-3.
The study of cardiac morphology may provide additional clinical and genetic insights. Specifically, large biobanks with cardiac imaging data now offer an opportunity to define and analyze variation in cardiac morphology that is incompletely quantified by traditional measurements but present in normal populations4. However, manual phenotyping is time-consuming and not feasible for testing novel phenotypes at larger scale. These challenges can be addressed by recent advances in deep learning and computer vision which allow for high throughput automated measurements of cardiac structures5-8, and may identify previously uncharacterized clinically-relevant phenotypic variation4,9,10.
Cardiomyopathies of different etiologies often result in a similar end-stage phenotype of a more round, spherical ventricle. Among individuals with known cardiac disease, increased sphericity of the left ventricle (LV) has been associated with adverse outcomes, including ventricular arrhythmias and death11-13. The sphericity index (defined as the ratio of LV short axis length divided by LV long axis length) is a simple metric of LV sphericity that has been previously applied to ventriculography11 and to echocardiography 14-16. In a small study of subjects without cardiovascular disease at baseline, a volumetric measurement of LV sphericity predicted incident heart failure and atrial fibrillation (AF)17. We hypothesized that within the spectrum of normal LV chamber size and systolic function, there exists variation in LV sphericity, and this variation may be a marker of cardiac risk with genetic underpinnings. To test this hypothesis, we used automated deep-learning segmentation of cardiac magnetic resonance imaging (MRI) data to estimate and analyze the sphericity index in the UK Biobank. We show that among subjects with normal LV chamber size and systolic function, increased sphericity predicts incident cardiovascular diseases, including cardiomyopathy, AF, and heart failure. Genetic analysis suggests a shared architecture between sphericity and non-ischemic cardiomyopathy (NICM), with NICM as a possible causal factor for LV sphericity among individuals with normal LV size and function.
Results
Measurement of the sphericity index using a convolutional neural network
In order to examine the clinical relevance and genetic influences of LV shape in the setting of normal size and function, we defined our main study cohort (n = 38,897) as UK Biobank participants with cardiac MRIs demonstrating normal LV end-diastolic volume (LVEDV), normal LV end-systolic volume (LVESV), and normal LV ejection fraction (LVEF) (Supplementary Figure 1). The baseline characteristics are shown in Table 1. We applied a fully convolutional neural network for semantic segmentation of cardiac chambers to cardiac MRIs from the UK Biobank. During end-diastole in each segmented 4-chamber image, we defined the smallest rectangle that fully encompassed the LV blood pool and measured the LV long axis length and short axis length. We defined the sphericity index as the ratio of the short axis length to the long axis length (Figure 1a). The correspondence between automated and human-read images (R2 0.73-0.79, mean absolute error [MAE] 0.04-0.06) was similar to human-human variation (R2 0.79, MAE 0.09) in the assessment of sphericity index on 100 random images. Figure 1b provides representative examples of the observed sphericity index in our study cohort. Sphericity index was similarly normally distributed in both men and women (Figure 1c) and showed a slight trend of increasing with age (Figure 1d). Within our study population, the sphericity index was not correlated with traditional MRI measurements of the LV (Supplementary Figure 2).
Table 1.
Cohort baseline characteristics
| Characteristic | N (%) or mean ± SD |
|---|---|
| N | 38897 |
| Age at MRI | 54.9 ± 7.6 |
| Male | 17983 (46.2%) |
| Self-identified White British | 32965 (84.7%) |
| Body mass index (kg/m2) | 26.5 ± 4.2 |
| Pulse rate | 67.7 ± 10.7 |
| Hypertension | 2388 (6.1%) |
| Diabetes | 947 (2.5%) |
| Prior myocardial infarction | 361 (0.01%) |
| LVEF (%) | 57.0 (4.47) |
| LVEDV (mL) | 135 ± 26.4 |
| LVESV (mL) | 58.4 ± 13.4 |
| LVEDVi (mL/m2) | 73.0 ± 11.6 |
| LVESVi (mL/m2) | 31.5 ± 6.2 |
Figure 1. Deep learning enabled measurement of left ventricular sphericity index.

a, Automated image segmentation of cardiac chambers was performed by applying a fully convolutional neural net to 4-chamber view cardiac MRI images. Sphericity index was defined by the ratio of the short and long axis lengths of a bounding box of the left ventricle. b, Distribution of the sphericity index in the study population and representative examples. c, The sphericity index is similarly normally distributed in male and female subjects. d, The sphericity index showed a small positive correlation with age. Concentric contour lines reflect increasing density of data point.
Phenome-wide association study of left ventricular sphericity
We broadly assessed for clinical associations with LV sphericity using a phenome-wide association study (PheWAS) approach (Figure 2), and we identified AF as the top association by P value (Pearson r 0.05, P 9.5x10⁻¹⁴). In comparison, LV long axis length had no association with AF (r −0.007, P 0.3), while LV short axis length showed a similar association with AF (r 0.05, P 2.6x10⁻¹⁴). Notably however, AF only ranked 8th by P value for short axis length. Other associations, including pulse rate (r −0.15, P 2.4x10−129), systolic blood pressure (r 0.09, P 2.3x10−43), and obesity (r 0.08, P 3.2x10−38) were substantially stronger for PheWAS of LV short axis length, demonstrating how measurements of organ size may associate with traits related to body size (Supplementary Figure 3). Conversely, metrics of shape may better highlight those associations independent of anthropometrics.
Figure 2. Phenome-wide association study of left ventricular sphericity index.

Upward pointing triangles represent positive correlations with sphericity index, and downward pointing triangles represent negative correlations. The horizontal red line reflects the threshold of Bonferroni significance for 966 tests (5x10⁻⁵). Associations meeting Bonferroni significance are labeled.
Left ventricular sphericity predicts incident disease
We next assessed whether the sphericity index predicts incident disease. We hypothesized that LV sphericity is a marker for cardiomyopathy. We therefore examined incident cardiomyopathy as well as clinical manifestations of cardiomyopathy, including AF, heart failure, and cardiac arrest. Examination of these outcomes is also supported by prior studies of sphericity11-13,17 and by the strong association with AF that we observed in our PheWAS. In a model adjusted for age at MRI and sex (Model 1), increased sphericity index was associated with increased risk for cardiomyopathy (hazard ratio [HR] 1.57, 95% CI 1.27-1.94, P <0.001), AF (HR 1.35, 95% CI 1.28-1.42, P <0.001), and heart failure (HR 1.37, 95% CI 1.24-1.53, P <0.001), with HR being reported per 1 standard deviation increase in sphericity index. There was no significant association with cardiac arrest. Stratifying the cohort by quintiles of sphericity index and comparing the top 20%, middle 60%, and bottom 20% shows that the relationship between sphericity index and risk extends across the distribution. Just as individuals with higher than median sphericity have increased disease incidence, individuals with lower than median sphericity have decreased disease incidence (Figure 3).
Figure 3. Risk of incident disease stratified by quintiles of sphericity index.

Time-to-event analysis was performed from time of MRI to first occurrence of (a) cardiomyopathy, (b) atrial fibrillation, (c) heart failure, and (d) cardiac arrest. Plots show cumulative incidence of disease stratified by sphericity index quintiles, comparing the top 20% (red), middle 60% (green), and bottom 20% (blue). Models were adjusted for age at MRI and sex.
To determine if the risk associated with increased sphericity can be accounted for by clinical factors, we assessed a second model (Model 2) with additional adjustments for BMI, pulse rate, hypertension, diabetes, and prior myocardial infarction. With these adjustments, the associations with cardiomyopathy, AF, and heart failure remained significant, and there was a modest attenuation in the hazard ratio for heart failure (Table 2). We then asked whether the sphericity index remains predictive once accounting for traditional MRI measurements of size and function. In models with additional adjustment for LV ejection fraction (Model 3a), LVEDV indexed on body surface area (LVEDVi) (Model 3b), or LVESV indexed on body surface area (LVESVi) (Model 3c), the associations with cardiomyopathy and AF remained significant, while the association with heart failure was lost. The same pattern was observed in a model adjusting for both LVEF and LVESVi (Table 2). In this fully adjusted model (Model 4), the association with cardiomyopathy remained robust (HR 1.47, 95% CI 1.10-1.98, P 0.01), while the association with AF partially attenuated (HR 1.20, 95% CI 1.11-1.28, P <0.001).
Table 2.
Risk of incident cardiomyopathy and related outcomes associated with increased sphericity index.
| Cardiomyopathy | Atrial fibrillation | Heart failure | Cardiac arrest | |||||
|---|---|---|---|---|---|---|---|---|
| HR (95% CI) | P | HR (95% CI) | P | HR (95% CI) | P | HR (95% CI) | P | |
|
Model 1
Age, sex |
1.57 (1.27-1.94) | <0.001 | 1.35 (1.28-1.42) | <0.001 | 1.37 (1.24-1.53) | <0.001 | 1.17 (0.88-1.54) | 0.3 |
|
Model 2 Model 1 + BMI, pulse rate, HTN, DM, prior MI |
1.62 (1.30-2.03) | <0.001 | 1.31 (1.23-1.38) | <0.001 | 1.23 (1.10-1.38) | <0.001 | 1.08 (0.81-1.44) | 0.6 |
|
Model 3a Model 2 + LVEF |
1.51 (1.13-2.02) | 0.005 | 1.23 (1.15-1.32) | <0.001 | 1.11 (0.96-1.28) | 0.2 | 1.01 (0.73-1.41) | 0.9 |
|
Model 3b Model 2 + LVEDVi |
1.46 (1.09-1.97) | 0.01 | 1.19 (1.11-1.28) | <0.001 | 1.13 (0.97-1.31) | 0.1 | 0.94 (0.67-1.34) | 0.7 |
|
Model 3c Model 2 + LVESVi |
1.47 (1.09-1.97) | 0.01 | 1.19 (1.11-1.28) | <0.001 | 1.09 (0.94-1.26) | 0.3 | 0.92 (0.65-1.31) | 0.7 |
|
Model 4 Model 2 + LVEF, LVESVi |
1.47 (1.10-1.98) | 0.01 | 1.20 (1.11-1.28) | <0.001 | 1.09 (0.94-1.26) | 0.3 | 0.92 (0.65-1.31) | 0.7 |
Hazard ratios (HR) reported per 1 standard deviation increase in sphericity index.
BMI = body mass index, HTN = hypertension, DM = diabetes mellitus, MI = myocardial infarction, LVEF = left ventricular ejection fraction, LVEDVi = left ventricular end-diastolic volume indexed on body surface area, LVESVi = left ventricular end-systolic volume indexed on body surface area
In summary, sphericity index is a predictor of incident cardiomyopathy, AF, and heart failure in a minimally adjusted model. Adjusting for clinical factors partially attenuates the association with heart failure. Additionally adjusting for traditional MRI measurements fully attenuates the association with heart failure and partially attenuates the association with AF. In all adjusted models, the association with cardiomyopathy shows little attenuation.
Genome-wide association study of left ventricular sphericity
We performed a genome-wide association study (GWAS) of common genetic variants and LV sphericity index and compared the results to the GWAS of the LV long and short axis lengths (Figure 4). We identified four loci associated with LV sphericity index at genome-wide significance (P ≤ 5x10⁻⁸): PLN, ANGPT1, PDZRN3, and HLA DR/DQ (Table 3). PLN is a gene well known for its causal role in dilated and arrhythmogenic cardiomyopathies18,19. ANGPT1 has not been associated with cardiomyopathy to date, but mouse experiments have demonstrated a critical role in mammalian heart development20,21. The PDZRN3 locus has been previously associated with electrocardiographic characteristics22 and LV fractal structure in prior GWAS4, and regulation of post-natal expression has been implicated in murine cardiac maturation and geometry23. The HLA DR/DQ locus has long been implicated in dilated cardiomyopathy24,25, and recent GWAS that included both normal and abnormal cardiac MRIs have identified this locus for both left and right chamber size metrics3,26.
Figure 4. Manhattan plots for genome-wide associations studies of left ventricular sphericity index, short axis length, and long axis length.

The red horizontal line represents a genome-wide significant P value of 5x10⁻⁸. Regions that reach genome-wide significant are labeled with candidate loci.
Table 3.
Lead variants and candidate genes for genome-wide significant loci of each left ventricle (LV) trait.
| LV trait | RSID | Chr | hg19 position |
Ref | Alt | Beta | P | Candidate gene |
|---|---|---|---|---|---|---|---|---|
| Sphericity index | rs11756438 | 6 | 118993632 | C | A | 0.004 | 1.16x10⁻¹⁵ | PLN |
| Sphericity index | rs1461990 | 8 | 108087628 | C | G | 0.003 | 4.90x10⁻¹⁰ | ANGPT1 |
| Sphericity index | none | 3 | 73578036 | AACACAC | A | 0.003 | 2.28x10⁻⁸ | PDZRN3 |
| Sphericity index | rs199682224 | 6 | 32486364 | G | T | 0.006 | 3.58x10⁻⁸ | HLA-DRB5 |
| Short axis length | rs57912492 | 6 | 118702621 | C | T | 0.24 | 2.43x10⁻¹⁰ | PLN |
| Short axis length | rs462797 | 16 | 22832777 | G | A | 0.46 | 2.93x10⁻⁸ | HS3ST2 |
| Short axis length | rs111692972 | 2 | 179669931 | C | T | −0.44 | 4.48x10⁻⁸ | TTN |
| Long axis length | none | 3 | 73578036 | AACACAC | A | −0.37 | 4.31x10⁻⁹ | PDZRN3 |
| Long axis length | rs72007904 | 8 | 108085680 | A | AACTATTC | −0.36 | 7.33x10⁻⁹ | ANGPT1 |
Comparing the GWAS of sphericity to LV short and long axis lengths highlights the value of studying shape-related phenotypes. Given the inherent interplay between sphericity and axis lengths, we expected to see overlap in genetic associations. Indeed, the genetic correlations with sphericity index were 0.64 (P 2.7x10⁻²⁵) and −0.63 (P 6.8x10⁻²⁷) for short axis and long axis lengths respectively. In terms of genome-wide significant loci, PLN was identified by both sphericity and short axis length but not long axis length. Notably, the significance of the association was substantially stronger for sphericity. Conversely, ANGPT1 and PDRZRN3 were identified by long axis length but not short axis length. Interestingly, the TTN gene was significant for short axis length (4.5x10⁻⁸) and suggestive for long axis length (P 1.5x10⁻⁷), but the association with sphericity was much weaker (P 2.1x10⁻⁵). This pattern might suggest that TTN impacts overall heart size more so than shape. To further investigate if the genetic architecture of sphericity is distinct from traditional measurements of size and function, we compared our results to a recent large GWAS of cardiac MRI phenotypes, including LVEF, LVEDVi, and LVESVi3. The genetic correlation between sphericity index and LVEF, LVEDVi, and LVESVi was −0.22 (P 0.07), 0.32 (P 5.8x10⁻⁷), and 0.32 (P 4.6x10⁻⁵) respectively. Of our lead variants for sphericity index, only one (rs11756438) was identified by the prior GWAS of these phenotypes (Supplementary Table 1). These results indicate that there are genetic drivers of LV sphericity that are distinct from those of LV size and function.
Relationship between sphericity and cardiomyopathy
We explored the relationship between LV sphericity and non-ischemic cardiomyopathy (NICM) by first measuring the genetic correlation. Given the findings from our Cox analysis, we also assessed AF as a comparison. For each outcome, we used recent large GWAS27,28, and correlations were assessed by LD score regression, a technique that is robust to potential sample overlap. We found a significant correlation between sphericity index and cardiomyopathy (rg 0.38, P 0.02) but no genetic correlation between sphericity and AF (rg 0.04, P 0.5).
We then assessed for evidence of causal relationships using bidirectional two-sample Mendelian randomization by inverse variance weighted meta-analysis. To do so, we used summary statistics for NICM and AF from the FinnGen project29, a cohort independent of the UK Biobank. When assessing sphericity index as an exposure, we found no evidence for causality with either NICM or AF. We then assessed sphericity index as an outcome. When using AF as an exposure, we found no evidence for causality with sphericity (Supplementary Table 2). However, when using NICM as an exposure, we found a significant causal relationship for sphericity (beta 0.002, P 0.03). In sensitivity analyses, the relationship remained significant by weighted medians (beta 0.001, P 0.049) but not by MR Egger (beta 0.0007, P 0.6). Together, these findings suggest that cardiomyopathy may be causal for increased sphericity even among individuals with normal measurements of LV systolic function and volumes.
Discussion
We have shown that the LV sphericity index is a predictor of incident cardiomyopathy and cardiomyopathy-related outcomes in healthy adults, independent of clinical factors and other imaging features. We were motivated to study LV sphericity by clinical experience and prior studies that suggested cardiac sphericity may be a marker of pathogenic remodeling. However, previous studies have focused primarily on sphericity after the onset of clinical disease11-16. We have added to these prior works by using deep learning to conduct the first large-scale study of sphericity in a healthy population, and we have shown that sphericity has genetic underpinnings relevant to the pathophysiology of cardiomyopathy.
Our study found that LV sphericity has overlapping genetic architecture with clinical NICM. Mendelian randomization indicates that NICM is causal for sphericity, but sphericity is not causal for NICM. This finding is consistent with other imaging phenotypes. For example, increased chamber size or decreased systolic function are the result of cardiomyopathy rather than the cause of it. Sphericity thus predicts clinical outcomes because it is a marker of subclinical disease. Under this model, genetic and environmental factors lead to molecular/cellular dysfunction. These micro-level changes may eventually manifest as macro-level changes impacting cardiac size, morphology, and function. The presence of increased sphericity may therefore identify individuals with underlying molecular/cellular abnormalities that place them at heightened risk for developing overt cardiomyopathy or related diseases such as atrial fibrillation. Additional work is needed to determine if sphericity index provides clinical utility in current practice settings where patients are being screened for the development of cardiomyopathies or where diagnosed patients are being monitored for disease progression. An important first step towards such efforts will be the validation of sphericity index as a predictive tool when applied to echocardiograms of healthy subjects.
In conclusion, this study demonstrates the utility of using deep learning and advanced imaging analysis to define and study non-traditional cardiac imaging risk biomarkers using the large-scale data that is increasingly available in biobanks. While conventional imaging metrics have significant diagnostic and prognostic value, some of these measurements have been adopted out of convenience or tradition. By representing a specific multi-dimensional remodeling phenotype, sphericity has emerged as a distinct morphologic trait with features not adequately captured by conventional measurements. We expect that the search space of potential imaging measurements is vast, and we have only begun to scratch at the surface of disease associations.
Limitations of the Study
The first limitation of this study is the use of a single cohort. The UK Biobank is known to have a healthy cohort bias and does not represent a random sample of the UK population. Moreover, the subjects who underwent MRI may reflect an even healthier subset of UK Biobank participants (Supplementary Table 3). Given our goal was to study the relevance of sphericity in a healthy population, we do not expect this bias to significantly impact our results. Still, replication in additional cohorts will be necessary to validate the use of sphericity for clinical risk prediction. A second limitation is that in order to limit inflation due to population substructure, our GWAS included only a subset of unrelated participants of similar European ancestry. A third limitation is the reliance on diagnostic codes to identify cases for our study outcomes. Although we used a curated set of outcomes provided by the UK Biobank for the research community, some misclassification is likely to occur. We expect misclassification to weaken the observed associations in our outcomes analyses. A fourth limitation is that we used uniform thresholds to identify subjects with normal LV size and function measurements, and we did not account for sex differences in these measurements. The result is the inclusion of a small number of subjects with measurements just outside the normal range when using sex-specific ranges. This limitation is at least partially addressed by our models that adjust for measurements of LV size and function and for sex. Fifth, sphericity index may not fully capture phenotypic variation within the left ventricle, as additional features of variable trabeculation, angle, and thickness simultaneously influence cardiac function. We hope this work motivates more studies of novel imaging phenotypes that might capture such variability.
STAR Methods
Resource Availability
Further information and requests for resources should be directed to and will be fulfilled by the lead contact, Shoa Clarke (shoa@stanford.edu)
Materials Availability
This study did not generate new unique reagents.
Data and Code Availability
This paper analyzes UK Biobank data, which is available after the approval of an application at https://www.ukbiobank.ac.uk.
All original code has been deposited at https://github.com/vukadinovic936/UKB and is publicly available as of the date of publication. DOIs are listed in the key resources table.
Key resources table
| REAGENT or RESOURCE | SOURCE | IDENTIFIER |
|---|---|---|
| Deposited data | ||
| Sphericity index GWAS summary statistics | This paper | https://my.locuszoom.org/gwas/834868/ |
| LV short axis GWAS summary statistics | This paper | https://my.locuszoom.org/gwas/983285/ |
| LV long axis GWAS summary statistics | This paper | https://my.locuszoom.org/gwas/865649/ |
| Software and algorithms | ||
| Sphericity Index Extractor | This paper | https://github.com/vukadinovic936/sphericity |
| Survival 3.5 | Therneau et al. | https://github.com/therneau/survival |
| Hail 0.2 | Neale Lab | https://github.com/hail-is/hail |
| LDSC 1.01 | Bulik-Sullivan et al. | https://github.com/bulik/ldsc |
| TwoSampleMR 0.5.6 | Hemani et al. | https://github.com/MRCIEU/TwoSampleMR |
Experimental Model and Subject Details
The UK Biobank (UKB) is a population-based cohort that links genetic and phenotypic data for approximately 500,000 adult participants from the United Kingdom30 31. Age, gender, and race were self-reported. Our analyses focused on ~48,000 participants who have undergone cardiac MRI32. A subset of this group that met quality control filters and that had normal MRI measurements (LV end-diastolic volume 88-218 mL, LV end-systolic volume 31-97 mL, and LV ejection fraction 48-70%)33 was used as the main cohort (Supplementary Figure 1). For the genome-wide association study (GWAS), we selected subjects from the main cohort who passed additional GWAS filters.
Method Details
Extraction of Sphericity Index Trait using Machine Learning
We downloaded cardiac MRI containing steady-state free precession image sequences of horizontal long-axis view. Each sequence is given as 210 × 208 × 50 matrix in DICOM format, with in-plane resolution 1.8 × 1.8 mm2. In the pre-processing phase, we converted DICOM images and manual annotations (.XML) to NIfTI format, which saves the sequence as a single 3d image for the sake of better file management.
We used a fully convolutional neural network5,34 for automated LV segmentation of MRI images. Trained weights were obtained from a prior work and inference was run on each video of each patient with cardiac MRIs in the UKB. For each individual, the semantic segmentation was manually evaluated and extreme outliers were excluded, as well as outliers in summary statistics provided from the UKB. We performed a segmentation quality check in two phases. We both heuristically checked (identifying when the segmentation was not continuous or implausibly small) and visually inspected segmentations to excluded patients with suboptimal segmentations.
For all images that passed quality check we created an automated bounding box around the segmentation of left ventricular blood pool (Figure 1a). The longer side of the rectangle was taken as LV long axis length (LVL), and the shorter side was taken as LV short axis length (LVS). Sphericity index is calculated as quotient of LVS and LVL . Higher value of sphericity index indicates more spherical appearance, and lower value indicates an elongated appearance of left ventricular chamber.
The automated measurement of sphericity index was validated by comparison to human measurement in a set of 100 images randomly selected from our study. Two cardiologists independently measured sphericity index on these images in a blinded fashion. The human-human and human-machine similarities in estimates were evaluated by the coefficient of determination (R2) and the mean absolute error (MAE).
Quantification and Statistical Analyses
PheWAS
Diagnostic data was downloaded as ICD10 codes, processed, and saved as diagnostic groups organized by phecodes using a mapping file provided by PheWAS Catalog35. Phenome-wide association studies (PheWAS)36 were performed by measuring the Pearson r correlation between sphericity index and each phecode. In addition, three quantitative measurements were assessed: pulse rate, systolic blood pressure, and diastolic blood pressure. A total of 966 correlations were assessed. Significant associations were identified as those with a P value below the Bonferroni-corrected threshold of 5x10⁻⁵.
Cox Survival Analysis
We performed a time-to-event analysis to assess the association of sphericity index with incident cardiomyopathy, AF, heart failure, and cardiac arrest, using the UKB first occurrence data. These outcomes are provided by the UKB as part of a curated set of outcomes derived from health record diagnostic codes. We defined days without incident as the time from the first MRI visit to the first occurrence of the given outcome, death, or last follow-up (March 31st, 2021). For outcomes of atrial fibrillation, heart failure, and cardiomyopathy, participants with the prevalent disease at the time of the first MRI visit were excluded. We measured the association between the sphericity index and each outcome using a multivariable Cox proportional hazards models. Clinical covariates (age, pulse rate, BMI, hypertension, diabetes, prior myocardial infarction) were determined at the time of MRI. For this analysis, the sphericity index was normalized to mean equaling 0 and standard deviation (SD) equaling 1, and the hazard ratio (HR) is reported as per 1-SD. We additionally stratified the cohort into the lower 20th, middle 60th, and upper 20th percent of the sphericity index and plotted adjusted cumulative incidence curves by strata.
Genome-wide association study
We used the UKB imputed genotype calls in BGEN v1.2 format. Samples were genotyped using the UK BiLEVE or UK Biobank Axiom arrays. Imputation was performed using the Haplotype Reference Consortium panel and the UK10K+1000 Genomes panel30. We used the QC files provided by UKB to create a GWAS cohort consisting of subjects who did not withdraw, were of inferred European ancestry, and were unrelated. Subjects with a genotype call rate < 0.98 were also removed. We considered variants with a minor allele frequency (MAF) ≥ 0.01, and we required genotyped variant to have a call rate ≥ 0.95 and imputed variants to have an INFO score ≥ 0.3. Variants with a Hardy-Weinberg equilibrium P value < 1x10⁻²⁰ were excluded. GWAS was done on a Spark 3.1.1 cluster, using library Hail 0.2 with Python version 3.6. The GWAS was adjusted for age at MRI and sex. We used the conventional P value of 5x10⁻⁸ as the threshold for defining genome-wide significance.
Genetic correlation
Genetic correlations were estimated using ldsc version 1.0137. For GWAS performed in this study (sphericity index, short axis length, long axis length), we used well imputed variants by filtering for INFO ≥ 0.9. For LVEF, LVEDVi, and LVESVi, we used previously published summary statistics3, and we filtered SNPs for INFO ≥ 0.9. For NICM and AF, we used summary statistics from previously published GWAS27,28, and we limited to well imputed variants by intersecting with HapMap3 variants (given INFO score was not provided). For all datasets, only variants with MAF ≥ 0.01 were used.
Mendelian randomization
Two-sample Mendelian randomization was conducted using the TwoSampleMR version 0.5.6 R package. We used a bidirectional approach with LV sphericity index as the exposure for the outcomes of NICM and AF and with LV sphericity as an outcome with NICM and AF as exposures. We used FinnGen29 release 6 GWAS summary statistics for NICM (finngen_R6_I9_NONISCHCARDMYOP_STRICT) and AF (finngen_R6_I9_AF) to assure non-overlapping samples. The FinnGen NICM strict phenotype excludes hypertrophic cardiomyopathy. For each exposure, the instrument variable was created by identifying independent significant or suggestive single nucleotide polymorphisms (SNPs) that could be harmonized to the outcome of interest unambiguously. Independent SNPs were defined using a clumping distance of 10 megabases and an R2 threshold of 0.001. Both sphericity index and NICM had a limited number of genome-wide significant variants after excluding palindromic SNPs and indels, and we therefore included SNPs with a suggestive P value of <10−6. This resulted in an 11-SNP instrument variable for sphericity index and a 7-SNP instrument variable for NICM. For AF, we only considered genome-wide significant SNPs (≤5x10⁻⁸), resulting in a 34-SNP instrument variable. We used inverse-variance weighted meta-analysis as our primary approach, and we used median weighted meta-analysis and MR Egger as sensitivity analyses.
Supplementary Material
Highlights.
Measurement of left ventricular sphericity can be automated using deep learning.
Sphericity predicts incident cardiomyopathy independent of traditional factors.
Genome-wide association study of sphericity identifies loci relevant to cardiomyopathy.
Context and Significance.
Imaging plays an important role in the diagnosis and management of heart disease. Modalities such as ultrasound and magnetic resonance imaging (MRI) allow clinicians to visualize manifestations of heart disease, including enlargement of the heart chambers or decrease in the pumping strength of the heart muscle. Here, researchers hypothesized that beyond size and function, shape may carry additional information about heart health. They use artificial intelligence to analyze >30,000 heart MRIs and show that even when the size and function is normal, the roundness (or “sphericity”) of the heart predicts risk for heart conditions. Additionally, heart roundness is impacted by genetic influences. Consideration of heart shape may help improve our ability to identify people at risk for developing heart disease.
Acknowledgements
This study was supported by grants K99-HL157421 (DO) and KL2TR003143 (SLC) from the National Institutes of Health.
Footnotes
Publisher's Disclaimer: This is a PDF file of an unedited manuscript that has been accepted for publication. As a service to our customers we are providing this early version of the manuscript. The manuscript will undergo copyediting, typesetting, and review of the resulting proof before it is published in its final form. Please note that during the production process errors may be discovered which could affect the content, and all legal disclaimers that apply to the journal pertain.
Declaration of Interests
D.L. has received research funding from Abbott Laboratories.
References
- 1.Vasan RS, Glazer NL, Felix JF, Lieb W, Wild PS, Felix SB, Watzinger N, Larson MG, Smith NL, Dehghan A, et al. (2009). Genetic variants associated with cardiac structure and function: a meta-analysis and replication of genome-wide association data. JAMA 302, 168–178. 10.1001/jama.2009.978-a. [DOI] [PMC free article] [PubMed] [Google Scholar]
- 2.Aung N, Vargas JD, Yang C, Cabrera CP, Warren HR, Fung K, Tzanis E, Barnes MR, Rotter JI, Taylor KD, et al. (2019). Genome-wide analysis of left ventricular image-derived phenotypes identifies fourteen loci associated with cardiac morphogenesis and heart failure development. Circulation 140, 1318–1330. 10.1161/CIRCULATIONAHA.119.041161. [DOI] [PMC free article] [PubMed] [Google Scholar]
- 3.Pirruccello JP, Bick A, Wang M, Chaffin M, Friedman S, Yao J, Guo X, Venkatesh BA, Taylor KD, Post WS, et al. (2020). Analysis of cardiac magnetic resonance imaging in 36,000 individuals yields genetic insights into dilated cardiomyopathy. Nat. Commun 11. 10.1038/s41467-020-15823-7. [DOI] [PMC free article] [PubMed] [Google Scholar]
- 4.Meyer HV, Dawes TJW, Serrani M, Bai W, Tokarczuk P, Cai J, de Marvao A, Henry A, Lumbers RT, Gierten J, et al. (2020). Genetic and functional insights into the fractal structure of the heart. Nature 584, 589–594. 10.1038/s41586-020-2635-8. [DOI] [PMC free article] [PubMed] [Google Scholar]
- 5.Bai W, Sinclair M, Tarroni G, Oktay O, Rajchl M, Vaillant G, Lee AM, Aung N, Lukaschuk E, Sanghvi MM, et al. (2018). Automated cardiovascular magnetic resonance image analysis with fully convolutional networks. J. Cardiovasc. Magn. Reson 20, 65. 10.1186/s12968-018-0471-x. [DOI] [PMC free article] [PubMed] [Google Scholar]
- 6.Ouyang D, He B, Ghorbani A, Yuan N, Ebinger J, Langlotz CP, Heidenreich PA, Harrington RA, Liang DH, Ashley EA, et al. (2020). Video-based AI for beat-to-beat assessment of cardiac function. Nature 580, 252–256. 10.1038/s41586-020-2145-8. [DOI] [PMC free article] [PubMed] [Google Scholar]
- 7.Bai W, Suzuki H, Huang J, Francis C, Wang S, Tarroni G, Guitton F, Aung N, Fung K, Petersen SE, et al. (2020). A population-based phenome-wide association study of cardiac and aortic structure and function. Nat. Med 26, 1654–1662. 10.1038/s41591-020-1009-y. [DOI] [PMC free article] [PubMed] [Google Scholar]
- 8.Duffy G, Cheng PP, Yuan N, He B, Kwan AC, Shun-Shin MJ, Alexander KM, Ebinger J, Lungren MP, Rader F, et al. (2022). High-throughput precision phenotyping of left ventricular hypertrophy with cardiovascular deep learning. JAMA Cardiol. 7, 386–395. 10.1001/jamacardio.2021.6059. [DOI] [PMC free article] [PubMed] [Google Scholar]
- 9.Fries JA, Varma P, Chen VS, Xiao K, Tejeda H, Saha P, Dunnmon J, Chubb H, Maskatia S, Fiterau M, et al. (2019). Weakly supervised classification of aortic valve malformations using unlabeled cardiac MRI sequences. Nat. Commun 10, 3111. 10.1038/s41467-019-11012-3. [DOI] [PMC free article] [PubMed] [Google Scholar]
- 10.Yu M, Tcheandjieu C, Georges A, Xiao K, Tejeda H, Dina C, Le Tourneau T, Fiterau M, Judy R, Tsao NL, et al. (2022). Computational estimates of annular diameter reveal genetic determinants of mitral valve function and disease. JCI Insight 7. 10.1172/jci.insight.146580. [DOI] [PMC free article] [PubMed] [Google Scholar]
- 11.Wong SP, French JK, Lydon A-M, Manda SOM, Gao W, Ashton NG, and White HD (2004). Relation of left ventricular sphericity to 10-year survival after acute myocardial infarction. Am. J. Cardiol 94, 1270–1275. 10.1016/j.amjcard.2004.07.110. [DOI] [PubMed] [Google Scholar]
- 12.Levine YC, Matos J, Rosenberg MA, Manning WJ, Josephson ME, and Buxton AE (2016). Left ventricular sphericity independently predicts appropriate implantable cardioverter-defibrillator therapy. Heart Rhythm 13, 490–497. 10.1016/j.hrthm.2015.09.022. [DOI] [PubMed] [Google Scholar]
- 13.Nakamori S, Ismail H, Ngo LH, Manning WJ, and Nezafat R (2017). Left ventricular geometry predicts ventricular tachyarrhythmia in patients with left ventricular systolic dysfunction: a comprehensive cardiovascular magnetic resonance study. J. Cardiovasc. Magn. Reson 19, 79. 10.1186/s12968-017-0396-9. [DOI] [PMC free article] [PubMed] [Google Scholar]
- 14.St John Sutton M, Pfeffer MA, Moye L, Plappert T, Rouleau JL, Lamas G, Rouleau J, Parker JO, Arnold MO, Sussex B, et al. (1997). Cardiovascular death and left ventricular remodeling two years after myocardial infarction: baseline predictors and impact of long-term use of captopril: information from the Survival and Ventricular Enlargement (SAVE) trial. Circulation 96, 3294–3299. 10.1161/01.cir.96.10.3294. [DOI] [PubMed] [Google Scholar]
- 15.Di Donato M, Dabic P, Castelvecchio S, Santambrogio C, Brankovic J, Collarini L, Joussef T, Frigiola A, Buckberg G, Menicanti L, et al. (2006). Left ventricular geometry in normal and post-anterior myocardial infarction patients: sphericity index and “new” conicity index comparisons. Eur. J. Cardiothorac. Surg 29 Suppl 1, S225–30. 10.1016/j.ejcts.2006.03.002. [DOI] [PubMed] [Google Scholar]
- 16.Khanna S, Bhat A, Chen HH, Tan JWA, Gan GCH, and Tan TC (2020). Left Ventricular Sphericity Index is a reproducible bedside echocardiographic measure of geometric change between acute phase Takotsubo’s syndrome and acute anterior myocardial infarction. Int J Cardiol Heart Vasc 29, 100547. 10.1016/j.ijcha.2020.100547. [DOI] [PMC free article] [PubMed] [Google Scholar]
- 17.Ambale-Venkatesh B, Yoneyama K, Sharma RK, Ohyama Y, Wu CO, Burke GL, Shea S, Gomes AS, Young AA, Bluemke DA, et al. (2017). Left ventricular shape predicts different types of cardiovascular events in the general population. Heart 103, 499–507. 10.1136/heartjnl-2016-310052. [DOI] [PubMed] [Google Scholar]
- 18.Schmitt JP, Kamisago M, Asahi M, Li GH, Ahmad F, Mende U, Kranias EG, MacLennan DH, Seidman JG, and Seidman CE (2003). Dilated cardiomyopathy and heart failure caused by a mutation in phospholamban. Science 299, 1410–1413. 10.1126/science.1081578. [DOI] [PubMed] [Google Scholar]
- 19.van der Zwaag PA, van Rijsingen IAW, Asimaki A, Jongbloed JDH, van Veldhuisen DJ, Wiesfeld ACP, Cox MGPJ, van Lochem LT, de Boer RA, Hofstra RMW, et al. (2012). Phospholamban R14del mutation in patients diagnosed with dilated cardiomyopathy or arrhythmogenic right ventricular cardiomyopathy: evidence supporting the concept of arrhythmogenic cardiomyopathy. Eur. J. Heart Fail 14, 1199–1207. 10.1093/eurjhf/hfs119. [DOI] [PMC free article] [PubMed] [Google Scholar]
- 20.Jeansson M, Gawlik A, Anderson G, Li C, Kerjaschki D, Henkelman M, and Quaggin SE (2011). Angiopoietin-1 is essential in mouse vasculature during development and in response to injury. J. Clin. Invest 121, 2278–2289. 10.1172/JCI46322. [DOI] [PMC free article] [PubMed] [Google Scholar]
- 21.Kim KH, Nakaoka Y, Augustin HG, and Koh GY (2018). Myocardial Angiopoietin-1 Controls Atrial Chamber Morphogenesis by Spatiotemporal Degradation of Cardiac Jelly. Cell Rep. 23, 2455–2466. 10.1016/j.celrep.2018.04.080. [DOI] [PubMed] [Google Scholar]
- 22.Ntalla I, Weng L-C, Cartwright JH, Hall AW, Sveinbjornsson G, Tucker NR, Choi SH, Chaffin MD, Roselli C, Barnes MR, et al. (2020). Multi-ancestry GWAS of the electrocardiographic PR interval identifies 202 loci underlying cardiac conduction. Nat. Commun 11, 2542. 10.1038/s41467-020-15706-x. [DOI] [PMC free article] [PubMed] [Google Scholar]
- 23.Pernot M, Jaspard-Vinassa B, Abelanet A, Rubin S, Forfar I, Jeanningros S, Cetran L, Yu MH-Y, Balse E, Hatem S, et al. (2022). Decrease of Pdzrn3 is required for heart maturation and protects against heart failure. Sci. Rep 12, 8. 10.1038/s41598-021-03795-7. [DOI] [PMC free article] [PubMed] [Google Scholar]
- 24.Carlquist JF, Menlove RL, Murray MB, O’Connell JB, and Anderson JL (1991). HLA class II (DR and DQ) antigen associations in idiopathic dilated cardiomyopathy. Validation study and meta-analysis of published HLA association studies. Circulation 83, 515–522. 10.1161/01.cir.83.2.515. [DOI] [PubMed] [Google Scholar]
- 25.Pankuweit S, Ruppert V, Jónsdóttir T, Müller H-H, Meyer T, and German Competence Network of Heart Failure (2013). The HLA class II allele DQB1 0309 is associated with dilated cardiomyopathy. Gene 531, 180–183. 10.1016/j.gene.2013.09.022. [DOI] [PubMed] [Google Scholar]
- 26.Pirruccello JP, Di Achille P, Nauffal V, Nekoui M, Friedman SF, Klarqvist MDR, Chaffin MD, Weng L-C, Cunningham JW, Khurshid S, et al. (2022). Genetic analysis of right heart structure and function in 40,000 people. Nat. Genet 54, 792–803. 10.1038/s41588-022-01090-3. [DOI] [PMC free article] [PubMed] [Google Scholar]
- 27.Aragam KG, Chaffin M, Levinson RT, McDermott G, Choi S-H, Shoemaker MB, Haas ME, Weng L-C, Lindsay ME, Smith JG, et al. (2018). Phenotypic Refinement of Heart Failure in a National Biobank Facilitates Genetic Discovery. Circulation. 10.1161/CIRCULATIONAHA.118.035774. [DOI] [PMC free article] [PubMed] [Google Scholar]
- 28.Roselli C, Chaffin MD, Weng L-C, Aeschbacher S, Ahlberg G, Albert CM, Almgren P, Alonso A, Anderson CD, Aragam KG, et al. (2018). Multi-ethnic genome-wide association study for atrial fibrillation. Nat. Genet 50, 1225–1233. 10.1038/s41588-018-0133-9. [DOI] [PMC free article] [PubMed] [Google Scholar]
- 29.Kurki MI, Karjalainen J, Palta P, Sipilä TP, Kristiansson K, Donner K, Reeve MP, Laivuori H, Aavikko M, Kaunisto MA, et al. (2022). FinnGen: Unique genetic insights from combining isolated population and national health register data. medRxiv. 10.1101/2022.03.03.22271360. [DOI] [Google Scholar]
- 30.Littlejohns TJ, Holliday J, Gibson LM, Garratt S, Oesingmann N, Alfaro-Almagro F, Bell JD, Boultwood C, Collins R, Conroy MC, et al. (2020). The UK Biobank imaging enhancement of 100,000 participants: rationale, data collection, management and future directions. Nat. Commun 11, 2624. 10.1038/s41467-020-15948-9. [DOI] [PMC free article] [PubMed] [Google Scholar]
- 31.Bycroft C, Freeman C, Petkova D, Band G, Elliott LT, Sharp K, Motyer A, Vukcevic D, Delaneau O, O’Connell J, et al. (2018). The UK Biobank resource with deep phenotyping and genomic data. Nature 562, 203–209. 10.1038/s41586-018-0579-z. [DOI] [PMC free article] [PubMed] [Google Scholar]
- 32.Petersen SE, Matthews PM, Francis JM, Robson MD, Zemrak F, Boubertakh R, Young AA, Hudson S, Weale P, Garratt S, et al. (2016). UK Biobank’s cardiovascular magnetic resonance protocol. J. Cardiovasc. Magn. Reson 18, 1–7. 10.1186/s12968-016-0227-4. [DOI] [PMC free article] [PubMed] [Google Scholar]
- 33.Petersen SE, Aung N, Sanghvi MM, Zemrak F, Fung K, Paiva JM, Francis JM, Khanji MY, Lukaschuk E, Lee AM, et al. (2017). Reference ranges for cardiac structure and function using cardiovascular magnetic resonance (CMR) in Caucasians from the UK Biobank population cohort. J. Cardiovasc. Magn. Reson 19, 18. 10.1186/s12968-017-0327-9. [DOI] [PMC free article] [PubMed] [Google Scholar]
- 34.Long J, Shelhamer E, and Darrell T (2015). Fully convolutional networks for semantic segmentation. 3431–3440. 10.1109/CVPR.2015.7298965. [DOI] [PubMed] [Google Scholar]
- 35.Wu P, Gifford A, Meng X, Li X, Campbell H, Varley T, Zhao J, Carroll R, Bastarache L, Denny JC, et al. (2019). Mapping ICD-10 and ICD-10-CM codes to phecodes: Workflow development and initial evaluation. JMIR Med. Inform 7, e14325. 10.2196/14325. [DOI] [PMC free article] [PubMed] [Google Scholar]
- 36.Ye Z, Mayer J, Ivacic L, Zhou Z, He M, Schrodi SJ, Page D, Brilliant MH, and Hebbring SJ (2015). Phenome-wide association studies (PheWASs) for functional variants. Eur. J. Hum. Genet 23, 523–529. 10.1038/ejhg.2014.123. [DOI] [PMC free article] [PubMed] [Google Scholar]
- 37.Bulik-Sullivan B, Finucane HK, Anttila V, Gusev A, Day FR, Loh P-R, ReproGen Consortium, Psychiatric Genomics Consortium, Genetic Consortium for Anorexia Nervosa of the Wellcome Trust Case Control Consortium 3, Duncan L, et al. (2015). An atlas of genetic correlations across human diseases and traits. Nat. Genet 47, 1236–1241. 10.1038/ng.3406. [DOI] [PMC free article] [PubMed] [Google Scholar]
Associated Data
This section collects any data citations, data availability statements, or supplementary materials included in this article.
Supplementary Materials
Data Availability Statement
This paper analyzes UK Biobank data, which is available after the approval of an application at https://www.ukbiobank.ac.uk.
All original code has been deposited at https://github.com/vukadinovic936/UKB and is publicly available as of the date of publication. DOIs are listed in the key resources table.
Key resources table
| REAGENT or RESOURCE | SOURCE | IDENTIFIER |
|---|---|---|
| Deposited data | ||
| Sphericity index GWAS summary statistics | This paper | https://my.locuszoom.org/gwas/834868/ |
| LV short axis GWAS summary statistics | This paper | https://my.locuszoom.org/gwas/983285/ |
| LV long axis GWAS summary statistics | This paper | https://my.locuszoom.org/gwas/865649/ |
| Software and algorithms | ||
| Sphericity Index Extractor | This paper | https://github.com/vukadinovic936/sphericity |
| Survival 3.5 | Therneau et al. | https://github.com/therneau/survival |
| Hail 0.2 | Neale Lab | https://github.com/hail-is/hail |
| LDSC 1.01 | Bulik-Sullivan et al. | https://github.com/bulik/ldsc |
| TwoSampleMR 0.5.6 | Hemani et al. | https://github.com/MRCIEU/TwoSampleMR |