

Abstract
Although the precise mechanisms determining the neurotoxic or neuroprotective activation phenotypes in microglia remain poorly characterized, metabolic changes in these cells appear critical for these processes. As cellular metabolism can be tightly regulated by changes in intracellular pH, we tested whether pharmacological targeting of the microglial voltage-gated proton channel 1 (Hv1), an important regulator of intracellular pH, is critical for activated microglial reprogramming. Using a mouse microglial cell line and mouse primary microglia cultures, either alone, or co-cultured with rat cerebrocortical neurons, we characterized in detail the microglial activation profile in the absence and presence of Hv1 inhibition. We observed that activated microglia neurotoxicity was mainly attributable to the release of tumor necrosis factor alpha, reactive oxygen species, and zinc. Strikingly, pharmacological inhibition of Hv1 largely abrogated inflammatory neurotoxicity not only by reducing the production of cytotoxic mediators but also by promoting neurotrophic molecule production and restraining excessive phagocytic activity. Importantly, the Hv1-sensitive change from a pro-inflammatory to a neuroprotective phenotype was associated with metabolic reprogramming, particularly via a boost in NADH availability and a reduction in lactate. Most critically, Hv1 antagonism not only reduced inflammatory neurotoxicity but also promoted microglia-dependent neuroprotection against a separate excitotoxic injury. Our results strongly suggest that Hv1 blockers may provide an important therapeutic tool against a wide range of inflammatory neurodegenerative disorders.
Keywords: Microglial activation, inflammatory neurotoxicity, voltage-gated proton channel, Hv1, metabolic reprogramming, excitotoxicity, neuroprotection
Graphical Abstract:

In this study, we used a classical LPS/IFNγ activation model in HAPI cell line and microglia primary culture to determine the role of the Hv1 in influencing the microglia activation phenotype. We propose that Hv1 blockade during microglial activation (1) reduces the production of reactive species and promotes intracellular acidification (2). The decrease in pH by ClGBI promotes the metabolic reprogramming of microglia by downregulating anaerobic glycolysis (3), resulting in neuroprotection (4).
Introduction
Microglia, the immune response orchestrator cell of the nervous system (Parkhurst & Gan, 2010), detect changes in the microenvironment and produce a response that aims to recover tissue homeostasis (Harry & Kraft, 2008). These changes, induced by pathogens or by direct damage to neurons, lead to microglial activation, which is characterized by changes in protein expression and intermediary metabolism (Kigerl et al., 2014).
Microglial activation can be broadly divided into two main phenotypes, pro-inflammatory and anti-inflammatory (Cherry et al., 2014), although intermediate phenotypes can exist between these two extremes (Barcia et al., 2011; Kim et al., 2016). During proinflammatory activation, microglia increase the production of membrane recognition molecules and reactive species production, while sustaining elevated phagocytic activity (Aderem & Underhill, 1999; Brown & Neher, 2012) and releasing cytotoxic cytokines (Dheen et al., 2007; Kawasaki & Kawai, 2014). Although the production of these mediators is necessary for damage containment, sustained proinflammatory activation can, and often does, lead to widespread neuronal death (Brown & Vilalta, 2015), a process defined here as inflammatory neurotoxicity. In contrast, anti-inflammatory microglial activation is characterized by moderated phagocytic activity and reactive species production, and, importantly, by the release of neurotrophic cytokines (Andreou et al., 2017; Lue et al., 2010). This profile promotes neuroprotection as well as recovery of damaged neurons and, thereby, tissue function (Hellwig et al., 2013; Stoll et al., 2000). It is noteworthy that microglia can oscillate between pro-inflammatory and anti-inflammatory phenotypes (Orihuela et al., 2016; Stratoulias et al., 2019). While a variety of conditions and signaling molecules associated with both neurotoxic and neuroprotective profiles have been identified (Hu et al., 2015), the precise mechanisms that regulate and determine the characteristics of specific microglial responses remain poorly defined.
Microglial metabolism has recently emerged as a possible key regulator of microglial activation (Bernier et al., 2019; Nair et al., 2019). Intermediary metabolism, in particular, is closely related to activation phenotype determination, as increases in mitochondrial ROS production, changes in mitochondrial metabolic function, and increases in lactate production are associated with LPS-induced proinflammatory activation (Voloboueva et al., 2013). During proinflammatory activation, microglia tend towards anaerobic metabolism, reflected by an increase in glycolytic rate, lactic acid production, and a decline in oxidative phosphorylation (Ghosh et al., 2018; Wang et al., 2019). Of note, high lactate production and a decrease in reduced nicotinamide adenine dinucleotide (NADH), due to enhanced glycolysis, can reduce the efficiency of antioxidant systems and glutamate reuptake (Jha & Morrison, 2020; Persson et al., 2006).
Anti-inflammatory activation is also characterized by cytokine production and enhanced phagocytic activity although, these processes occur to a much less significant degree. Therefore, it is possible that the associated energy demand could be lower, although there is currently no solid evidence in this regard. However, there is evidence that the proinflammatory activation induced by LPS increases energy related parameters, such as glucose uptake, while the activation promoted by IL-4, an anti-inflammatory cytokine, decreases it (Suzuki et al., 2021). Moreover, anti-inflammatory activation is associated with the oxidation of alternative energy substrates, without a significant increase in lactic acid fermentation (Gras et al., 2006; Orihuela et al., 2016).
A common component of cellular metabolic changes and microglial activation is the regulation of intracellular pH (Liu et al., 2010). Indeed, protons could be key regulators of the inflammatory response, as increases in intracellular proton production have been correlated with reactive oxygen species production, phagocytic activity, as well the release of cytokines (Liu et al., 2010; Morgan et al., 2009). Microglial activation is, in fact, associated with an increase in proton production, primarily as a result of the activity of reduced nicotinamide adenine dinucleotide phosphate (NADPH) oxidase 2 (NOX2) (Faff et al., 1996; Sekar et al., 2018). This increase in NOX2 activity, characteristic of proinflammatory activation, is essential to maintain phagocytosis and the subsequent respiratory burst (Nauseef, 2019). Upon activation, NOX2 transports an electron from NADPH to molecular oxygen to produce and extrude superoxide (Hernandez-Espinosa et al., 2019; Zeng et al., 2018). Without compensatory proton movement, the activity of this transmembrane electron transport would be sufficient to generate pronounced membrane depolarization, and, importantly, promote intracellular acidification (El Chemaly et al., 2010).
Recent evidence points to Hv1 as an essential membrane proton channel necessary for proper NOX2 function and intracellular pH regulation (Kawai et al., 2017; Ramsey et al., 2009; Ritzel et al., 2021). This zinc-sensitive, voltage-gated channel consists of two identical subunits that gate cooperatively (Lishko et al., 2010; Musset et al., 2010; Ramsey et al., 2006). Hv1 extrudes protons from activated cells to compensate for charge and osmotic imbalances due to NOX2 activity and metabolism, normalizing intracellular pH and regulating protein function. Although the absence of Hv1 does not significantly modify the physiology of non-activated microglia, during activation, a lack of Hv1 is associated with critical changes in the inflammatory response (Li et al., 2021; Ritzel et al., 2021). These changes have largely been associated with a neuroprotective microglial profile (Tian et al., 2016; Zhang et al., 2020), although, notably, the molecular mechanisms behind this process have largely remained undefined.
Most of the evidence about the neuroprotective effect associated with Hv1 lack of function has been obtained using knockout animal models (Li et al., 2021; Yu et al., 2020). However, selective pharmacological tools are available, including guanidine derivatives (i.e., 2-guanidinobenzimidazole, 2GBI and 5-chloro-2-guanidinobenzimidazole, ClGBI) (Hong et al., 2014) as well as arginine mimetics (i.e. 3-(2-amino-5-methyl-1H-imidazol-4-yl)-1-(3,5-difluorophenyl) propan-1-one, HIF and 2-aminobenzimidazole, ABI) (Zhao et al., 2021), which have been proven to be effective Hv1 inhibitors in a number of paradigms (Asuaje et al., 2017; Ma et al., 2022; Meszaros et al., 2020; Zhao et al., 2021). Guanidine derivatives, such as ClGBI, are effective inhibitors at low micromolar concentrations, and have a low toxicity profile. Computational models also predict high membrane permeability (Lim et al., 2021; Zhao et al., 2021). Of note, their chemical properties allow them to interact with voltage-gating domains, even when the Hv1 channel is in its closed conformation (Hong et al., 2014; Hong et al., 2015).
The purpose of the experiments described here was to define the specific molecular components of inflammatory microglial activation that are dependent on Hv1 function using a pharmacological blocker of the channel in two independent microglial preparations. The implementation of two different models allowed us to describe the general effect of Hv1 inhibition on microglial activation by combining the technical advantages and scalability of a cell line, with validation in a primary culture. Additionally, corroborating the findings in different cell types suggests the existence of a general effect in immune cells capable of activation. In addition to describing Hv1-dependent microglia activation profile, our overarching goal is to provide evidence that Hv1 block can effectively lead to changes in microglial metabolic profile that result in neuroprotection, rather than only in the mitigation of inflammatory neurotoxicity.
Materials and methods
Experimental model and subject details
HAPI microglial cell line:
Mouse immortalized microglia (Highly Aggressive Proliferating Immortalized or HAPI; RRID:CVCL_0F62) cells were generously provided by Dr. J. Connor (Pennsylvania State University, Hershey, PA, USA) (Cheepsunthorn et al., 2001). HAPI cells are listed as a commonly misidentified cell line by the International Cell Line Authentication Committee (ICLAC-00602) due primarily to confusion about the species of origin (originally reported to be from rat). This cell line was selected due to its highly quiescent non-activated state and robust proinflammatory response following activation (Hara et al., 2011). Importantly, as will be evident by the data presented here, we now provide a complete characterization of the activation profile of these cells and further compare this profile to that of primary mouse microglial cells. HAPI cells were cultured in DMEM+GlutaMAx (Thermofisher, #10566016) containing 10% heat-inactivated fetal bovine serum (FBS; Thermofisher, A4766801), 100 units/ml penicillin G and 0.1 mg/ml streptomycin in a humidified 5% CO2 incubator at 37°C. After reaching approximately 80% confluence, the cells were seeded at a density of 350,000 cells/ml and experimentally treated after 24 h (Cheepsunthorn et al., 2001). HAPI cells were maintained and used up to a maximum of 25 passages to minimize spontaneous activation.
Rat cerebrocortical neuronal cultures:
All procedures involving the use of animals were reviewed and approved by the University of Pittsburgh IACUC (protocol number 21039053). For neuronal viability experiments, cultures were prepared from embryonic day 17 (E17) Sprague–Dawley rat cortices of either sex (Charles River Laboratories, Wilmington, MA, USA), as described previously (Hartnett et al., 1997). Pregnant donor rats were euthanized by CO2 inhalation and 5–10 brains were pooled before plating. Cortices were dissociated with trypsin (0.6 mg/ml), and suspended in growth medium, composed of a v/v mixture of 80% Dulbecco’s modified minimal essential medium, 10% Ham’s F12-nutrients, and 10% bovine calf serum. Density was adjusted to 350,000 cells per ml and plated on poly-l-ornithine–coated glass coverslips in six-well plates. Non-neuronal cell proliferation was inhibited after 14 days in vitro (DIV) with 2 μM cytosine arabinoside, and growth medium was changed to one consisting of Dulbecco’s modified minimal essential medium and 2% bovine calf serum until cultures were utilized at 21 DIV (Hartnett et al., 1997).
Primary microglia cultures:
Microglia cultures were prepared from 7–12 cerebral cortices of 1-day-old C57BL/6 mice of either sex (Charles River, Laboratories, Wilmington, MA, USA). After mechanical and chemical dissociation using papain (20 UI/ml, Sigma Millipore 1495005) and DNase (10 UI/ml, Sigma Millipore, 260913), cells were seeded in DMEM-F12 with 10% FBS, 100 units/ml penicillin G, 0.1 mg/ml, and microglia supplement (Cell biologics, M1286) at a density of 250,000 cells/ml (62,500 cells/cm2) and cultured at 37°C in humidified and 5% CO2. Medium was replaced every 4 days and confluency was achieved after 12–14 DIV. Microglia were separated by a 15-min incubation with a mild trypsin solution (0.25% trypsin, 1 mM EDTA) diluted 1:4 in DMEM-F12 (Saura et al., 2003). Twenty-four hours after trypsinization, the isolated cells were fixed, immunostained and counted, showing that 98–99% were positive for the specific microglial marker Iba1 (FIG. S1).
Microglial activation protocol:
Twenty-four hours post-seeding, both HAPI cells and primary microglia cultures were treated with a combination of LPS (1 μg/ml; Millipore, L4516) and IFNγ (0.1 μg/ml; Millipore, IF002) for 24 h to promote pro-inflammatory activation (Hayes et al., 1995). Activation was performed in both the absence and presence of Hv1 antagonism with ClGBI (Millipore, G11802). After 24 h of treatment, conditioned medium was obtained or activated cells were harvested to conduct the experiments described below.
Inflammatory neurotoxicity assessment
To establish the neurotoxicity effect of soluble molecules produced following microglial activation, coverslips containing 21 DIV cortical cultures were transferred to 24-well plates and treated with 500 μl of conditioned medium from activated microglia (Zhang & Fedoroff, 1996). Additionally, 2,2′-[1,2-Ethanediylbis(nitrilomethylidyne)] bis[6-methoxy-phenol manganese complex (EUK134; 100 μM; Millipore, #81065), dizocilpine hydrogen maleate (MK801; 10 μM; Millipore, M107), 2-pyridinylmethylamino ethylamine benzenesulfonic acid hydrate sodium salt (ZX1; 5 μM; Strem Co., #07–0350), TNF-α neutralizing antibody (nTNF-α; 10 μg/ml; Cell signaling, mAb11969, RRID:AB_2797395), or IL-6 neutralizing antibody (nIL-6; 5 μg/ml; InvivoGen #mabg-mil6-3) were co-administered to characterize the participation of neurotoxic molecules resulting from proinflammatory activation. In co-culture experiments, microglia cultures were treated with LPS/IFNγ ± ClGBI for 24 h as described above; after activation, cells were harvested (75,000 cells/ml in DMEM/F-12 medium) and plated directly on top of 21 DIV cortical cultures that had previously transfected with firefly luciferase-expressing plasmid for neuronal viability studies (Aras et al., 2008).
Excitotoxicity
To determine the effect of Hv1 inhibition on inflammatory neurotoxicity during excitotoxic damage, an in vitro model of glutamate reuptake inhibition was employed (Justice et al., 2018). Co-cultures of mixed cortical and microglia pretreated with LPS/IFNγ ± ClGBI, were exposed for 24 h to DL-threo-β-benzyloxyaspartic acid (TBOA), a glutamate transporter inhibitor, to induce neuronal excitotoxicity from synaptically released glutamate (Schulien et al., 2020; Yeh et al., 2017).
Viability assays
MTS assay protocol: Briefly, 20 μl of tetrazolium compound (3-(4,5-dimethylthiazol-2-yl)-5-(3-carboxymethoxyphenyl)-2-(4-sulfophenyl)-2H-tetrazolium) inner salt solution (MTS; 5 mg/ml; Abcam, ab223881) were added to cells in a 24-well plate and incubated at 37 °C in a humidified 5% CO2 incubator for 30 min. The resulting reduction of MTS tetrazolium compound by viable cells generates a colored formazan dye that is soluble in cell culture media (Buttke et al., 1993). The formazan dye was quantified by measuring the absorbance (490–500 nm) using a microplate reader (Wallac 1420 Victor2 multilabel counter; PerkinElmer). Differences are expressed in percent of cell death against control.
MT-Luciferase assay: Cell viability was also evaluated in real time by using Real Time-Glo™ MT Cell Viability Assay (Promega, G9711). Briefly, cells were plated into 24-well plates, treated with LPS/IFNγ ± ClGBI and incubated for 24 h. After treatment, cells were incubated for 10 min with Real Time-Glo™ reagent, according to the manufacturer’s protocol. Luminescence was measured using a microplate reader with an integration time of 0.5 s per well. In this assay, luminescent signal is correlated with the number of metabolically active cells. Results are provided as relative luminescence units (RLU).
LDH assay: LDH is rapidly released into the cell culture medium upon damage of the plasma membrane (Aras et al., 2008). LDH release was determined using a commercial kit (Abcam, ab102526) following the manufacturer’s instructions. Absorbance (490 nm) and background (690 nm) were measured. Results are calculated as background-subtracted absorbance measurements and expressed as normalized values against control.
Co-culture neuronal viability assay: Neuronal cell death in neuron/microglia cocultures was measured using a luciferase expression assay (Aras et al., 2008; Pal et al., 2003). For these experiments, we transfected neurons with a firefly luciferase-expressing plasmid (pUHC13-3 Luciferase, gift from Dr. H. Buchard) using Lipofectamine 2000 (Thermofisher, #11668030). Briefly, mixed coverslips with cortical cultures were transferred to a 24-well plate. Each well was transfected with 1.5 μg of DNA (25% firefly luciferase-pUHC13-3 and 75% pCDNA3 vector, RRID:Addgene_74939) in optiMEM (Thermofisher, #31985062). Twenty-four hours following transfection non-activated or activated microglia ± ClGBI (75,000 cells/ml) were plated directly on top on neurons (Knoch et al., 2008). Neuronal viability was assayed 24 h later using the Steadylite Plus Luminescence assay (PerkinElmer, #6016981). An overnight exposure to TBOA (75 μM; Tocris biotech, #1223) in the absence of microglia was used as a positive control for maximal neuronal cell death. Results are reported as percentage with respect to cortical neurons with vehicle treatment as control.
Cytokine immunoassays
Cytokines were determined in the culture medium by enzyme-linked immunoassay (ELISA) using the ultrasensitive ELISA kits for IL-1β (Abcam, ab197742), IL-4 (Abcam, ab100710), IL-6 (Abcam, ab222503), IL-10 (Abcam, ab255729), TGFβ (Abcam, ab119557) and TNF-α (Abcam, ab208348) according to the manufacturer’s instructions. Briefly, the samples were obtained from the culture medium after treatments. The medium was centrifuged at 2,000 rpm to remove cell debris and diluted 50% with distilled water. The concentration of cytokines was determined based on the standard curve provided by the manufacturer and expressed as pg/ml.
Immunoblotting
Cells were gently scraped off the wells on ice after being exposed to cell lysis buffer supplemented with a protease inhibitor cocktail (Millipore, #11697498). Debris were pelleted by centrifugation for 10 min at 8,000 rpm, and the remaining lysates were used immediately or stored at −20 °C. Protein concentrations of lysates were measured with a BCA assay (Thermofisher, #23225). Sodium dodecyl sulphate–polyacrylamide gel electrophoresis(SDS–PAGE) was conducted using the Mini Protean 3 System (Bio-Rad, Hercules, CA). Prior to electrophoresis, protein samples were treated with a reducing sample buffer and boiled at 100 °C for 5 min. Samples with equal amounts of protein (30–50 μg per lane) were run on 8 or 12% SDS-PAGE gel for 2 h at 100 mV. For immunoblotting, separated protein bands were transferred onto a 0.25 μm nitrocellulose membrane (Bio-Rad) for 30 min at 18 mV in a semidry chamber. The membranes were then blocked with 3% fat free milk in PBS with 0.05% Tween 20 (PBST) at RT for 1 h and probed with anti-gp91phox(Abcam, ab129068, RRID:AB_11144496), anti-NOS2 (Santa Cruz Bio., sc-7271, RRID:AB_627810), anti-Hv1 (Alomone labs. AHC-001, RRID:AB_10917155) or anti-β-actin (Millipore, MAB1501, RRID:AB_2223041) antibodies in PBST overnight at 4°C. After washing with PBST, blots were incubated with goat 680RD anti-Rabbit (1:10,000; Li-Cor, AB272118, RRID:AB_10956166) or 800CW anti-Mouse (1:10,000; Li-Cor, AB2687825, RRID:AB_621847) at RT for 1 h. Blots were visualized using Odyssey Western blot detection system. Quantification was performed using ImageJ software (Wayne Rasband, NIH, RRID:SCR_003070). Results were calculated as protein of interest/β-actin ratio and expressed as fold-change against normalized control.
DHE stain and ROS detection
The cell permeable fluorescent dye dihydroethidium (DHE; Millipore, D7008) was used to detect intracellular ROS (Dimayuga et al., 2007). After 24 h treatment of microglia with LPS/IFNγ ± ClGBI, DHE (5 μM) was added and incubated for 30 min at 37°C and 5% CO2. Cells were then washed and mounted on microscope slides. Images were obtained with a Nikon Eclipse Ti epifluorescence microscope (Nikon, Tokyo, Japan) using a 10X objective, and processed with NIS-Elements Advanced Research Imaging software (version 4.30.02, Nikon, RRID:SCR_002776). In a separate set of experiments, cells were washed with PBS and MHB medium was added for direct quantification. Determination of final point DhE fluorescence was performed using a microplate reader at 610 nm when excited at 535 nm. Data are expressed in relative fluorescence units (RFU).
Immunofluorescent staining and image analysis
Cells were fixed with ice-cold ethanol for 5 min, washed with PBS and incubated with blocking solution, 1% bovine serum albumin (Hartlage-Rubsamen et al., 1999) and glycine 0.5% in PBST, for 30 min at RT. Next, cells were incubated with anti-Iba1 (1:200; Alomone, ACS-010, RRID:AB_2827294) and anti-GFAP (1:500; Thermofisher, 14-9892-82) (Zhao et al., 2013) overnight at 4°C. On the following day, the cells were incubated for 1 h at RT with secondary antibody goat anti-rabbit conjugated with Alexa Fluor 488 (1:500; Abcam, ab150077, RRID:AB_2630356) and goat anti-mouse conjugated with Alexa Fluor 594 (1:500; Abcam, ab150116). DAPI (1:1000 in mounting solution, RRID:AB_2336788) was used to stain the nucleus. For negative controls, cells were stained with the secondary antibody only. Fluorescent images were obtained at 10X and 40X magnification and analyzed. For morphological characterization, the total area of HAPI cells and microglia was determined by established protocols (Kongsui et al., 2014). First, we arbitrarily selected three fields from 3 biological replicates, selected demarcated cells, and measured their area (in μm2) using ImageJ software. An independent investigator blinded to the treatment groups performed the cell selection and analysis. A Leica Stellaris confocal microscope (Leica, Stellaris 5) was used for determining the purity of the primary microglia cultures.
Microglial phagocytic activity
Phagocytic activity assay was measured according to the kit manufacturer’s instructions (Abcam, ab235900) (Lian et al., 2016). Briefly, cells were seeded in 96-well plates at a density of 250,000 cells/ml. After 24 h of LPS/IFNγ treatment, the medium was removed, and the assay buffer was added and incubated for 4 h. Following incubation, a quenching solution is added, and the fluorescence intensity measured in a plate reader (Ex 490/Em 520). Phagocytic activity was calculated according to the standard curve given by the manufacturer after subtracting the mean relative fluorescent units (RFU) of the negative controls. The results are expressed as normalized values with respect to the control.
Enzyme activity quantification
NOX activity:
Microglial NOX activity was determined by a chemo-luminescent method (Minkenberg & Ferber, 1984). Briefly, cells were harvested 24 h after treatments using a sterile cell scraper and 200 μl of ice-cold PBS. Subsequently, 100 μl of the sample (in duplicate) was transferred to a white microplate and 100 μM NADPH (Millipore, #2646711) and 100 μM lucigenin (Millipore, #2315971) were added. In parallel, 15 IU of superoxide dismutase (Millipore, #9054891) were added to a duplicate sample to subtract the unspecific oxidation. Additionally, samples were treated with DPI (100 μM; Millipore, D2926), a general inhibitor of NOX, or GSK-279 (1–100 μM; Millipore, SML2770) a specific inhibitor of NOX2, as negative controls. Luminescence was quantified using a plate reader. Values are expressed as relative light units (RLU) per mg.
NOS activity:
Microglial nitric oxide synthase (NOS) activity was determined using an activity assay kit (Abcam, ab211083) (Veremeyko et al., 2018). Cells samples were prepared in ice-cold NOS kit assay buffer and centrifuged for 10 min at 10,000×g. Supernatants were collected, and protein concentrations determined by BCA assay. Samples were then incubated with NOS reaction mix for 1 h at 37°C. After incubation, NOS kit assay buffer and enhancer solution were added. This reaction mixture was incubated for 10 min at RT. For the color reaction, Griess Reagent was added. Absorbance was measured after a 10 min incubation by a microplate reader at 540 nm. NOS specific activity was then calculated from a standard curve and expressed as mU/mg.
Pyruvate kinase activity:
Pyruvate Kinase (PK) activity was determined using an assay kit (Abcam, ab83432)(Ji et al., 2021) according to the manufacturer’s instructions. Briefly, Controls and treated cells were lysed with the assay buffer and transferred to a 96-well plate. Thereafter, 50 μL of the master mix were added to each sample. The relative fluorescence was determined after 20 minutes of incubation using a plate reader (Ex/Em = 535/587 nm). All samples were measured in technical duplicates and expressed as mU/mL.
Fluorometric pHi and pHe measurements
Intracellular pH (pHi) was measured using cell-permeant BCFL-AM (Millipore, MAK150) (Ozkan & Mutharasan, 2002). Cells were seeded in 96 wells plates (500,000 cell/ml) and treated for 24 h. The medium was replaced with reaction solution (BCFL-AM and 50 mM Probenecid, in Hank’s Buffer with 10 mM HEPES (HHBS). Cells were then incubated at 37°C in an atmosphere of 5% CO2 for 30 min while protected from light. Measurements were then performed at Ex 490 nm/ Em 535 nm in a microplate reader. The change in pH was corroborated by the addition of NH3 (acid load) which promotes a decrease in intracellular pH and therefore, of fluorescence, followed by a slow and progressive recovery of the signal. The RFU value was equated to the pH scale by creating a curve of increasing concentration of BCFL-AM in HHBS, in which the pH was directly measured using a potentiometer (LabX, Corning 240). For the determination of extracellular pH (pHe), culture medium was removed after the treatments and BCFL-AM was added to this solution, in the absence of cells. Medium was then incubated at 37°C in an atmosphere of 5% CO2 for 30 min (protected from light). Following incubation, measurement was performed at Ex 490 nm/Em 535 nm in a microplate reader. The fluorescence obtained was corroborated using a potentiometer (LabX, Corning 240) and reported as pH values.
Metabolite determination
Lactate:
Lactate production was measured by its oxidation coupled to NADH production, which, in turn, was detected via bioluminescence using a reductase/luciferase system assay kit (Promega, J5021)(Ilina et al., 2017). Briefly, microglia were seeded at 250,000 cells/ml into a 24-well plate and treated with LPS/IFNγ ± ClGBI for 24 h. After the treatments, medium was removed and cells were incubated for 60 min with the reaction mix (Luciferin detection reagent, NAD, lactate dehydrogenase, reductase, and reductase substrate). At the same time, medium was collected and treated with inactivation and neutralization solutions to inactivate the endogenous LDH and prevent NADH degradation for the extracellular measurement. RLU obtained are directly proportional to the lactate concentration following the production of a standard curve provided by the manufacturer. The total lactate was obtained by the sum of the lactate concentration in the samples and in the medium. Results are expressed as final lactate concentration (μM).
NAD+/NADH ratio:
NAD levels were analyzed by use of the colorimetric total NAD+/NADH assay (Abcam, ab186032) that allows the differentiation of NAD+ and NADH (Vidugiriene et al., 2014). The assay reagent consisted of a mixture of NAD+-reducing and NADH-oxidizing enzyme causing an amplification of the NAD signal. As NAD+ but not NADH is heat labile at 60°C, total NAD is detected in the unheated sample and NADH is detected in the heated sample. The difference between total NAD and NADH represents NAD+. One half of the samples was heated at 60°C for 30 min, while another half was kept on ice. A total of 40 μl of the unheated or heated samples as well as NADH (0.1–5.0 μM dissolved in PBS) were transferred to a clear 96-well microplate. After adding 40 μl of the enzyme reaction mix the color of produced formazan was measured at 450 nm in plate reader. Pure NAD+ (Millipore, N0632) and NADH (Millipore, N8129) were used as reference standards. NADH can be detected at 260 and 340 nm, while NAD+ is detectable at 260 nm only. Results are expressed as NAD+ and NADH concentrations, normalized to control values.
Glucose utilization:
Glucose utilization was determined indirectly based on the detection of 2-deoxyglucose-6-phosphate in total cell lysates using the Glucose Uptake-Glo kit (Promega, J1341) according to the manufacturer’s instructions (Tucker et al., 2018). Luminescence was measured using an multiplate reader. The medium was removed, and cells were washed to remove residual glucose. Glucose utilization was initiated by the addition of 1 mM 2-deoxyglucose and was allowed to proceed for 30 min at 37 °C. Results are expressed as fmol/cell/min
Zinc measurements
FluoZin-3-tetrapotassium salt (Thermofisher, F24194) was used as fluorescent indicator for extracellular Zn2+ (Datki et al., 2007). All solutions used in these experiments were prepared with Milli-Q water previously treated with Chelex 100 (BioRad, #1422822), a chelating resin, to avoid metal cross-contamination. Briefly, after 24 hours of treatment, 200 μl of culture medium from the microglia cultures were transferred to a 96-well multiplate. Fluozin-3 (2μM) was immediately added to the samples and then incubated for 60 min at RT in the dark. Finally, the fluorescence resulting from the binding of Fluozin-3 to chelatable zinc was quantified in a multiplate reader (Ex 485nm/Em 535nm). Results are expressed as zinc concentration in μM, obtained from a standard curve of known concentrations of ZnCl2 versus fluorescence.
Hv1 knock down
HAPI cells were seeded and incubated until reaching at 50% confluence. Next, cells were transfected with Hv1 SMARTPool siRNA (Horizon, L-081118-02-0010) or the negative scramble control (SC; 100 nM; Horizon, D-001210-02-20) using DharmaFECT 4 Transfection Reagent (Horizon, T-2004-03), according to the manufacturer’s protocol. Additionally, a siRNA concentration curve (25–125 nM) was performed, and the effective concentration of siRNA was established (100 and 125 nM), defined as a decrease of more than 80% in the amount of protein 48 h after transfection. The effectiveness of the siRNAs in suppressing Hv1 expression was determined by western blotting using anti-Hv1 antibody as described above.
Quantification, statistical analyses, and reporting
Approximately 60 pregnant rats (E15-E17) and 24 litters of mice (P1-P2) were used to produce cortical and primary microglia cultures, respectively. No randomization was performed to allocate subjects in the treatment sequence was established arbitrarily (no randomization was performed). No deliberate blinding was performed in the study, except for a number of assays that were performed by a person naïve to the study As the entire study was performed in vitro, the critical parameter we were careful to control for was the number of biological replicates (separate culture dates in the case of primary cultures, and different passages or frozen stocks in the case of the HAPI cell line). These procedures are based on a large number of cellular studies performed in our laboratory. The sample size was determined a priori, based on our previous results utilizing our cell culture models for microglia activation and neuronal toxicity (Aras et al., 2008; Hartnett et al., 1997; Knoch et al., 2008). No samples were excluded from analysis. Treatments and experiments were carried out in the afternoon (17:00–19:00 h). Numeric values displayed represent the mean ± SEM of at least three biological replicates (cell cultures prepared independently), each performed in technical triplicates or quadruplicates. Graphs comparing normalized values (control matched to 1) across multiple groups, were analyzed via Kruskal-Wallis test with Dunn’s post-hoc for multiple comparisons (non-parametric data) or one-way ANOVA with Tukey or Dunnett’s post-hoc analysis for individual parametric data comparisons (individually specified in figure legends) using GraphPad Prism9. No exclusion criteria were pre-determined. Unspecified comparisons are vs. control. Significance is shown as * p<0.05, ** p < 0.01, *** p < 0.005 and **** p < 0.001.
Data availability
Any information required to reanalyze the data reported in this paper is available from the corresponding authors upon reasonable request.
Results
Hv1 inhibition hampers the inflammatory activation profile of microglia.
Experiments were performed both on HAPI cells and primary microglia cultures, which both express Hv1 (Fig. S9). We first characterized the complete response properties of HAPI cells upon LPS/IFNγ-mediated activation and determined whether these properties would be altered by Hv1 block. HAPI cells were exposed to increasing concentrations of LPS (0.25–5 μg/ml) in the presence of 0.1 μg/ml IFNγ for 24 hours. Concentrations higher than 0.5 μg/ml of LPS (with 0.1 μg/ml IFNγ) reliably increased all inflammatory activation parameters measured (Fig. S2), consistent with a proinflammatory phenotype. We next established the maximal concentration of an Hv1 antagonist these cells could tolerate without observable cell death (Fig. S3). Cell death was quantified using MTS and LDH assays, during both basal and activated conditions (1 μg/ml LPS/0.1 μg/ml IFNγ), 24 hours after exposure to increasing concentrations (5–20 μm) of ClGBI, an Hv1 blocker. ClGBI is highly efficacious (~90% channel block) and the most potent (EC50 = 1 μM) of the guanidine-derived antagonists of the proton channel (Hong et al., 2014). We observed that 10 μM of the blocker was well-tolerated without any observable cell death in both resting and activated HAPI cells (Fig. S3 A–D). Next, using the MT-luciferase assay, we monitored the long-term viability of non-activated and activated HAPI cells that had been exposed to vehicle or 10 μM ClGBI for 24 h. No apparent long-term impact of Hv1 antagonism was observed in non-activated or activated cells after 72 hours after treatment (Fig. S3E, F). We next used the same approach in primary microglia cultures obtained from postnatal mouse brain. For these studies, we first evaluated the sensitivity of these cells to the presence of increasing concentrations of ClGBI, similar to the characterization performed in HAPI cells (Fig. S4). We found that the primary microglia cultures could withstand 10-fold less the concentration of the antagonist when compared to our cell line, showing as clear decrease in viability when exposed to ClGBI concentrations higher than 1 μM for 24 hours, both under basal and activated (1.0 μg/ml LPS/0.1 μg/ml IFN) conditions (Fig. S4A–D). Additionally, we assessed the effect of treatments on the long-term viability of microglia cultures. We found that after 4 weeks, the viability of activated microglia decreased by 50%. Co-administration of 1 μM ClGBI restored viability by 25% (Fig. S4E). Given these results, for subsequent studies we chose to utilize 1 μg/ml and 0.1 μg/ml LPS/IFNγ to activate both HAPI and primary microglial cells as well to utilize 10 μM ClGBI for HAPI cells and 1 μM ClGBI for primary microglia cultures to antagonize Hv1.
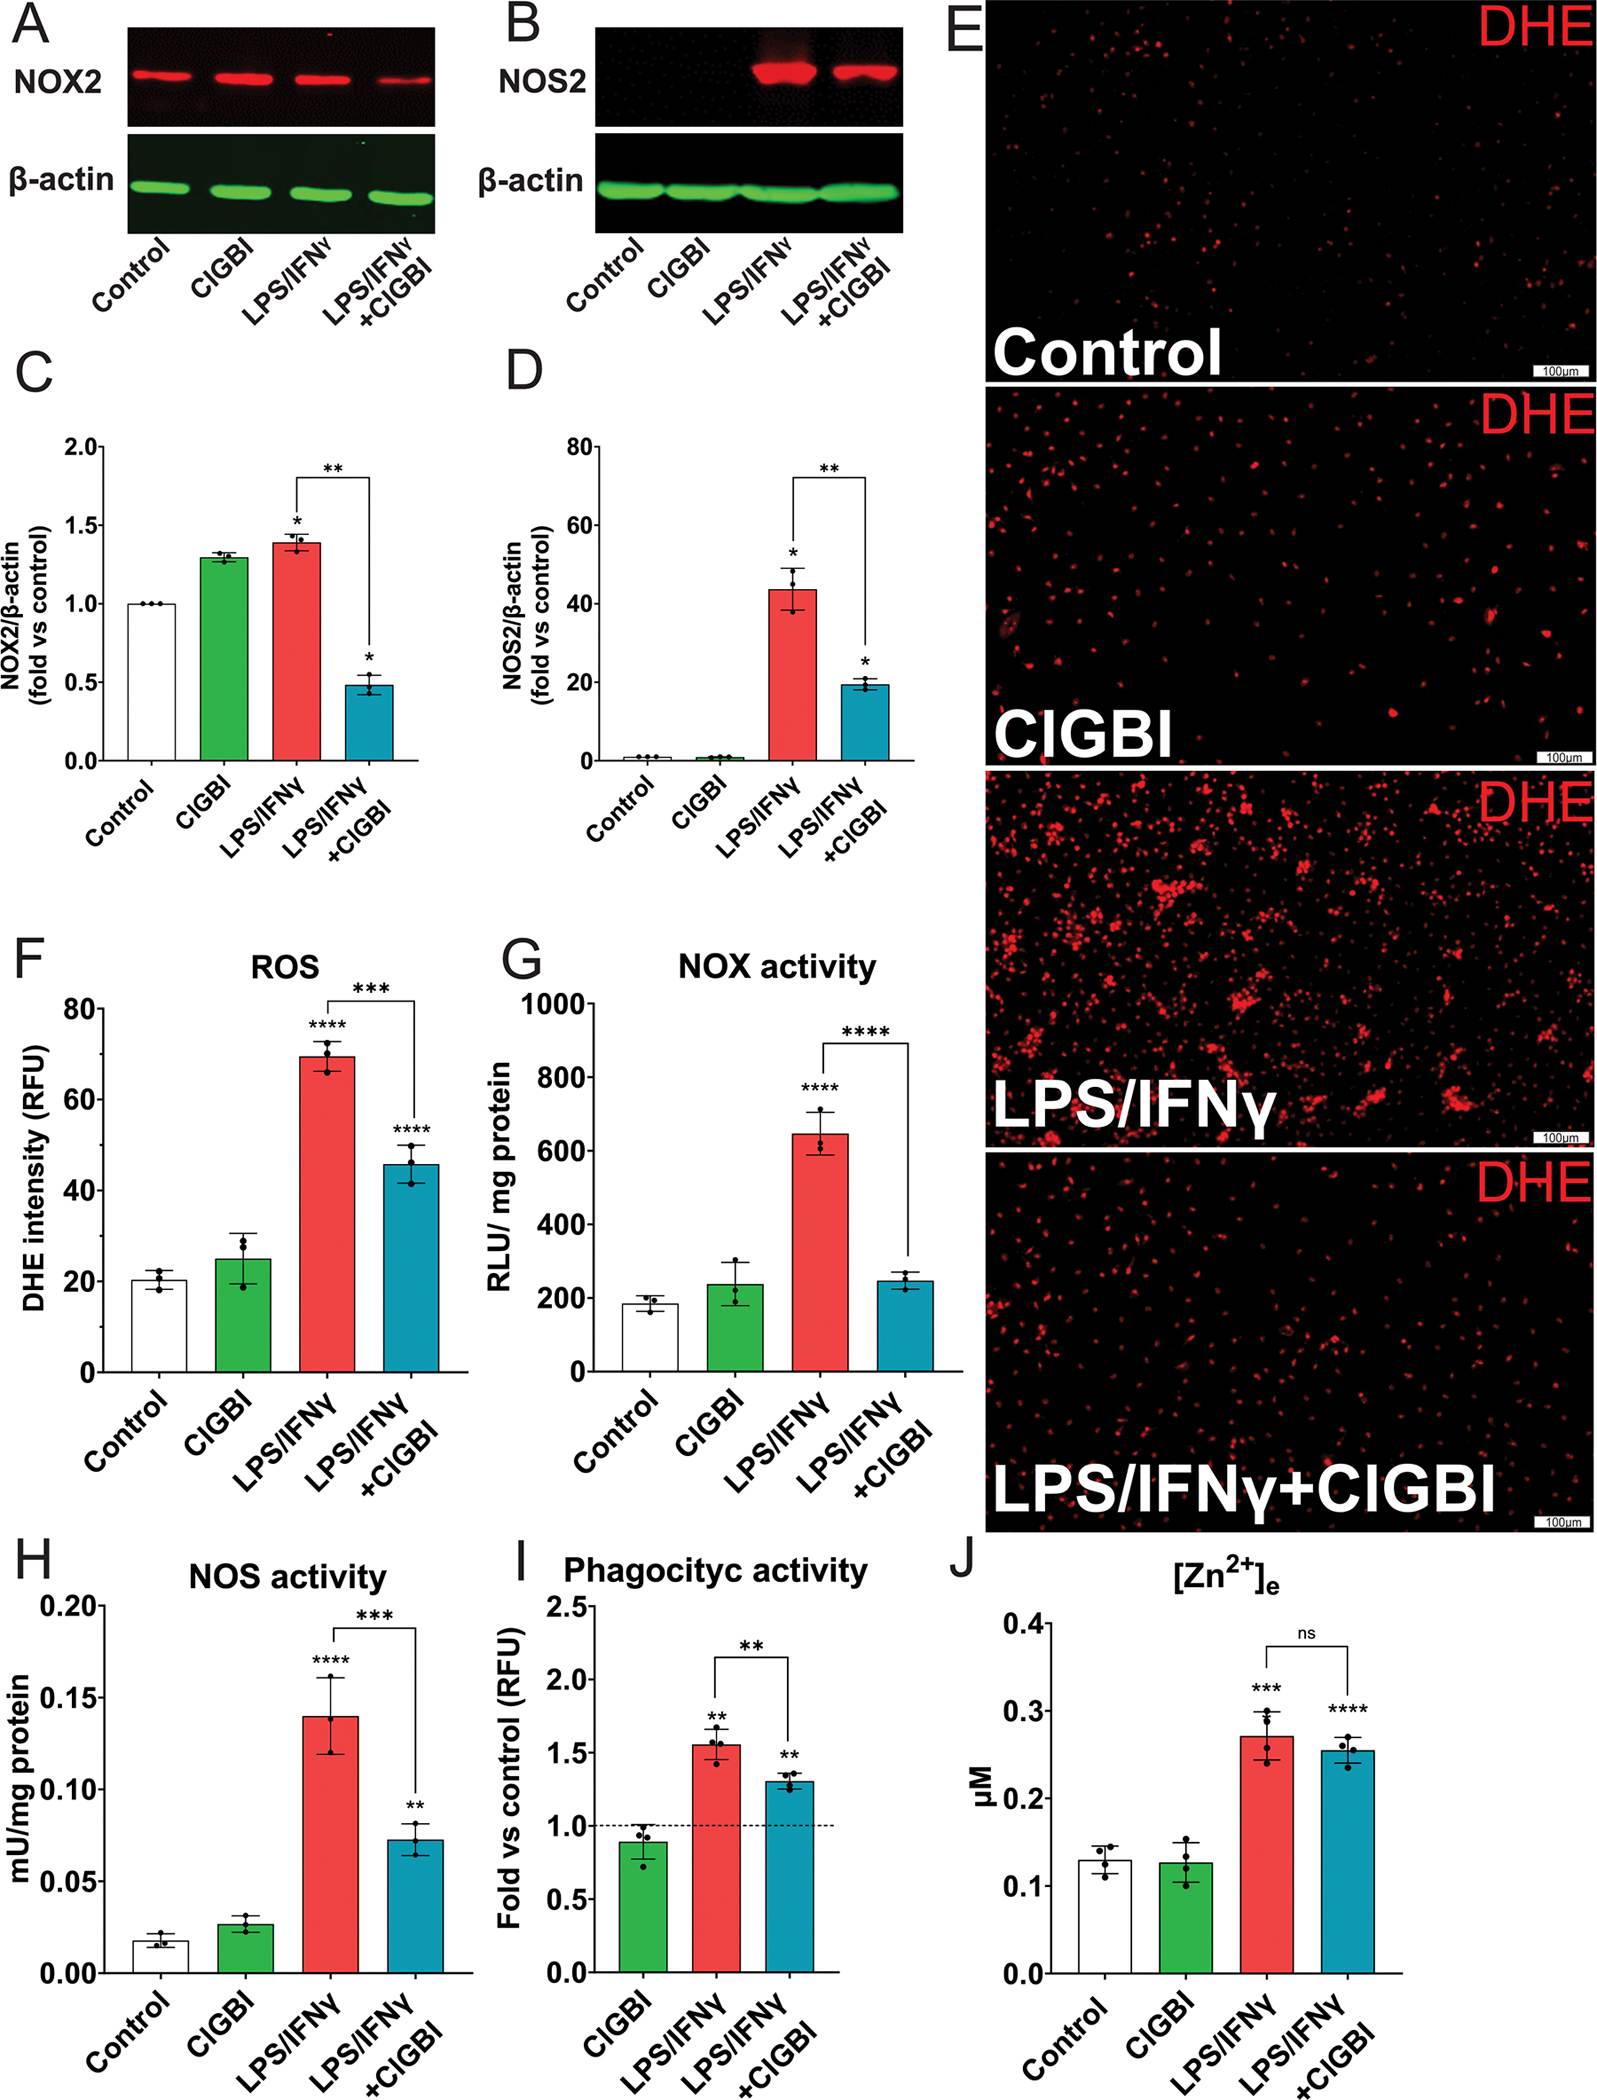
As our initial data suggested an increase in ROS production after activation of HAPI cells (Fig. S3B), we quantified the protein expression levels of the main reactive species-producing enzymes during HAPI cell activation, namely NOX2 (Fig. 1A and S11A) and NOS2 (Fig. 1B and S10B). We found that following HAPI cell activation NOX2 protein was increased nearly two-fold (Fig. 1C). Importantly, the presence of ClGBI during activation attenuated this response although incubation with ClGBI alone had a mild stimulatory effect (Fig. 1C). In the case of NOS2, activation produced a dramatic 60-fold increase in protein expression, while Hv1 inhibition during activation reduced NOS2 expression to approximately half this level (Fig. 1D). ROS production itself was next evaluated utilizing DhE fluorescence (Fig. 1E). We observed a substantial increase in fluorescence in activated cells, which was significantly mitigated by ClGBI (Fig. 1F). Given that Hv1 antagonism reduced the expression of both NOX2 and NOS2 in activated cells, we hypothesized that the ClGBI-mediated decrease in reactive species production was due, in part, to a reduction in NOX and NOS2 enzymatic activity. Indeed, quantification of enzymatic activity revealed that while NOX activity increased three-fold in response to activation, Hv1 inhibition completely suppressed this response (Fig. 1G and S6A). Additionally, activated cells showed a 20-fold increase in NOS2 activity, a phenomenon that was again partially blocked by Hv1 inhibition (FIG. 1H). We next quantified phagocytic activity to establish whether this important activation parameter could also be regulated by Hv1 antagonism. After activation, HAPI cells more than doubled their phagocytic activity, while co-administration of ClGBI effectively limited this increase and returned it near baseline levels (Fig. 1I and S6B). Finally, we measured the extracellular concentration of zinc ([Zn2+]e) since macrophage responses to LPS are associated with changes in zinc homeostasis (Gao et al., 2018). We observed a significant increase in [Zn2+]e, secondary to the activation of HAPI cells, which, in this case, was not modified by Hv1 antagonism (Fig. 1J). In sum, our data strongly suggest that HAPI microglial cells show a complete, general inflammatory pattern following activation. Furthermore, our data indicate that Hv1 antagonism during activation can effectively hamper the extent of reactive oxygen and nitrogen species generated by limiting their enzymatic production. Importantly, while activation leads to enhance phagocytic activity, Hv1 antagonism in activated microglia dampens but does not eliminate this critical function of these cells.
Figure 1. Hv1 inhibition hampers the inflammatory activation profile of HAPI cells.

Activation parameters were determined in the control group and HAPI cells treated with 1/0.1 μg/ml LPS/IFNγ, 10 μM ClGBI, or both, for 24 h. (A) Representative Western blot images for NOX2 and (B) NOS2; β-actin was used as a loading control. (C) Quantification of protein bands intensity density for NOX2/β-actin (Kruskal-Wallis test, N=4, df=3) and (D) NOS2/β-actin (Kruskal-Wallis test, N=4, df=3). (E) ROS detection. Representative micrographs of cells stained with DhE (red mark). Fields were arbitrarily selected, paired based on cell density, and the image was then captured at 10x (scale bar=100 μm). (F) Quantification of end point DhE fluorescence (one-way ANOVA, N=4, df=3, F=176.4). Data are expressed in relative fluorescence units (RFU). (G) NOX activity as determined by the resulting luminescence from lucigenin oxidation after the addition of NADPH (one-way ANOVA, N=4, df=3, F=123.1). Data are expressed as relative light units (RLU) per mg of protein. (H) Determination of NOS activity by colorimetry linked to nitric oxide production (one-way ANOVA, N=4, df=3, F=295.4). Data are presented as milli Units (mU) per milligram of protein. (I) Determination of phagocytic activity by quantifying the fluorescence intensity of internalized pre-labeled green E. coli (one-way ANOVA, N=4, df=2, F=64.36). (J) Determination of extracellular zinc by FluoZin3; results are expressed in μM based on a standard concentration curve of ZnCl2 in a Chelex-treated solution (one-way ANOVA, N=6, df=5, F=50.62). All values displayed represent the mean ± SEM of at least four biological replicates, each performed in technical triplicate. Graphs comparing values across groups were analyzed via (C, D) Kruskal-Wallis test with Dunn’s post-hoc for multiple comparisons and (F-J) one-way ANOVA with Tukey post-hoc for individual comparisons. Unspecified comparisons are vs. control. Significance is shown as *p<0.05 ** p < 0.01, *** p < 0.005 and **** p < 0.001.
Having established the inflammatory activation pattern of immortalized microglia cells and the extent to which Hv1 inhibition modifies key components of this phenotype, we next aimed to evaluate whether primarily microglial cells responded similarly. We compared the expression levels of NOX2 (Fig. 2A and S10C) and NOS2 (Fig. 2B and S10D) in primary mouse microglial cultures at rest and following activation, both with and without Hv1 inhibition. We observed that ClGBI (1μM) alone could enhance NOX2 expression in non-activated microglia, and that activation could further enhance this process (Fig. 2C). Strikingly, activation in the presence of the Hv1 blocker depressed NOX2 expression levels well below control levels (Fig. 2C). Similar to the results obtained with HAPI cells, activation promoted a dramatic ~40-fold increase in NOS2 expression in primary microglial cells, a phenomenon that was attenuated by Hv1 inhibition (Fig. 2D). The changes in expression of these two proteins were paralleled by enhanced DhE staining in activated cells, with a concomitant decrease in staining in ClGBI-treated activated cells (Fig. 2E; quantified in Fig. 2F). NOX activity, NOS activity and phagocytosis followed a similar pattern to that observed in HAPI cells, with increased activity upon activation, as well as inhibition by Hv1 antagonism (Fig. 2G–I). Once again, activated cells retained phagocytotic capabilities near what is normally observed by non-activated microglia in the presence of ClGBI, (Fig. 2I). Activated microglia presented a similar increase in [Zn2+]e to that observed in HAPI cells, while of greater magnitude. Upon activation, [Zn2+]e concentration increased nearly three-fold, and this response was again not attenuated by ClGBI treatment (Fig. 2J). Our findings suggest that ROS production and enhanced phagocytic activity are dependent on Hv1 activity and that its inhibition can have an important influence on their regulation. On the other hand, zinc release appears to be an activation parameter independent of Hv1 activity. Most importantly, the activation profile of HAPI cells appears to robustly reproduce what is normally observed in primary microglial cells making them a valuable tool in the study of brain inflammatory processes. As mentioned earlier, a distinct feature of these cells is their highly stable, quiescent resting state and robust activation profile.
Figure 2. Hv1 inhibition also hampers the inflammatory activation profile of primary mouse microglia.
Activation parameters were determined in the control group and microglia treated with 1/0.1 μg/ml LPS/IFNγ, 1 μM ClGBI, or both, for 24 h. See descriptions in Fig. 1 for individual panels. A similar activation profile is observed in both HAPI cells and primary mouse microglial cells. All parameters measured are the same in Figs. 1 and 2. All values displayed represent the mean ± SEM of at least three biological replicates, each performed in technical triplicate. (C) (one-way ANOVA, N=3, df=2, F=302.4) and (D) (one-way ANOVA, N=3, df=2, F=136.2). F) (one-way ANOVA, N=4, df=3, F=95.81). G) (one-way ANOVA, N=3, df=2, F=69.8). H) (one-way ANOVA, N=3, df=2, F=69.14). I) (one-way ANOVA, N=3, df=2, F=49.15). J) (one-way ANOVA, N=6, df=5, F=56.65). Graphs comparing values across groups were analyzed via (C, D) Kruskal-Wallis test with Dunn’s post-hoc for multiple comparisons and (F-J) one-way ANOVA with Tukey post-hoc for individual comparisons. Unspecified comparisons are vs. control. Significance is shown as *p<0.05 ** p < 0.01, *** p < 0.005 and **** p < 0.001.
Hv1 block prevents proton extrusion and acidifies the intracellular pH of activated microglia.
As Hv1 promotes proton extrusion in response to intracellular pH acidification, we next determined the impact of ClGBI on the intracellular (pHi) and extracellular (pHe) pH of HAPI cells, using BCFL-AM, an intracellular fluorescent indicator. First, we evaluated different concentrations of ClGBI (Fig. S5). We did not observe changes in pHi or pHe at any concentration of ClGBI tested (2.5–10 μM) on non-activated HAPI cells (Fig. S5A, B), further highlighting their stable resting state. However, following activation, a significant decrease in pHi, as well as an increase in pHe, was observed following 7.5–10 μM ClGBI treatment (Fig. 3A, B; Fig. S5C, D). These results indicate that activation leads to pronounced intracellular acidification and that Hv1 inhibition intensifies this effect. Moreover, this activation-induced intracellular acidification is associated with a decrease in proton extrusion, which can be assessed by a change in pHe. As such, both pHi and pHe can clearly be modulated by Hv1 inhibition in activated cells. These findings are consistent with the known function of the proton channel during microglial activation (Morgan et al., 2009; Wu, 2014), which are nicely recapitulated in our HAPI cell preparation. Finally, we confirmed that the activation and ClGBI-mediated changes in pHi and pHe observed in the cell line were also present in the primary microglial cells, which was indeed the case (Fig. 3C, D), further demonstrating the utility of HAPI cells as an excellent microglial cell line model.
Figure 3. Hv1 block prevents proton extrusion and acidifies the intracellular pH of both activated HAPI cells and microglia.

pH was determined fluorometrically in the control group and in cells treated with 1/0.1 μg/ml LPS/IFNγ, ClGBI (10 μM for HAPI cells and 1 μM for microglia) or both, for 24 h. Comparison of the (A) intracellular (one-way ANOVA, N=4, df=3, F=153.9) and (B) extracellular pH (one-way ANOVA, N=4, df=3, F=69.13) of non-activated and activated HAPI cells treated with 10 μM ClGBI demonstrate an decrease in intracellular pH as well as increased extracellular pHe in ClGBI-treated activated cells. Fluorometric determination of (C) intracellular (one-way ANOVA, N=3, df=2, F=100.4) and (D) extracellular pH of non-activated or activated microglia treated with or without 1 μM ClGBI (one-way ANOVA, N=3, df=2, F=69.61) demonstrating the same response as HAPI cells. pH measurements are based on calibrated BCFL-AM fluorescence. Extracellular pH was confirmed by a potentiometer. Data are expressed as units on the logarithmic pH scale and represented as mean ± SEM of at least three biological replicates, each performed in technical triplicate. Graphs comparing values across groups were analyzed via one-way ANOVA with Tukey post-hoc analysis for individual comparisons. Unspecified comparisons are vs. control. Significance is shown as ** p < 0.01, *** p < 0.005 and **** p < 0.001.
NOX2 activity promotes intracellular acidification in activated HAPI cells.
During microglial activation, ROS production by NOX2 results in a release of protons into the intracellular space. As such proton extrusion, particularly by Hv1, is necessary for maintaining electroneutrality. We investigated the impact of NOX2 activity on pHi using GSK279, a specific competitive inhibitor of NOX2 (Hirano et al., 2015). As previously noted, treatment with LPS/IFNγ led to a four-fold enhancement of NOX activity in HAPI cells. In contrast, activation in the continuous presence of GSK279 (1–100 μM) led to a concentration-dependent inhibition of NOX activity, reverting to near control activity at the highest concentration of the inhibitor (Fig. 4A). As NOX2 activity likely leads to the aforementioned intracellular acidification following activation, we confirmed that GSK279 similarly led to a concentration-dependent reversal of pHi changes observed in HAPI cells following treatment with LPS/IFNγ (Fig. 4B). Importantly, NOX2 inhibition could also effectively abrogate the enhanced acidification produced by Hv1 block in activated cells (Fig. 4C). To corroborate Hv1 inhibition as the specific mechanism of the observed effect, we used YHV98-4, a newly developed selective inhibitor of Hv1 (Zhang et al., 2022). After establishing the appropriate concentration of the treatment in non-activated and activated HAPI cells, we observed that YHV98-4 (1 μM) promotes the inhibition of NOX activity and the decrease of ROS in experiments similar to those performed with ClGBI (Fig. S7). These results suggest not only that NOX2 is largely responsible for the intracellular acidification secondary to activation but that the functional coupling between Hv1 and NOX2 governs intracellular pH during the microglial inflammatory response. Moreover, the enhanced intracellular acidification as a result of Hv1 block in activated cells is the likely mechanism behind ClGBI-mediated inhibition of NOX2 activation (Lam et al., 2013).
Figure 4. NOX2 activity promotes intracellular acidification in activated HAPI cells.

The follow parameters were determined in the control group and cells treated with 1/0.1 μg/ml LPS/IFNγ, 10 μM ClGBI or both, for 24 h. (A) Determination of NOX activity in activated HAPI cells in the presence of 1–100 μM GSK-279, a NOX2 inhibitor. Activity was determined via quantification of luminescence resulting from the oxidation of lucigenin and expressed as relative light units (RLU) per mg of protein (one-way ANOVA, N=4, df=3, F=103.9). (B) Fluorometric determination of intracellular pH in activated HAPI cells treated with 1–100 μM GSK-279 (one-way ANOVA, N=3, df=2, F=95). (C) Comparison of intracellular pH in non-activated and activated HAPI cells treated with 10 μM ClGBI and 100μM GSK279 (one-way ANOVA, N=4, df=3, F=106.2). The pH values were extrapolated from the detection of BCFL-AM fluorescence and are expressed as units on the logarithmic pH scale. All data are presented as mean ± SEM of at least three biological replicates, each performed in technical triplicate. Analysis via one-way ANOVA with Tukey post-hoc analysis for individual comparisons. Unspecified comparisons in all panels are vs. control. Significance is shown as * p < 0.05, ** p < 0.01, *** p < 0.005 and **** p < 0.001.
Pharmacological inhibition of Hv1 modifies the activation metabolic profile.
As intracellular acidification is associated with intermediary metabolism changes (Busa & Nuccitelli, 1984; Song et al., 2022), we next measured critical metabolic parameters under basal and activated conditions in HAPI cells. First, we assessed intracellular lactate (lactatei) concentrations, since proinflammatory microglial activation is associated with increased lactic fermentation (Song et al., 2022). Intracellular lactate increased almost four-fold during activation, compared to control, a phenomenon that was significantly attenuated by ClGBI treatment (Fig. 5A). Additionally, activation not only promoted lactate production but also its release into the extracellular space. After 24 hours of treatment with LPS/IFNγ, the concentration of extracellular lactate (lactatee) increased more than fifteen times baseline levels, which, again, was strongly inhibited by Hv1 block (Fig. 5B). These changes were also reflected by total lactate measurements (Fig. 5C). Subsequently, we investigated whether these metabolic changes were also present in activated primary microglial cultures. The effects of activation and Hv1 blockade on the concentrations of lactatei, lactatee and total lactate seen in HAPI cells were all equally present in this system (Fig. 5G–I). To determine if the decrease in lactate production was associated with a reduction in the glycolytic rate, we measured the flux from glucose to glucose-6-phosphate (indirect glucose utilization) and pyruvate kinase (PK) activity in HAPI cells. Activation produced an increase in glucose utilization and PK activity (Fig. S8). Surprisingly, Hv1 blockade intensified the glucose utilization which is classically associated with proinflammatory activation (Fig. S8A). This effect could be due to an increase in glucose transport in response to intracellular acidification or indirectly due to changes in mitochondrial function, a parameter also sensitive to intracellular pH. This, however, must be confirmed through directly glucose uptake determination. Additionally, ClGBI also decreases PK activity (Fig. S8B), probably resulting in reduced glycolytic flux despite the increase in glucose utilization.
Figure 5. Pharmacological inhibition of Hv1 modifies the activation metabolic profile of HAPI cells and mouse microglial cells.

The follow parameters were determined in the control group and cells treated with 1/0.1 μg/ml LPS/IFNγ, ClGBI (10 μM for HAPI cells and 1 μM for microglia) or both, for 24 h. Determination of (A) intracellular (one-way ANOVA, N=3, df=2, F=57.55), (B) extracellular (one-way ANOVA, N=3, df=2, F=170.3), and (C) total lactate (one-way ANOVA, N=3, df=2, F=123.3) using a bioluminescence reductase/luciferase system in non-activated and activated HAPI cells and (G) intracellular (one-way ANOVA, N=3, df=2, F=56.33), (H) extracellular (one-way ANOVA, N=3, df=2, F=226.6, P < 0.001), as well as (I) total lactate (one-way ANOVA, N=3, df=2, F=189.04) of non-activated and activated mouse microglia in the absence or presence of 10 μM ClGBI. Data are expressed as lactate concentration (μM) based on a standard curve provided by the manufacturer. Measurement of D) NAD+ (one-way ANOVA, N=3, df=2, F=9.66) and E) NADH (one-way ANOVA, N=3, df=2, F=98.36) by a colorimetric assay in non-activated and activated HAPI cells, as well as the (J) NAD+ (one-way ANOVA, N=3, df=2, F=4.23) and K) NADH (one-way ANOVA, N=3, df=2, F=16.21) concentration in mouse microglia in the absence and presence of 10 μM ClGBI. Additionally, we report the resulting NAD+/NADH in F) HAPI cells (one-way ANOVA, N=3, df=2, F=34.7) and L) mouse microglia (one-way ANOVA, N=3, df=2, F=47.71) ratios which were normalized to control ratios (dotted line). Data in D, E, J, and K are expressed as the concentration of NAD+ or NADH (ng per mg of protein) based on a curve provided by the manufacturer. The results are presented as the mean ± SEM of at least three biological replicates, each performed in technical triplicate. Graphs comparing values across groups were analyzed via one-way ANOVA with Tukey post-hoc analysis for individual comparisons. Graphs comparing values to normalized controls (dashed lines) and across groups in F and L were analyzed via Kruskal-Wallis test with Dunn’s post-hoc multiple comparisons (N=3, df=2). Unspecified comparisons are vs. control. Significance is shown as *p < 0.05, **p < 0.01, ***p < 0.005 and ****p < 0.001.
An indicative parameter of the shift in the metabolic response of cells is the NAD+/NADH redox state. An increase in NAD+/NADH ratio is generally associated with metabolic stress (Winkler & Hirrlinger, 2015). Activated HAPI cells showed a moderate decrease in NAD+ compared to non-activated cells, which could be completely prevented by Hv1 inhibition (Fig. 5D). Additionally, we found that activation dramatically decreased the concentration of NADH when compared to non-activated cells, an effect that was again mitigated by ClGBI (Fig. 5E). These changes in NAD+ and NADH led to a 4-fold increase in the NAD+/NADH ratio upon activation, which was significantly attenuated by Hv1 antagonism (Fig. 5F). A nearly identical pattern of NAD+ and NADH changes were observed in primary microglia cultures (Figs. 5J–L). These results suggest that activation promotes lactate production and NADH consumption, processes directly associated with increased glycolysis.
Hv1 inhibition promotes an anti-inflammatory activation phenotype.
As the microglial activation phenotype can be strongly influenced by metabolic changes (Baik et al., 2019; Jha & Morrison, 2020), we next characterized the secreted factors profile of both non-activated and activated HAPI cells and primary microglia in the presence and absence of ClGBI. To do so, we quantified the concentration of cytokines in the culture medium of cells in the aforementioned conditions. We first quantified levels of the pro-inflammatory cytokines IL-1 β, IL-6, and TNFα. Interestingly, ClGBI alone moderately increased the production of IL-1β in non-activated HAPI cells, when compared to control. IL-1β levels were further increased in activated cells. However, in this case, Hv1 block did not modify the response (Fig. 6A). In contrast, ClGBI alone did not influence IL-1β production in non-activated primary microglia cultures, but it did significantly reverse the increased production of this cytokine in activated cultures (Fig. 7A). Both HAPI and primary microglial cell activation produced a robust increase in IL-6 production, with ClGBI co-treatment markedly inhibiting its production (Fig. 6B and 7B). A similar pattern was observed with TNFα production, and its inhibition by ClGBI, in both HAPI (Fig. 6C) and microglial cells (Fig. 7C). These results confirmed that upon activation both our models increase production of well-known pro-inflammatory cytokines, which are largely suppressed by Hv1 antagonism.
Figure 6. Hv1 inhibition promotes an anti-inflammatory HAPI cells activation phenotype.

The follow parameters were determined in the control group and cells treated only with 1/0.1 μg/ml LPS/IFNγ, 10 μM ClGBI or both, for 24 h. Determination of (A) IL-1β (one-way ANOVA, N=3, df=2, F=71.48), (B) IL-6 (one-way ANOVA, N=3, df=2, F=1571), (C) TNFα, (one-way ANOVA, N=3, df=2, F=537.2) (D) IL-4, (one-way ANOVA, N=3, df=2, F=23.88) (E) IL-10 (one-way ANOVA, N=3, df=2, F=105) and (F) TGF-β (one-way ANOVA, N=3, df=2, F=8.473) by ELISA immunoassay in the culture medium of non-activated and activated HAPI cells in the presence of 10 μM ClGBI. Results are expressed as cytokine concentration per ml (pg/ml). (G) Representative images obtained by immunocytochemistry (40x) of the morphology of non-activated (white arrow) and activated (red arrow) HAPI cells stained with Iba-1 (green). Scale bar = 20 μm. (H) Analysis of the mean area of activated and non-activated HAPI cells in the presence or absence of 10 μM ClGBI (one-way ANOVA, N=4, df=3, F=29.49). The results are expressed in μm2. Results are presented as the mean ± SEM of three biological replicates, each performed in technical triplicate. Results were analyzed via one-way ANOVA with Tukey post-hoc analysis for individual comparisons. Unspecified comparisons are vs. control. Significance is shown as **p < 0.01, ***p < 0.005 and ****p < 0.001.
Figure 7. Hv1 inhibition also promotes an anti-inflammatory microglial activation phenotype.

Activation parameters were determined in the control group and microglia treated with 1/0.1 μg/ml LPS/IFNγ, 1 μM ClGBI or both, for 24 h. Determination of (A) IL-1β (one-way ANOVA, N=3, df=2, F=170.4), (B) IL-6 (one-way ANOVA, N=3, df=2, F=63.68), (C) TNFα, (one-way ANOVA, N=3, df=2, F=65.53) (D) IL-4, (one-way ANOVA, N=3, df=2, F=12.36) (E) IL-10 (one-way ANOVA, N=3, df=2, F=35.21) and (F) TGF-β (one-way ANOVA, N=3, df=2, F=31.81) by ELISA immunoassay in the culture medium of non-activated and activated primary mouse microglia cells in the presence of 1 μM ClGBI. Results are expressed as cytokine concentration per ml (pg/ml). (G) Representative images obtained by immunocytochemistry (40x) of the morphology of non-activated (white arrow) and activated (red arrow) HAPI cells stained with Iba-1 (green) and DAPI (blue). Scale bar = 20 μm. (H) Analysis of the mean area of activated and non-activated microglia in the absence and presence of 10 μM ClGBI. The results are expressed in μm2 (one-way ANOVA, N=4, df=3, F= 20.38). Results are presented as the mean ± SEM of three biological replicates, each performed in technical triplicate. They were analyzed via one-way ANOVA with Tukey post-hoc analysis for individual comparisons. Unspecified comparisons are vs. control. Significance is shown as * p < 0.05, ** p < 0.01, *** p < 0.005 and **** p < 0.001.
Given these findings and our data demonstrating that Hv1 hampers inflammatory activation (Fig. 1 and 2), we examined whether Hv1 could also promote an anti-inflammatory phenotype. We quantified three cytokines directly associated with anti-inflammatory responses in microglia, namely IL-4, IL-10, and TGF-β. HAPI and microglial cell activation was accompanied by a moderate decrease in IL-4, which was normalized to control levels by ClGBI in both cell types (Fig. 6D and 7D). In contrast to these observations, the patterns of IL-10 production differed between HAPI (Fig. 6E) and primary microglial (Fig. 7E) cells. In both cases, production of this neuroprotective cytokine increased upon activation. We observed a nearly 50% decrease in IL-10 levels in HAPI cells treated with ClGBI alone as well as a similar decrease in activated cells exposed to the Hv1 antagonist. In contrast, we did not observe a decrease in IL-10 in non-activated or activated primary microglial cells treated with ClGBI. TGF-β, a potent inducer of anti-inflammatory polarization (Islam et al., 2018), decreased following activation in both cell types. For this cytokine, we did not observe a significant rescue in production by ClGBI in either HAPI or microglial cells, although there was a trend towards recovery in the cell line model (Fig. 6F and 7F). These results suggest a complex effect of Hv1 inhibition on anti-inflammatory cytokine production in the cell line and primary microglia cultures. However, the general pattern observed is one in which an anti-inflammatory phenotype is maintained in activated cells when Hv1 is blocked, favoring an IL-4 (and perhaps TGF-β) characterized neuroprotective profile in HAPI cells, and an IL-4/IL-10 profile in the mouse microglial cultures.
Finally, we examined the morphological changes associated with HAPI and microglial cell activation by means of Iba-1 labeling (Fig. 6G and 7G) and corroborated that activation is associated with an increase in cell area, a change that is prevented by Hv1 antagonism (Fig. 6H and 7H). Control non-activated HAPI cells generally presented a compact, uniform, and rounded soma, with few projections. This morphology appeared unaffected by the presence of ClGBI alone. After treatment with LPS/IFNγ, we observed an increase in the size of the soma as well as the acquisition of an irregular appearance. When activation occurred during Hv1 inhibition, cells exhibited both types of morphology, although the vast majority resembled non-activated cells. This morphology activation pattern suggests the acquisition of an alternative or mixed phenotype (Fernandez-Arjona et al., 2017) under these conditions (Fig. 6G and 6H), which is consistent with their secreted factors profile. Similarly, to the cell line, ClGBI treatment in non-activated microglial cells did not change their morphology. However, after 24 hours of LPS/IFNγ treatment, we observed a significant increase in the size of the soma and a reduction in the number of processes, correlating with a classic proinflammatory activation profile (Fernandez-Arjona et al., 2017). Treatment of activated microglia with ClGBI again resulted in a morphological profile more akin to the non-activated state (Fig. 7G and 7H).
Hv1 inhibition during activation reduces inflammatory neurotoxicity.
The results presented thus far show that Hv1 inhibition decreases the microglial production of reactive species and proinflammatory mediators, while promoting the release of anti-inflammatory cytokines. To determine the functional implications of these changes to the activation profile of microglia, we examined their neurotoxicity in the presence and absence of ClGBI. Primary rat cortical neuron cultures were exposed to conditioned medium from non-activated and activated HAPI (Fig. 8A) and microglial cells (Fig. 9A) treated with or without ClGBI. Twenty-four hours after exposure, neuronal viability was quantified by LDH and MTS assays. Cortical cultures exposed to conditioned medium from activated HAPI and microglial cultures, resulted in a significant loss of neuronal viability as evidenced by increased LDH release (Fig. 8B and 9B). Critically, we found that Hv1 antagonism with ClGBI during activation prevented the neurotoxicity of the conditioned medium (Fig. 8B and 9B). These findings were confirmed in the MTS assay (decreasing cell death from 31.1 to 11.7%, Fig. 8C and from 46.2 to 23.7%, Fig. 9C). These data strongly suggest that in the presence of an Hv1 blocker, the secretion of neurotoxic factors by activated microglia is significantly attenuated.
Figure 8. Hv1 inhibition during activation reduces HAPI cells inflammatory neurotoxicity.

The follow parameters were determined in the control group and HAPI cells treated only with 1/0.1 μg/ml LPS/IFNγ, 10 μM ClGBI or both, for 24 h. (A) Schematic of the treatment of mixed cortical cultures with conditioned medium obtained from nonactivated and activated HAPI cells (created with Biorender.com). Results were normalized to baseline LDH (B) or MTS (C-G) values from mixed cortical cells cultures treated with HAPI cell medium that was never exposed to the HAPI cells themselves. (B) Toxicity as evidenced by the LDH release from mixed cortical cultures treated with conditioned medium from non-activated and activated HAPI cells in the absence and presence of 10 μM ClGBI (one-way ANOVA, N=4, df=3, F=39.01). (C) Viability of mixed cortical cultures treated with conditioned medium from HAPI cells (as shown in A) was also determined with an MTS colorimetric assay (one-way ANOVA, N=4, df=3, F=57.1). (C-F) Determination of specific neurotoxic components of the secreted factors through MTS assay of mixed cortical cultures treated with conditioned medium and D) an antioxidant (100 μM EUK134; one-way ANOVA, N=4, df=3, F=40.01), (E) an extracellular zinc chelator (5 μM ZX1; one-way ANOVA, N=4, df=3, F=30.55), (F) interleukin 6 neutralizing antibody (IL-6 nAb; one-way ANOVA, N=4, df=3, F=27.07) and (G) TNF-α neutralizing antibody (TNF-α nAb; one-way ANOVA, N=4, df=3, F=22.53, P<0.0001). Results were normalized to baseline LDH (B) or MTS (C-G) values from cells treated with HAPI cell medium that was never exposed to the HAPI cells themselves. Results are expressed as either relative LDH release (B), or percent viability (C-G) as the mean ± SEM of four biological replicates, each performed in technical triplicate. Data were analyzed via one-way ANOVA with Tukey post-hoc analysis for individual comparisons. Unspecified comparisons in B and C were vs. control. Significance is shown as *p < 0.05, ***p < 0.005 and ****p < 0.001.
Figure 9. Hv1 inhibition during activation also reduces microglia inflammatory neurotoxicity.

The follow parameters were determined in the control group and microglia cells treated with 1/0.1 μg/ml LPS/IFNγ, 1 μM ClGBI or both, for 24 h. (A) Schematic illustrating of the treatment of mixed cortical cultures with conditioned medium obtained from non-activated and activated HAPI cells (created with Biorender.com). (B) Toxicity as evidenced by the LDH release from mixed cortical cultures treated with conditioned medium from non-activated and activated primary mouse microglia cells in the absence and presence of 1 μM ClGBI (one-way ANOVA, N=4, df=3, F=46.27). (C) Viability of mixed cortical cultures treated with conditioned medium from primary mouse microglial cells (as shown in A) was also determined using an MTS colorimetric assay (one-way ANOVA, N=4, df=3, F=67.1). (D-G) Determination of specific neurotoxic components of secreted factors trough MTS assay of cortical cultures treated with conditioned medium and (D) an antioxidant (100 μM EUK134; one-way ANOVA, N=4, df=3, F=68.41), (E) an extracellular zinc chelator (5 μM ZX1; one-way ANOVA, N=4, df=3, F=68.41), (F) interleukin 6 neutralizing antibody (IL-6 nAb; one-way ANOVA, N=4, df=3, F=50.58) and (G) TNF-α neutralizing antibody (TNF-α nAb; one-way ANOVA, N=4, df=3, F=61.52). Results were normalized to baseline LDH (A) or MTS (C-G) values from mixed cortical cultures treated with HAPI cell medium that was never exposed to the HAPI cells themselves. Results are expressed as either relative LDH release (B), or percent viability (C-G) as the mean ± SEM of four biological replicates, each performed in technical triplicate. Data were analyzed via one-way ANOVA with Tukey post-hoc analysis for individual comparisons. Unspecified comparisons in B and C were vs. control. Significance is shown as **p < 0.01, ***p < 0.005 and ****p < 0.001.
Having demonstrated that Hv1 inhibition limits neurotoxicity associated with the release of pro-inflammatory mediators by activated microglia, we turned our focus to identifying the diffusible molecules that contribute to the observed neurotoxic profile in our cell models. As oxidative stress is closely related to inflammatory neurotoxicity (Simpson & Oliver, 2020), we first assessed whether antioxidant exposure could increase neuronal viability using the MTS assay. Indeed, EUK134 (100 μM), a synthetic superoxide dismutase/catalase mimetic (Himori et al., 2017; Rong et al., 1999), provided neuroprotection (decreasing death by ~14%) against toxicity associated with HAPI and microglial conditioned media exposure (Figs. 8D and 9D). Given that extracellular zinc is neurotoxic to our cortical cultures (He & Aizenman, 2010) and that we demonstrate that activation in both HAPI cells and microglia causes an increase in extracellular Zn2+, we evaluated whether the extracellular zinc chelator ZX1 (Pan et al., 2011) (5 μM) could provide some degree of neuroprotection to conditioned media exposure. Indeed, ZX1 treatment significantly increased neuronal viability (decreasing death by ~18%) in cortical cultures exposed to conditioned media from activated microglia (Fig. 8E and 9E). Finally, we used neutralizing antibodies to block the activity of IL-6 (Liu et al., 2021) and TNFα (Muendlein et al., 2021), neurotoxic cytokines released during activation in both our models. Surprisingly, neutralization of IL-6 (5 μg/ml) was not sufficient to reverse the neurotoxicity induced by the conditioned media from either activated HAPI (Fig. 8F) or microglial (Fig. 9F) cultures. In contrast, we found that a TNFα neutralizing antibody (5 μg/ml) significantly increased the viability (decreasing death by ~30%) in both cases (Fig. 8G and 9G). Of note, none of the neuroprotective actions of EUK134, ZX1 or TNFα neutralization were additive with the previously noted protective actions of ClGBI (Fig. 8D–G and 9D–G), suggesting that Hv1 block protects neurons, in part, by preventing sufficient pro-inflammatory cytokine production by activated microglial cells.
Hv1 inhibition promotes microglia-mediated neuroprotection during excitotoxic damage.
In the next set of experiments, we evaluated: i) whether co-cultures of microglia and cortical cells resulted in neurotoxicity following activation, ii) whether inducing excitotoxicity in neurons could itself result in microglial activation and further enhance neurotoxicity, and iii) whether Hv1 inhibition could restore neuronal viability following microglial activation and/or excitotoxic insults (Fig. 10A). In both our HAPI/cortical and microglia/cortical co-cultures we observed a 2-fold increase in LDH release following activation, indicating, once again, that microglial activation results in neurotoxicity (Fig. 10B, E). Importantly, in both cases, the presence of ClGBI abrogated the neurotoxicity (Figs. 10B, E). Since an elevated LDH could be reflective of the presence of injured microglia (induced by dying neurons), neurons, or astroglia in our cortical cultures, we took advantage of a luciferase viability assay in previously transfected neurons, which exclusively reflects neuronal viability in co-culture or mixed culture conditions (Aras et al., 2008; Schulien et al., 2020). Using this assay, we confirmed both a decrease in neuronal viability (~44%) following microglial activation, as well as neuroprotection by Hv1 block (decreasing death by ~20%). Also, we note that since Hv1 inhibition restored viability to near control levels in both LDH and luciferase assay, it is likely that the LDH signal was of neuronal and not of microglial or astroglial origin (Fig. 10C, F).
Figure 10. Hv1 inhibition promotes microglial-mediated neuroprotection from excitotoxic damage.

The follow parameters were determined in the control group and cells treated only with 1/0.1 μg/ml LPS/IFNγ, ClGBI (10 μM for HAPI cells and 1 μM for microglia) or both, for 24 h. (A) Schematic showing the treatment of co-cultures subjected to excitotoxic damage (created with Biorender.com). Data were normalized to baseline LDH values from neuronal cultures without HAPI cells or mouse microglia. Non-activated or previously activated HAPI cells (B-D) or primary mouse microglia (E-G) were plated directly on top of mixed cortical cultures or mixed cortical cultures that were previously transfected with a luciferase reporter to directly asses neuronal viability (C, D, F, G), as described earlier (Knoch et al., 2008). Activated (B) HAPI cells (one-way ANOVA, N=4, df=3, F=122.3) and (E) microglia induced neurotoxicity (one-way ANOVA, N=4, df=3, F=42.64), as evidenced by LDH release from the co-culture after 24 h, which was attenuated by ClGBI. Similar results were obtained with the luciferase viability assay on (C) HAPI cells (one-way ANOVA, N=4, df=3, F=52.28) and (F) mouse microglia (one-way ANOVA, N=4, df=3, F=73.09). Mixed cortical cultures were then exposed overnight to the glutamate transporter inhibitor TBOA (75 μM) to induce excitotoxicity, in the absence or presence of 10 μM ClGBI (10 μM for HAPI and 1 μM for mouse microglia), and with or without co-cultures of non-activated or previously activated (+/− ClGBI) D) HAPI cells (one-way ANOVA, N=3, df=2, F=77.58) or (G) mouse microglia (one-way ANOVA, N=3, df=2, F=85.18). TBOA-induced excitotoxicity alone was not abrogated by ClGBI. However, the proton channel blocker rescued neurons from the enhanced TBOA excitotoxicity induced by activated HAPI and microglial cells. Results are expressed as either relative LDH release (B, E), or percent viability (C, D, F, G) as the mean ± SM of four biological replicates, each performed in technical triplicate and analyzed via one-way ANOVA with Tukey post-hoc analysis for individual comparisons. Undefined comparisons are vs. control. Significance is shown as ***p < 0.005 and ****p < 0.001.
We next explored whether microglia were protective against a canonical excitotoxic insult and whether Hv1 antagonism modified this response. We first exposed cortical cultures alone to the glutamate uptake inhibitor TBOA (75 μM), noting, as expected (Schulien et al., 2020; Yeh et al., 2017), a substantial decrease in neuronal viability (46%), as measured by the luciferase assay (Fig. 10D). In the absence of HAPI cells, the observed excitotoxicity was not influenced by the presence of the Hv1 blocker. In contrast, when neurons were in co-culture with non-activated HAPI or microglial cells, TBOA toxicity could be partially ameliorated by ClGBI (decreasing death by ~20% Figs. 10D and 10G), indicating that neuronal excitotoxic injury, in and of itself, is sufficient to trigger microglial cell activation, as observed in other systems (Hernandez-Espinosa et al., 2019).
Moreover, we observed increased TBOA toxicity when neurons were exposed to previously activated HAPI or microglial cells (~21% increase), an effect that was lost when ClGBI was present during activation. However, when HAPI or microglial cells were activated in the absence of Hv1 block, ClGBI was protective if added during the TBOA exposure, decreasing neuronal death by ~20% (Figs. 10D and 10G, right two sets of bar graphs). This critically important result indicates that Hv1 block not only prevents neurotoxicity mediated by activated microglia but also, by reprogramming these cells, Hv1 antagonism can generate an overall neuroprotective environment that is protective against a separate excitotoxic insult.
Discussion
In this work we report that pharmacologic inhibition of Hv1 during proinflammatory activation decreases microglial neurotoxicity and, critically, promotes neuroprotection against excitotoxic damage. Hv1 antagonism decreases the enzymatic production of reactive species, primarily through inhibition of NOX2. Despite ClGBI’s marked effect on NOX2 activity, Hv1 antagonism only partially blocks NOS2 and phagocytic activity, which are processes also associated with neuroprotection (Jantaratnotai et al., 2006; Stefano et al., 2004). We also observed that the profile of secreted factors from activated HAPI cells and microglia are characterized by a significant increase in proinflammatory cytokines (IL-1β, IL-6, and TNFα) and the reduction in anti-inflammatory cytokines (IL-4 and TGFβ). These characteristics are consistent with what has been reported in various models of proinflammatory activation (Jiang et al., 2021; Smith et al., 2012). Adding to this body of work, we report that Hv1 antagonism promotes a drastic change in the secreted factors, characterized by a decrease in the pro-inflammatory cytokines IL-6 and TNFα in both primary and immortalized microglia as well as a decrease in IL-1β in primary microglia and an increase in the neurotrophic cytokine IL-4 in both systems as well as an increase in IL-10 in primary microglia. These changes in the secreted factors following microglial activation indicates that ClGBI promotes the acquisition of an anti-inflammatory phenotype by decreasing the production of proinflammatory factors and tilting the balance towards the release of neurotrophic cytokines.
Additionally, we assessed the neurotoxic capacity of the activated microglia secreted factors in cortical neurons and whether this process could be modified by Hv1 antagonism. We found that conditioned media from activated microglia was indeed neurotoxic, and this toxicity was mainly dependent on the release of TNFα, as well as on the production of ROS and the release of extracellular zinc. Hv1 inhibition did not add to the neuroprotection provided by the neutralization of TNFα nor the use of an antioxidant or a zinc chelator, suggesting that, in fact, these are the activation changes promoted by Hv1 blockade that are associated with increased neuronal viability.
Hv1 normally extrudes protons into the extracellular space, a crucial process when metabolism and ROS production by NOX2 activity increase during activation (Kettenmann et al., 2011; Morgan et al., 2009). In non-activated microglia, the intracellular pH does not fluctuate significantly, which helps to keep Hv1 in a closed state (Decoursey, 2012). After activation, NOX2 activity increases, which causes a rapid increase in the intracellular proton concentration. This rise in intracellular proton concentration promotes increased activity of Hv1, triggering a mechanism responsible for regulating microglial pH and maintaining electroneutrality (Kawai et al., 2017; Kawai et al., 2018). We observed that ClGBI, as expected, blocked proton outflow, inducing a greater intracellular acidification, while at the same time, preventing a decrease in extracellular pH. We posit that the decreased extracellular pH changes observed in our system after Hv1 inhibition may also contribute to the observed increased neuronal viability, as extracellular acidity can be neurotoxic (Li et al., 2021). These observations are consistent with the neuroprotection observed in genetic models of Hv1 depletion (Ritzel et al., 2021).
Microglial activation is a rapid response that depends on a very flexible metabolism to satisfy the energetic requirements for surface marker expression and cytokine and reactive species production (Bernier et al., 2020; Chausse et al., 2021; Lauro & Limatola, 2020; Takeda et al., 2021). In this study we corroborate that activation promotes an increase in lactate production, secondary to a boost in the glycolytic rate, as shown by increased glucose utilization and PK activity. Increased glycolytic rate and lactate production are a common phenomenon in pro-inflammatory activation, and, in fact, high lactate concentrations are directly associated with IL-6 and TNFα production (Borst et al., 2019; Jha & Morrison, 2020; Soto-Heredero et al., 2020). Additionally, we found an increased NAD+/NADH ratio in activated microglia, which is also associated with changes in the glycolytic flux (Ghosh et al., 2018). Remarkably, ClGBI modifies the metabolic response to microglia activation through inhibition PK activity, the decrease of the NAD+/NADH ratio and lactate production. PK inhibition could be the main cause of the decrease in lactate production and the subsequent decrease in the NAD+/NADH ratio, probably through transcriptional or allosteric modifications promoted through increased acidification (Fenton & Hutchinson, 2009). Since decreased flux in the glycolytic pathway may be due to increases in other glucose utilization pathways (e.g., PPP), the ultimate effect of these changes on carbohydrate metabolism needs to be carefully explored in future studies.
Although the loss of Hv1 function has previously been associated with the acquisition of anti-inflammatory responses (Kremlev & Palmer, 2005; Kremlev et al., 2004; Lannes et al., 2017; Provenzano et al., 2021), the precise mechanism mediating this process has, until now, remained undefined. A microglial metabolic shift has been correlated with proinflammatory cellular responses characterized by an increased glycolysis and the decline in mitochondrial ATP production (Srivastava, 2016). Hv1 inhibition considerably decreases PK activity, lactate production, as well as the NAD+/NADH ratio. Interestingly, glycolytic flux and lactic fermentation decline are associated with less proinflammatory activation phenotypes (Rice et al., 2002). Together, these findings suggest that Hv1 blockage promotes a negative regulation of glycolysis, which could be a key piece of microglia activation linked to neuroprotection. Finally, in this study we evaluated the impact of microglial reprogramming during excitotoxic damage. Most critically, our data shows that when activation occurs during Hv1 inhibition, not only is inflammatory neurotoxicity prevented, but microglia now become capable of protecting neurons against a separate excitotoxic insult.
Conclusions
Our findings indicate that pharmacological inhibition of Hv1 effectively reduces inflammatory neurotoxicity and promotes the production of anti-inflammatory factors which correlates with changes in the metabolic adaptation capacity of microglia. These changes in the metabolism of activated microglia could be critical for the metabolic reprogramming associated with a strong neuroprotective microglial response, and the maintenance of an anti-inflammatory phenotype. In our model, metabolic reprogramming not only prevents microglial neurotoxicity, but also produces neuroprotection against secondary injury. As such, our work establishes a solid foundation to explore the pharmacological manipulation of Hv1 as an effective strategy for promoting neuroprotection in a wide range of neurodegenerative disorders.
Limitations of this study
In addition to the pharmacological inhibition of Hv1, we examined whether Hv1 silencing would result in a similar scenario. However, we found that although siRNA was effective in decreasing Hv1 expression in non-activated HAPI cells, this effect was lost in activated cells (Fig. S9B and 9D), possibly as a result of Hv1 membrane stabilization upon activation. Moreover, it must be noted that this study does not take into account the potential role of astroglia, which are crucial amplifiers of cytokines action (Colombo & Farina, 2016) and are present in the primary rat cortical cultures utilized in this study.
Supplementary Material
Acknowledgements:
The work was supported by the National Institutes of Health Grant number NS0432577. The authors also thank Karen Hartnett-Scott for expert technical assistance.
List of abbreviations
- ABI
2-aminobenzimidazole
- 2GBI
2-guanidinobenzimidazole
- HIF
3-(2-amino-5-methyl-1H-imidazole-4-yl)-1-difluorophenyl
- ClGBI
5-chloro-2-guanidinobenzimidazole
- BSA
Bovine serum albumin
- DIV
Days in vitro
- MK801
Dizocilpine hydrogen maleate
- EUK134
Ethanediyl bis 6-methoxy-phenol manganese complex
- pHe
Extracellular pH
- Lactate
Extracellular lactate
- FBS
Fetal bovine serum
- IFNγ
Gamma interferon
- HHBS
Hank’s Buffer with HEPES solution
- HAPI
Highly aggressively proliferating immortalized
- Hv1
Hydrogen voltage-gated channel 1
- 1β
Interleukin 1β-IL
- IL-4
Interleukin 4
- IL-6
Interleukin 6
- IL-10
Interleukin 10
- Lactatei
Intracellular Lactate
- pHi
Intracellular pH
- LDH
Lactate Dehydrogenase
- LPS
Lipopolysaccharide
- nIL-10
Neutralizing antibody of IL-10
- TNF-α nAb
Neutralizing antibody of TNF-α
- IL-6 nAb
Neutralizing antibody of IL-6
- NADPH
Nicotinamide adenine dinucleotide phosphate reduced
- NOS
Nitric oxide synthase
- NOX
NADPH oxidases
- NOX2
NADPH oxidase 2
- NADH
Nicotinamide adenine dinucleotide reduced
- OD
Optical density
- DAMPs
Patterns associated with damage
- PAMPs
Patterns associated with pathogens
- PBS
Phosphate buffered saline
- PBST
Phosphate buffered saline and Tween 20
- PKC
Protein kinase C
- PK
Pyruvate Kinase
- ROS
Reactive oxygen species
- RFU
Relative Fluorescence units
- RLU
Relative light units
- TBOA
Threo-β-Benzyloxyaspartic acid
- MTS
Tetrazolium compound inner salt
- TGF-β
Transforming growth factor beta
- TNFα
Tumor necrosis factor alpha
Footnotes
Competing interests: The authors declare that they have no competing interests
Ethics approval and consent to participate: Animals procedures were approved by the IACUC of the University of Pittsburgh (Protocol # 21039053)
Consent for publication and clinical trial registration: Not applicable
A preprint of a previous version of the manuscript was uploaded to Research Square on April 12, 2022. See doi:10.21203/rs.3.rs-1527316/v1
Availability of data and materials:
The datasets used and analyzed during the current study are available from the corresponding authors upon reasonable request.
References
- Aderem A, & Underhill DM (1999). Mechanisms of phagocytosis in macrophages. Annu Rev Immunol, 17, 593–623. 10.1146/annurev.immunol.17.1.593 [DOI] [PubMed] [Google Scholar]
- Andreou KE, Soto MS, Allen D, Economopoulos V, de Bernardi A, Larkin JR, & Sibson NR (2017). Anti-inflammatory Microglia/Macrophages As a Potential Therapeutic Target in Brain Metastasis. Front Oncol, 7, 251. 10.3389/fonc.2017.00251 [DOI] [PMC free article] [PubMed] [Google Scholar]
- Aras MA, Hartnett KA, & Aizenman E (2008). Assessment of cell viability in primary neuronal cultures. Curr Protoc Neurosci, Chapter 7, Unit 7 18. 10.1002/0471142301.ns0718s44 [DOI] [PubMed] [Google Scholar]
- Asuaje A, Smaldini P, Martin P, Enrique N, Orlowski A, Aiello EA, Gonzalez Leon C, Docena G, & Milesi V (2017). The inhibition of voltage-gated H(+) channel (HVCN1) induces acidification of leukemic Jurkat T cells promoting cell death by apoptosis. Pflugers Arch, 469(2), 251–261. 10.1007/s00424-016-1928-0 [DOI] [PubMed] [Google Scholar]
- Baik SH, Kang S, Lee W, Choi H, Chung S, Kim JI, & Mook-Jung I (2019). A Breakdown in Metabolic Reprogramming Causes Microglia Dysfunction in Alzheimer’s Disease. Cell Metab, 30(3), 493–507 e496. 10.1016/j.cmet.2019.06.005 [DOI] [PubMed] [Google Scholar]
- Barcia C, Ros CM, Annese V, Gomez A, Ros-Bernal F, Aguado-Yera D, Martinez-Pagan ME, de Pablos V, Fernandez-Villalba E, & Herrero MT (2011). IFN-gamma signaling, with the synergistic contribution of TNF-alpha, mediates cell specific microglial and astroglial activation in experimental models of Parkinson’s disease. Cell Death Dis, 2(4), e142. 10.1038/cddis.2011.17 [DOI] [PMC free article] [PubMed] [Google Scholar]
- Bernier LP, Bohlen CJ, York EM, Choi HB, Kamyabi A, Dissing-Olesen L, Hefendehl JK, Collins HY, Stevens B, Barres BA, & MacVicar BA (2019). Nanoscale Surveillance of the Brain by Microglia via cAMP-Regulated Filopodia. Cell Rep, 27(10), 2895–2908 e2894. 10.1016/j.celrep.2019.05.010 [DOI] [PubMed] [Google Scholar]
- Bernier LP, York EM, & MacVicar BA (2020). Immunometabolism in the Brain: How Metabolism Shapes Microglial Function. Trends Neurosci, 43(11), 854–869. 10.1016/j.tins.2020.08.008 [DOI] [PubMed] [Google Scholar]
- Borst K, Schwabenland M, & Prinz M (2019). Microglia metabolism in health and disease. Neurochem Int, 130, 104331. 10.1016/j.neuint.2018.11.006 [DOI] [PubMed] [Google Scholar]
- Brown GC, & Neher JJ (2012). Eaten alive! Cell death by primary phagocytosis: ‘phagoptosis’. Trends Biochem Sci, 37(8), 325–332. 10.1016/j.tibs.2012.05.002 [DOI] [PubMed] [Google Scholar]
- Brown GC, & Vilalta A (2015). How microglia kill neurons. Brain Res, 1628(Pt B), 288–297. 10.1016/j.brainres.2015.08.031 [DOI] [PubMed] [Google Scholar]
- Busa WB, & Nuccitelli R (1984). Metabolic regulation via intracellular pH. Am J Physiol, 246(4 Pt 2), R409–438. 10.1152/ajpregu.1984.246.4.R409 [DOI] [PubMed] [Google Scholar]
- Buttke TM, McCubrey JA, & Owen TC (1993). Use of an aqueous soluble tetrazolium/formazan assay to measure viability and proliferation of lymphokine-dependent cell lines. J Immunol Methods, 157(1–2), 233–240. 10.1016/0022-1759(93)90092-l [DOI] [PubMed] [Google Scholar]
- Chausse B, Kakimoto PA, & Kann O (2021). Microglia and lipids: how metabolism controls brain innate immunity. Semin Cell Dev Biol, 112, 137–144. 10.1016/j.semcdb.2020.08.001 [DOI] [PubMed] [Google Scholar]
- Cheepsunthorn P, Radov L, Menzies S, Reid J, & Connor JR (2001). Characterization of a novel brain-derived microglial cell line isolated from neonatal rat brain. Glia, 35(1), 53–62. 10.1002/glia.1070 [DOI] [PubMed] [Google Scholar]
- Cherry JD, Olschowka JA, & O’Banion MK (2014). Neuroinflammation and M2 microglia: the good, the bad, and the inflamed. J Neuroinflammation, 11, 98. 10.1186/1742-2094-11-98 [DOI] [PMC free article] [PubMed] [Google Scholar]
- Colombo E, & Farina C (2016). Astrocytes: Key Regulators of Neuroinflammation. Trends Immunol, 37(9), 608–620. 10.1016/j.it.2016.06.006 [DOI] [PubMed] [Google Scholar]
- Datki ZL, Hunya A, & Penke B (2007). A novel and simple fluorescence method for the measurement of presynaptic vesicular zinc release in acute hippocampal slices with a fluorescence plate reader. Brain Res Bull, 74(1–3), 183–187. 10.1016/j.brainresbull.2007.06.001 [DOI] [PubMed] [Google Scholar]
- Decoursey TE (2012). Voltage-gated proton channels. Compr Physiol, 2(2), 1355–1385. 10.1002/cphy.c100071 [DOI] [PMC free article] [PubMed] [Google Scholar]
- Dheen ST, Kaur C, & Ling EA (2007). Microglial activation and its implications in the brain diseases. Curr Med Chem, 14(11), 1189–1197. 10.2174/092986707780597961 [DOI] [PubMed] [Google Scholar]
- Dimayuga FO, Wang C, Clark JM, Dimayuga ER, Dimayuga VM, & Bruce-Keller AJ (2007). SOD1 overexpression alters ROS production and reduces neurotoxic inflammatory signaling in microglial cells. J Neuroimmunol, 182(1–2), 89–99. 10.1016/j.jneuroim.2006.10.003 [DOI] [PMC free article] [PubMed] [Google Scholar]
- El Chemaly A, Okochi Y, Sasaki M, Arnaudeau S, Okamura Y, & Demaurex N (2010). VSOP/Hv1 proton channels sustain calcium entry, neutrophil migration, and superoxide production by limiting cell depolarization and acidification. J Exp Med, 207(1), 129–139. 10.1084/jem.20091837 [DOI] [PMC free article] [PubMed] [Google Scholar]
- Faff L, Ohlemeyer C, & Kettenmann H (1996). Intracellular pH regulation in cultured microglial cells from mouse brain. J Neurosci Res, 46(3), 294–304. [DOI] [PubMed] [Google Scholar]
- Fenton AW, & Hutchinson M (2009). The pH dependence of the allosteric response of human liver pyruvate kinase to fructose-1,6-bisphosphate, ATP, and alanine. Arch Biochem Biophys, 484(1), 16–23. 10.1016/j.abb.2009.01.011 [DOI] [PMC free article] [PubMed] [Google Scholar]
- Fernandez-Arjona MDM, Grondona JM, Granados-Duran P, Fernandez-Llebrez P, & Lopez-Avalos MD (2017). Microglia Morphological Categorization in a Rat Model of Neuroinflammation by Hierarchical Cluster and Principal Components Analysis [Original Research]. Front Cell Neurosci, 11, 235. 10.3389/fncel.2017.00235 [DOI] [PMC free article] [PubMed] [Google Scholar]
- Gao H, Dai W, Zhao L, Min J, & Wang F (2018). The Role of Zinc and Zinc Homeostasis in Macrophage Function. J Immunol Res, 2018, 6872621. 10.1155/2018/6872621 [DOI] [PMC free article] [PubMed] [Google Scholar]
- Ghosh S, Castillo E, Frias ES, & Swanson RA (2018). Bioenergetic regulation of microglia. Glia, 66(6), 1200–1212. 10.1002/glia.23271 [DOI] [PMC free article] [PubMed] [Google Scholar]
- Gras G, Porcheray F, Samah B, & Leone C (2006). The glutamate-glutamine cycle as an inducible, protective face of macrophage activation. J Leukoc Biol, 80(5), 1067–1075. 10.1189/jlb.0306153 [DOI] [PubMed] [Google Scholar]
- Hara H, Nakamura Y, Ninomiya M, Mochizuki R, Kamiya T, Aizenman E, Koketsu M, & Adachi T (2011). Inhibitory effects of chalcone glycosides isolated from Brassica rapa L. ‘hidabeni’ and their synthetic derivatives on LPS-induced NO production in microglia. Bioorg Med Chem, 19(18), 5559–5568. 10.1016/j.bmc.2011.07.036 [DOI] [PubMed] [Google Scholar]
- Harry GJ, & Kraft AD (2008). Neuroinflammation and microglia: considerations and approaches for neurotoxicity assessment. Expert Opin Drug Metab Toxicol, 4(10), 1265–1277. 10.1517/17425255.4.10.1265 [DOI] [PMC free article] [PubMed] [Google Scholar]
- Hartlage-Rubsamen M, Lemke R, & Schliebs R (1999). Interleukin-1beta, inducible nitric oxide synthase, and nuclear factor-kappaB are induced in morphologically distinct microglia after rat hippocampal lipopolysaccharide/interferon-gamma injection. J Neurosci Res, 57(3), 388–398. https://www.ncbi.nlm.nih.gov/pubmed/10412030 [PubMed] [Google Scholar]
- Hartnett KA, Stout AK, Rajdev S, Rosenberg PA, Reynolds IJ, & Aizenman E (1997). NMDA receptor-mediated neurotoxicity: a paradoxical requirement for extracellular Mg2+ in Na+/Ca2+-free solutions in rat cortical neurons in vitro. J Neurochem, 68(5), 1836–1845. 10.1046/j.1471-4159.1997.68051836.x [DOI] [PubMed] [Google Scholar]
- Hayes MP, Freeman SL, & Donnelly RP (1995). IFN-gamma priming of monocytes enhances LPS-induced TNF production by augmenting both transcription and MRNA stability. Cytokine, 7(5), 427–435. 10.1006/cyto.1995.0058 [DOI] [PubMed] [Google Scholar]
- He K, & Aizenman E (2010). ERK signaling leads to mitochondrial dysfunction in extracellular zinc-induced neurotoxicity. J Neurochem, 114(2), 452–461. 10.1111/j.1471-4159.2010.06762.x [DOI] [PMC free article] [PubMed] [Google Scholar]
- Hellwig S, Heinrich A, & Biber K (2013). The brain’s best friend: microglial neurotoxicity revisited. Front Cell Neurosci, 7, 71. 10.3389/fncel.2013.00071 [DOI] [PMC free article] [PubMed] [Google Scholar]
- Hernandez-Espinosa DR, Massieu L, Montiel T, & Moran J (2019). Role of NADPH oxidase-2 in the progression of the inflammatory response secondary to striatum excitotoxic damage. J Neuroinflammation, 16(1), 91. 10.1186/s12974-019-1478-4 [DOI] [PMC free article] [PubMed] [Google Scholar]
- Himori K, Abe M, Tatebayashi D, Lee J, Westerblad H, Lanner JT, & Yamada T (2017). Superoxide dismutase/catalase mimetic EUK-134 prevents diaphragm muscle weakness in monocrotalin-induced pulmonary hypertension. PLoS One, 12(2), e0169146. 10.1371/journal.pone.0169146 [DOI] [PMC free article] [PubMed] [Google Scholar]
- Hirano K, Chen WS, Chueng AL, Dunne AA, Seredenina T, Filippova A, Ramachandran S, Bridges A, Chaudry L, Pettman G, Allan C, Duncan S, Lee KC, Lim J, Ma MT, Ong AB, Ye NY, Nasir S, Mulyanidewi S, . . . Rutter AR (2015). Discovery of GSK2795039, a Novel Small Molecule NADPH Oxidase 2 Inhibitor. Antioxid Redox Signal, 23(5), 358–374. 10.1089/ars.2014.6202 [DOI] [PMC free article] [PubMed] [Google Scholar]
- Hong L, Kim IH, & Tombola F (2014). Molecular determinants of Hv1 proton channel inhibition by guanidine derivatives. Proc Natl Acad Sci U S A, 111(27), 9971–9976. 10.1073/pnas.1324012111 [DOI] [PMC free article] [PubMed] [Google Scholar]
- Hong L, Singh V, Wulff H, & Tombola F (2015). Interrogation of the intersubunit interface of the open Hv1 proton channel with a probe of allosteric coupling. Sci Rep, 5, 14077. 10.1038/srep14077 [DOI] [PMC free article] [PubMed] [Google Scholar]
- Hu X, Leak RK, Shi Y, Suenaga J, Gao Y, Zheng P, & Chen J (2015). Microglial and macrophage polarization-new prospects for brain repair. Nat Rev Neurol, 11(1), 56–64. 10.1038/nrneurol.2014.207 [DOI] [PMC free article] [PubMed] [Google Scholar]
- Ilina EI, Armento A, Sanchez LG, Reichlmeir M, Braun Y, Penski C, Capper D, Sahm F, Jennewein L, Harter PN, Zukunft S, Fleming I, Schulte D, Le Guerroue F, Behrends C, Ronellenfitsch MW, Naumann U, & Mittelbronn M (2017). Effects of soluble CPE on glioma cell migration are associated with mTOR activation and enhanced glucose flux. Oncotarget, 8(40), 67567–67591. 10.18632/oncotarget.18747 [DOI] [PMC free article] [PubMed] [Google Scholar]
- Islam A, Choudhury ME, Kigami Y, Utsunomiya R, Matsumoto S, Watanabe H, Kumon Y, Kunieda T, Yano H, & Tanaka J (2018). Sustained anti-inflammatory effects of TGF-β1 on microglia/macrophages. Biochim Biophys Acta Mol Basis Dis, 1864(3), 721–734. 10.1016/j.bbadis.2017.12.022 [DOI] [PubMed] [Google Scholar]
- Jantaratnotai N, Utaisincharoen P, Piyachaturawat P, Chongthammakun S, & Sanvarinda Y (2006). Inhibitory effect of Curcuma comosa on NO production and cytokine expression in LPS-activated microglia. Life Sci, 78(6), 571–577. 10.1016/j.lfs.2005.04.065 [DOI] [PubMed] [Google Scholar]
- Jha MK, & Morrison BM (2020). Lactate Transporters Mediate Glia-Neuron Metabolic Crosstalk in Homeostasis and Disease. Front Cell Neurosci, 14, 589582. 10.3389/fncel.2020.589582 [DOI] [PMC free article] [PubMed] [Google Scholar]
- Ji L, Shen W, Zhang F, Qian J, Jiang J, Weng L, Tan J, Li L, Chen Y, Cheng H, & Sun D (2021). Worenine reverses the Warburg effect and inhibits colon cancer cell growth by negatively regulating HIF-1α. Cell Mol Biol Lett, 26(1), 19. 10.1186/s11658-021-00263-y [DOI] [PMC free article] [PubMed] [Google Scholar]
- Jiang X, Yi S, Liu Q, & Zhang J (2021). The secretome of M1 and M2 microglia differently regulate proliferation, differentiation and survival of adult neural stem/progenitor cell. bioRxiv, 2021.2009.2015.460424. 10.1101/2021.09.15.460424 [DOI] [PMC free article] [PubMed] [Google Scholar]
- Justice JA, Manjooran DT, Yeh CY, Hartnett-Scott KA, Schulien AJ, Kosobucki GJ, Mammen S, Palladino MJ, & Aizenman E (2018). Molecular Neuroprotection Induced by Zinc-Dependent Expression of Hepatitis C-Derived Protein NS5A Targeting Kv2.1 Potassium Channels. J Pharmacol Exp Ther, 367(2), 348–355. 10.1124/jpet.118.252338 [DOI] [PMC free article] [PubMed] [Google Scholar]
- Kawai T, Okochi Y, Ozaki T, Imura Y, Koizumi S, Yamazaki M, Abe M, Sakimura K, Yamashita T, & Okamura Y (2017). Unconventional role of voltage-gated proton channels (VSOP/Hv1) in regulation of microglial ROS production. J Neurochem, 142(5), 686–699. 10.1111/jnc.14106 [DOI] [PubMed] [Google Scholar]
- Kawai T, Tatsumi S, Kihara S, Sakimura K, & Okamura Y (2018). Mechanistic insight into the suppression of microglial ROS production by voltage-gated proton channels (VSOP/Hv1). Channels (Austin), 12(1), 1–8. 10.1080/19336950.2017.1385684 [DOI] [PMC free article] [PubMed] [Google Scholar]
- Kawasaki T, & Kawai T (2014). Toll-like receptor signaling pathways. Front Immunol, 5, 461. 10.3389/fimmu.2014.00461 [DOI] [PMC free article] [PubMed] [Google Scholar]
- Kettenmann H, Hanisch UK, Noda M, & Verkhratsky A (2011). Physiology of microglia. Physiol Rev, 91(2), 461–553. 10.1152/physrev.00011.2010 [DOI] [PubMed] [Google Scholar]
- Kigerl KA, de Rivero Vaccari JP, Dietrich WD, Popovich PG, & Keane RW (2014). Pattern recognition receptors and central nervous system repair. Exp Neurol, 258, 5–16. 10.1016/j.expneurol.2014.01.001 [DOI] [PMC free article] [PubMed] [Google Scholar]
- Kim CC, Nakamura MC, & Hsieh CL (2016). Brain trauma elicits non-canonical macrophage activation states. J Neuroinflammation, 13(1), 117. 10.1186/s12974-016-0581-z [DOI] [PMC free article] [PubMed] [Google Scholar]
- Knoch ME, Hartnett KA, Hara H, Kandler K, & Aizenman E (2008). Microglia induce neurotoxicity via intraneuronal Zn(2+) release and a K(+) current surge. Glia, 56(1), 89–96. 10.1002/glia.20592 [DOI] [PMC free article] [PubMed] [Google Scholar]
- Kongsui R, Beynon SB, Johnson SJ, & Walker FR (2014). Quantitative assessment of microglial morphology and density reveals remarkable consistency in the distribution and morphology of cells within the healthy prefrontal cortex of the rat. J Neuroinflammation, 11, 182. 10.1186/s12974-014-0182-7 [DOI] [PMC free article] [PubMed] [Google Scholar]
- Kremlev SG, & Palmer C (2005). Interleukin-10 inhibits endotoxin-induced pro-inflammatory cytokines in microglial cell cultures. J Neuroimmunol, 162(1–2), 71–80. 10.1016/j.jneuroim.2005.01.010 [DOI] [PubMed] [Google Scholar]
- Kremlev SG, Roberts RL, & Palmer C (2004). Differential expression of chemokines and chemokine receptors during microglial activation and inhibition. J Neuroimmunol, 149(1–2), 1–9. 10.1016/j.jneuroim.2003.11.012 [DOI] [PubMed] [Google Scholar]
- Lam TI, Brennan-Minnella AM, Won SJ, Shen Y, Hefner C, Shi Y, Sun D, & Swanson RA (2013). Intracellular pH reduction prevents excitotoxic and ischemic neuronal death by inhibiting NADPH oxidase. Proc Natl Acad Sci U S A, 110(46), E4362–4368. 10.1073/pnas.1313029110 [DOI] [PMC free article] [PubMed] [Google Scholar]
- Lannes N, Eppler E, Etemad S, Yotovski P, & Filgueira L (2017). Microglia at center stage: a comprehensive review about the versatile and unique residential macrophages of the central nervous system. Oncotarget, 8(69), 114393–114413. 10.18632/oncotarget.23106 [DOI] [PMC free article] [PubMed] [Google Scholar]
- Lauro C, & Limatola C (2020). Metabolic Reprograming of Microglia in the Regulation of the Innate Inflammatory Response. Front Immunol, 11, 493. 10.3389/fimmu.2020.00493 [DOI] [PMC free article] [PubMed] [Google Scholar]
- Li Y, Ritzel RM, He J, Cao T, Sabirzhanov B, Li H, Liu S, Wu LJ, & Wu J (2021). The voltage-gated proton channel Hv1 plays a detrimental role in contusion spinal cord injury via extracellular acidosis-mediated neuroinflammation. Brain Behav Immun, 91, 267–283. 10.1016/j.bbi.2020.10.005 [DOI] [PMC free article] [PubMed] [Google Scholar]
- Lian H, Roy E, & Zheng H (2016). Microglial Phagocytosis Assay. Bio Protoc, 6(21). 10.21769/BioProtoc.1988 [DOI] [PMC free article] [PubMed] [Google Scholar]
- Lim VT, Freites JA, Tombola F, & Tobias DJ (2021). Thermodynamics and Mechanism of the Membrane Permeation of Hv1 Channel Blockers. J Membr Biol, 254(1), 5–16. 10.1007/s00232-020-00149-8 [DOI] [PMC free article] [PubMed] [Google Scholar]
- Lishko PV, Botchkina IL, Fedorenko A, & Kirichok Y (2010). Acid extrusion from human spermatozoa is mediated by flagellar voltage-gated proton channel. Cell, 140(3), 327–337. 10.1016/j.cell.2009.12.053 [DOI] [PubMed] [Google Scholar]
- Liu B, Huang J, Ashraf A, Rahaman O, Lou J, Wang L, Cai P, Wen J, Anwaar S, Liu X, Ni H, Ganguly D, Zhao J, & Yang CY (2021). The RNase MCPIP3 promotes skin inflammation by orchestrating myeloid cytokine response. Nat Commun, 12(1), 4105. 10.1038/s41467-021-24352-w [DOI] [PMC free article] [PubMed] [Google Scholar]
- Liu Y, Kintner DB, Chanana V, Algharabli J, Chen X, Gao Y, Chen J, Ferrazzano P, Olson JK, & Sun D (2010). Activation of microglia depends on Na+/H+ exchange-mediated H+ homeostasis. J Neurosci, 30(45), 15210–15220. 10.1523/JNEUROSCI.3950-10.2010 [DOI] [PMC free article] [PubMed] [Google Scholar]
- Lue LF, Kuo YM, Beach T, & Walker DG (2010). Microglia activation and anti-inflammatory regulation in Alzheimer’s disease. Mol Neurobiol, 41(2–3), 115–128. 10.1007/s12035-010-8106-8 [DOI] [PMC free article] [PubMed] [Google Scholar]
- Ma J, Gao X, Li Y, DeCoursey TE, Shull GE, & Wang HS (2022). The HVCN1 voltage-gated proton channel contributes to pH regulation in canine ventricular myocytes. J Physiol. 10.1113/JP282126 [DOI] [PMC free article] [PubMed] [Google Scholar]
- Meszaros B, Papp F, Mocsar G, Kokai E, Kovacs K, Tajti G, & Panyi G (2020). The voltage-gated proton channel hHv1 is functionally expressed in human chorion-derived mesenchymal stem cells. Sci Rep, 10(1), 7100. 10.1038/s41598-020-63517-3 [DOI] [PMC free article] [PubMed] [Google Scholar]
- Minkenberg I, & Ferber E (1984). Lucigenin-dependent chemiluminescence as a new assay for NAD(P)H-oxidase activity in particulate fractions of human polymorphonuclear leukocytes. J Immunol Methods, 71(1), 61–67. 10.1016/0022-1759(84)90206-0 [DOI] [PubMed] [Google Scholar]
- Morgan D, Capasso M, Musset B, Cherny VV, Rios E, Dyer MJ, & DeCoursey TE (2009). Voltage-gated proton channels maintain pH in human neutrophils during phagocytosis. Proc Natl Acad Sci U S A, 106(42), 18022–18027. 10.1073/pnas.0905565106 [DOI] [PMC free article] [PubMed] [Google Scholar]
- Muendlein HI, Connolly WM, Magri Z, Smirnova I, Ilyukha V, Gautam A, Degterev A, & Poltorak A (2021). ZBP1 promotes LPS-induced cell death and IL-1beta release via RHIM-mediated interactions with RIPK1. Nat Commun, 12(1), 86. 10.1038/s41467-020-20357-z [DOI] [PMC free article] [PubMed] [Google Scholar]
- Musset B, Smith SM, Rajan S, Cherny VV, Sujai S, Morgan D, & DeCoursey TE (2010). Zinc inhibition of monomeric and dimeric proton channels suggests cooperative gating. J Physiol, 588(Pt 9), 1435–1449. 10.1113/jphysiol.2010.188318 [DOI] [PMC free article] [PubMed] [Google Scholar]
- Nair S, Sobotka KS, Joshi P, Gressens P, Fleiss B, Thornton C, Mallard C, & Hagberg H (2019). Lipopolysaccharide-induced alteration of mitochondrial morphology induces a metabolic shift in microglia modulating the inflammatory response in vitro and in vivo. Glia, 67(6), 1047–1061. 10.1002/glia.23587 [DOI] [PubMed] [Google Scholar]
- Nauseef WM (2019). The phagocyte NOX2 NADPH oxidase in microbial killing and cell signaling. Current opinion in immunology, 60, 130–140. 10.1016/j.coi.2019.05.006 [DOI] [PMC free article] [PubMed] [Google Scholar]
- Orihuela R, McPherson CA, & Harry GJ (2016). Microglial M1/M2 polarization and metabolic states. Br J Pharmacol, 173(4), 649–665. 10.1111/bph.13139 [DOI] [PMC free article] [PubMed] [Google Scholar]
- Ozkan P, & Mutharasan R (2002). A rapid method for measuring intracellular pH using BCECF-AM. Biochim Biophys Acta, 1572(1), 143–148. 10.1016/s0304-4165(02)00303-3 [DOI] [PubMed] [Google Scholar]
- Pal S, Hartnett KA, Nerbonne JM, Levitan ES, & Aizenman E (2003). Mediation of neuronal apoptosis by Kv2.1-encoded potassium channels. J Neurosci, 23(12), 4798–4802. 10.1523/jneurosci.23-12-04798.2003 [DOI] [PMC free article] [PubMed] [Google Scholar]
- Pan E, Zhang XA, Huang Z, Krezel A, Zhao M, Tinberg CE, Lippard SJ, & McNamara JO (2011). Vesicular zinc promotes presynaptic and inhibits postsynaptic long-term potentiation of mossy fiber-CA3 synapse. Neuron, 71(6), 1116–1126. 10.1016/j.neuron.2011.07.019 [DOI] [PMC free article] [PubMed] [Google Scholar]
- Parkhurst CN, & Gan WB (2010). Microglia dynamics and function in the CNS. Curr Opin Neurobiol, 20(5), 595–600. 10.1016/j.conb.2010.07.002 [DOI] [PMC free article] [PubMed] [Google Scholar]
- Persson M, Sandberg M, Hansson E, & Ronnback L (2006). Microglial glutamate uptake is coupled to glutathione synthesis and glutamate release. Eur J Neurosci, 24(4), 1063–1070. 10.1111/j.1460-9568.2006.04974.x [DOI] [PubMed] [Google Scholar]
- Provenzano F, Perez MJ, & Deleidi M (2021). Redefining Microglial Identity in Health and Disease at Single-Cell Resolution. Trends Mol Med, 27(1), 47–59. 10.1016/j.molmed.2020.09.001 [DOI] [PubMed] [Google Scholar]
- Ramsey IS, Moran MM, Chong JA, & Clapham DE (2006). A voltage-gated proton-selective channel lacking the pore domain. Nature, 440(7088), 1213–1216. 10.1038/nature04700 [DOI] [PMC free article] [PubMed] [Google Scholar]
- Ramsey IS, Ruchti E, Kaczmarek JS, & Clapham DE (2009). Hv1 proton channels are required for high-level NADPH oxidase-dependent superoxide production during the phagocyte respiratory burst. Proc Natl Acad Sci U S A, 106(18), 7642–7647. 10.1073/pnas.0902761106 [DOI] [PMC free article] [PubMed] [Google Scholar]
- Rice AC, Zsoldos R, Chen T, Wilson MS, Alessandri B, Hamm RJ, & Bullock MR (2002). Lactate administration attenuates cognitive deficits following traumatic brain injury. Brain Res, 928(1–2), 156–159. 10.1016/s0006-8993(01)03299-1 [DOI] [PubMed] [Google Scholar]
- Ritzel RM, He J, Li Y, Cao T, Khan N, Shim B, Sabirzhanov B, Aubrecht T, Stoica BA, Faden AI, Wu LJ, & Wu J (2021). Proton extrusion during oxidative burst in microglia exacerbates pathological acidosis following traumatic brain injury. Glia, 69(3), 746–764. 10.1002/glia.23926 [DOI] [PMC free article] [PubMed] [Google Scholar]
- Rong Y, Doctrow SR, Tocco G, & Baudry M (1999). EUK-134, a synthetic superoxide dismutase and catalase mimetic, prevents oxidative stress and attenuates kainate-induced neuropathology. Proc Natl Acad Sci U S A, 96(17), 9897–9902. 10.1073/pnas.96.17.9897 [DOI] [PMC free article] [PubMed] [Google Scholar]
- Saura J, Tusell JM, & Serratosa J (2003). High-yield isolation of murine microglia by mild trypsinization. Glia, 44(3), 183–189. 10.1002/glia.10274 [DOI] [PubMed] [Google Scholar]
- Schulien AJ, Yeh CY, Orange BN, Pav OJ, Hopkins MP, Moutal A, Khanna R, Sun D, Justice JA, & Aizenman E (2020). Targeted disruption of Kv2.1-VAPA association provides neuroprotection against ischemic stroke in mice by declustering Kv2.1 channels. Sci Adv, 6(27). 10.1126/sciadv.aaz8110 [DOI] [PMC free article] [PubMed] [Google Scholar]
- Sekar P, Huang DY, Chang SF, & Lin WW (2018). Coordinate effects of P2X7 and extracellular acidification in microglial cells. Oncotarget, 9(16), 12718–12731. 10.18632/oncotarget.24331 [DOI] [PMC free article] [PubMed] [Google Scholar]
- Simpson DSA, & Oliver PL (2020). ROS Generation in Microglia: Understanding Oxidative Stress and Inflammation in Neurodegenerative Disease. Antioxidants (Basel), 9(8), 743. 10.3390/antiox9080743 [DOI] [PMC free article] [PubMed] [Google Scholar]
- Smith JA, Das A, Ray SK, & Banik NL (2012). Role of pro-inflammatory cytokines released from microglia in neurodegenerative diseases. Brain Res Bull, 87(1), 10–20. 10.1016/j.brainresbull.2011.10.004 [DOI] [PMC free article] [PubMed] [Google Scholar]
- Song S, Yu L, Hasan MN, Paruchuri SS, Mullett SJ, Sullivan MLG, Fiesler VM, Young CB, Stolz DB, Wendell SG, & Sun D (2022). Elevated microglial oxidative phosphorylation and phagocytosis stimulate post-stroke brain remodeling and cognitive function recovery in mice. Commun Biol, 5(1), 35. 10.1038/s42003-021-02984-4 [DOI] [PMC free article] [PubMed] [Google Scholar]
- Soto-Heredero G, Gomez de Las Heras MM, Gabande-Rodriguez E, Oller J, & Mittelbrunn M (2020). Glycolysis - a key player in the inflammatory response. FEBS J, 287(16), 3350–3369. 10.1111/febs.15327 [DOI] [PMC free article] [PubMed] [Google Scholar]
- Srivastava S (2016). Emerging therapeutic roles for NAD(+) metabolism in mitochondrial and age-related disorders. Clin Transl Med, 5(1), 25. 10.1186/s40169-016-0104-7 [DOI] [PMC free article] [PubMed] [Google Scholar]
- Stefano GB, Kim E, Liu Y, Zhu W, Casares F, Mantione K, Jones DA, & Cadet P (2004). Nitric oxide modulates microglial activation. Med Sci Monit, 10(2), BR17–22. https://www.ncbi.nlm.nih.gov/pubmed/14737036 [PubMed] [Google Scholar]
- Stoll G, Jander S, & Schroeter M (2000). Cytokines in CNS disorders: neurotoxicity versus neuroprotection. J Neural Transm Suppl, 59, 81–89. 10.1007/978-3-7091-6781-6_11 [DOI] [PubMed] [Google Scholar]
- Stratoulias V, Venero JL, Tremblay ME, & Joseph B (2019). Microglial subtypes: diversity within the microglial community. Embo j, 38(17), e101997. 10.15252/embj.2019101997 [DOI] [PMC free article] [PubMed] [Google Scholar]
- Suzuki C, Han S, Kesavamoorthy G, Kosugi M, Araki K, Harada N, Kanazawa M, Tsukada H, Magata Y, & Ouchi Y (2021). Differences in in vitro microglial accumulation of the energy metabolism tracers [(18)F]FDG and [(18)F]BCPP-EF during LPS- and IL4 stimulation. Sci Rep, 11(1), 13200. 10.1038/s41598-021-92436-0 [DOI] [PMC free article] [PubMed] [Google Scholar]
- Takeda H, Yamaguchi T, Yano H, & Tanaka J (2021). Microglial metabolic disturbances and neuroinflammation in cerebral infarction. J Pharmacol Sci, 145(1), 130–139. 10.1016/j.jphs.2020.11.007 [DOI] [PubMed] [Google Scholar]
- Tian DS, Li CY, Qin C, Murugan M, Wu LJ, & Liu JL (2016). Deficiency in the voltage-gated proton channel Hv1 increases M2 polarization of microglia and attenuates brain damage from photothrombotic ischemic stroke. J Neurochem, 139(1), 96–105. 10.1111/jnc.13751 [DOI] [PMC free article] [PubMed] [Google Scholar]
- Tucker DF, Sullivan JT, Mattia KA, Fisher CR, Barnes T, Mabila MN, Wilf R, Sulli C, Pitts M, Payne RJ, Hall M, Huston-Paterson D, Deng X, Davidson E, Willis SH, Doranz BJ, Chambers R, & Rucker JB (2018). Isolation of state-dependent monoclonal antibodies against the 12-transmembrane domain glucose transporter 4 using virus-like particles. Proc Natl Acad Sci U S A, 115(22), E4990–E4999. 10.1073/pnas.1716788115 [DOI] [PMC free article] [PubMed] [Google Scholar]
- Veremeyko T, Yung AWY, Anthony DC, Strekalova T, & Ponomarev ED (2018). Early Growth Response Gene-2 Is Essential for M1 and M2 Macrophage Activation and Plasticity by Modulation of the Transcription Factor CEBPbeta. Front Immunol, 9, 2515. 10.3389/fimmu.2018.02515 [DOI] [PMC free article] [PubMed] [Google Scholar]
- Vidugiriene J, Leippe D, Sobol M, Vidugiris G, Zhou W, Meisenheimer P, Gautam P, Wennerberg K, & Cali JJ (2014). Bioluminescent cell-based NAD(P)/NAD(P)H assays for rapid dinucleotide measurement and inhibitor screening. Assay Drug Dev Technol, 12(9–10), 514–526. 10.1089/adt.2014.605 [DOI] [PMC free article] [PubMed] [Google Scholar]
- Voloboueva LA, Emery JF, Sun X, & Giffard RG (2013). Inflammatory response of microglial BV-2 cells includes a glycolytic shift and is modulated by mitochondrial glucose-regulated protein 75/mortalin. FEBS Lett, 587(6), 756–762. 10.1016/j.febslet.2013.01.067 [DOI] [PMC free article] [PubMed] [Google Scholar]
- Wang L, Pavlou S, Du X, Bhuckory M, Xu H, & Chen M (2019). Glucose transporter 1 critically controls microglial activation through facilitating glycolysis. Mol Neurodegener, 14(1), 2. 10.1186/s13024-019-0305-9 [DOI] [PMC free article] [PubMed] [Google Scholar]
- Winkler U, & Hirrlinger J (2015). Crosstalk of Signaling and Metabolism Mediated by the NAD(+)/NADH Redox State in Brain Cells. Neurochem Res, 40(12), 2394–2401. 10.1007/s11064-015-1526-0 [DOI] [PubMed] [Google Scholar]
- Wu LJ (2014). Voltage-gated proton channel HV1 in microglia. Neuroscientist, 20(6), 599–609. 10.1177/1073858413519864 [DOI] [PubMed] [Google Scholar]
- Yeh CY, Bulas AM, Moutal A, Saloman JL, Hartnett KA, Anderson CT, Tzounopoulos T, Sun D, Khanna R, & Aizenman E (2017). Targeting a Potassium Channel/Syntaxin Interaction Ameliorates Cell Death in Ischemic Stroke. J Neurosci, 37(23), 5648–5658. 10.1523/JNEUROSCI.3811-16.2017 [DOI] [PMC free article] [PubMed] [Google Scholar]
- Yu Y, Luo X, Li C, Ding F, Wang M, Xie M, Yu Z, Ransom BR, & Wang W (2020). Microglial Hv1 proton channels promote white matter injuries after chronic hypoperfusion in mice. J Neurochem, 152(3), 350–367. 10.1111/jnc.14925 [DOI] [PubMed] [Google Scholar]
- Zeng X, Ren H, Zhu Y, Zhang R, Xue X, Tao T, & Xi H (2018). Gp91phox (NOX2) in Activated Microglia Exacerbates Neuronal Damage Induced by Oxygen Glucose Deprivation and Hyperglycemia in an in Vitro Model. Cell Physiol Biochem, 50(2), 783–797. 10.1159/000494243 [DOI] [PubMed] [Google Scholar]
- Zhang Q, Ren Y, Mo Y, Guo P, Liao P, Luo Y, Mu J, Chen Z, Zhang Y, Li Y, Yang L, Liao D, Fu J, Shen J, Huang W, Xu X, Guo Y, Mei L, Zuo Y, . . . Jiang R (2022). Inhibiting Hv1 channel in peripheral sensory neurons attenuates chronic inflammatory pain and opioid side effects. Cell Res, 32(5), 461–476. 10.1038/s41422-022-00616-y [DOI] [PMC free article] [PubMed] [Google Scholar]
- Zhang SC, & Fedoroff S (1996). Neuron-microglia interactions in vitro. Acta Neuropathol, 91(4), 385–395. 10.1007/s004010050440 [DOI] [PubMed] [Google Scholar]
- Zhang ZJ, Zheng XX, Zhang XY, Zhang Y, Huang BY, & Luo T (2020). Aging alters Hv1-mediated microglial polarization and enhances neuroinflammation after peripheral surgery. CNS Neurosci Ther, 26(3), 374–384. 10.1111/cns.13271 [DOI] [PMC free article] [PubMed] [Google Scholar]
- Zhao C, Hong L, Galpin JD, Riahi S, Lim VT, Webster PD, Tobias DJ, Ahern CA, & Tombola F (2021). HIFs: New arginine mimic inhibitors of the Hv1 channel with improved VSD-ligand interactions. J Gen Physiol, 153(9). 10.1085/jgp.202012832 [DOI] [PMC free article] [PubMed] [Google Scholar]
- Zhao YY, Yan DJ, & Chen ZW (2013). Role of AIF-1 in the regulation of inflammatory activation and diverse disease processes. Cell Immunol, 284(1–2), 75–83. 10.1016/j.cellimm.2013.07.008 [DOI] [PubMed] [Google Scholar]
Associated Data
This section collects any data citations, data availability statements, or supplementary materials included in this article.
Supplementary Materials
Data Availability Statement
Any information required to reanalyze the data reported in this paper is available from the corresponding authors upon reasonable request.
The datasets used and analyzed during the current study are available from the corresponding authors upon reasonable request.