

Abstract
Objective:
Histotripsy is an emerging non-invasive, non-ionizing, and non-thermal focal tumor therapy. While histotripsy targeting is currently based on ultrasound (US), other imaging modalities such as cone-beam computed tomography (CBCT) have recently been proposed to enable the treatment of tumors not visible on ultrasound. The objective of this study was to develop and evaluate a multi-modality phantom to facilitate the assessment of histotripsy treatment zones on both US and CBCT imaging.
Methods:
Fifteen red blood cell phantoms composed of alternating layers with and without barium were manufactured. Spherical 25mm histotripsy treatments were performed, and treatment zone size and location were measured on CBCT and ultrasound. Sound speed, impedance, and attenuation were measured for each layer type.
Discussion:
The average ± standard deviation signed difference between measured treatment diameters was 0.29±1.25mm. The Euclidean distance between measured treatment centers was 1.68±0.63mm. The sound speed in the different layers ranged from 1491 to 1514 m/s and was within typically reported soft tissue ranges (1480-1560m/s). In all phantoms, histotripsy resulted in sharply delineated treatment zones, allowing segmentation in both modalities.
Conclusion:
These phantoms will aid in the development and validation of x-ray-based histotripsy targeting techniques, which promise to expand the scope of treatable lesions beyond only those visible on ultrasound.
Keywords: Histotripsy, Tissue phantom, Targeting, Cone Beam CT, Ultrasound, Multi-modality Imaging, Acoustic properties
Introduction
Histotripsy is an emerging non-invasive, non-ionizing, and non-thermal focused ultrasound technology c urrently being evaluated as a novel focal tumor therapy(1,2). Histotripsy is performed by delivering short (< 20 μs), high-intensity (> 10 MPa) pulses at very low duty cycles (< 1%)(3). The result is mechanical tissue disruption on the cellular and subcellular levels through controlled acoustic cavitation. Cavitation, or the creation of a small “bubble cloud” via the rapid expansion and collapse of endogenous gas pockets, imparts intense strain on adjacent tissue, fracturing cellular structures and turning it into a homogenized zone of acellular debris (4,5). Cavitation is a threshold phenomenon that occurs at the focal spot of the therapeutic transducer. Aligning the focal spot on the intended target is currently performed using a diagnostic ultrasound transducer coaxially mounted within the therapy transducer. Once the target is selected, and a treatment plan (contouring of the target tumor and desired margins) created, a robotic arm automatically moves the focal spot of the transducer throughout the treatment volume (6,7). Treatment volumes of any size and shape can be created.
A first-in-human trial demonstrated liver histotripsy to be well-tolerated and effective (8). Furthermore, pre-clinical studies have shown potential for a wide variety of applications, including but not limited to the treatment of tumors in the liver (6,9), kidney (7,10,11), and prostate (12,13), neurological diseases (14,15), congenital and valvular heart disease(16), and deep venous thrombosis (17–19). However, widespread clinical translation of histotripsy will be limited by an exclusive reliance on diagnostic ultrasound for targeting. Factors that may limit visualization and accurate targeting using ultrasound include poor acoustic windows through bowel, aerated lung, bone, and in patients with large body habitus. Additional targeting techniques based on magnetic resonance or x-ray imaging are being developed to facilitate the targeting of tissue or tumors not well visualized on ultrasound (20,21). These techniques can be used in conjunction with current ultrasound-based approaches and may reduce operator dependence by enabling treatment planning on volumetric, multiplanar datasets. CT is a commonly used imaging technique for guiding focal cancer therapies as it offers rapid volumetric imaging for target identification and immediate assessment of treatment success(22,23). However, conventional CT is not ideal for histotripsy system integration as the closed bore CT system provides limited space for the treatment head, has field of view limitations, and is susceptible to artifacts from the therapeutic transducer and the robotic arm. C-arm x-ray fluoroscopy with CBCT offers many of the benefits of conventional CT, including volumetric multiplanar datasets, but also has the advantage of an open system configuration, which can better accommodate the histotripsy treatment head and robotic arm. As such, C-arm-based histotripsy targeting techniques have recently been described (21).
Appropriate models are needed to further develop new histotripsy targeting techniques, including C-arm x-ray-based methods. Histotripsy treatment volumes can be visualized in vivo through the injection of intravenous contrast and are visible as hypoattenuating regions due to the lack of perfusion in the treated areas. However, the use of phantoms instead of animal models is often preferred in early development stages due to the lower cost and ethical concerns, as well as a more controlled environment (e.g. no respiratory motion, variable acoustic windows). In contrast to animal models, tissue-mimicking phantoms can provide a reproducible and controlled environment for early development, characterization, validation and quality control of targeting techniques. To facilitate development of a C-arm targeting technique specifically, a phantom should mimic the acoustic properties of targeted tissue (eg, liver) and provide adequate contrast between the histotripsy treatment zone and surrounding “tissue” on CBCT to facilitate segmentation of the treatment zone for targeting accuracy assessment.
A tissue-mimicking phantom for testing and characterizing histotripsy systems has been previously described using red blood cells (RBC) suspended in agarose gel (24). Histotripsy treatments are visualized clearly on ultrasound as hypoechoic regions due to the rupture of individual red blood cells. However, treatment volumes in this phantom cannot be visualized on CBCT imaging due to a lack of x-ray attenuation contrast. Introducing thin, high x-ray attenuating layers to the above-mentioned RBC phantom can help achieve dual-modality imaging of the histotripsy treatment volume. The purpose of this study is to 1) describe the creation of a multimodal tissue-mimicking phantom to validate C-arm-based targeting techniques for histotripsy, 2) characterize acoustic properties of the phantom and determine how layers affect treatment and imaging, and 3) validate the phantom by comparing CBCT, US, and optical imaging of treatment zones.
Materials and Methods
To achieve a local change in x-ray attenuation during histotripsy treatment, a multi-layer phantom with alternating layers of high and low x-ray attenuation coefficient was developed by adding thin layers containing barium sulfate (Sigma-Aldrich Co., St. Louis, MO). Histotripsy treatment causes adjacent layers in the target volume to mix and create a homogeneous area visible on both ultrasound and CBCT.
Phantom Construction
The multi-layer phantom was manufactured using an agarose mixture based on the work proposed by (24). Low-gelling temperature agarose (Sigma-Aldrich Co., St. Louis, MO) and 0.9% isotonic saline were mixed at room temperature at a ratio of 1.5:100 g/ml. Barium sulfate was added to create mixtures used for the high attenuation layers. Concentrations of 1.5, 3, and 6 g barium sulfate in 100 ml saline were investigated in this study. Containers were heated and stirred until a homogenous solution was created (~80°C). The solutions were placed in a vacuum chamber and degassed under increasing negative pressure up to 30 inches Hg (14.735 PSI). After degassing, the agarose solutions were cooled to 43°C and red blood cells (Sheep Red Blood Cells Packed 100%, Innovative Research, Inc., Novi, MI) were carefully mixed into the solutions. Alternating layers with (~1 mm thick) and without (~4 mm thick) barium sulfate were poured into a 5 × 5 × 5 cm silicone mold. The layer thickness was chosen to be on the order of the typical histotripsy cavitation bubble cloud size (~3 × 3 × 6 mm) to allow for good mixing. Thinner high-attenuation layers additionally help reduce acoustic phase aberrations created by the differences in the speed of sound. A total of 5 phantoms for each concentration of barium sulfate were created. All phantoms were refrigerated in isotonic saline for up to 7 days at 4 °C under −100 kPa pressure until they were treated and analyzed.
Phantom Properties
To characterize the ultrasound propagation through the phantom, measurements of the acoustic properties, including density ρ, sound propagation speed cm, impedance Z, and attenuation αc were performed independently for phantom layers. Samples containing 0, 1.5, 3, and 6 g barium sulfate per 100 ml saline were labeled sample-N, sample-1.5, sample-3, and sample-6, respectively. Each sample was prepared in a cylindrical acrylic mold with a 7.5 cm inner diameter and 2.5 cm height, which was sealed on each side with plastic wrap. The samples thickness (d), including the plastic wrap layers, was measured by a digital caliper. The density ρm of each sample was calculated by measuring mass on a laboratory balance (Adventurer Pro AV114C, Ohaus Corporation, NJ, USA) and volume by the water displacement method. The narrow band substitution method (25) was used to measure sound speed and attenuation at 22 °C. To this end, unfocused transmitter and receiver transducers were placed on opposite sides of a water tank ~ 25 cm apart and connected to a function generator (AFG 3251, Tektronix, Beaverton, OR) and oscilloscope (LeCroy’s WaveSurfer 4000HD, Chestnut Ridge, NY), as shown in Figure 1.
Figure 1.
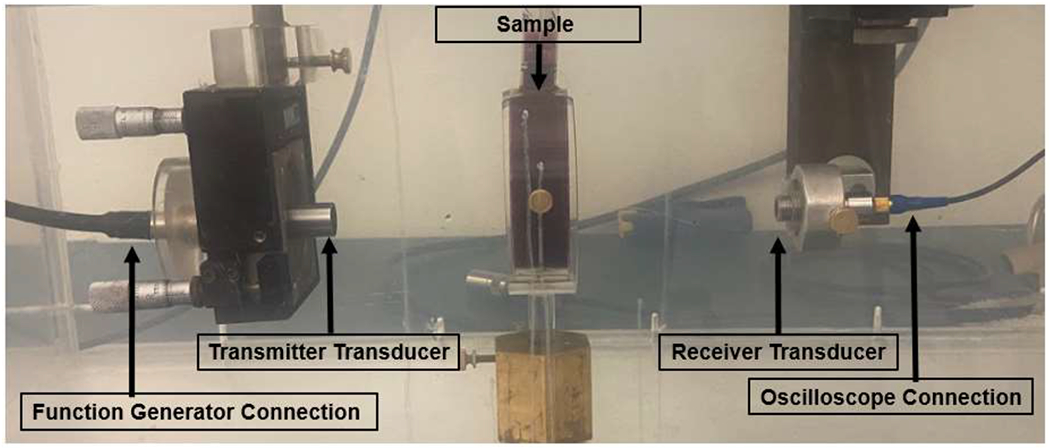
Acoustic property measurement setup in a water bath. Non-barium containing layer sample in a cylindrical mold, seen between transmitter and receiver transducers.
Amplitude and phase shifts were recorded at 1, 2.25, 3, 5, and 7.5 MHz using a sinusoidal tone burst signal with 30 cycles (narrow band excitation). Five measurements with the cylindrical molds at slightly different locations were performed for each sample type and each frequency, and mean values were reported. The same measurements were performed without a sample as reference. The speed of sound cm for each sample was calculated based on the time difference calculated from the measured phase shift, and the known speed of sound in water m/s using
| (1) |
The linear attenuation coefficient αc was determined based on the transmitter-generated amplitude A0, the amplitude at the receiver A, and transducer frequency f
| (2) |
where TI is the transmission coefficient calculated based on the specific acoustic impedance Z = ρc for the sample (Zm), water (Zw) and plastic wrap (Zs)
| (3) |
| (4) |
assuming a nominal thickness and sound speed for the plastic wrap.
Characterization of x-ray attenuation was performed separately for each layer type, similar to the acoustic property measurements. Samples containing 0, 1.5, 3, and 6 g barium sulfate per 100 ml saline were imaged using a multidetector computed tomography system (MDCT) (Discovery HD 750, General Electric, Boston, MA, USA) and analysis was performed using a clinical workstation (Leonardo, Siemens Healthineers, Forchheim, Germany). A region of interest (ROI) was selected in the axial, sagittal, and coronal segments in the center of each sample. CT number and noise measurement (mean CT number ± mean noise) of the three orthogonal plane ROIs were reported for each sample.
Histotripsy Treatment
A research prototype histotripsy system (HistoSonics, Plymouth, MN) was used to create all histotripsy treatments. The prototype consisted of a 700-kHz multi-element therapy transducer and a coaxially aligned 3-MHz curvilinear array ultrasonic imaging probe (Model C5-2; Analogic Corp, Peabody, MA) for real-time ultrasound targeting and monitoring of the treatment. Therapy was delivered in short pulses (< 20 μs), peak negative pressure >14 MPa, and at a low duty cycle (<1%). The total treatment time was approximately 14 minutes.
A calibration step was performed prior to each treatment to account for acoustic aberrations. To this end, a test bubble cloud was generated and visualized using the integrated ultrasound imaging probe. The offset between the geometrical focal point of the therapy transducer and the actual center of the bubble cloud was then manually measured. Differences in the calibration offsets across the three phantom groups were analyzed using ANOVA.
Using proprietary software (version 1.0.1.3, Histosonics, Inc), 2.5 cm spherical treatment zones were planned and created in each phantom. The depth targeted for each treatment zone center was ~2 cm from the upper border of the phantom. During treatment, the bubble cloud was mechanically moved through the planned target volume using micro-positioners attached to the therapy transducer. Treatments were performed at a voltage of 10% above the cavitation threshold. The treatment sequence was performed twice in each phantom to ensure adequate homogenization of the treatment volume. The experimental setup is shown in Figure 2.
Figure 2.

Experimental setup showing the histotripsy system, degassed water bath containing the phantom, and Artis-Zee C-arm system.
Success was determined by visually comparing the treatment zone to the planned treatment volume. Fifteen multi-layered phantoms (5 for each group of barium concentration) were treated and received post-treatment imaging analysis.
Imaging
Following histotripsy treatment, ultrasound imaging was performed with the above-mentioned integrated diagnostic probe and analyzed manually using manufacturer-provided software measurement tools. Measurements were taken between the borders of the phantom and the hyperattenuating gas bubbles around the treatment volume. Following ultrasound imaging, posttreatment CBCT images were acquired using an Artis Zee x-ray system (Siemens Healthineers, Forchheim, Germany). To this end, phantoms were removed from the water bath and placed directly on the patient table. CBCT image reconstruction and analysis was performed using a clinical workstation (Leonardo, Siemens Healthineers, Forchheim, Germany). Following CBCT imaging, treated phantoms were cut along the axial center and digitally scanned using an optical scanner (MG3200, Canon, Ota City, Tokyo, Japan). The optical images were compared to CBCT and US imaging using the Dice similarity coefficient. Treatment volume diameters were measured in X, Y, and Z direction in both US and CBCT, where Z represents the direction from the center of the transducer to the target and X is the perpendicular direction along the table long axis. Similarly, the location of the treatment zone was determined by measuring the distances and d+z between treatment volume margin and phantom borders in positive (+) and negative (−) direction along the X, Y, and Z axes. The offsets xCBCT and xUS between the center of the treatment volume relative to the center of the phantom for each modality were calculated using
| (5) |
The accuracy of the treatment localization was determined as the Euclidean distance between the treatment volume center points . Corresponding signed differences in X, Y and Z directions are reported.
Treatment zone overlap was analyzed in 2D central axial slices of the phantom in US, CBCT, and optical imaging. To this end, three images (ultrasound, optical image, and cross-sectional slice from 3D CBCT) were registered (rigid registration) using phantom edges as control/reference points. The treatment zones were individually segmented manually using MATLAB tools. All images were resampled to an isotropic pixel size of 0.47 mm and the Sørensen-Dice similarity coefficient calculated.
To determine the visibility of the treatment regions in CBCT images, the signal-difference-to-noise ratio (SDNR) between treatment volume and non-barium layer was calculated. To this end, mean and standard deviations of the grayscale values inside ROIs were performed. For the treatment volume, circular ROIs were placed in the axial, coronal, and sagittal plane as shown in Figure 3 and the results averaged yielding mean μT and standard deviation σT. Similarly μRBC and σRBC for the RBC layer was measured in three ROIs. Due to the layered pattern outside the treatment zone, ROIs were placed in three different layers parallel to the layer orientation (Figure 3b). The SDNR for each modality was calculated using
| (6) |
Figure 3.
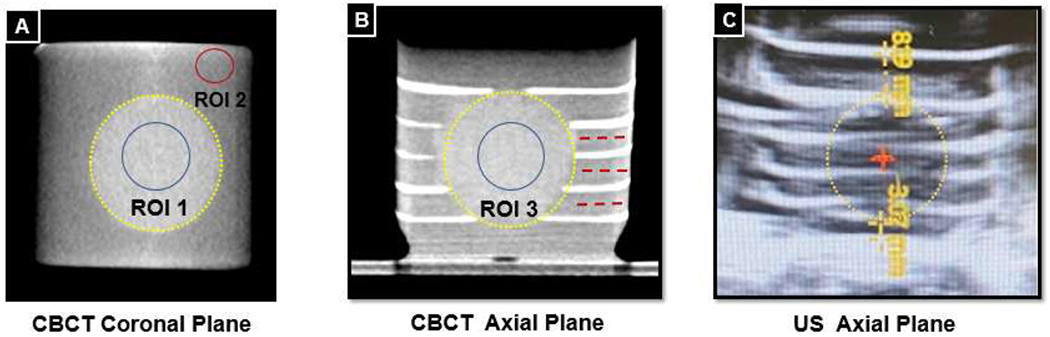
Treatment volumes are outlined by yellow dashed circles. A: SDNR measurement in the coronal plane, treatment volume ROI in the blue circle, RBC layer ROI in the red circle. B: Three layers where coronal RBC ROIs are measured are shown with dashed red lines. C: Distance from phantom border to treatment margin in Z plane (d+z,d−z) shown with yellow dashed lines.
Differences in SDNRs across the different barium sulfate concentration phantom groups were analyzed using ANOVA.
Results
Phantom Properties
An optical image of a treated phantom is shown in Figure 5. The phantom is predominantly red with thin intermittent pink layers. The treatment volume is well visualized as a homogeneous spherical region in the center. The measured sound speed means at 1 MHz in the four samples including the non-barium layer ranged from 1491 to 1514 m/s. For comparison, the typical sound speed measured in soft tissue ranges from 1480-1560 m/s (24,26). The largest difference between the acoustic impedance within the three layers was 0.05 MRayl, which is 2.6 times smaller than the difference between the acoustic impedances of water and soft tissue (~0.13 Mrayl). Table 1 gives an overview of all measurements (mean ± standard deviation) for a frequency of 1 MHz, which is closest to the therapeutic histotripsy transducer frequency of 0.7 MHz as well as corresponding reference values for soft tissue properties at 20°C previously described literature. Ultrasound attenuation, impedance and sound speed measurements for all measured frequencies are demonstrated in graphs (Figure 4).
Figure 5.

A) 2D ultrasound image of the multilayer phantom with planned spherical treatment (25 mm diameter), B) post-treatment ultrasound image of treatment volume, C) axial slice of post-treatment CBCT, and D) optical image of a cut plane through the phantom after treatment.
Table 1.
Acoustic properties of the tissue phantom layers measured in this study at 22°C, 1MHz and reference values for water and soft tissues are provided. Five measurements (technical replicates) in one representative sample per barium concentration were performed.
| Water | Sample-N | Sample-1.5 | Sample-3 | Sample-6 | Soft Tissue | |
|---|---|---|---|---|---|---|
| Density (kg/m3) | 998 | 1040 | 1010 | 1020 | 1040 | 1050 |
| Sound Speed (m/s) | 1488 | 1514±0.3 | 1508±1.7 | 1503±0.2 | 1491±1.2 | 1480–1560 |
| Impedance (MRayl) | 1.48 | 1.57±0.00 | 1.52±0.00 | 1.53±0.00 | 1.55±0.00 | 1.61 |
| Attenuation (dB/cm/MHz) | 0.002 | 0.04±0.00 | 0.27±0.02 | 0.48±0.00 | 0.94±0.03 | 0.4–0.7 |
Figure 4.

Attenuation, impedance and sound speed measurements at 1, 2.25, 3, 5, and 7.5 MHz, 22°C. Sample-N, Sample-1.5, Sample-3, and Sample-6 are reported in blue, orange, yellow and purple, respectively. Five measurements (technical replicates) in one representative sample per barium concentration were performed and the result of each technical replicate is demonstrated as an individual dot.
CT numbers were 26.8 ± 1, 380 ± 16, 616 ± 25, and 1309 ± 129 Hounsfield Units (HU) for sample-N, sample-1.5, sample-3, and sample-6, respectively. Sample-N was within range of soft tissue x-ray attenuation. CT numbers of sample-6 were similar to that of cortical bone. Higher values may involve the risk of beam hardening and photon starvation artifacts in CBCT and reduced diagnostic ultrasound signal. CT numbers of sample- 1.5 were similar to IV contrast. Using barium sulfate concentrations lower than 1.5 g per 100 ml saline may result in treatment regions which are difficult to segment in CT images.
Imaging
In all phantoms, histotripsy resulted in homogeneous treatment zones easily distinguishable from the untreated layers, making segmentation of the treatment zone on both CBCT and ultrasound possible (see Figure 5). All treatment zone diameters closely correlated with the planned 25 mm spherical treatment volume.
Mean and standard deviation of the manually segmented treatment volume sizes in the CBCT images were 26.8 ± 1.1, 25.8 ± 0.6, and 26.0 ± 1.7 mm in the X, Y, and Z directions, respectively. Similarly, on ultrasound images, treatment zone diameters were 25.6 ± 1.3, 25.7 ± 1.4, and 25.5 ± 1.1 mm.
Treatment zone center point locations differed between CBCT and ultrasound measurements by 0.8 ± 0.6, 0.8 ± 0.5, 0.9 ± 0.6 mm in the X, Y and Z directions, respectively. The average Euclidean distance between the treatment volume center points was 1.6 ± 0.6 mm. Mean and standard deviation of the Dice similarity coefficients between treatment zones were 0.96 ± 0.02 (CBCT to optical), 0.91 ± 0.05 (optical to US), and 0.91 ± 0.05 (CBCT to US).
The SDNR values in CBCT images were significantly different (p<0.001) between all three groups and correlated with barium sulfate concentration. In order of decreasing concentration, SDNR was 6.6 ± 0.8, 4.0 ± 0.5, and 3.0 ± 0.3 in the three groups.
A significant difference between the aberration correction offsets across the three groups was also observed between the 6 and 3 g barium concentration layers (p=0.001) and between 6 and 1.5 g barium concentration layers (p<0.001). However, no significant difference was observed between 3 and 1.5 g layers (p=0.344). The average calibration offsets in order of decreasing concentration were 2.4 ± 0.6, 0.7 ± 1.3, and 0.3 ± 0.5 mm. For comparison, aberration correction was 1.7 ± 1.7 mm in homogeneous RBC phantoms.
Discussion
Histotripsy treatment volumes can be visualized by CT imaging in vivo with intravenous contrast injection and are visible as hypoattenuating regions relative to surrounding tissue due to the lack of perfusion and contrast in the treated areas (see Figure 6A). Treatment volumes cannot be seen in ex-vivo tissue due to the similar attenuation of the treatment zone and surrounding tissue without a contrast agent (see Figure 6B). In our multi-modal phantom, layers of high and low x-ray attenuation coefficient in the target volume mix and create a homogeneous area of distinct attenuation, which is visible on CT images.
Figure 6.

Histotripsy treatment volumes in-vivo, ex-vivo, and in a phantom. A) In-vivo treatment volume in a contrast enhanced CBCT of the liver visible as hypoattenuating region due to lack of perfusion in the treatment volume. B) CBCT of an ex-vivo liver treatment, where the treatment volume is not visible due to the lack of a contrast agent. C) CBCT of a treatment volume in a multilayered phantom visible as homogeneous area which disrupts the layered structure of the phantom.
The results indicate the proposed phantom mimics soft tissue and enables assessment of histotripsy treatment zones on both imaging modalities. Measured treatment volumes on CBCT, ultrasound, and optical imaging closely resembled the planned target volume in size and location. Although SDNR decreased with lower barium sulfate concentrations, treatment volumes were visualized even at the lowest tested concentration.
To simulate realistic conditions for histotripsy treatments in the phantom, it is important that the acoustic properties, such as the speed of sound, are similar to the expected range for in-vivo soft tissue treatments. While the results show a decrease in speed of sound with increasing barium content, even for the highest barium concentration, the values are still within previously reported ranges for soft tissue and close to the sound speed in water, which is used as a coupling medium (24,27). Deviations in the speed of sound could also increase acoustic phase aberrations and therefore change the position of the bubble cloud. The statistical analysis of the calibration offsets showed a significantly higher offset for the sample with the highest barium concentration. However, no significant difference was observed between the two lower concentration samples. The acoustic aberration is further reduced by minimizing the thickness of the barium layers in the phantoms.
The overall amount of acoustic energy that can reach the target is also dependent on the attenuation and impedance difference across layer interfaces. Deviation in the impedance between samples was small, which helps reduce the amount of reflected energy between layers, and the attenuation sample-3 is similar to that of soft tissue.
Actual treatment volumes were slightly larger than planned, which might be caused, in part, by the size of the bubble cloud. Under normal conditions, the expected size is 3×3×6 mm when in a homogeneous environment. However, the exact size may vary with tissue type, amount of gas in tissue, and transducer voltage. In this study, phantoms were treated with a voltage approximately 10% above the cavitation threshold which might increase the size of the bubble cloud. However, the difference in diameter is also close to the spatial resolution of the ultrasound and CBCT images (0.47 mm), which also contributes to the submillimeter difference between treatment sizes measured on CBCT and ultrasound.
The treatment localization analysis was based on relative measurements to the phantom boundaries due to lack of internal fiducials. Center point differences between CBCT and ultrasound images in X, Y, and Z directions were less than 1 mm on average and can mainly be attributed to the limited spatial resolution of CBCT and ultrasound.
The treatment zones were well visualized on CBCT for all phantom groups with an SDNR > 2, which increased with higher barium concentration as expected. The lowest tested barium sulfate concentration of 1.5 g barium per 100 ml saline may be used in future studies, as phantoms in this group had the least heterogeneity in sound speed measurements (only 6 m/s difference between sample-N and sample-1.5).
The main limitation of this study is potential variations in the thickness of individual layers in the phantom due to manual pouring and cooling process. These changes could affect the acoustic aberration and increase the deviation for each group. However, the measured standard deviations were relatively small for each group compared to the mean aberration offset. Additionally, the limited resolution of the ultrasound imaging system used for evaluation could also affect the measurement accuracy of the treatment size and location. Further research is required to investigate other potential strategies to incorporate distinct barium sulfate patterns and distributions in the phantom to improve the sensitivity to very small treatments and individual bubble clouds.
Conclusion
The proposed multimodal phantom allowed visualization of histotripsy treatment zones on both US and CBCT. Treatment zone diameters and center locations were similar between the two modalities. Barium concentrations did affect ultrasound propagation speed and attenuation. However, the variations were within the range of human soft tissue. Increasing barium concentrations provided increased SDNR on x-ray imaging. However, treatment volume was discernible even at the lowest tested concentration. These phantoms may facilitate development, validation, and quality control of novel targeting techniques for histotripsy, expanding the scope of treatable lesions.
Acknowledgments
Partial funding for this study was received from HistoSonics Inc. and the National Institute of Biomedical Imaging and Bioengineering under award number R01EB031007. Additional funding was provided by the Clinical and Translational Science Award (CTSA) program, through the NIH National Center for Advancing Translational Sciences (NCATS) under award number UL1TR002373. Author S.P is funded through a fellowship award from the National Cancer Institute (NCI) under award number 5F30CA250408-03 and a training grant from the National Institute of General Medical Sciences under award 5T32GM140935-02. The content is solely the responsibility of the authors and does not necessarily represent the official views of the NIH.
Footnotes
Publisher's Disclaimer: This is a PDF file of an unedited manuscript that has been accepted for publication. As a service to our customers we are providing this early version of the manuscript. The manuscript will undergo copyediting, typesetting, and review of the resulting proof before it is published in its final form. Please note that during the production process errors may be discovered which could affect the content, and all legal disclaimers that apply to the journal pertain.
Conflict of Interest Statement
Dr. Wagner is a consultant for HistoSonics. Dr. Laeseke is a consultant for HistoSonics, NeuWave (Johnson & Johnson/Ethicon), and Elucent Medical and a sharedholder of HistoSonics, Elucent Medical, McGinley Orthopedics, and RevOps Health. Dr. Hall performs custom ultrasound phantom design and manufacture for Clarius, GE, Philips, and Siemens.
Research Data
The data that support the findings of this study are available from the corresponding author, MW, upon reasonable request.
References
- 1.Ziemlewicz TJ, Cho CS. The HistoSonics System for Treatment of Primary and Metastatic Liver Tumors Using Histotripsy (#HOPE4LIVER). ClinicalTrials.gov identifier: NCT04572633 Updated April 20, 2021 [Internet]. 2020. [cited 2022 Aug 21]; Available from: https://clinicaltrials.gov/ct2/show/NCT04572633
- 2.Solbiati LA. The HistoSonics System for Treatment of Primary and Metastatic Liver Tumors Using Histotripsy (#HOPE4LIVER) (#HOPE4LIVER). ClinicalTrials.gov identifier: NCT04573881 >Updated May 2, 2022 [Internet]. 2020. [cited 2022 Aug 21]; Available from: https://clinicaltrials.gov/ct2/show/NCT04573881
- 3.Xu Z, Hall TL, Vlaisavljevich E, Lee FT. Histotripsy: the first noninvasive, non-ionizing, non-thermal ablation technique based on ultrasound. International Journal of Hyperthermia. 2021. Jan 1;38(l):561–75. [DOI] [PMC free article] [PubMed] [Google Scholar]
- 4.Vlaisavljevich E, Maxwell A, Mancia L, Johnsen E, Cain C, Xu Z. Visualizing the Histotripsy Process: Bubble Cloud–Cancer Cell Interactions in a Tissue-Mimicking Environment. Ultrasound Med Biol. 2016. Oct 1;42(10):2466–77. [DOI] [PMC free article] [PubMed] [Google Scholar]
- 5.Parsons JE, Cain CA, Abrams GD, Fowlkes JB. Pulsed cavitational ultrasound therapy for controlled tissue homogenization. Ultrasound Med Biol. 2006. Jan;32(l):115–29. [DOI] [PubMed] [Google Scholar]
- 6.Smolock AR, Cristescu MM, Vlaisavljevich E, Gendron-Fitzpatrick A, Green C, Cannata J, et al. Robotically assisted sonic therapy as a noninvasive nonthermal ablation modality: Proof of concept in a porcine liver model. Radiology [Internet]. 2018. May 1 [cited 2022 Aug 18];287(2):485–93. Available from: 10.1148/radiol.2018171544 [DOI] [PubMed] [Google Scholar]
- 7.Knott EA, Swietlik JF, Longo KC, Watson RF, Green CM, Abel EJ, et al. Robotically-Assisted Sonic Therapy for Renal Ablation in a Live Porcine Model: Initial Preclinical Results. J Vase Interv Radiol. 2019. Aug;30(8):1293–302. [DOI] [PMC free article] [PubMed] [Google Scholar]
- 8.Vidal-Jove J, Serres X, Vlaisavljevich E, Cannata J, Duryea A, Miller R, et al. First-in-man histotripsy of hepatic tumors: the THERESA trial, a feasibility study. International Journal of Hyperthermia [Internet]. 2022. [cited 2022 Sep ll];39(l):1115–23. Available from: 10.1080/02656736.2022.2112309 [DOI] [PubMed] [Google Scholar]
- 9.Longo KC, Zlevor AM, Laeseke PF, Swietlik JF, Knott EA, Rodgers AC, et al. Histotripsy Ablations in a Porcine Liver Model: Feasibility of Respiratory Motion Compensation by Alteration of the Ablation Zone Prescription Shape. Cardiovasc Intervent Radiol. 2020. Nov;43(11): 1695–701. [DOI] [PMC free article] [PubMed] [Google Scholar]
- 10.Styn NR, Hall TL, Fowlkes JB, Cain CA, Roberts WW. Histotripsy of renal implanted VX-2 tumor in a rabbit model: investigation of metastases. Urology. 2012. Sep;80(3):724–9. [DOI] [PubMed] [Google Scholar]
- 11.Schade GR, Wang YN, D’Andrea S, Hwang JH, Liles WC, Khokhlova TD. Boiling Histotripsy Ablation of Renal Cell Carcinoma in the Eker Rat Promotes a Systemic Inflammatory Response. Ultrasound Med Biol. 2019;45(l):137–47. [DOI] [PMC free article] [PubMed] [Google Scholar]
- 12.Hempel CR, Hall TL, Cain CA, Fowlkes JB, Xu Z, Roberts WW. Histotripsy Fractionation of Prostate Tissue: Local Effects and Systemic Response in a Canine Model. J Urol. 2011. Apr 1;185(4):1484–9. [DOI] [PMC free article] [PubMed] [Google Scholar]
- 13.Schade GR, Keller J, Ives K, Cheng X, Rosol TJ, Keller E, et al. Histotripsy focal ablation of implanted prostate tumor in an ACE-1 canine cancer model. J Urol. 2012. Nov; 188(5): 1957–64. [DOI] [PMC free article] [PubMed] [Google Scholar]
- 14.Gerhardson T, Sukovich JR, Chaudhary N, Chenevert TL, Ives K, Hall TL, et al. Histotripsy Clot Liquefaction in a Porcine Intracerebral Hemorrhage Model. Neurosurgery. 2020;86(3):429–36. [DOI] [PMC free article] [PubMed] [Google Scholar]
- 15.Sukovich JR, Cain CA, Pandey AS, Chaudhary N, Camelo-Piragua S, Allen SP, et al. In vivo histotripsy brain treatment. J Neurosurg [Internet]. 2018. Oct 1 [cited 2022 Aug 18];131(4):1331–8. Available from: https://pubmed.ncbi.nlm.nih.gov/30485186/ [DOI] [PMC free article] [PubMed] [Google Scholar]
- 16.Xu Z, Owens G, Gordon D, Cain C, Ludomirsky A. Non-invasive Creation of an Atrial Septal Defect by Histotripsy in a Canine Model. Circulation [Internet]. 2010. Feb 2 [cited 2022 Aug 18];121(6):742. Available from: /pmc/articles/PMC2834201/ [DOI] [PMC free article] [PubMed] [Google Scholar]
- 17.Bader KB, Hendley SA, Bollen V. Assessment of Collaborative Robot (Cobot)-Assisted Histotripsy for Venous Clot Ablation. IEEE Trans Biomed Eng. 2021;68(4):1220–8. [DOI] [PMC free article] [PubMed] [Google Scholar]
- 18.Zhang X, Macoskey JJ, Ives K, Owens GE, Gurm HS, Shi J, et al. Non-lnvasive Thrombolysis Using Microtripsy in a Porcine Deep Vein Thrombosis Model. Ultrasound Med Biol. 2017;43(7):1378–90. [DOI] [PMC free article] [PubMed] [Google Scholar]
- 19.Maxwell AD, Owens G, Gurm HS, Ives K, Myers DD, Xu Z. Noninvasive treatment of deep venous thrombosis using pulsed ultrasound cavitation therapy (histotripsy) in a porcine model. J Vase Interv Radiol. 2011. Mar;22(3):369–77. [DOI] [PMC free article] [PubMed] [Google Scholar]
- 20.Lu N, Gupta D, Daou BJ, Fox A, Choi D, Sukovich JR, et al. Transcranial Magnetic Resonance-Guided Histotripsy for Brain Surgery: Pre-clinical Investigation. Ultrasound Med Biol [Internet]. 2022. Jan 1 [cited 2022 Aug 18];48(1):98–110. Available from: https://pubmed.ncbi.nlm.nih.gov/34615611/ [DOI] [PMC free article] [PubMed] [Google Scholar]
- 21.Wagner MG, Periyasamy S, Kutlu AZ, Pieper AA, Swietlik JF, Ziemlewicz TJ, et al. An X-ray C-arm Guided Automatic Targeting System for Histotripsy. IEEE Trans Biomed Eng [Internet]. 2022. [cited 2022 Aug 21];1–12. Available from: https://ieeexplore.ieee.org/document/9855852/ [DOI] [PMC free article] [PubMed]
- 22.Smith KA, Kim HS. Interventional Radiology and Image-Guided Medicine: Interventional Oncology. Semin Oncol. 2011. Feb 1;38(1):151–62. [DOI] [PubMed] [Google Scholar]
- 23.Ahmed M, Solbiati L, Brace CL, Breen DJ, Callstrom MR, Charboneau JW, et al. Image-guided Tumor Ablation: Standardization of Terminology and Reporting Criteria—A 10-Year Update. https://doi.org/101148/radioll4132958 [Internet]. 2014. Jun 13 [cited 2022 Nov 14];273(l):241–60. Available from: 10.1148/radiol.14132958 [DOI] [PMC free article] [PubMed] [Google Scholar]
- 24.Maxwell AD, Wang TY, Yuan L, Duryea AP, Xu Z, Cain CA. A tissue phantom for visualization and measurement of ultrasound-induced cavitation damage. Ultrasound Med Biol. 2010. Dec;36(12):2132–43. [DOI] [PMC free article] [PubMed] [Google Scholar]
- 25.Madsen EL, Frank GR, Carson PL, Edmonds PD, Frizzell LA, Herman BA, et al. Interlaboratory comparison of ultrasonic attenuation and speed measurements. J Ultrasound Med [Internet]. 1986. [cited 2022 Aug 18];5(10):569–76. Available from: https://pubmed.ncbi.nlm.nih.gov/3534290/ [DOI] [PubMed] [Google Scholar]
- 26.Bamber JC, Hill CR. Acoustic properties of normal and cancerous human liver—I. Dependence on pathological condition. Ultrasound Med Biol. 1981. Jan 1;7(2):121–33. [DOI] [PubMed] [Google Scholar]
- 27.Gyöngy M, Kollár S. Variation of ultrasound image lateral spectrum with assumed speed of sound and true scatterer density. Ultrasonics [Internet]. 2015. Feb 1 [cited 2022 Aug 18];56:370–80. Available from: https://pubmed.ncbi.nlm.nih.gov/25260487/ [DOI] [PubMed] [Google Scholar]