

Abstract
The rhesus macaque is a long-lived nonhuman primate (NHP) with a brain structure similar to humans, which may represent a valuable translational animal model in which to study human brain aging. Previous MRI studies of age in rhesus macaque brains have been prone to low statistical power, unbalanced sex ratio and lack of a complete age range. To overcome these problems, the current study surveyed structural T1-weighted MRI scans of 66 animals, 34 females (aged 6–31 years) and 32 males (aged 5–27 years). Differences observed in older animals, included enlargement of the lateral ventricles and a smaller volume in the frontal cortex, caudate, putamen, hypothalamus, and thalamus. Unexpected, greater volume, were measured in older animals in the hippocampus, amygdala, and globus pallidus. There were also numerous differences between males and females with respect to age in both white and gray matter regions. As an apparent model of normative human aging, the macaque is ideal for studying induction and mitigation of neurodegenerative disease.
Keywords: Rhesus Macaque, Magnetic Resonance Imaging, Aging, Frontal Cortex
1. Introduction
With a rapidly growing population of older adults, it is becoming increasingly crucial to understand the underlying causes of normative and pathological aging and to lay a foundation for interventions that can prolong and improve quality of life. One question is what occurs in the brain as we age and how do normal aging processes differ or contribute to the development of dementias, such as Alzheimer’s disease? One of the main tools in the study of the aging human brain is non-invasive neuroimaging, which allows in vivo assessment of brain structure. Magnetic resonance imaging (MRI), for example, enables a non-invasive way to examine brain structure and assess volumetric differences in a region-specific manner. In humans, MRI can be used to prospectively distinguish individuals that will develop Alzheimer’s disease (AD) from healthy controls, indicating the sensitivity of the technique and its potential for investigating brain regions in living animals and ultimately correlating them to behavior (Killiany et al., 2000; Tondelli et al., 2012).
Non-human primates (NHPs) are important experimental models for studying human conditions, because of their close phylogenetic, physiological and anatomical relationships to humans, their long lifespan (Chiou et al., 2020) and gyrencephalic brain (Rogers et al., 2010). Study of both cognitive and physical aging in NHPs relative to humans will determine their fit as animal models of human aging processes. These qualities make rhesus macaques one of the most widely utilized NHPs in aging research (Didier et al., 2016). Macaques can live more than 25 years in captivity (Chiou et al., 2020) and exhibit cognitive decline by as early as middle-age (12–19 years; Moore et al., 2006) with further declines in memory, executive function and motor slowing in old (20+ years; Hara et al., 2014; Lacreuse et al., 2005; Moore et al., 2006; O’Donnell et al., 1999) versus young adults (5–11 years).
Previous MRIs of macaques have reported smaller volumes in gray matter in older animals, with white matter changes being somewhat equivocal (Andersen et al., 1999; Chen et al., 2013; Lacreuse et al., 2005; Wisco et al., 2008). Regionally, a decrease in gray matter volume in older individuals occurred in the frontal and temporal cortices, but not for the cerebellum, globus pallidus, visual cortex or parietal cortex (Alexander et al., 2008). One of the most common findings in rhesus macaques is a smaller volume of the caudate and putamen in old (Ingram et al., 2001; Lacreuse et al., 2005; Matochik et al., 2004; Matochik et al., 2000; Wisco et al., 2008), brain areas that are involved in movement as well as learning. Earlier MRI studies have several limitations including: 1) lack of an adequate number of subjects, 2) lack of equal sex representation (Alexander et al., 2008; Chen et al., 2013; Matochik et al., 2004; Matochik et al., 2000), 3) comprehensive age representation (Alexander et al., 2008; Chen et al., 2013; Matochik et al., 2000; Wisco et al., 2008). Consequently, many of the previous monkey studies suffer from being underpowered, unbalanced and lacking representation of both males and females across the adult lifespan.
Thus, the goal of the present study was to overcome many of these previous limitations by taking advantage of the nonhuman aging primate resource at the Oregon National Primate Research Center (ONPRC) and performing a more comprehensive MRI examination of rhesus macaque brains during aging. Here we present a dataset of 66 animals with approximately equal numbers of male and female subjects, representing a wide adult age range, analyzed with age as a continuous variable, with volumetric analysis of 35 distinct brain regions. To our knowledge, this is the most comprehensive examination of morphological changes in the brain of the rhesus macaque with relation to age and will further our understanding of the macaque as a model in which to elucidate potential causes of brain aging and neurodegeneration in humans.
2. Methods
2.1. Animals
The study used a total of 66 rhesus macaque monkeys (Macaca mulatta), with 34 females and 32 males, and with an age range of 5–28 years at the time of scan (Supplemental Table 1). Animals were indoor caged, and paired, when possible, and were fed commercial monkey chow, supplemented with fresh fruit and vegetables. Drinking water was available ad libitum. All animals were gonadally intact, with the exception of two females and gonadal steroid levels or female cyclicity in intact animals were unknown. All protocols for housing and testing received approval from the ONPRC Institutional Animal Care and Use Committee and in accordance with the National Research Council’s Guide for the Care and Use of Laboratory Animals.
2.2. MRI acquisition
Following initial sedation with ketamine (5 mg/kg), animals were intubated, then maintained on 1% isoflurane in 100% oxygen. MR imaging was done on a 3T Siemens Magnatom system. For subject safety, physiological monitoring occurred throughout MRI acquisition and recovery. Four T1-weighted magnetization-prepared rapid acquisition gradient echo (MPRAGE; (Mugler and Brookeman, 1990) images were acquired using the following parameters: TR=2500 ms, TE= 4.38 ms, TI= 1100 ms, Flip angle= 9 degrees, slice thickness= 0.5 mm, FOV= 128×128 mm2, matrix size= 256×256 (0.5 mm-sided isotropic voxels).
2.3. MRI data analysis
Analyses were performed (Figure 1), using the ANTS suite (Avants et al., 2010); (https://www.nitrc.org/projects/ants) and the FSL suite of tools (version 5.0, http://fsl.fmrib.ox.ac.uk/fsl/fslwiki/). The four scans were motion-corrected with “antsRegistrationSyN.sh” using one of the scans as a reference, and were then averaged together using “fslmaths.” Using the “antsRegistrationSyN.sh” command, an averaged image was registered, non-linearly, to the rhesus macaque INIA19 template. Application of the command “antsApplyTransforms” generated a brain mask and the brain is then skull stripped using “fslmaths”, and corrected for biased intensity using “N4BiasFieldCorrection.” The corrected and skull-stripped brain is then again registered to the INIA19 template (Rohlfing et al., 2012). The neuromaps file accompanying the INIA19 template is then applied to the extracted brain using “antsApplyTransforms.” In some cases, smaller sub-regions were merged according to previously published literature (Supplemental Table 2); (Kroenke et al., 2014; Liu et al., 2019).
Figure 1. A graphical workflow of the data processing procedure used for the MRI brain scans from rhesus macaques.
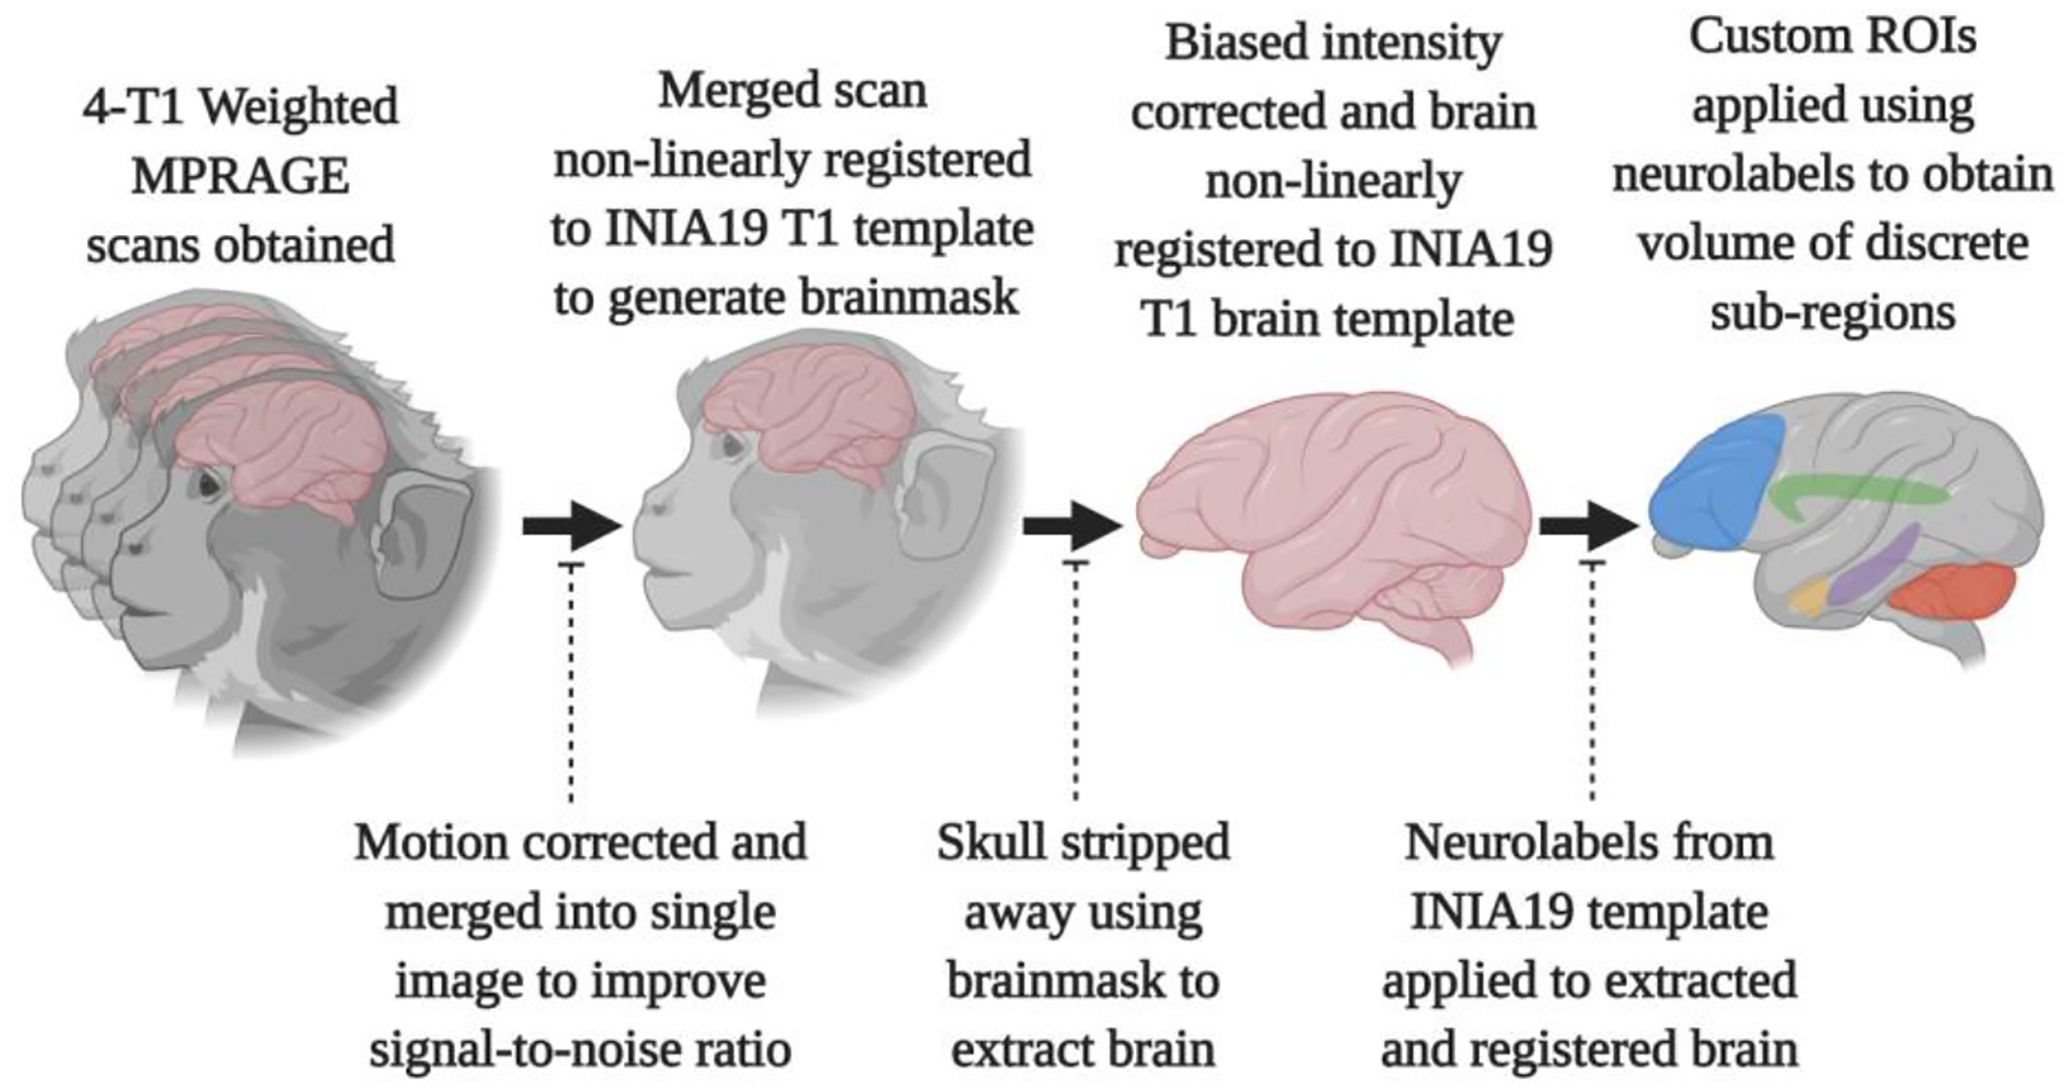
Scans were motion-corrected using one of the four scans as a reference, then merged, and the whole head scan aligned to the INIA19 whole brain template. The resulting brain mask was manually-corrected, then used to strip away all tissue that was not brain. The biased intensity was corrected, then the skull-stripped brain was aligned to the brain template provided with the INIA19 package. Application of the neuromaps and custom ROIs obtained volumes. (Images created with software from BioRender.com).
Due to individual variation in head size, the intracranial volume (ICV) was used to normalize all examined regions. The ICV was obtained, as mentioned above, from merged images, which were masked to include only intracranial space, defined as all space inside the skull (including CSF space between brain and skull) using an in-house routine followed by manual inspection and refinement if needed.
2.4. Statistics
Modelling the relationship between aging and volumetric differences, as well as interactions with sex, occurred by multiple polynomial regression. Sex-dependent polynomial aging models were fitted on 35 regions of interest (ROIs) normalized to ICV. Data was fit to linear models as well, to compare to geometric analysis, as sex difference and sex by age interactions. We started with a saturated model that includes indicator variables of sex, age, age quadratic term, and their interactions. We used stepwise methods to select a parsimonious subset of independent variables for inclusion in the final regression model using a 5% significance level as stopping criteria. Backward selection determines a final model and the best fit (linear or geometric) reported. In all figures, individual male data is designated by empty triangles and dashed lines, whereas female data by solid circles and solid lines. In analyses when there was no effect of sex, but an effect of age, the trend line for combined male/female is dot and dashed lines. Only statistically significant differences were included in the figures. The full statistical model is available in Supplemental Table 3.
3. Results
All values reported in parentheses are equations for the trend lines of the significant changes with age, presented individually by sex or combined, as determined by backward selection, with the best linear or quadratic fit shown. There was a significant difference in age adjusted ICV (cm3) between sexes with ICV greater in males after accounting for age (p-value < 0.0001, ANCOVA, Figure 2A). In the following list of subcortical gray matter regions, there was no effect of sex, but a significant effect of age. In the caudate, volume loss was fitted by a quadratic expression (caudate = 1.21989− 0.0001822 × age2; page2 = 0.0006 Figure 2B), while the putamen experienced a linear decline (putamen = 1.66005 − 0.00593 × age; page = 0.0035 Figure 2C). The globus pallidus increased linearly with age, (globus pallidus = 0.36752 + 0.0063 × age; page < 0.0001; Figures 2D). The thalamus displayed significant difference in intercept between sex (pintercept = 0.0068) and age2 (p < 0.0001) with both sexes best fit by negatively sloped quadratic trends, however, the males have a higher intercept (thalamusmale= 1.09001 − 0.0002315 × age2; thalamusfemale= 1.03106 − 0.0002315 × age2; Figure 2E). The hypothalamus displayed a significant sex difference in intercept (p = 0.0481), age (p = 0.0426) and an age by sex interaction (p = 0.0322), with both sexes having negatively sloped trend lines. The male trend line, however, was quadratic (hypothalamusmale = 0.30085 − 0.00289 × age + 0.00007797 × age2) and the female line linear (hypothalamusfemale = (0.24728 + 0.00459 × age − 0.0001522 × age2; Figure 2F).
Figure 2. ICV (A), volume of the caudate (B), putamen (C), globus pallidus (D), thalamus (E), and hypothalamus (F) normalized to ICV.
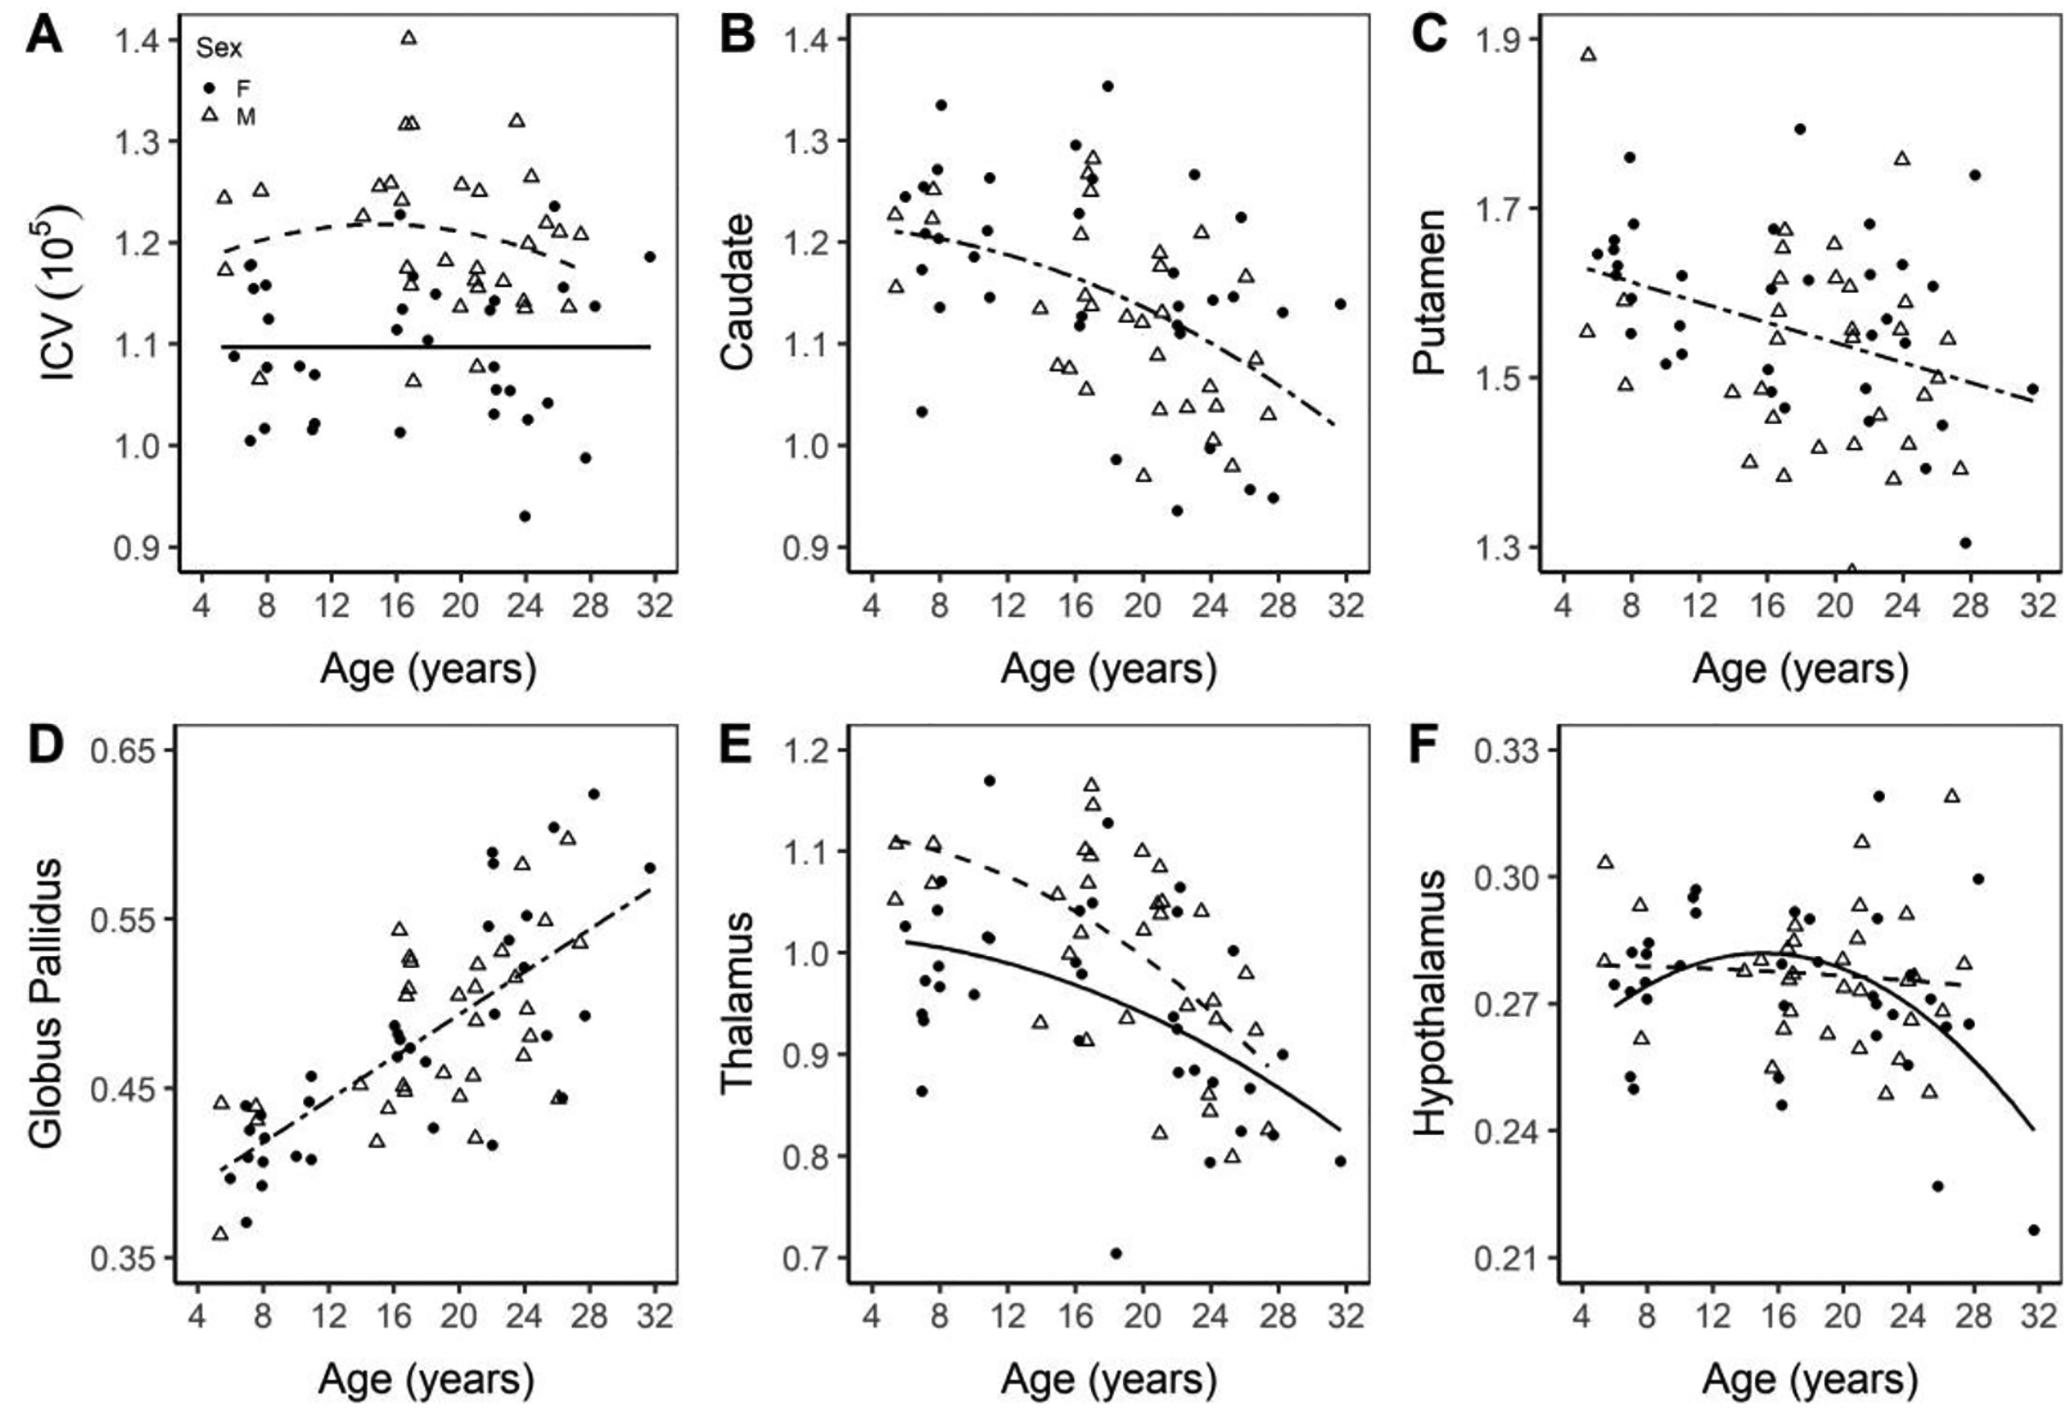
Total intracranial volume for all 66 animals are shown (A), as well as normalized data in the listed regions (B-F). Males are marked with an open triangle and the best fit is a dashed line while females are marked with a solid circle and a solid line.
The anterior cingulate displayed a significant effect of age, with a negatively sloped linear loss (anterior cingulate = 1.07982 − 0.00323 × age; p = 0.0043; Figure 3A). In the dorsolateral prefrontal cortex (dlPFC), both sexes had decreasing trends with age with a significant age2 by sex interaction (p = 0.0451) (dlPFCmale = 2.83521 − 0.05004 × age + 0.0011085 × age2; dlPFCfemale = 2.40715 − 0.0003115 × age2; Figure 3B). The frontal cortex displayed a significant linear decrease with age (frontal cortex = 9.69119 − 0.03834 × age; page < 0.0001; Figure 3C). The occipital and parietal cortices show no significant difference with age or between sexes. The temporal cortex displays a significant difference in intercept between sex, with males having a higher normalized volume than females (temporal cortexmale = 10.60423; temporal cortexfemale = 10.25834; p = 0.0026; Figure 3F).
Figure 3. Volume of the anterior cingulate (A), dlPFC (B), frontal (C), occipital (D), parietal (E), and temporal (F) cortices normalized to ICV.
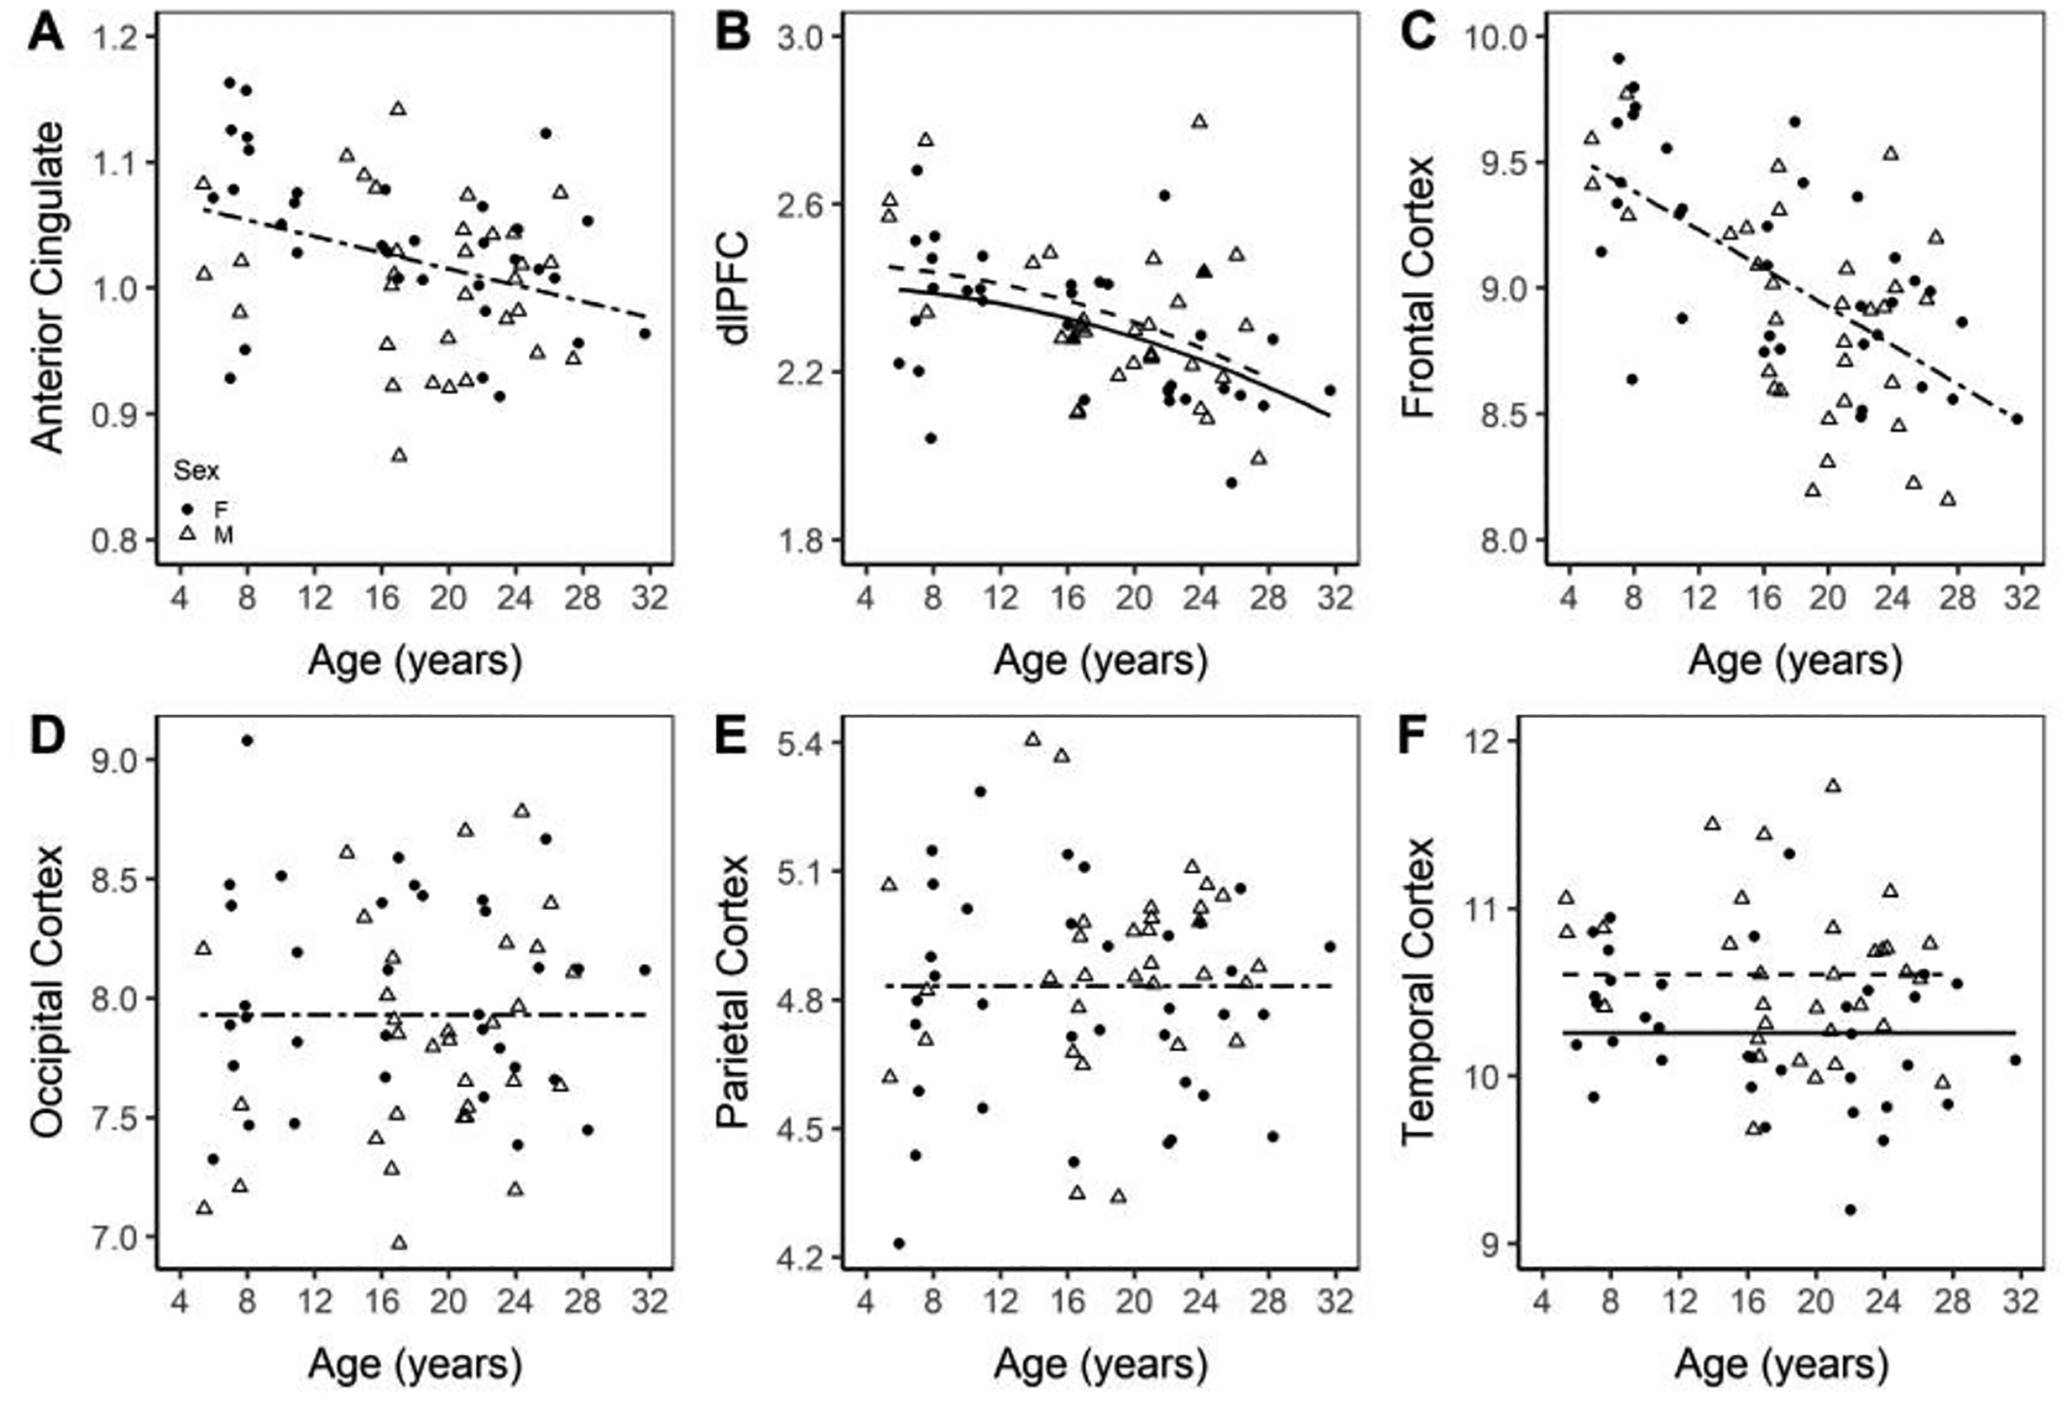
Normalized volumes of the anterior cingulate cortex, frontal, occipital, parietal and temporal cortices. Males are marked with an open triangle and a dashed line while females are marked with a solid circle and a solid line.
The three regions of the corpus callosum, the major white matter tract bridging the cerebral hemispheres, displayed inverted U-shaped, quadratic trend lines with age (genu = 0.09672 + 0.00275 × age − 0.00009196 × age2, page2 = 0.0178; body = 0.1957 + 0.00425 × age − 0.0001276 × age2, page2 = 0.0366; splenium = 0.13615 + 0.00601 × age − 0.0001681 × age2, page2 = 0.0044; Figure 4A–C). The internal capsule, a subcortical white matter (WM) area, displayed a significant age by sex interaction, with only the males displaying an inverted U-shaped trend (internal capsulemale = 0.93852 + 0.01272 × age − 0.0005118 × age2; page2 < 0.0029; Figure 4D).
Figure 4. Volume of the genu (A), body (B), and splenium (C) of the corpus callosum and the internal capsule (D) normalized to ICV. All trend-lines indicate a significant difference.
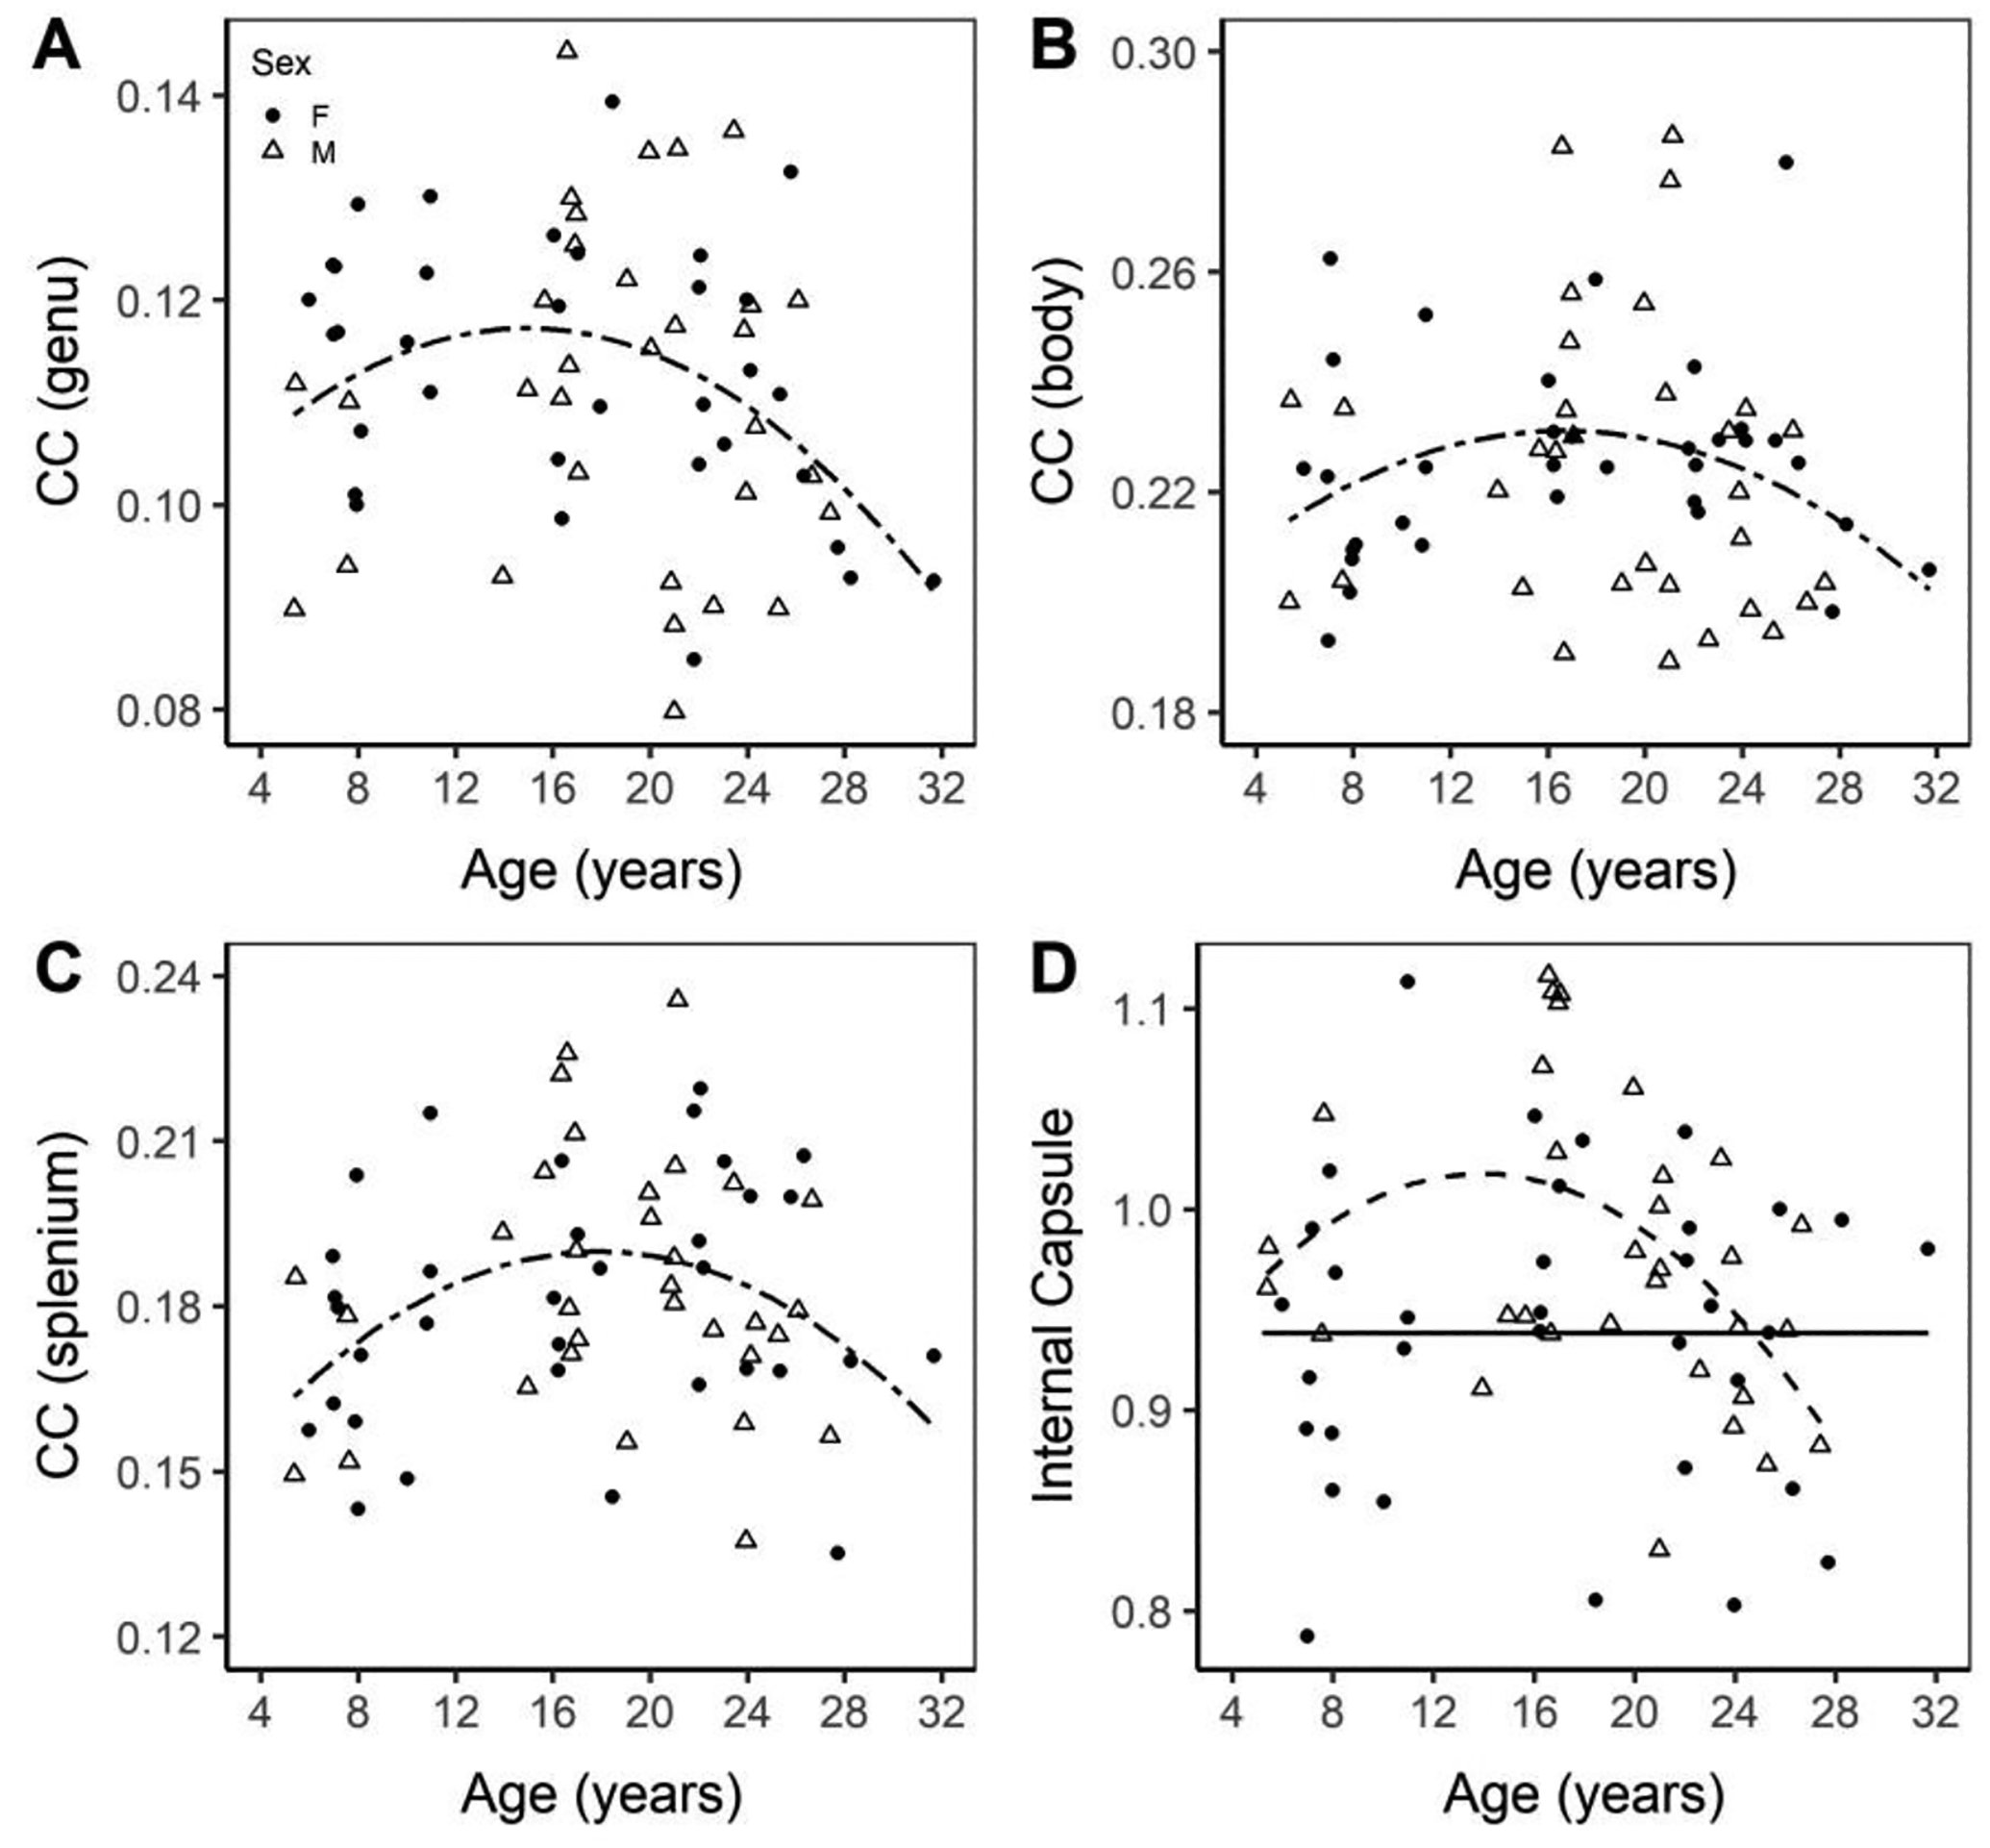
Normalized regional volumes of the corpus callosum sub-regions and internal capsule. Males are marked with an open triangle and a dashed line while females are marked with a solid circle and a solid line.
Regional WM also showed several significant changes in the current study. The underlying frontal cortical WM displayed a significant effect of age (p = 0.0111) as well as an age by sex interaction (p = 0.0354), with both sexes showing an inverted U-shaped quadratic trend (frontal WMmale = 2.30902 + 0.05732 × age − 0.0018367 × age2; frontal WMfemale = 2.30902 + 0.03802 × age − 0.0008695 × age2; Figure 5A). The occipital WM showed significant effect of sex (p = 0.0160) and age2 (p=0.0350) and both trend lines are inverted U shaped, though females have a higher intercept (occipital WMmale = 3.72897 + 0.05517 × age − 0.00143 × age2; occipital WMfemale = 3.88085 + 0.05517 × age − 0.00143 × age2; Figure 5B). The parietal WM shows significant difference in intercept between sex (p = 0.0099) and age (p = 0.0033) with both linear trend lines having positive slopes, but males having a higher intercept (parietal WMmale = 6.88417 + 0.02005 × age; parietal WMfemale = 6.64433 + 0.02005 × age; Figure 5C). Temporal WM displayed a significant age by sex interaction, with males having a higher intercept and females showing no trend with age (temporal WMmale = 1.46871 + 0.00214 × age, page_sex = 0.0272; temporal WMfemale = 1.46871).
Figure 5. Volume of the frontal WM (A), occipital WM (B), parietal WM (C), and temporal WM (D) normalized to ICV.
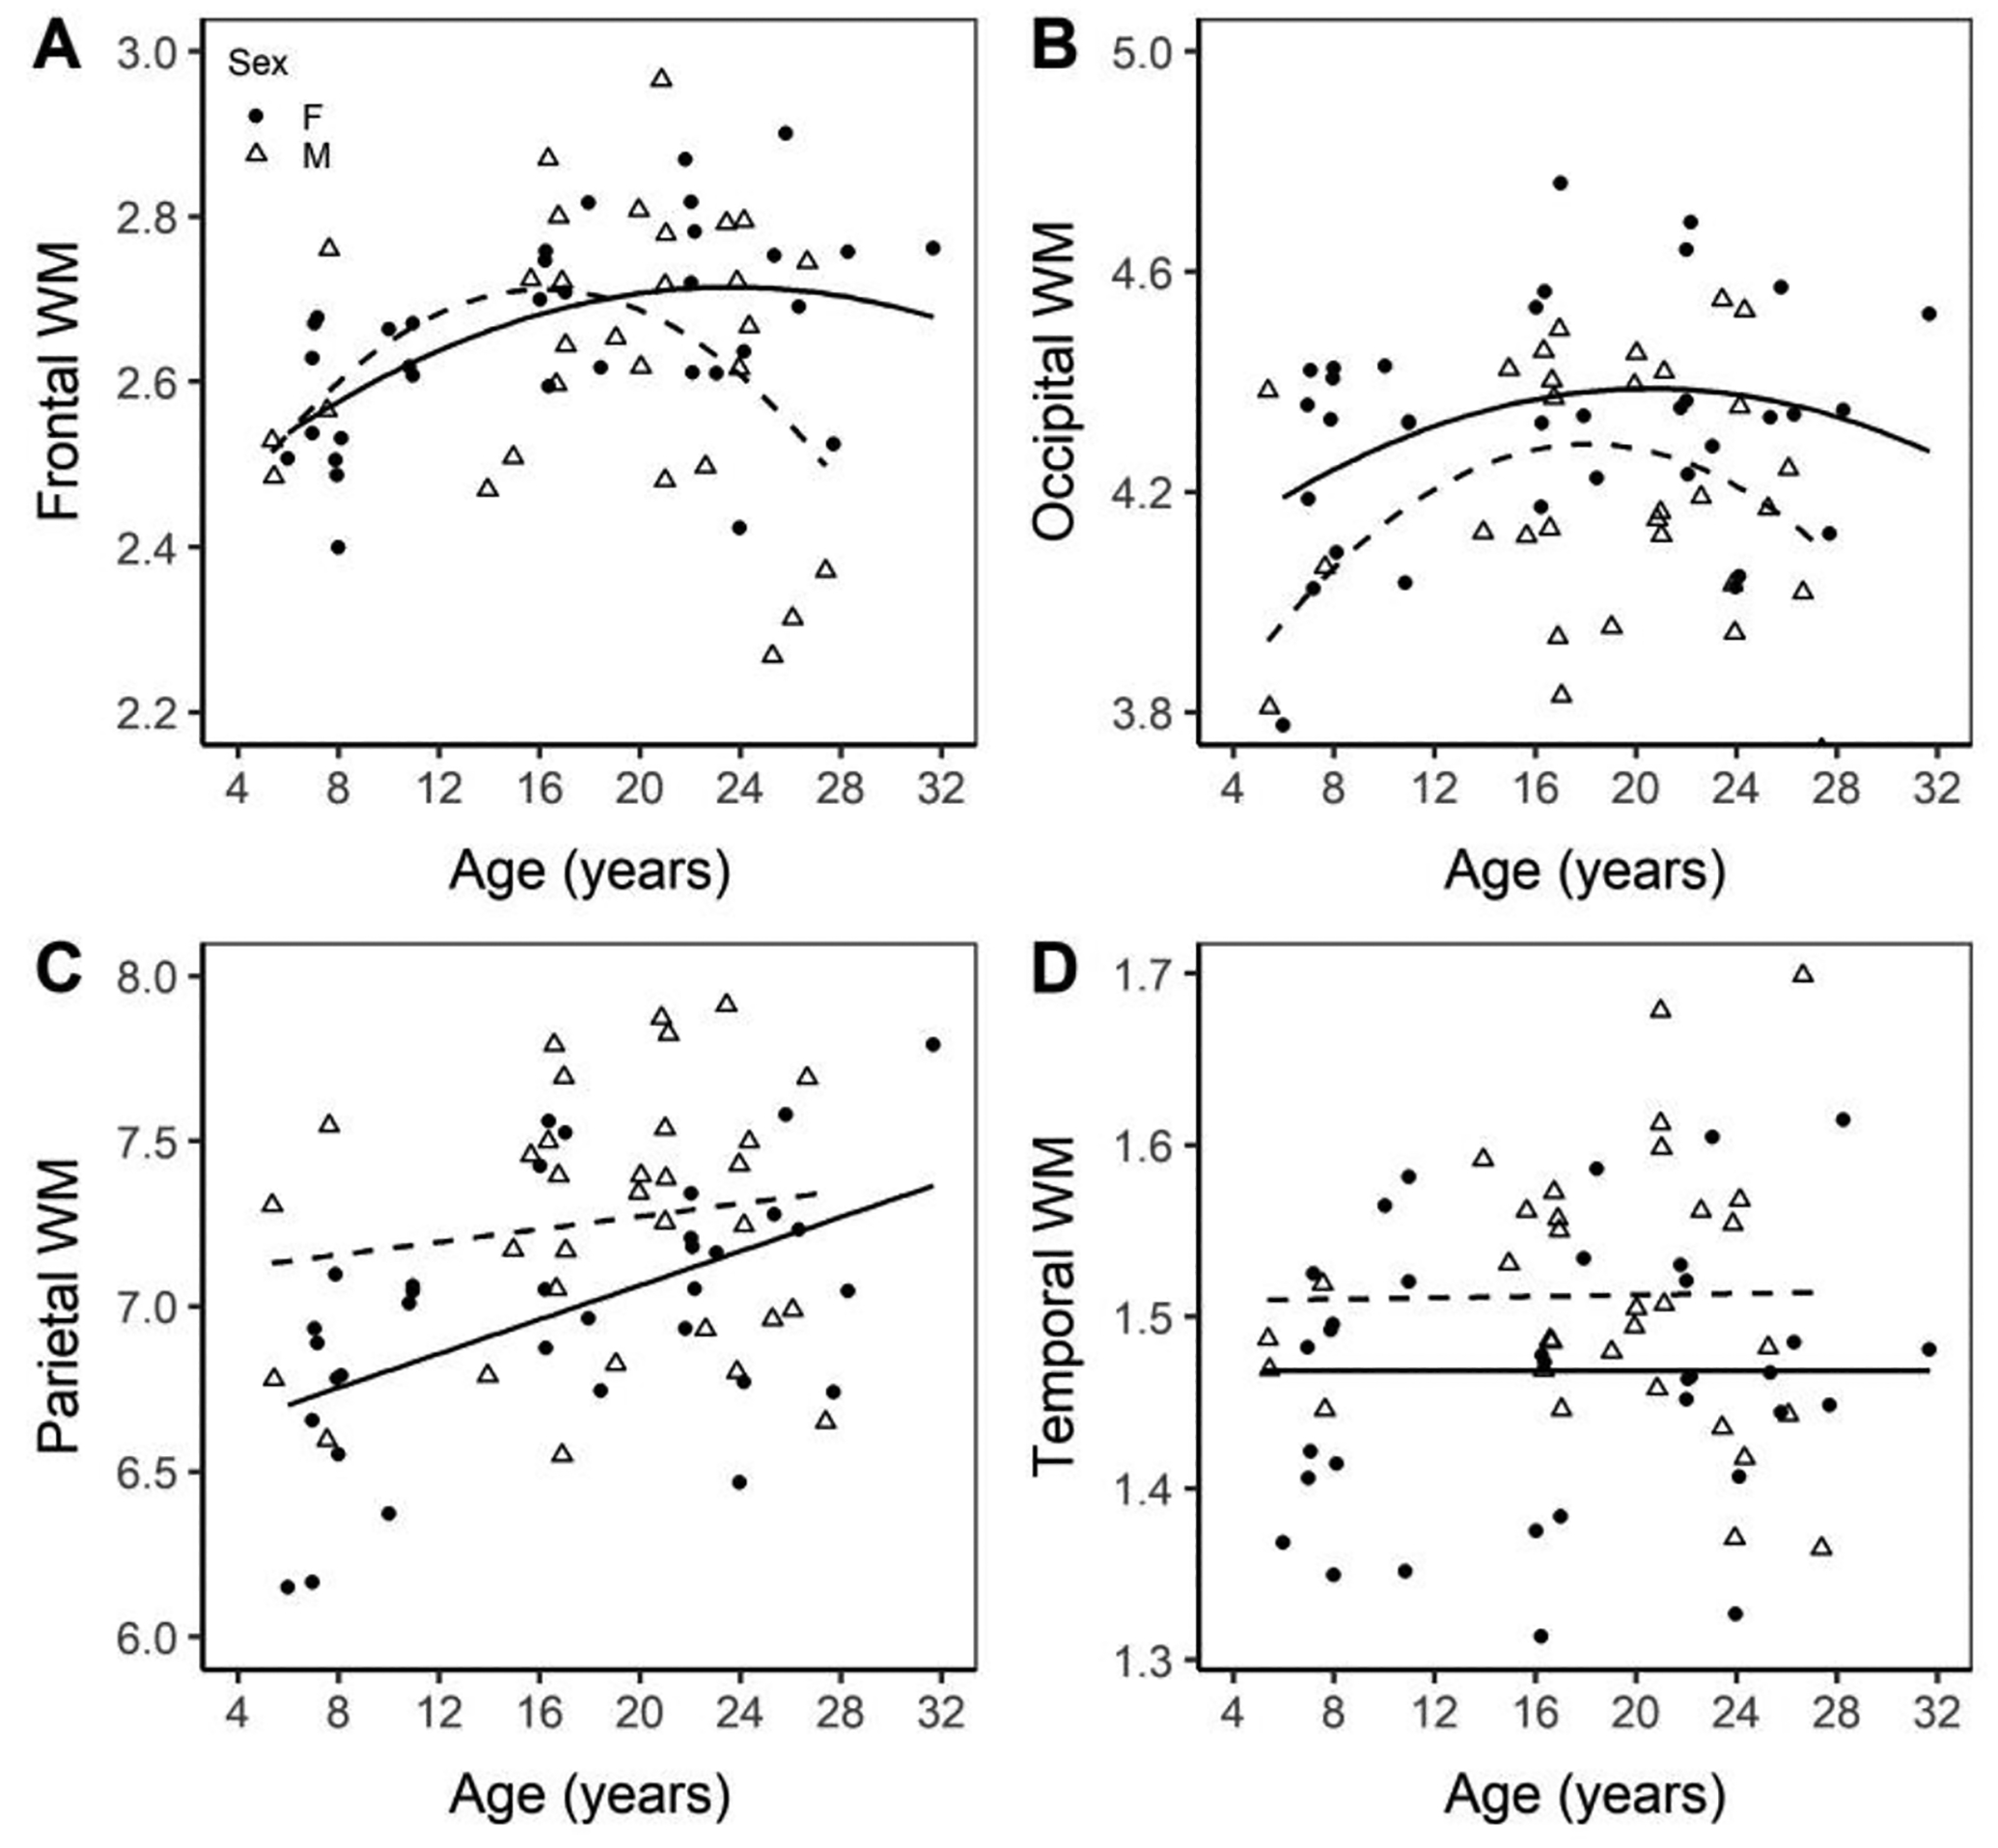
Normalized volumes of the white matter regions of the frontal, occipital, parietal and temporal cortices. Males are marked with an open triangle and a dashed line while females are marked with a solid circle and a solid line.
Unexpectedly, several regions showed higher volumes in older subjects. The amygdala had a significant age (p = 0.0059) and age2 by sex interaction (p = 0.0134) with both trend lines having positive slope while the male line is quadratic (amygdalamale = 0.65882 + 0.00247 × age + 0.00006405 × age2) and the female line is linear (amygdalafemale = 0.65882 + 0.00247 × age; Figure 6A). The dentate gyrus shows a significant difference in intercept between sex, (p = 0.0020), age (p = 0.0113), and an age2 by sex interaction (p = 0.0004). Both trend lines had a positive slope, though the male is quadratic (dentate gyrusmale = 0.42869 − 0.01161 × age + 0.00040329 × age2) and the female is linear (dentate gyrusfemale = 0.3296 + 0.00146 × age; Figure 6B).). The fornix shows independence from age, but males had a higher intercept (fornixmale = 0.14659; fornixfemale = 0.13925; p < 0.0119; Figure 6C). The hippocampus showed a significantly different intercept between sex (p = 0.0037), age (p = 0.0150) and an age2 by sex interaction (p = 0.0010), with both trend lines having positive slopes, though the male is quadratic (hippocampusmale = 1.09158 − 0.02525 × age + 0.00091599 × age2), while the female is linear (hippocampusfemale = 0.86565 + 0.00342 × age; Figure 6D).
Figure 6. Volume of the amygdala (A), dentate gyrus (B), fornix (C), and hippocampus (D) normalized to ICV.
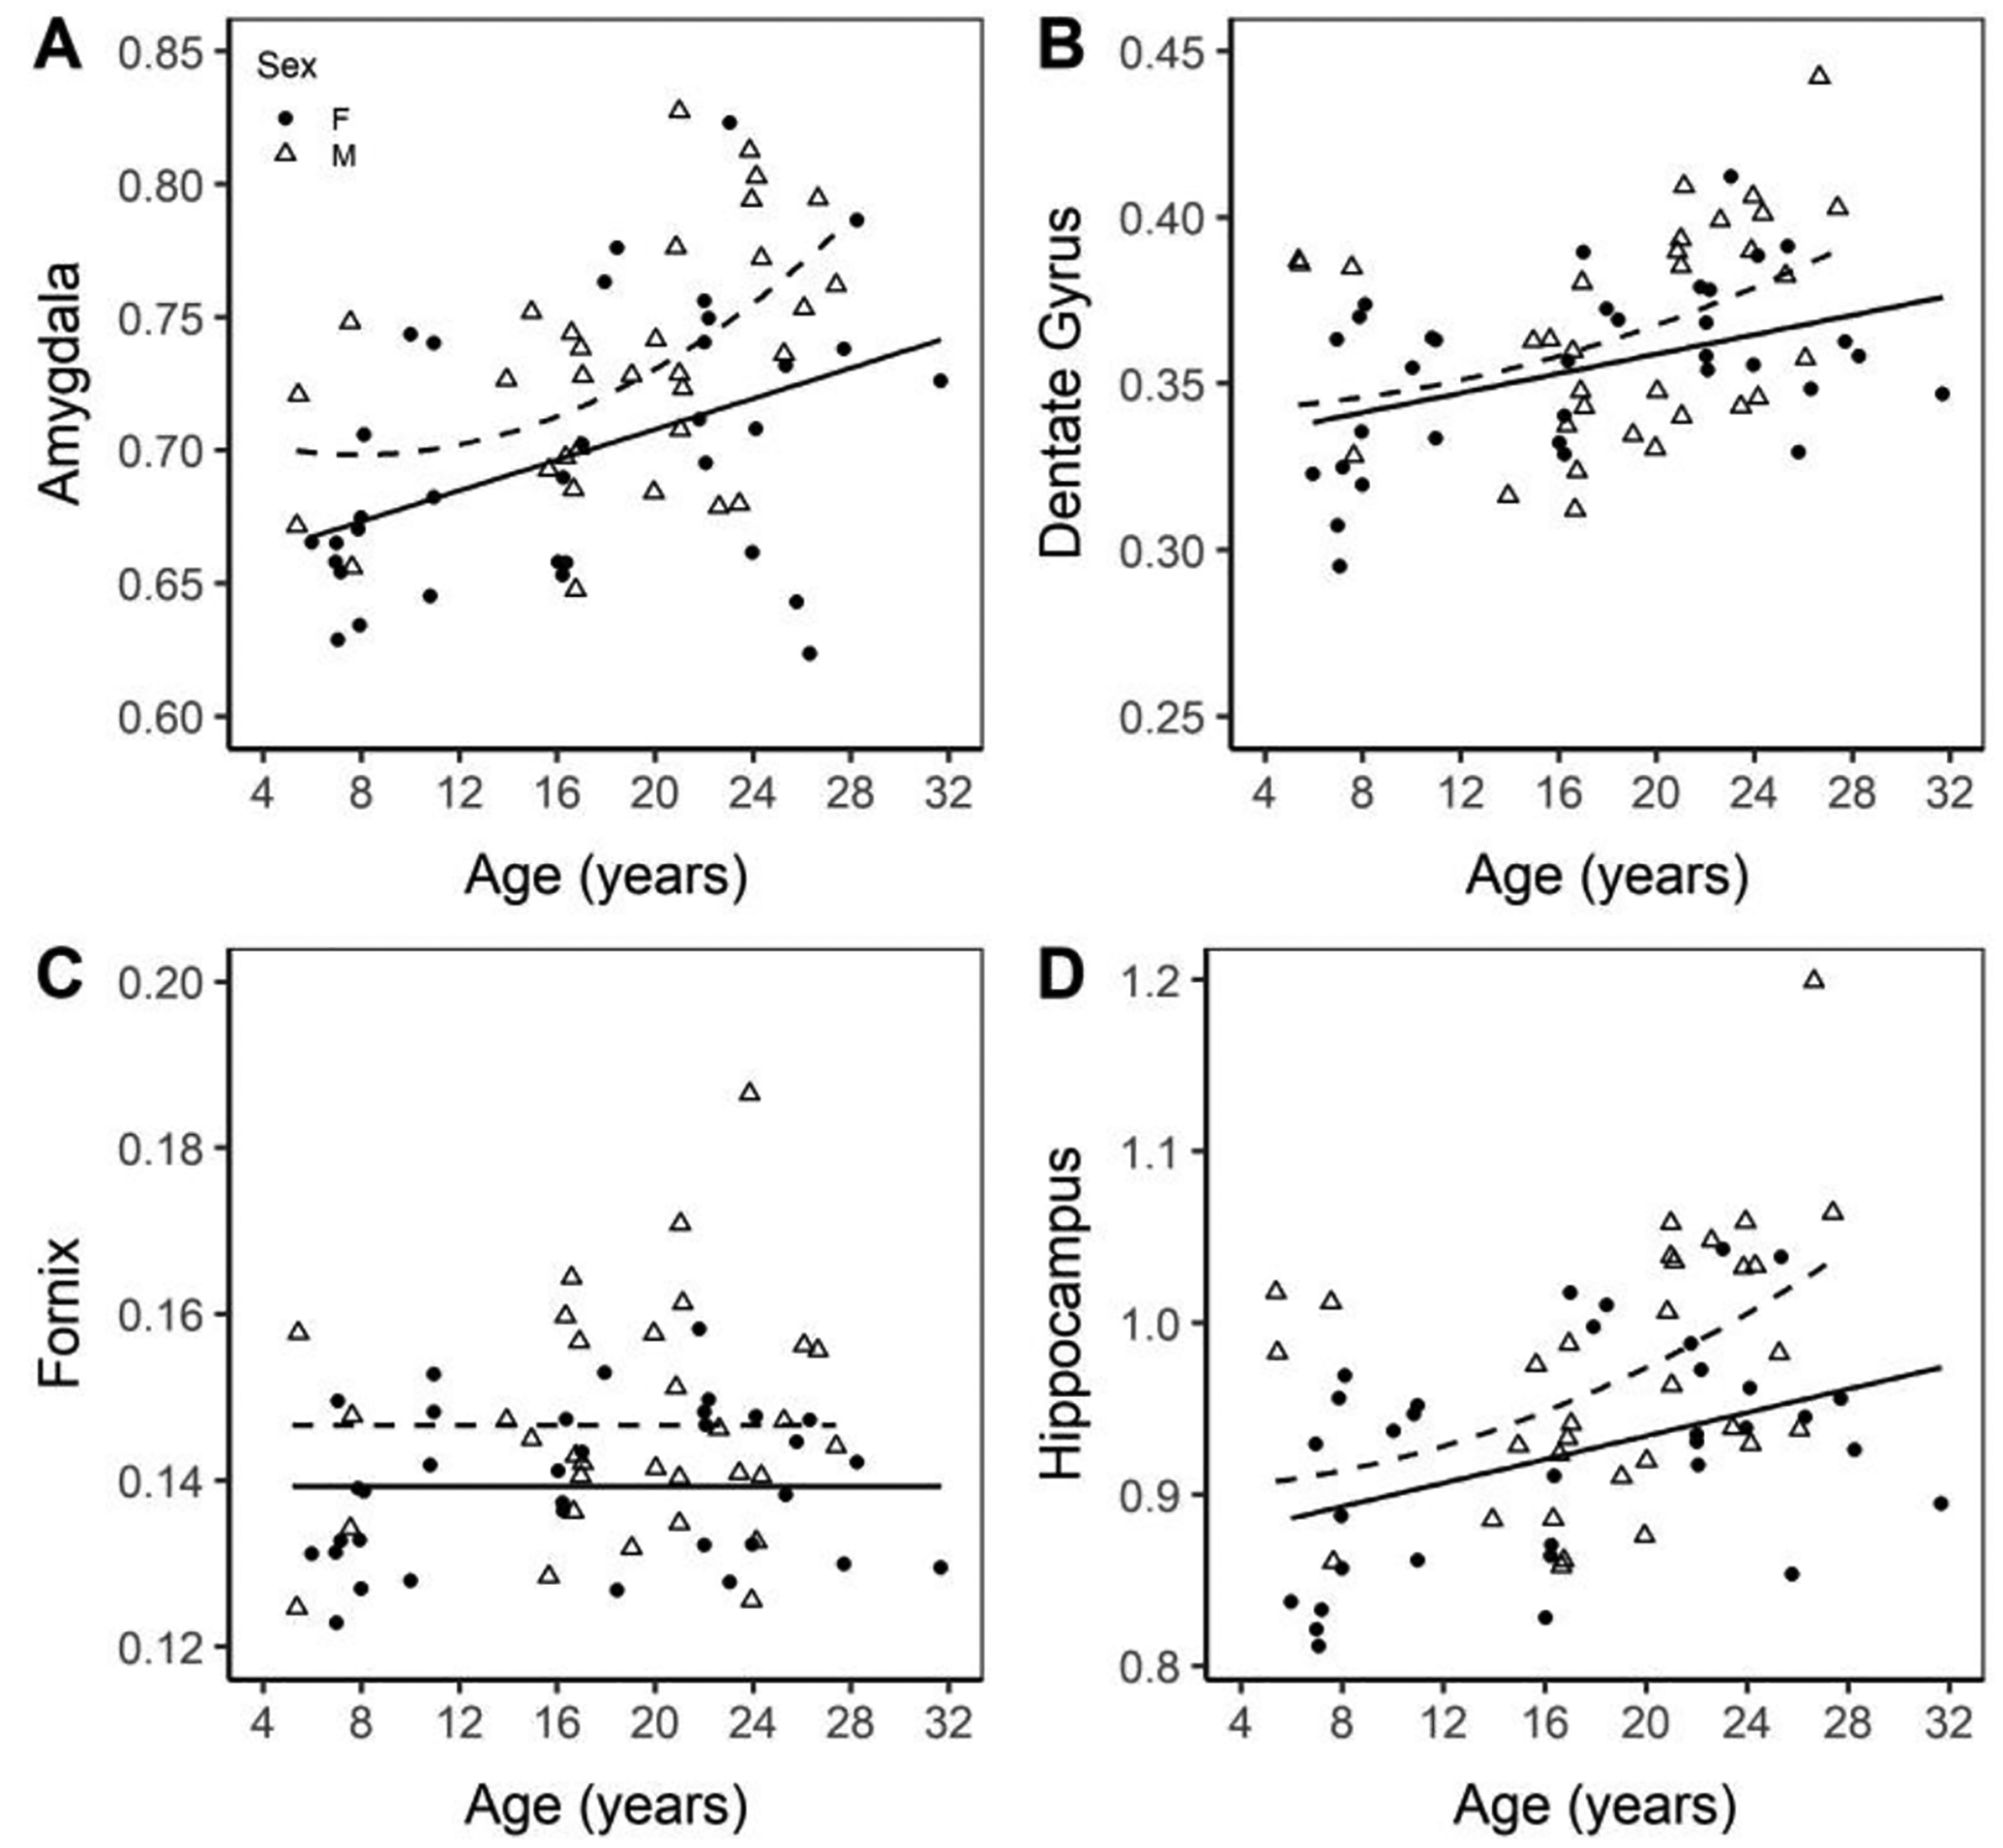
Normalized volumes of the amygdala, dentate gyrus, fornix, and hippocampus. Males are marked with an open triangle and a dashed line while females are marked with a solid circle and a solid line.
The lateral ventricles, which hold a large fraction of the total CSF internal to the brain, display a significant main effect of age with a linear trend line with a positive slope (lateral ventricle = 0.46482 + 0.00222 × age; p = 0.0165; Figure 7A). The 3rd ventricle shows no significant association with aging (Figure 7B). The 4th ventricle shows a significant difference in intercept between sex (p = 0.0055) and an age by sex interaction (p=0.0138), with only the males (fourth ventriclemale = 0.08766 − 0.0005437 × age) having a negative linear sloped trend line p = 0.0138; Figure 7C).
Figure 7. Volume of the lateral ventricle (A), 3rd ventricle (B), and 4th ventricle (C) normalized to ICV. All trend-lines indicate a significant difference.
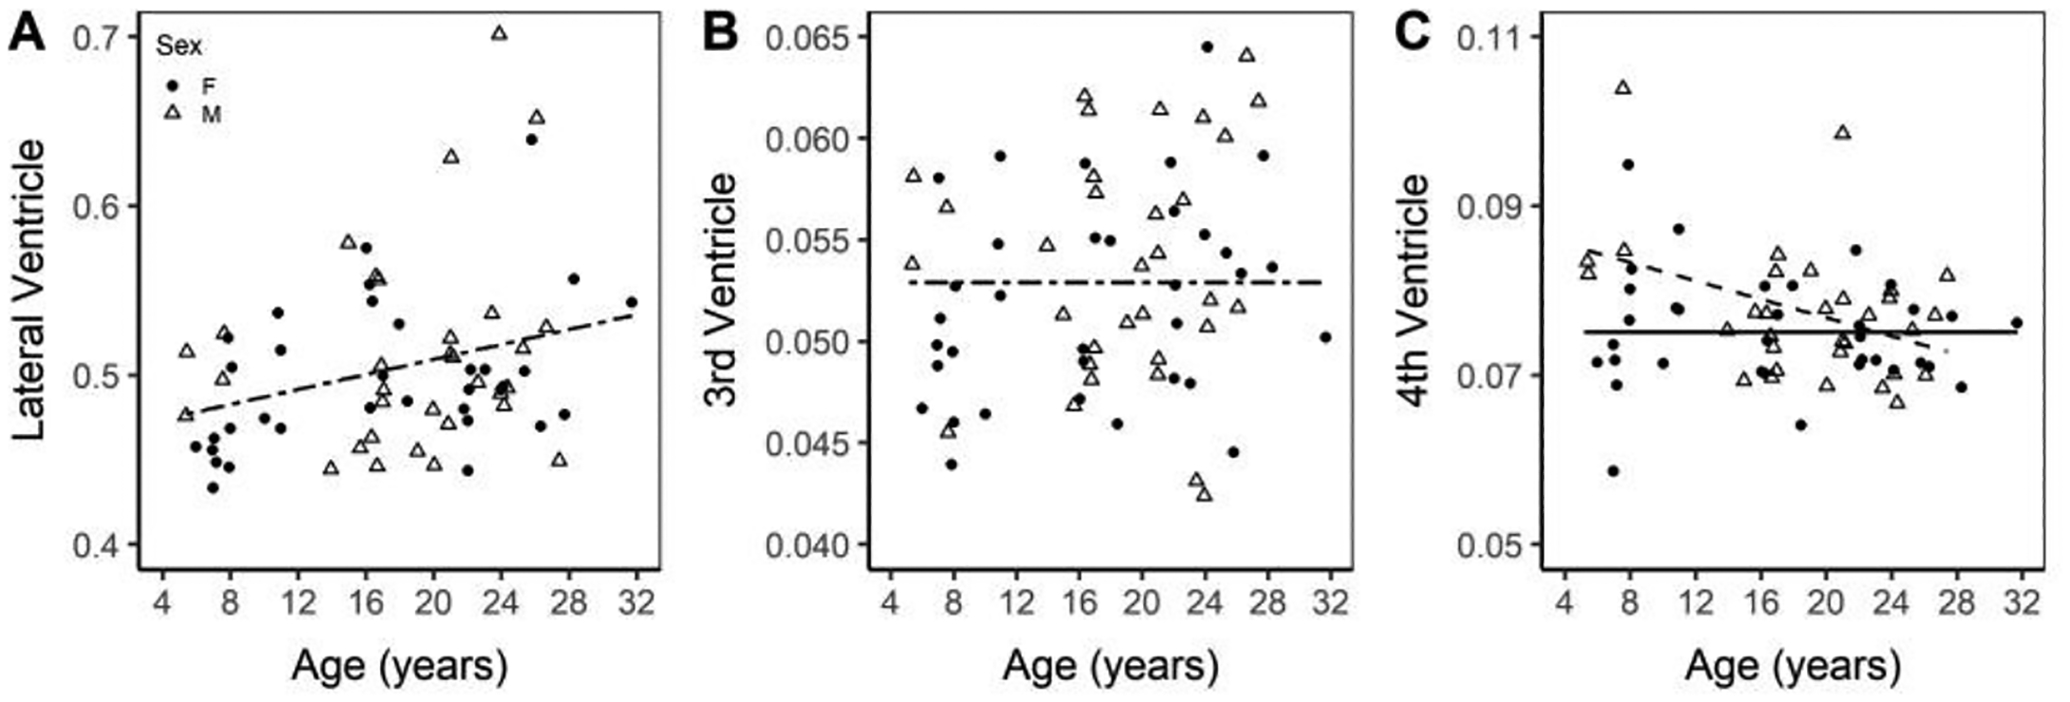
Normalized regional volumes of the lateral, 3rd, and 4th ventricles. Males are marked with an open triangle and a dashed line while females are marked with a solid circle and a solid line.
4. Discussion
Our current study shows a decrease of frontal, dlPFC and anterior cingulate cortex volumes with age, which may relate to prior reports of diminished performance on executive function in aged rhesus macaques (Hara et al., 2012; Moore et al., 2006; Sridharan et al., 2012). Prior studies have also found a correlation between behavioral differences on executive function tasks and frontal cortex atrophy at later ages in macaques (Alexander et al., 2008; Shamy et al., 2011; Sridharan et al., 2012). Changes in neuronal firing rate in the PFC and declines in working memory performance are also observed in aged rhesus macaques (Wang et al., 2011). Longitudinal studies in cognitively normal elderly humans also report both a generalized loss of GM (Kramer et al., 2007) and a frontal cortex volume decrease (Crivello et al., 2014; Salat et al., 2004) that is associated with cognitive decline (Cardenas et al., 2011), which is exacerbated in Alzheimer’s disease (Mungas et al., 2005). Notably, a clinical study of healthy aged humans also revealed gray matter atrophy in the medial frontal, dlPFC, and the anterior cingulate (Bergfield et al., 2010). Moreover, the latter region, in humans, is involved in decision-making processes and projects to the prefrontal cortex (Bush et al., 2002; MacDonald et al., 2000; Vanveen and Carter, 2002), increasing functional complexity with the process of aging. The thalamus, which was smaller volumetrically with age in the current study, impacts many functions in humans including sensory processing, learning, memory and executive functioning (Fama and Sullivan, 2015) and clinically, connectivity to frontal lobe regions are susceptible to changes with age, though our data do not differentiate sub-regions of the thalamus as tested in human studies (Hughes et al., 2012). Corroborating prior studies, we also observed negative correlations with age in the volume of the caudate and putamen. These regions are associated with learning and motor control, which are impaired in older rhesus macaques (Ingram et al., 2001; Lacreuse et al., 2005; Matochik et al., 2004; Matochik et al., 2000; Wisco et al., 2008). The caudate and putamen also have been observed to decrease volumetrically with age in human studies (Abedelahi et al., 2013; Raz et al., 2010), but decrease more precipitously in those suffering from AD (Barber et al., 2002; Cho et al., 2014; Jiji et al., 2013).
In line with NHP (Andersen et al., 1999) and human studies (Cardenas et al., 2011; Coffey et al., 1992), we observed an enlargement of the lateral ventricles in older animals, indicating a possible loss of brain tissue. The cause of other positive correlations between volume and age in regions including the hippocampus, amygdala and globus pallidus is unknown. The hippocampus, a structure crucial to memory and shown to atrophy with aging in humans (Raz et al., 2010), surprisingly showed larger volumes in older macaques in our study, rather than the previously reported stability (Shamy et al., 2006; Shamy et al., 2011). The globus pallidus shows a strong, consistent positive correlation to age, which may be in part due to iron deposition that occurs in this region with age (Wu et al., 2022). Iron deposition could affect MRI acquisition, rather than indicate a change to the actual volume of the structure. These regions may also experience inflammation, potentially a result of neuropathology, which is consistent with volumetric increases seen in a human MRI examination of mild traumatic brain injury, which showed increased hippocampal volume following injury (Ross et al., 2020). Neuroinflammation also occurs in human aging (Ownby, 2010) and one possible explanation for the observed larger volumes in older animals is that the rhesus hippocampus is known to develop AD-like neuropathology (Sridharan et al., 2013). While the hippocampus, specifically the dentate gyrus, is one of the regions known to display adult neurogenesis, attributing higher volumes to this process is questionable considering neurogenesis rates decrease in aged macaques (Aizawa et al., 2009; Gould et al., 1999).
It is unclear what underlies volumetric differences in old animals in GM regions detectable by MRI in the NHP. Previous studies showed no neuronal loss in the rhesus entorhinal cortex (Gazzaley et al., 1997; Merrill et al., 2000) and hippocampus (Keuker et al., 2003). In the current study, the anterior cingulate and dlPFC both had negative volumetric correlations with age, despite macaques displaying no neuronal loss in these regions, even at more advanced ages (Stonebarger et al., 2020). However, there is significant loss of dendritic spines in the prefrontal cortex of older macaques (Young et al., 2014) and in the frontal cortex (Peters et al., 2008), which may account for regional volume loss. Moreover, declines in neuronal volume, atrophy of dendritic arbor, spines (Duan et al., 2003) and synapses (Peters et al., 2008) may be related to gray matter volumetric differences. Previously published work, such as the reported lack of neuronal loss in the brains of older macaques, also support that macaques are a model of normative rather than pathological aging in humans.
There is an interesting pattern of change over the lifetime of the rhesus macaque in a number of WM regions. This inverted U-shaped trajectory mimics human studies of healthy aging (Fotenos et al., 2005; Grydeland et al., 2013). In the current study the corpus callosum (body, genu and splenium), internal capsule (males only) and frontal and occipital WM all displayed this pattern. In humans, frontal WM decreases with age (Raz et al., 2010). This supports the concept that myelination continues into adulthood, before accelerating declines in old age (Yeatman et al., 2014). These patterns highlight the importance of treating age as a continuous variable. Prior microscopy work shows unraveling of the myelin sheath in the corpus callosum of older macaques relative to younger animals, though how this would affect volume is unknown (Peters and Sethares, 2002). Loss of myelination is one avenue, by which brain changes may affect behavior, which also changes with age in humans (Bartzokis, 2004; Grydeland et al., 2013). In humans, the corpus callosum has been shown to atrophy during the course of normal aging (Raz et al., 2010).
Sex-related volumetric differences, for example, the expected larger intracranial volume in males, occurred in our study. However, because of the scarcity of NHP data on sex-related volumetric brain changes across age, most of the comparisons are with clinical reports. Males also showed a slightly larger volume in the dlPFC versus females, although their trajectory of change with age was similar. This is contrast to a report that men show a greater volumetric decrease with age in the frontal cortex (Murphy et al., 1996), occurring as early as middle-age (Gur et al., 2002). In the current study, rhesus males have higher normalized volume of both the thalamus and hypothalamus, but with a downward trajectory with age for both sexes. More specifically, in the thalamus, the males showed a steeper decline throughout adulthood; however, the line of best fit never reaches as low as the females. In the hypothalamus, the males had a linear loss with age, while the females showed an overall quadratic trend with a steep decrease at later age points. Interestingly, in both the temporal cortex and the temporal WM, males showed greater normalized volumes, despite no change in older animals observed in either sex. In humans, there is typically no sex-related difference in temporal lobe volume (Murphy et al., 1996) but, there is a volumetric decrease in old that is exacerbated in males (Cowell et al., 1994). In our study, sex differences were in all cortical WM regions studied. Males displayed an earlier peak in frontal WM with a steeper decline in later age. Rhesus males also had lower normalized occipital WM volume than females, also with a steeper decline in later age. In parietal WM, males start with a greater volume, and both sexes show an increase in volume at later age, though the female trend line had a greater slope. This pattern of changes is very interesting and overall suggest a vulnerability of males to late-age cortical WM loss. In humans, males typically show a greater overall volume of WM than females even when corrected for total brain volume (Allen et al., 2003; Chen et al., 2007; Gur et al., 1999).
In the present study, rhesus males had slightly larger normalized volume in the hippocampus, dentate gyrus and the amygdala, which all increased with age. Some human studies (Goldstein et al., 2001), but not all (Gur et al., 2002), have reported larger amygdala volumes in males, whereas the opposite effect has been observed in the hippocampus, with females having a higher normalized volume (Filipek et al., 1994). Overall, a general pattern of change observed would appear to be a worsening of changes with increasing age in some key regions in males.
One uncontrolled variable that is of interest is the effect of sex hormone status, as this can impact brain volume in studies of human aging (Mosconi et al., 2021). However, given the acute nature of this study, the reproductive cycle status of older females was not established. Moreover, despite two females being gonadectomized at time of scan, this study was not powered to examine this factor. A potential confound, as a result of the cross-sectional design, is the broad range of scan dates between some of the older and younger animals. When interpreting cross-sectional studies it is important to note that some prior studies have found a discrepancy between the results of cross-sectional and longitudinal studies of age (Lindenberger, 2014; Pfefferbaum and Sullivan, 2015), while others have shown good agreement between longitudinal analysis and cross-sectional predictions (Fotenos et al., 2005).
We note other caveats to our study, especially that macaques can live into their early forties, and the lack of availability of the oldest-old limit our understanding of brain modifications with advanced age. More technical limitations include the effect of age on T1-signal (Badve et al., 2015; Cho et al., 1997; Hagiwara et al., 2021; Steen et al., 1995), which may impact the way some cortical and subcortical structures are measured. Technical advances, on the other hand, provide additional tools for examining WM loss, which is associated with cognitive decline in NHPs, (Lyons et al., 2004). Connectivity and tractography can be better defined with diffusion tensor imaging (DTI), as opposed to volumetric change, as demonstrated by the loss of microstructural integrity during normal aging in rhesus macaques and chimpanzees (Chen et al., 2013), as well as humans (Fama and Sullivan, 2015; Hughes et al., 2012). As MRI is non-invasive and repeatable, longitudinal studies are possible, tracking changes in individual macaque brains over time reduces variability by using repeated measures in the same subjects. Clinically, longitudinal scans have detected age-related changes (Bagarinao et al., 2022; Fjell et al., 2009; Nyberg et al., 2010; Raz et al., 2005; Taki et al., 2013) indicating a similar strategy would be effective in studying rhesus macaques. For example, a recent longitudinal, clinical study revealed age-related declines in the amygdala and hippocampus (Bagarinao et al., 2022) suggesting that a similar approach may clarify NHP studies.
In sum, comparing our results with the primate literature corroborates some regional change with age, but is equivocal in others. Inter-individual differences exist, and in the absence of behavioral measures, the functional significance of the observed volumetric changes is unknown. However, the clinical literature leads to the conclusion that the rhesus macaque appears to mimic the patterns of normal human aging with no indication of more severe AD-like changes (Killiany et al., 2000; Pini et al., 2016), which is important for model development and future experimental design.
Supplementary Material
HIGHLIGHTS.
Examined cross-sectional, age-related volumetric changes in the nonhuman primate brain
MRI analysis revealed several sex differences in normalized brain regions
Negative trajectories in cortical and subcortical gray matter varied regionally
Change in white matter volume varied regionally, but many with a middle-age peak and decline
Frontal cortex is particularly susceptible, with volumetric loss in both gray and white matter
Acknowledgements:
Support for this study comes from National Institutes of Health (NIH) grants: AG019100, AG055378, AG062220 and OD011092. We wish to thank Drs. Zheng Liu and Benjamin Zimmerman for their help with algorithms used in the data analysis.
Funding:
Support for this work was by National Institutes of Health (NIH) grants: AG019100, AG055378, AG062220 and OD011092.
Abbreviations:
- MRI
magnetic resonance imaging
- AD
Alzheimer’s Disease
- NHP
Non-Human Primate
- ONPRC
Oregon National Primate Research Center
- OVX
Ovariectomy
- PFC
Prefrontal Cortex
- ROI
Region of Interest
Footnotes
Publisher's Disclaimer: This is a PDF file of an unedited manuscript that has been accepted for publication. As a service to our customers we are providing this early version of the manuscript. The manuscript will undergo copyediting, typesetting, and review of the resulting proof before it is published in its final form. Please note that during the production process errors may be discovered which could affect the content, and all legal disclaimers that apply to the journal pertain.
Credit Author Statement:
Steven Dash was responsible for the analysis and writeup of the manuscript. Byung Park provided support for the statistical analysis. Chris Kroenke and Bill Rooney assisted with technical aspects of the MRI study and provided the analysis pipeline. Henryk Urbanski and Steven Kohama were responsible for the research design, training and financial support.
- Donald McLaren (Biogen)
- Sterling Johnson- University Wisconsin
- Douglas Rosene- Boston University
Verification-
This submission has not been published previously, nor is it under consideration for publication elsewhere. If accepted, Neurobiology of Aging will be the sole publisher, as agreed upon by all authors.
Code availability: ANTS suite of tools is publicly available (https://www.nitrc.org/projects/ants)
Ethics approval: This study makes use of archived MRI images from a study approved by ONPRC Institutional Animal Care and Use Committee
Conflicts of interest: The authors declare no conflicts of interest
Availability of data and material:
Contact corresponding author for any data not presented in the supplement
Bibliography
- Abedelahi A, Hasanzadeh H, Hadizadeh H, Joghataie MT, 2013. Morphometric and volumetric study of caudate and putamen nuclei in normal individuals by MRI: Effect of normal aging, gender and hemispheric differences. Pol J Radiol 78(3), 7–14. doi: 10.12659/PJR.889364. Available at: https://www.ncbi.nlm.nih.gov/pubmed/24115954. [DOI] [PMC free article] [PubMed] [Google Scholar]
- Aizawa K, Ageyama N, Yokoyama C, Hisatsune T, 2009. Age-dependent alteration in hippocampal neurogenesis correlates with learning performance of macaque monkeys. Exp Anim 58(4), 403–407. doi: 10.1538/expanim.58.403. Available at: https://www.ncbi.nlm.nih.gov/pubmed/19654438. [DOI] [PubMed] [Google Scholar]
- Alexander GE, Chen K, Aschenbrenner M, Merkley TL, Santerre-Lemmon LE, Shamy JL, Skaggs WE, Buonocore MH, Rapp PR, Barnes CA, 2008. Age-related regional network of magnetic resonance imaging gray matter in the rhesus macaque. J Neurosci 28(11), 2710–2718. doi: 10.1523/JNEUROSCI.1852-07.2008. Available at: https://www.ncbi.nlm.nih.gov/pubmed/18337400. [DOI] [PMC free article] [PubMed] [Google Scholar]
- Allen JS, Damasio H, Grabowski TJ, Bruss J, Zhang W, 2003. Sexual dimorphism and asymmetries in the gray-white composition of the human cerebrum. Neuroimage 18(4), 880–894. doi: 10.1016/s1053-8119(03)00034-x. Available at: https://www.ncbi.nlm.nih.gov/pubmed/12725764. [DOI] [PubMed] [Google Scholar]
- Andersen AH, Zhang Z, Zhang M, Gash DM, Avison MJ, 1999. Age-associated changes in rhesus CNS composition identified by MRI. Brain Res 829(1–2), 90–98. doi: 10.1016/s0006-8993(99)01343-8. Available at: https://www.ncbi.nlm.nih.gov/pubmed/10350533. [DOI] [PubMed] [Google Scholar]
- Avants BB, Yushkevich P, Pluta J, Minkoff D, Korczykowski M, Detre J, Gee JC, 2010. The optimal template effect in hippocampus studies of diseased populations. Neuroimage 49(3), 2457–2466. doi: 10.1016/j.neuroimage.2009.09.062. Available at: https://www.ncbi.nlm.nih.gov/pubmed/19818860. [DOI] [PMC free article] [PubMed] [Google Scholar]
- Badve C, Yu A, Rogers M, Ma D, Liu Y, Schluchter M, Sunshine J, Griswold M, Gulani V, 2015. Simultaneous T1 and T2 Brain Relaxometry in Asymptomatic Volunteers using Magnetic Resonance Fingerprinting. Tomography 1(2), 136–144. doi: 10.18383/j.tom.2015.00166. Available at: https://www.ncbi.nlm.nih.gov/pubmed/26824078. [DOI] [PMC free article] [PubMed] [Google Scholar]
- Bagarinao E, Watanabe H, Maesawa S, Kawabata K, Hara K, Ohdake R, Ogura A, Mori D, Yoneyama N, Imai K, Yokoi T, Kato T, Koyama S, Katsuno M, Wakabayashi T, Kuzuya M, Hoshiyama M, Isoda H, Naganawa S, Ozaki N, Sobue G, 2022. Reserve and Maintenance in the Aging Brain: A Longitudinal Study of Healthy Older Adults. eNeuro 9(1). doi: 10.1523/ENEURO.0455-21.2022. Available at: https://www.ncbi.nlm.nih.gov/pubmed/35045976. [DOI] [PMC free article] [PubMed] [Google Scholar]
- Barber R, McKeith I, Ballard C, O’Brien J, 2002. Volumetric MRI study of the caudate nucleus in patients with dementia with Lewy bodies, Alzheimer’s disease, and vascular dementia. J Neurol Neurosurg Psychiatry 72(3), 406–407. doi: 10.1136/jnnp.72.3.406. Available at: https://www.ncbi.nlm.nih.gov/pubmed/11861709. [DOI] [PMC free article] [PubMed] [Google Scholar]
- Bartzokis G, 2004. Age-related myelin breakdown: a developmental model of cognitive decline and Alzheimer’s disease. Neurobiol Aging 25(1), 5–18; author reply 49–62. doi: 10.1016/j.neurobiolaging.2003.03.001. Available at: https://www.ncbi.nlm.nih.gov/pubmed/14675724. [DOI] [PubMed] [Google Scholar]
- Bergfield KL, Hanson KD, Chen K, Teipel SJ, Hampel H, Rapoport SI, Moeller JR, Alexander GE, 2010. Age-related networks of regional covariance in MRI gray matter: reproducible multivariate patterns in healthy aging. Neuroimage 49(2), 1750–1759. doi: 10.1016/j.neuroimage.2009.09.051. Available at: https://www.ncbi.nlm.nih.gov/pubmed/19796692. [DOI] [PMC free article] [PubMed] [Google Scholar]
- Bush G, Vogt BA, Holmes J, Dale AM, Greve D, Jenike MA, Rosen BR, 2002. Dorsal anterior cingulate cortex: a role in reward-based decision making. Proc Natl Acad Sci U S A 99(1), 523–528. doi: 10.1073/pnas.012470999. Available at: https://www.ncbi.nlm.nih.gov/pubmed/11756669. [DOI] [PMC free article] [PubMed] [Google Scholar]
- Cardenas VA, Chao LL, Studholme C, Yaffe K, Miller BL, Madison C, Buckley ST, Mungas D, Schuff N, Weiner MW, 2011. Brain atrophy associated with baseline and longitudinal measures of cognition. Neurobiol Aging 32(4), 572–580. doi: 10.1016/j.neurobiolaging.2009.04.011. Available at: https://www.ncbi.nlm.nih.gov/pubmed/19446370. [DOI] [PMC free article] [PubMed] [Google Scholar]
- Chen X, Sachdev PS, Wen W, Anstey KJ, 2007. Sex differences in regional gray matter in healthy individuals aged 44–48 years: a voxel-based morphometric study. Neuroimage 36(3), 691–699. doi: 10.1016/j.neuroimage.2007.03.063. Available at: https://www.ncbi.nlm.nih.gov/pubmed/17499524. [DOI] [PubMed] [Google Scholar]
- Chen X, Errangi B, Li L, Glasser MF, Westlye LT, Fjell AM, Walhovd KB, Hu X, Herndon JG, Preuss TM, Rilling JK, 2013. Brain aging in humans, chimpanzees (Pan troglodytes), and rhesus macaques (Macaca mulatta): magnetic resonance imaging studies of macro- and microstructural changes. Neurobiol Aging 34(10), 2248–2260. doi: 10.1016/j.neurobiolaging.2013.03.028. Available at: https://www.ncbi.nlm.nih.gov/pubmed/23623601. [DOI] [PMC free article] [PubMed] [Google Scholar]
- Chiou KL, Montague MJ, Goldman EA, Watowich MM, Sams SN, Song J, Horvath JE, Sterner KN, Ruiz-Lambides AV, Martínez MI, Higham JP, Brent LJN, Platt ML, Snyder-Mackler N, 2020. Rhesus macaques as a tractable physiological model of human ageing: Rhesus macaque model of human ageing. 375. doi:https://asu.pure.elsevier.com/en/publications/rhesus-macaques-as-a-tractable-physiological-model-of-human-agein. Available at. [DOI] [PMC free article] [PubMed] [Google Scholar]
- Cho H, Kim JH, Kim C, Ye BS, Kim HJ, Yoon CW, Noh Y, Kim GH, Kim YJ, Kim JH, Kim CH, Kang SJ, Chin J, Kim ST, Lee KH, Na DL, Seong JK, Seo SW, 2014. Shape changes of the basal ganglia and thalamus in Alzheimer’s disease: a three-year longitudinal study. J Alzheimers Dis 40(2), 285–295. doi: 10.3233/JAD-132072. Available at: https://www.ncbi.nlm.nih.gov/pubmed/24413620. [DOI] [PubMed] [Google Scholar]
- Cho S, Jones D, Reddick WE, Ogg RJ, Steen RG, 1997. Establishing norms for age-related changes in proton T1 of human brain tissue in vivo. Magn Reson Imaging 15(10), 1133–1143. doi: 10.1016/s0730-725x(97)00202-6. Available at: https://www.ncbi.nlm.nih.gov/pubmed/9408134. [DOI] [PubMed] [Google Scholar]
- Coffey CE, Wilkinson WE, Parashos IA, Soady SA, Sullivan RJ, Patterson LJ, Figiel GS, Webb MC, Spritzer CE, Djang WT, 1992. Quantitative cerebral anatomy of the aging human brain: a cross-sectional study using magnetic resonance imaging. Neurology 42(3 Pt 1), 527–536. doi: 10.1212/wnl.42.3.527. Available at: https://www.ncbi.nlm.nih.gov/pubmed/1549213. [DOI] [PubMed] [Google Scholar]
- Cowell PE, Turetsky BI, Gur RC, Grossman RI, Shtasel DL, Gur RE, 1994. Sex differences in aging of the human frontal and temporal lobes. J Neurosci 14(8), 4748–4755, https://www.ncbi.nlm.nih.gov/pubmed/8046448. [DOI] [PMC free article] [PubMed] [Google Scholar]
- Crivello F, Tzourio-Mazoyer N, Tzourio C, Mazoyer B, 2014. Longitudinal assessment of global and regional rate of grey matter atrophy in 1,172 healthy older adults: modulation by sex and age. PLoS One 9(12), e114478. doi: 10.1371/journal.pone.0114478. Available at: https://www.ncbi.nlm.nih.gov/pubmed/25469789. [DOI] [PMC free article] [PubMed] [Google Scholar]
- Didier ES, MacLean AG, Mohan M, Didier PJ, Lackner AA, Kuroda MJ, 2016. Contributions of Nonhuman Primates to Research on Aging. Vet Pathol 53(2), 277–290. doi: 10.1177/0300985815622974. Available at: https://www.ncbi.nlm.nih.gov/pubmed/26869153. [DOI] [PMC free article] [PubMed] [Google Scholar]
- Duan H, Wearne SL, Rocher AB, Macedo A, Morrison JH, Hof PR, 2003. Age-related dendritic and spine changes in corticocortically projecting neurons in macaque monkeys. Cereb Cortex 13(9), 950–961. doi: 10.1093/cercor/13.9.950. Available at: https://www.ncbi.nlm.nih.gov/pubmed/12902394. [DOI] [PubMed] [Google Scholar]
- Fama R, Sullivan EV, 2015. Thalamic structures and associated cognitive functions: Relations with age and aging. Neurosci Biobehav Rev 54, 29–37. doi: 10.1016/j.neubiorev.2015.03.008. Available at: https://www.ncbi.nlm.nih.gov/pubmed/25862940. [DOI] [PMC free article] [PubMed] [Google Scholar]
- Filipek PA, Richelme C, Kennedy DN, Caviness VS Jr., 1994. The young adult human brain: an MRI-based morphometric analysis. Cereb Cortex 4(4), 344–360. doi: 10.1093/cercor/4.4.344. Available at: https://www.ncbi.nlm.nih.gov/pubmed/7950308. [DOI] [PubMed] [Google Scholar]
- Fjell AM, Walhovd KB, Fennema-Notestine C, McEvoy LK, Hagler DJ, Holland D, Brewer JB, Dale AM, 2009. One-year brain atrophy evident in healthy aging. J Neurosci 29(48), 15223–15231. doi: 10.1523/JNEUROSCI.3252-09.2009. Available at: https://www.ncbi.nlm.nih.gov/pubmed/19955375. [DOI] [PMC free article] [PubMed] [Google Scholar]
- Fotenos AF, Snyder AZ, Girton LE, Morris JC, Buckner RL, 2005. Normative estimates of cross-sectional and longitudinal brain volume decline in aging and AD. Neurology 64(6), 1032–1039. doi: 10.1212/01.WNL.0000154530.72969.11. Available at: https://www.ncbi.nlm.nih.gov/pubmed/15781822. [DOI] [PubMed] [Google Scholar]
- Gazzaley AH, Thakker MM, Hof PR, Morrison JH, 1997. Preserved number of entorhinal cortex layer II neurons in aged macaque monkeys. Neurobiol Aging 18(5), 549–553. doi: 10.1016/s0197-4580(97)00112-7. Available at: https://www.ncbi.nlm.nih.gov/pubmed/9390783. [DOI] [PubMed] [Google Scholar]
- Goldstein JM, Seidman LJ, Horton NJ, Makris N, Kennedy DN, Caviness VS Jr., Faraone SV, Tsuang MT, 2001. Normal sexual dimorphism of the adult human brain assessed by in vivo magnetic resonance imaging. Cereb Cortex 11(6), 490–497. doi: 10.1093/cercor/11.6.490. Available at: https://www.ncbi.nlm.nih.gov/pubmed/11375910. [DOI] [PubMed] [Google Scholar]
- Gould E, Reeves AJ, Fallah M, Tanapat P, Gross CG, Fuchs E, 1999. Hippocampal neurogenesis in adult Old World primates. Proc Natl Acad Sci U S A 96(9), 5263–5267. doi: 10.1073/pnas.96.9.5263. Available at: https://www.ncbi.nlm.nih.gov/pubmed/10220454. [DOI] [PMC free article] [PubMed] [Google Scholar]
- Grydeland H, Walhovd KB, Tamnes CK, Westlye LT, Fjell AM, 2013. Intracortical myelin links with performance variability across the human lifespan: results from T1- and T2-weighted MRI myelin mapping and diffusion tensor imaging. J Neurosci 33(47), 18618–18630. doi: 10.1523/JNEUROSCI.2811-13.2013. Available at: https://www.ncbi.nlm.nih.gov/pubmed/24259583. [DOI] [PMC free article] [PubMed] [Google Scholar]
- Gur RC, Turetsky BI, Matsui M, Yan M, Bilker W, Hughett P, Gur RE, 1999. Sex differences in brain gray and white matter in healthy young adults: correlations with cognitive performance. J Neurosci 19(10), 4065–4072, https://www.ncbi.nlm.nih.gov/pubmed/10234034. Available at: https://www.ncbi.nlm.nih.gov/pubmed/10234034. [DOI] [PMC free article] [PubMed] [Google Scholar]
- Gur RC, Gunning-Dixon F, Bilker WB, Gur RE, 2002. Sex differences in temporo-limbic and frontal brain volumes of healthy adults. Cereb Cortex 12(9), 998–1003. doi: 10.1093/cercor/12.9.998. Available at: https://www.ncbi.nlm.nih.gov/pubmed/12183399. [DOI] [PubMed] [Google Scholar]
- Hagiwara A, Fujimoto K, Kamagata K, Murata S, Irie R, Kaga H, Someya Y, Andica C, Fujita S, Kato S, Fukunaga I, Wada A, Hori M, Tamura Y, Kawamori R, Watada H, Aoki S, 2021. Age-Related Changes in Relaxation Times, Proton Density, Myelin, and Tissue Volumes in Adult Brain Analyzed by 2-Dimensional Quantitative Synthetic Magnetic Resonance Imaging. Invest Radiol 56(3), 163–172. doi: 10.1097/RLI.0000000000000720. Available at: https://www.ncbi.nlm.nih.gov/pubmed/32858581. [DOI] [PMC free article] [PubMed] [Google Scholar]
- Hara Y, Rapp PR, Morrison JH, 2012. Neuronal and morphological bases of cognitive decline in aged rhesus monkeys. Age (Dordr) 34(5), 1051–1073. doi: 10.1007/s11357-011-9278-5. Available at: https://www.ncbi.nlm.nih.gov/pubmed/21710198. [DOI] [PMC free article] [PubMed] [Google Scholar]
- Hara Y, Yuk F, Puri R, Janssen WG, Rapp PR, Morrison JH, 2014. Presynaptic mitochondrial morphology in monkey prefrontal cortex correlates with working memory and is improved with estrogen treatment. Proc Natl Acad Sci U S A 111(1), 486–491. doi: 10.1073/pnas.1311310110. Available at: https://www.ncbi.nlm.nih.gov/pubmed/24297907. [DOI] [PMC free article] [PubMed] [Google Scholar]
- Hughes EJ, Bond J, Svrckova P, Makropoulos A, Ball G, Sharp DJ, Edwards AD, Hajnal JV, Counsell SJ, 2012. Regional changes in thalamic shape and volume with increasing age. Neuroimage 63(3), 1134–1142. doi: 10.1016/j.neuroimage.2012.07.043. Available at: https://www.ncbi.nlm.nih.gov/pubmed/22846656. [DOI] [PMC free article] [PubMed] [Google Scholar]
- Ingram DK, Chefer S, Matochik J, Moscrip TD, Weed J, Roth GS, London ED, Lane MA, 2001. Aging and caloric restriction in nonhuman primates: behavioral and in vivo brain imaging studies. Ann N Y Acad Sci 928, 316–326. doi: 10.1111/j.1749-6632.2001.tb05661.x. Available at: https://www.ncbi.nlm.nih.gov/pubmed/11795523. [DOI] [PubMed] [Google Scholar]
- Jiji S, Smitha KA, Gupta AK, Pillai VP, Jayasree RS, 2013. Segmentation and volumetric analysis of the caudate nucleus in Alzheimer’s disease. Eur J Radiol 82(9), 1525–1530. doi: 10.1016/j.ejrad.2013.03.012. Available at: https://www.ncbi.nlm.nih.gov/pubmed/23664648. [DOI] [PubMed] [Google Scholar]
- Keuker JI, Luiten PG, Fuchs E, 2003. Preservation of hippocampal neuron numbers in aged rhesus monkeys. Neurobiol Aging 24(1), 157–165. doi: 10.1016/s0197-4580(02)00062-3. Available at: https://www.ncbi.nlm.nih.gov/pubmed/12493561. [DOI] [PubMed] [Google Scholar]
- Killiany RJ, Gomez-Isla T, Moss M, Kikinis R, Sandor T, Jolesz F, Tanzi R, Jones K, Hyman BT, Albert MS, 2000. Use of structural magnetic resonance imaging to predict who will get Alzheimer’s disease. Annals of Neurology 47(4), 430–439. doi:. Available at: https://asu.pure.elsevier.com/en/publications/rhesus-macaques-as-a-tractable-physiological-model-of-human-agein. [DOI] [PubMed] [Google Scholar]
- Kramer JH, Mungas D, Reed BR, Wetzel ME, Burnett MM, Miller BL, Weiner MW, Chui HC, 2007. Longitudinal MRI and cognitive change in healthy elderly. Neuropsychology 21(4), 412–418. doi: 10.1037/0894-4105.21.4.412. Available at: https://www.ncbi.nlm.nih.gov/pubmed/17605574. [DOI] [PMC free article] [PubMed] [Google Scholar]
- Kroenke CD, Rohlfing T, Park B, Sullivan EV, Pfefferbaum A, Grant KA, 2014. Monkeys that voluntarily and chronically drink alcohol damage their brains: a longitudinal MRI study. Neuropsychopharmacology 39(4), 823–830. doi: 10.1038/npp.2013.259. Available at: https://www.ncbi.nlm.nih.gov/pubmed/24077067. [DOI] [PMC free article] [PubMed] [Google Scholar]
- Lacreuse A, Diehl MM, Goh MY, Hall MJ, Volk AM, Chhabra RK, Herndon JG, 2005. Sex differences in age-related motor slowing in the rhesus monkey: behavioral and neuroimaging data. Neurobiol Aging 26(4), 543–551. doi: 10.1016/j.neurobiolaging.2004.05.007. Available at: https://www.ncbi.nlm.nih.gov/pubmed/15653182. [DOI] [PubMed] [Google Scholar]
- Lindenberger U, 2014. Human cognitive aging: corriger la fortune? Science 346(6209), 572–578. doi: 10.1126/science.1254403. Available at: https://www.ncbi.nlm.nih.gov/pubmed/25359964. [DOI] [PubMed] [Google Scholar]
- Liu Z, Neuringer M, Erdman JW Jr., Kuchan MJ, Renner L, Johnson EE, Wang X, Kroenke CD, 2019. The effects of breastfeeding versus formula-feeding on cerebral cortex maturation in infant rhesus macaques. Neuroimage 184, 372–385. doi: 10.1016/j.neuroimage.2018.09.015. Available at: https://www.ncbi.nlm.nih.gov/pubmed/30201462. [DOI] [PMC free article] [PubMed] [Google Scholar]
- Lyons DM, Yang C, Eliez S, Reiss AL, Schatzberg AF, 2004. Cognitive correlates of white matter growth and stress hormones in female squirrel monkey adults. J Neurosci 24(14), 3655–3662. doi: 10.1523/JNEUROSCI.0324-04.2004. Available at: https://www.ncbi.nlm.nih.gov/pubmed/15071114. [DOI] [PMC free article] [PubMed] [Google Scholar]
- MacDonald AW 3rd, Cohen JD, Stenger VA, Carter CS, 2000. Dissociating the role of the dorsolateral prefrontal and anterior cingulate cortex in cognitive control. Science 288(5472), 1835–1838. doi: 10.1126/science.288.5472.1835. Available at: https://www.ncbi.nlm.nih.gov/pubmed/10846167. [DOI] [PubMed] [Google Scholar]
- Matochik JA, Chefer SI, Lane MA, Woolf RI, Morris ED, Ingram DK, Roth GS, London ED, 2000. Age-related decline in striatal volume in monkeys as measured by magnetic resonance imaging. Neurobiology of Aging 21(4), 591–598. doi: 10.1016/s0197-4580(00)00134-2. Available at. [DOI] [PubMed] [Google Scholar]
- Matochik JA, Chefer SI, Lane MA, Roth GS, Mattison JA, London ED, Ingram DK, 2004. Age-related decline in striatal volume in rhesus monkeys: assessment of long-term calorie restriction. Neurobiol Aging 25(2), 193–200. doi: 10.1016/s0197-4580(03)00092-7. Available at: https://www.ncbi.nlm.nih.gov/pubmed/14749137. [DOI] [PubMed] [Google Scholar]
- Merrill DA, Roberts JA, Tuszynski MH, 2000. Conservation of neuron number and size in entorhinal cortex layers II, III, and V/VI of aged primates. J Comp Neurol 422(3), 396–401. doi:. Available at: https://www.ncbi.nlm.nih.gov/pubmed/10861515. [DOI] [PubMed] [Google Scholar]
- Moore TL, Killiany RJ, Herndon JG, Rosene DL, Moss MB, 2006. Executive system dysfunction occurs as early as middle-age in the rhesus monkey. Neurobiol Aging 27(10), 1484–1493. doi: 10.1016/j.neurobiolaging.2005.08.004. Available at: https://www.ncbi.nlm.nih.gov/pubmed/16183172. [DOI] [PubMed] [Google Scholar]
- Mosconi L, Berti V, Dyke J, Schelbaum E, Jett S, Loughlin L, Jang G, Rahman A, Hristov H, Pahlajani S, Andrews R, Matthews D, Etingin O, Ganzer C, de Leon M, Isaacson R, Brinton RD, 2021. Menopause impacts human brain structure, connectivity, energy metabolism, and amyloid-beta deposition. Sci Rep 11(1), 10867. doi: 10.1038/s41598-021-90084-y. Available at: https://www.ncbi.nlm.nih.gov/pubmed/34108509. [DOI] [PMC free article] [PubMed] [Google Scholar]
- Mugler JP 3rd, Brookeman JR, 1990. Three-dimensional magnetization-prepared rapid gradient-echo imaging (3D MP RAGE). Magn Reson Med 15(1), 152–157. doi: 10.1002/mrm.1910150117. Available at: https://www.ncbi.nlm.nih.gov/pubmed/2374495. [DOI] [PubMed] [Google Scholar]
- Mungas D, Harvey D, Reed BR, Jagust WJ, DeCarli C, Beckett L, Mack WJ, Kramer JH, Weiner MW, Schuff N, Chui HC, 2005. Longitudinal volumetric MRI change and rate of cognitive decline. Neurology 65(4), 565–571. doi: 10.1212/01.wnl.0000172913.88973.0d. Available at: https://www.ncbi.nlm.nih.gov/pubmed/16116117. [DOI] [PMC free article] [PubMed] [Google Scholar]
- Murphy DG, DeCarli C, McIntosh AR, Daly E, Mentis MJ, Pietrini P, Szczepanik J, Schapiro MB, Grady CL, Horwitz B, Rapoport SI, 1996. Sex differences in human brain morphometry and metabolism: an in vivo quantitative magnetic resonance imaging and positron emission tomography study on the effect of aging. Arch Gen Psychiatry 53(7), 585–594. doi: 10.1001/archpsyc.1996.01830070031007. Available at: https://www.ncbi.nlm.nih.gov/pubmed/8660125. [DOI] [PubMed] [Google Scholar]
- Nyberg L, Salami A, Andersson M, Eriksson J, Kalpouzos G, Kauppi K, Lind J, Pudas S, Persson J, Nilsson LG, 2010. Longitudinal evidence for diminished frontal cortex function in aging. Proc Natl Acad Sci U S A 107(52), 22682–22686. doi: 10.1073/pnas.1012651108. Available at: https://www.ncbi.nlm.nih.gov/pubmed/21156826. [DOI] [PMC free article] [PubMed] [Google Scholar]
- O’Donnell KA, Rapp PR, Hof PR, 1999. Preservation of prefrontal cortical volume in behaviorally characterized aged macaque monkeys. Exp Neurol 160(1), 300–310. doi: 10.1006/exnr.1999.7192. Available at: https://www.ncbi.nlm.nih.gov/pubmed/10630214. [DOI] [PubMed] [Google Scholar]
- Ownby RL, 2010. Neuroinflammation and cognitive aging. Curr Psychiatry Rep 12(1), 39–45. doi: 10.1007/s11920-009-0082-1. Available at: https://www.ncbi.nlm.nih.gov/pubmed/20425309. [DOI] [PubMed] [Google Scholar]
- Peters A, Sethares C, 2002. Aging and the myelinated fibers in prefrontal cortex and corpus callosum of the monkey. J Comp Neurol 442(3), 277–291. doi: 10.1002/cne.10099. Available at: https://www.ncbi.nlm.nih.gov/pubmed/11774342. [DOI] [PubMed] [Google Scholar]
- Peters A, Sethares C, Luebke JI, 2008. Synapses are lost during aging in the primate prefrontal cortex. Neuroscience 152(4), 970–981. doi: 10.1016/j.neuroscience.2007.07.014. Available at: https://www.ncbi.nlm.nih.gov/pubmed/18329176. [DOI] [PMC free article] [PubMed] [Google Scholar]
- Pfefferbaum A, Sullivan EV, 2015. Cross-sectional versus longitudinal estimates of age-related changes in the adult brain: overlaps and discrepancies. Neurobiol Aging 36(9), 2563–2567. doi: 10.1016/j.neurobiolaging.2015.05.005. Available at: https://www.ncbi.nlm.nih.gov/pubmed/26059713. [DOI] [PMC free article] [PubMed] [Google Scholar]
- Pini L, Pievani M, Bocchetta M, Altomare D, Bosco P, Cavedo E, Galluzzi S, Marizzoni M, Frisoni GB, 2016. Brain atrophy in Alzheimer’s Disease and aging. Ageing Res Rev 30, 25–48. doi: 10.1016/j.arr.2016.01.002. Available at: https://www.ncbi.nlm.nih.gov/pubmed/26827786. [DOI] [PubMed] [Google Scholar]
- Raz N, Lindenberger U, Rodrigue KM, Kennedy KM, Head D, Williamson A, Dahle C, Gerstorf D, Acker JD, 2005. Regional brain changes in aging healthy adults: general trends, individual differences and modifiers. Cereb Cortex 15(11), 1676–1689. doi: 10.1093/cercor/bhi044. Available at: https://www.ncbi.nlm.nih.gov/pubmed/15703252. [DOI] [PubMed] [Google Scholar]
- Raz N, Ghisletta P, Rodrigue KM, Kennedy KM, Lindenberger U, 2010. Trajectories of brain aging in middle-aged and older adults: regional and individual differences. Neuroimage 51(2), 501–511. doi: 10.1016/j.neuroimage.2010.03.020. Available at: https://www.ncbi.nlm.nih.gov/pubmed/20298790. [DOI] [PMC free article] [PubMed] [Google Scholar]
- Rogers J, Kochunov P, Zilles K, Shelledy W, Lancaster J, Thompson P, Duggirala R, Blangero J, Fox PT, Glahn DC, 2010. On the genetic architecture of cortical folding and brain volume in primates. Neuroimage 53(3), 1103–1108. doi: 10.1016/j.neuroimage.2010.02.020. Available at: https://www.ncbi.nlm.nih.gov/pubmed/20176115. [DOI] [PMC free article] [PubMed] [Google Scholar]
- Rohlfing T, Kroenke CD, Sullivan EV, Dubach MF, Bowden DM, Grant KA, Pfefferbaum A, 2012. The INIA19 Template and NeuroMaps Atlas for Primate Brain Image Parcellation and Spatial Normalization. Front Neuroinform 6(NOV), 27. doi: 10.3389/fninf.2012.00027. Available at: https://www.ncbi.nlm.nih.gov/pubmed/23230398. [DOI] [PMC free article] [PubMed] [Google Scholar]
- Ross DE, Seabaugh JD, Seabaugh JM, Alvarez C, Ellis LP, Powell C, Hall C, Reese C, Cooper L, Ochs AL, 2020. Patients with chronic mild or moderate traumatic brain injury have abnormal brain enlargement. Brain Inj 34(1), 11–19. doi: 10.1080/02699052.2019.1669074. Available at: https://www.ncbi.nlm.nih.gov/pubmed/31553632. [DOI] [PubMed] [Google Scholar]
- Salat DH, Buckner RL, Snyder AZ, Greve DN, Desikan RS, Busa E, Morris JC, Dale AM, Fischl B, 2004. Thinning of the cerebral cortex in aging. Cereb Cortex 14(7), 721–730. doi: 10.1093/cercor/bhh032. Available at: https://www.ncbi.nlm.nih.gov/pubmed/15054051. [DOI] [PubMed] [Google Scholar]
- Shamy JL, Buonocore MH, Makaron LM, Amaral DG, Barnes CA, Rapp PR, 2006. Hippocampal volume is preserved and fails to predict recognition memory impairment in aged rhesus monkeys (Macaca mulatta). Neurobiol Aging 27(10), 1405–1415. doi: 10.1016/j.neurobiolaging.2005.07.019. Available at: https://www.ncbi.nlm.nih.gov/pubmed/16183171. [DOI] [PubMed] [Google Scholar]
- Shamy JL, Habeck C, Hof PR, Amaral DG, Fong SG, Buonocore MH, Stern Y, Barnes CA, Rapp PR, 2011. Volumetric correlates of spatiotemporal working and recognition memory impairment in aged rhesus monkeys. Cereb Cortex 21(7), 1559–1573. doi: 10.1093/cercor/bhq210. Available at: https://www.ncbi.nlm.nih.gov/pubmed/21127015. [DOI] [PMC free article] [PubMed] [Google Scholar]
- Sridharan A, Willette AA, Bendlin BB, Alexander AL, Coe CL, Voytko ML, Colman RJ, Kemnitz JW, Weindruch RH, Johnson SC, 2012. Brain volumetric and microstructural correlates of executive and motor performance in aged rhesus monkeys. Front Aging Neurosci 4(OCT), 31. doi: 10.3389/fnagi.2012.00031. Available at: https://www.ncbi.nlm.nih.gov/pubmed/23162464. [DOI] [PMC free article] [PubMed] [Google Scholar]
- Sridharan A, Pehar M, Salamat MS, Pugh TD, Bendlin BB, Willette AA, Anderson RM, Kemnitz JW, Colman RJ, Weindruch RH, Puglielli L, Johnson SC, 2013. Calorie restriction attenuates astrogliosis but not amyloid plaque load in aged rhesus macaques: a preliminary quantitative imaging study. Brain Res 1508, 1–8. doi: 10.1016/j.brainres.2013.02.046. Available at: https://www.ncbi.nlm.nih.gov/pubmed/23473840. [DOI] [PMC free article] [PubMed] [Google Scholar]
- Steen RG, Gronemeyer SA, Taylor JS, 1995. Age-related changes in proton T1 values of normal human brain. J Magn Reson Imaging 5(1), 43–48. doi: 10.1002/jmri.1880050111. Available at: https://www.ncbi.nlm.nih.gov/pubmed/7696808. [DOI] [PubMed] [Google Scholar]
- Stonebarger GA, Urbanski HF, Woltjer RL, Vaughan KL, Ingram DK, Schultz PL, Calderazzo SM, Siedeman JA, Mattison JA, Rosene DL, Kohama SG, 2020. Amyloidosis increase is not attenuated by long-term calorie restriction or related to neuron density in the prefrontal cortex of extremely aged rhesus macaques. Geroscience 42(6), 1733–1749. doi: 10.1007/s11357-020-00259-0. Available at: https://www.ncbi.nlm.nih.gov/pubmed/32876855. [DOI] [PMC free article] [PubMed] [Google Scholar]
- Taki Y, Thyreau B, Kinomura S, Sato K, Goto R, Wu K, Kawashima R, Fukuda H, 2013. A longitudinal study of the relationship between personality traits and the annual rate of volume changes in regional gray matter in healthy adults. Hum Brain Mapp 34(12), 3347–3353. doi: 10.1002/hbm.22145. Available at: https://www.ncbi.nlm.nih.gov/pubmed/22807062. [DOI] [PMC free article] [PubMed] [Google Scholar]
- Tondelli M, Wilcock GK, Nichelli P, De Jager CA, Jenkinson M, Zamboni G, 2012. Structural MRI changes detectable up to ten years before clinical Alzheimer’s disease. Neurobiol Aging 33(4), 825 e825–836. doi: 10.1016/j.neurobiolaging.2011.05.018. Available at: https://www.ncbi.nlm.nih.gov/pubmed/21782287. [DOI] [PubMed] [Google Scholar]
- Vanveen V, Carter C, 2002. The anterior cingulate as a conflict monitor: fMRI and ERP studies. Physiology & Behavior 77(4–5), 477–482. doi: 10.1016/s0031-9384(02)00930-7. Available at. [DOI] [PubMed] [Google Scholar]
- Wang M, Gamo NJ, Yang Y, Jin LE, Wang XJ, Laubach M, Mazer JA, Lee D, Arnsten AF, 2011. Neuronal basis of age-related working memory decline. Nature 476(7359), 210–213. doi: 10.1038/nature10243. Available at: https://www.ncbi.nlm.nih.gov/pubmed/21796118. [DOI] [PMC free article] [PubMed] [Google Scholar]
- Wisco JJ, Killiany RJ, Guttmann CR, Warfield SK, Moss MB, Rosene DL, 2008. An MRI study of age-related white and gray matter volume changes in the rhesus monkey. Neurobiol Aging 29(10), 1563–1575. doi: 10.1016/j.neurobiolaging.2007.03.022. Available at: https://www.ncbi.nlm.nih.gov/pubmed/17459528. [DOI] [PMC free article] [PubMed] [Google Scholar]
- Wu J, Peng S, Zhang Y, Pan B, Chen H, Hu X, Gong NJ, 2022. Developmental trajectory of magnetic susceptibility in the healthy rhesus macaque brain. NMR Biomed 35(9), e4750. doi: 10.1002/nbm.4750. Available at: https://www.ncbi.nlm.nih.gov/pubmed/35474524. [DOI] [PubMed] [Google Scholar]
- Yeatman JD, Wandell BA, Mezer AA, 2014. Lifespan maturation and degeneration of human brain white matter. Nat Commun 5, 4932. doi: 10.1038/ncomms5932. Available at: https://www.ncbi.nlm.nih.gov/pubmed/25230200. [DOI] [PMC free article] [PubMed] [Google Scholar]
- Young ME, Ohm DT, Dumitriu D, Rapp PR, Morrison JH, 2014. Differential effects of aging on dendritic spines in visual cortex and prefrontal cortex of the rhesus monkey. Neuroscience 274, 33–43. doi: 10.1016/j.neuroscience.2014.05.008. Available at: https://www.ncbi.nlm.nih.gov/pubmed/24853052. [DOI] [PMC free article] [PubMed] [Google Scholar]
Associated Data
This section collects any data citations, data availability statements, or supplementary materials included in this article.
Supplementary Materials
Data Availability Statement
Contact corresponding author for any data not presented in the supplement