

Abstract
The coronavirus disease or COVID-19 pandemic continues imposing restrictions on the human population from full-scale normal/routine activities all over the world. This study primarily spotlights the consequences of the COVID-19-pandemic-lockdown on physicochemical parameters of water (samples) of the Karamana river system (KRS) during the pre-monsoons (or January) of 2021 and 2022, using the Weighted Arithmetic Index method and Geostatistical analysis (ArcMap 10.2). Even though the Karamana river supported the water needs of the people during the past several decades, the quality of water deteriorated due to the rising population and consequent anthropogenic activities. Hence, it is imperative to evaluate the water quality during the post-COVID-19 lockdowns and document the spatial distribution of parameters listed in the BIS (Bureau of Indian standard) IS10500, 2012. This was accomplished by establishing a water quality index (WQI), Geostatistical analysis, and weighted overlay analysis (WOA). The estimated WQI suggested that about 45.11km2 (6.43%) area has declined from the excellent category of water quality between 2021 and 2022. Similarly, WOA results deciphered that the area under the poor category has drastically and negatively changed from 27.85 km2 (4.0%) to 60.42 km2 (8.6%) after revoking of lockdown restrictions. The lessons learned from syn-Covid-19, the spike or uptrend of the water quality compared to the past decades, offer ample scientific basis to policymakers, administrators, and environmentalists for restoration of river system health from huge anthropogenic stress.
Keywords: Water quality index, Geostatistical analysis, Weighted arithmetic index, Surface water, Geochemistry, Karamana River Basin, COVID-19
1. Introduction
Right from the days of ancient civilization, rivers cradled human settlements, and domesticated animal life, navigation, energy, and technology. Surprisingly, this human–water bonding continues far more vigorously and expansively in the 21st century also, as the river (or surface) water is an immersive source of water security for domestic, irrigation, industrial, and recreation sectors of society. Along its entire route, a river is a fundamental resource not only for human life but also for scores of other fauna and flora. Every river is crucial to the equilibrium of the environment and biodiversity. That is why rivers must be considered the most precious natural resource and an essential contributor to secure human existence. Nowadays the misuse of rivers including their water resources and their susceptibility to contamination has affected the loss of their natural environments throughout the globe (Kumar et al., 2019). Evaluations by the ‘Lancet Commission’ on Pollution and Health, indicate that annually 1.8 million deaths worldwide are related to ‘water’ (mainly microbiological contamination) and 0.5 million deaths to soil pollution, heavy metals, and chemicals, i.e., chemical pollution (Landrigan et al., 2017, Boelee et al., 2019). This happens due to poor wastewater management as well as the complex anthropogenic aspects such as urban growth and development, agronomic practices, and manufacturing (Akimoto, 2003, Karunanidhi et al., 2020, Masood et al., 2016, Ogwueleka, 2015, Volkamer et al., 2006). UNEP (2016) reported that human health and productive activities are severely stressed as a result of point and non-point farm discharge carrying large quantities of agrochemical residues, forever chemicals, organic matter, drug residues, sediments, and saline drainage into water bodies, i.e., into the aquatic ecosystems. Furthermore, the steep rise in water demand/use by citizens is one of the major issues driving water scarcity in many countries, including India (Prasood et al., 2021).
Such scenarios prevailing in developing and underdeveloped countries are chiefly attributable to population explosion. For example, India has 16% of the world’s population but only 4% of the world’s freshwater resources. With the changing weather patterns and recurrent droughts, India is water-stressed (Nathan, 2021). Leahy (2018) noted that 1.1 billion people worldwide lack access to water and a total of 2.7 billion face water scarcity for at least one month annually and nearly half of this number live in India and China. India, with an annual average precipitation of 1170 mm, has an annual water yield of 4000 km3 (Shaji et al., 2021). In a press release, the India Council for Agricultural Research (ICAR, 2019) cautioned that by 2025 India’s annual per capita water availability will touch a new low of 1465 m3 (i.e., a water-stressed state) from 5177 m3in 1951. Further decline in annual per capita to <1000 m3 will make India a water-scarce nation. Population rise is one of the tangible drivers for the decline in annual per capita water availability (Prasood et al., 2021).
Chakraborty et al., (2021) proposed that despite the COVID-19 disruption of routine activities across multiple sectors globally, the former positively impacted water resources, especially in respect of river water quality. Several studies documented and vouched for the role of anthropogenic activities as one of the key drivers of pollution in all facets of the environment (Akimoto, 2003, Karunanidhi et al., 2020, Ogwueleka, 2015, Masood et al., 2016, Schlacher et al., 2016, Volkamer et al., 2006). In a report, Dutta et al., (2020) proposed that the water quality of River Ganga did improve during the COVID-19 lockdown due to the shutdown of major industries and the decline of agricultural activities in the Ganga basin. Similarly, the Krishna and Cauvery rivers and their tributaries have also regained their decades-old poor status in respect of water quality (KSPCB, 2020). This prompted us to launch a study of a tropical river, the Karamana R., in the southwestern seaboard of India hosting the capital city of Thiruvananthapuram in the state of Kerala, India, which is on a fast track of urbanization through the past four decades (Sajinkumar et al., 2017). Hopefully, the outcome of this research will shine new light on the water quality in Karamana R., basin (KRB), especially against the backdrop of COVID-19 disruptions.
COVID-19 has hugely impacted practically every facet of human activity, including the quality of water in the nation states globally (Aman et al., 2020, Arif et al., 2020, DTE, 2020, Dutta et al., 2020, Karunanidhi et al., 2021, Khan et al., 2021, Mukherjee et al., 2020, Shukla et al., 2021, Singhal and Matto, 2020, Yunus et al., 2020). Furthermore, the COVID-19 lockdown has minimized water pollution in countries such as Malaysia, Indonesia, Thailand, Bangladesh, and Maldives (Kundu, 2020). Similarly, Venice’s canals and the Yamuna river in Delhi (India) are now significantly clearer compared to the recent past (Paital, 2020, Saadat et al., 2020). However, the extent and quantum of the revival are still unknown and are just being speculated (Aravinthasamy et al., 2021). As billions of people have been vaccinated against COVID-19, global social and economic activities are gradually returning to normalcy. Nevertheless, the lockdowns due to such pandemics should not be construed as a long-term measure to control environmental pollution (Mousazadeh et al., 2021). Then again, many researchers argued that these short-term positive impacts of COVID-19 should form the basis for future design, development, and implementation of pragmatic policies to protect the human environment (Allegrante et al., 2020, Chang et al., 2020, Espejo et al., 2020, Raoofi et al., 2020).
Even though several publications spotlighting one or other aspect of KRB exist, viz., urbanization, morphometric analysis, and water quality (Ajayakrishnan et al., 2014, Arulbalaji et al., 2020, Balan et al., 2020, Jayaraman et al., 2003, Kedareswarudu et al., 2013, Sreeja et al., 2018, Sujitha et al., 2012, Sukanya and Joseph, 2020), the impact of COVID-19 lockdown on the water quality status in KRB has not been addressed yet. So, this study is very appropriately timed and positioned now, as humanity is more dependent on such limited or dwindling resources like surface water on the one hand (Thrivikramji, 1989) and further, it will portray a reliable picture of the water quality changes of KRB vis-à-vis the COVID-19 lockdown. This study primarily spotlights the consequences of the COVID-19-pandemic-lockdown on physicochemical parameters of water (samples) of the Karamana river system (KRS) during the pre-monsoons (or January) of 2021 and 2022, using the Weighted Arithmetic Index method and Geostatistical analysis (ArcMap 10.2).
2. Study Area
In KRB, (North Latitudes 8°21′ 49.89″ to 8°41′43.51″ and East Longitudes 76° 51′ 11.23″ to 77° 14′ 5.97″), a 6th order basin(area=702 km2; trunk stream length=68.0 km), the trunk stream originates from Chemmunji mottai (elevation=1717.0 m. amsl; N. Lat. 8°40'42.97“ and E. Long. 77°11'34.19”), a peak in the Western Ghats, and then propels initially southwesterly and subsequently southerly, draining through grasslands, sholas, tea and rubber plantations, small and medium towns, and finally the Thiruvananthapuram City Corporation (TCC), before joining the Arabian Sea. This river drains through all three physiographic regions of Kerala, (viz., highland (elevation>75.0 m amsl), midland (7.5 -75.0 m amsl), and lowland (<7.5 m amsl)), is sandwiched between the Vamanapuram river basin to the NW and Neyyar basin to the SE. There are 31 local (self-governing) bodies in the KRB, viz., 29 grama panchayats, NM (Nedumangad Municipality), and TCC. Per Census-2011, the population of the basin is ∼1.60 million. The grand sum of lengths of all orders of streams in KRB stands at 1418.0 km (Fig. 1 ).
Fig. 1.
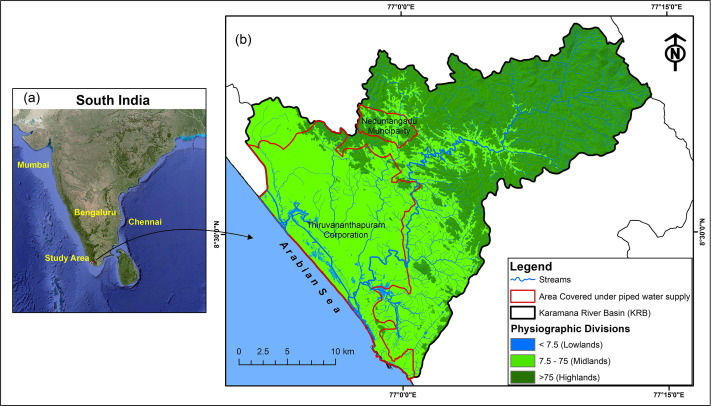
Location map (a) concerning South India (Google Earth scene) (b) physiographic divisions with drainage network of Karamana River Basin (KRB), on an Arc SEC SRTM-DEM base with hill shade overlay.
KRB, set in the tropical monsoon climate (i.e., Koppen’s Am zone), is the principal source of water (average annual rainfall=2600.0 mm), meeting the needs of the domestic sector, schools and colleges, hospitals, and small-scale industries in TCC (Harikumar, 2017, Jayaraman et al., 2003, Rani, 2013). The elements that influence the climate are the wide-ranging relief from the west coast to the hilly midland and finally to the lofty Western Ghats. Currently, water discharge in the Karamana River is modulated by two reservoirs, the first one at Aruvikkara (area=258 ha; built in 1930) and the second one further upstream at Peppara (area=582 ha; built in 1972).KRB exhibits a diverse land use pattern, such as mixed agricultural plantation(area=432.53 km2 or 61.6%), while the highland covered with dense evergreen forest vegetation (120.56 km2 or 17.17%). According to Chandrasekharan, 1962, Champion and Seth, 1968, the major forest types of this region are West coast tropical evergreen forests, southern semi-evergreen moist mixed deciduous forests, and southern subtropical savannahs. The built-up area had extensively sprawled towards the south-western (SW) part of the basin (52.97 km2 or 7.55%) hosting the NM and TCC. The river/water bodies spread across the basin (14.43 km2 or 2.06%), while rubber plantations are mostly confined to the higher midland and lower highland tracts (31.32 km2 or 4.46%). Coconut (15.36 km2), cashew (0.01 km2), and tea (5.34 km2) are the other cash crops in the study area. Mixed cropping (viz., plantain, tapioca, and vegetable farming) is also practiced by some farmers. Fig. 2 depicts the major land use types of KRB.
Fig. 2.
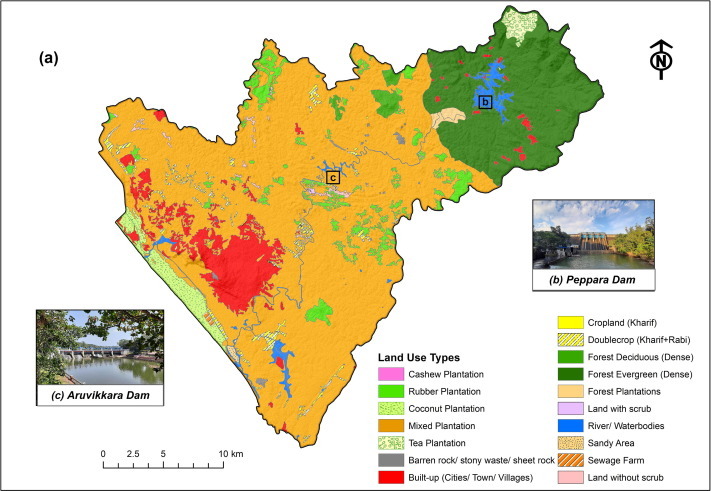
(a) Land Use Land Cover (LULC) map of the KRB (b)Peppara dam and (c) Aruvikkara Dam
After the initial breakout of Covid-19, the Government of India allowed industrial operations from 1st June 2020, and states followed suit. Subsequently, all the malls, markets, hotels, and public transport resumed functioning and the people of working age worked hard to make up for full capacity production in different sectors for overcoming or neutralizing their financial loss due to the lockdown. Finally, and quite interestingly, the return of the economy to normalcy was mirrored in the water quality of KRB too.
3. Materials and Methods
3.1. Sample collection
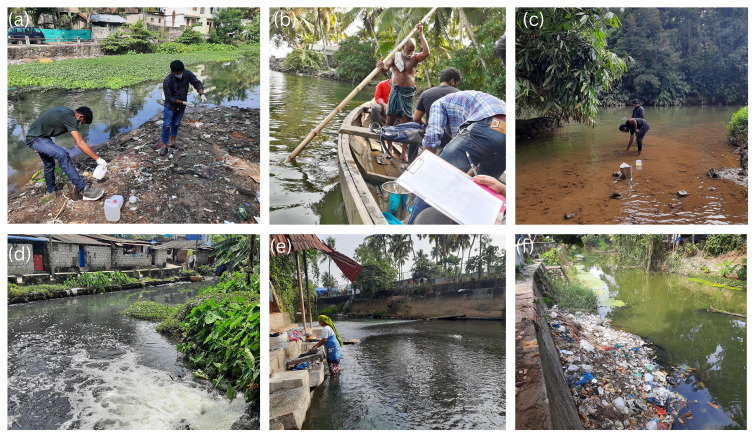
Water samples (N=34) were collected from the Karamana River after the peaking of COVID-19 (i.e., pre-monsoon or January of 2021 and 2022), along with geolocations using a hand-held GPS (APPENDIX- I & II). The primary sampling point is in the surface water layer (5 cm below the surface to exclude organic and inorganic floaters) and along the mid-channel. Then water samples were stored in 1000 ml polyethylene bottles, which were prewashed and three times rinsed with the surface water (SW) before capping and labeling. A portable pH meter was used to measure pH immediately after the collection (Supplementary material 1).
3.2. Materials
Watershed boundary and Land use types of KRB (including TCC, NM, and 29 grama panchayats), were sourced from Kerala Land Use Board (KLUB), and the physiographic divisions (viz., Highland, Midland, and Lowland) of the study area were delineated from the SRTM-DEM of ArcSEC resolution, downloaded from the www.earthexplorer.usgs.gov. ArcGIS 10.2 software was used for the geostatistical analysis and Microsoft excel for estimating the Weighted Arithmetic Index of Brown et al., (1972).
3.3. Methods
The chemical parameters viz., TDS, Calcium (Ca2+), Magnesium (Mg2+), Total Hardness (TH), Chloride (Cl-), Nitrate (NO3 -), Nitrite (NO2 -), Silicate (SiO4) and Sulfate (SO4 2-) were determined as per APHA (2005) guidelines. Further, each parameter was categorized and classified following the stipulations of the Bureau of Indian Standards (BIS, 2012). Even though several instances of water quality indices and assessment methods exist in the literature (Boah et al., 2015, Kadam et al., 2021, Sener et al., 2017, Talib et al., 2019, Ustaoğlu et al., 2020), water quality index (WQI) originally proposed by Horton (1945) and later refined by Brown et al., (1972) is the most widely used one (Xiao et al., 2021, Zhang et al., 2021). WQI is estimated through weighted arithmetic index method. Some recent examples of the application of WQI can be seen in Cadraku and Beqiraj, 2022, Krishan et al., 2023, Kwon and Jo, 2023. For better visualization and perception of spatial variability trends of hydro-chemical parameters, a series of thematic maps were created using tools, such as Inverse Distance Weighting (IDW) and 1st-degree polynomial trend in ArcGIS 10.2
3.3.1. Water Quality Index (WQI)
A water quality index (WQI) is a numerical abstraction of a large volume of data related to water quality into certain basic classes (viz., excellent, good, poor, very poor, and unsuitable), for quick and easy reporting to administrator and the community regularly (Huyla, 2009). WQI, a single number expressing the overall water quality, at a certain location and time, is based on several water quality parameters (Adelagun et al., 2021). The index is very much effective and important to relate the trend of water quality and management of water quality (Jagadeeswari & Ramesh, 2012) (Table 1 ).
Table 1.
WQI-based verbal water quality classes (Brown et al., 1972)
| WQI | Water quality state |
|---|---|
| 0 - 25 | Excellent |
| 26 - 50 | Good |
| 51 - 75 | Poor |
| 76 - 100 | Very poor |
| Above 100 | Unsuitable |
WQI is calculated following the weighted arithmetic index method (Brown et al., 1972), using the Eq-1:
| (1) |
where,
quality rating of nth water quality parameter,
Unit weight of nth water quality parameter
Quality rating is calculated as (Eq-2):
| (2) |
where,
actual value of the parameter observed
ideal value of the parameter
All the ideal or standard values are taken as zero for drinking water except pH and dissolved oxygen (Tripathy and Sahu, 2005).
standard permissible value for the nth water quality parameter.
For pH, the ideal value is 7.0 (for natural/pure water), and a permissible value is 8.5 (above this limit is considered as polluted). Therefore, the quality rating for pH is calculated as (Eq-3):
| (3) |
Unit weight is calculated as (Eq-4):
| (4) |
Where,
a constant of proportionality, is calculated as (Eq-5):
| (5) |
Further, the spatial variations of the WQI were modeled using the IDW technique in ArcGIS 10.2 platform.
3.3.2. Geostatistical analysis
The geostatistical analyst toolset in ArcGIS 10.2 is used for mapping the spatial variability of physico chemical parameters of surface water (SW) samples for the ease of visualizing and comparing the quality variations in the KRB for the pre-monsoon, i.e., January of 2021 and 2022. IDW and 1st-degree polynomial trend tools(for identifying the direction of surge) are used in creating thematic maps of quality parameter trends. IDW is a method of interpolation to estimate cell values by averaging the values of sample data points in the neighborhood of each processing cell (ESRI, 2007). This method predicts the unmeasured points in such a way that points that are closer to one another are different than the points that are far from measured points. More weight corresponds to points that are closer to one another whereas less weightage goes to points that are farther apart and can be represented by Eq. (6):
| (6) |
Where ‘p’ is optimal power which can be calculated by root mean square prediction error (RMSPE). Different powers can be used for IDW interpolation and plotted against RMSPE. However, is mostly used as a default value to estimate points by this interpolation because it provides minimum RMSPE (Aravindan and Shankar, 2011, Kamble et al., 2020, Murugesan et al., 2020). 1st-degree polynomial trend maps per se are strongly informative and robustly bring out the general trend of variation of the mapped variable across the study area. Moreover, to identify the quality category on the BIS framework, physico-chemical parameters of the KRB were screened against the former.
3.3.3. Weighted Overlay Analysis
Spatial variation/distribution of water quality parameters was analyzed through geostatistical analysis for ranking and reclassification based on the BIS limits (some are unique single numbers; while others are a range with acceptable upper and lower limits), to identify the localized clusters of water quality status. While reclassifying, (a range of) a specific parameter is substituted with a single numerical value. Higher ranks are assigned to the relatively higher values in the BIS list (i.e., say above the permissible limit), and lower ranks to the lower values (in the desirable limit). These new values are used as input in weighted overlay analysis for 2021 and 2022. Parameters that have only an acceptable value range in BIS were excluded from the weighted overlay analysis to avoid unwanted errors. Further, hotspot areas/clusters were identified using ArcMap 10.2 (Supplementary material 2).
4. Results and Discussions
COVID-19 pandemic lockdown modulated physico-chemical parameters of the surface water of KRB were analyzed through the perspectives of the Weighted Arithmetic Index method and Geostatistical analyst. The key parameters scrutinized and monitored in this study are pH, total dissolved solids (TDS), calcium (Ca2+), magnesium (Mg2+), total hardness (TH), chloride (Cl-), nitrate (NO3 -), nitrite (NO2 -), silicate (SiO4) and sulfate (SO4 2-). The previous studies in KRB, before COVID-19 pandemic, allied to the water quality reveal that the rise in population, urbanization, and anthropogenic activities are the key factors for the deterioration of the water quality (Balan et al., 2020, Harikumar, 2017, Jayaraman et al., 2003, Mahadevan et al., 2020, Sujitha et al., 2012, Sukanya and Joseph, 2020) while the uptrend of the decadal population had negatively affected the annual per capita water share (Shaji et al., 2021, Prasood et al., 2021, Prasood et al., 2022). Census of India reported that since 1991 onwards the population trend for Kerala stood above the national trend (Kerala- 26.4%; India- 25.7%) and continued to be so till 2011 (e.g., Kerala: 47.7%, India: 31.2%), indicating a negative correlation between safe water supply and population growth. Similarly, Arulbalaji et al., (2020) reported that during 1988-2019, the wetlands and cultivated lands near the main waterbody and lake from the southwest of Thiruvananthapuram have been converted to dry land for commercial purposes and other new transport infrastructure.
Although COVID-19 disrupted routine activities across multiple sectors globally and nationally, this made a positive impact on water resources, especially in respect of river water quality. The present study on the estimated WQI and spatial modeling of water quality parameters, robustly suggests improved water quality of KRB “to unimaginable” levels after the COVID-19 lockdown. Recent studies reported from elsewhere too indicate that improved water quality had happened in other provinces of the world (Allegrante et al., 2020, Chang et al., 2020, Dutta et al., 2020, Espejo et al., 2020, KSPCB, 2020, Kundu, 2020, Paital, 2020, Raoofi et al., 2020, Saadat et al., 2020). Moreover, our study suggests that anthropogenic impact is perhaps the single most important factor for the decline of water quality which is positively aligned with reports from across the globe (cf. Akimoto, 2003, Karunanidhi et al., 2020, Masood et al., 2016, Ogwueleka, 2015, Schlacher et al., 2016, Volkamer et al., 2006).
4.1. Water Quality Index (WQI)
The estimated WQI of water samples in the KRB suggests that though ∼96.39% (676.66 km2) of the basin enjoyed an excellent category class during the late peak of COVID-19 (i. e., January 2021), the area declined to 89.96% (631.55 km2) in January 2022, indicating a downtrend of WQI over an area of 45.11km2 between timelines 2021 and 2022 or after the lifting of COVID-19 lockdown. (Fig. 3 ; Table 2 ).
Fig. 3.
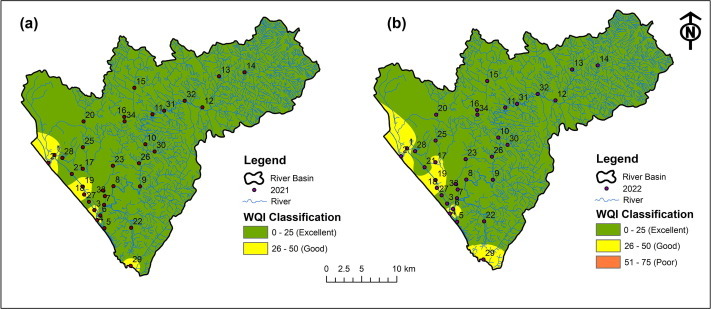
Spatial distributions of WQI classes, KRB
Table 2.
Areal variation of Water Quality Index, KRB (after Brown et al., 1972)
| No | WQI Class | 2021, km2 | % | 2022, km2 | % | Change,km2 |
|---|---|---|---|---|---|---|
| 1 | Excellent (0 - 25) | 676.66 | 96.39 | 631.55 | 89.96 | 45.11 |
| 2 | Good (26 - 50) | 25.34 | 3.61 | 67.14 | 9.56 | 41.8 |
| 3 | Poor (51 - 75) | - | - | 3.31 | 0.47 | 3.31 |
| 702.00 | 100.00 | 702.00 | 100.00 |
4.2. Geostatistical analysis
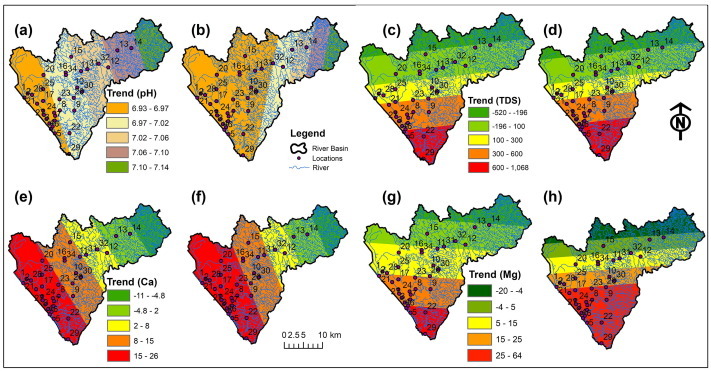
A better understanding of the water quality is crucial as it is the chief determinant of designating water for drinking, agricultural and industrial purposes. We modeled the spatial distribution of chemical parameters of water samples through the Geostatistical analysis, then compared the same with the standard limits set in BIS. Further, based on BIS limits, the area of KRB is reclassified with ArcGIS 10.2 spatial analyst extension, to evaluate the spatial extent and distribution of land parcels of varying water quality. Interestingly, the results indicated that during the lockdown episode water quality had improved, but later seemingly slightly deteriorated due to the relaxation of the lockdown. For instance, in January 2021, the extent of pH under the permissible limit was only 2.59 km2 (0.37%), which later rose to 9.96 km2 (1.42%). Similarly, TDS, Mg2+, TH, and Cl-levels ballooned from 40.82 (5.81%) to 48.90 km2 (6.97%), 18.48 (2.63%) to 74.44 km2 (10.6%), 16.42 (2.34%) to 21.69 km2 (3.09%) and 26.99 (3.84%) to 33.64 km2 (4.79%), respectively. Meanwhile, Ca2+, NO3 -, NO2 -, SiO4, and SO4 2-remained unchanged (Fig. 4, Fig. 5, Fig. 6, Fig. 7 and Table 3).
Fig. 4.
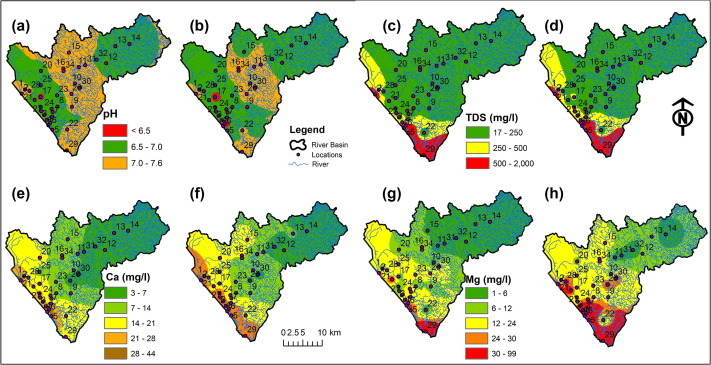
Spatial variation of (a & b) pH, (c & d) TDS, (e & f) Ca2+ and (g & h) Mg2+, KRB, Kerala. (a, c, e, g) and (b, d, f, h) are the IDW model of 2021 and 2022 respectively. Supplementary Material 3: pH, TDS, Ca2+, Mg2+(a, c, e, g and b, d, f, h) are the 1st Degree Trends for 2021 and 2022 respectively.
Fig. 5.
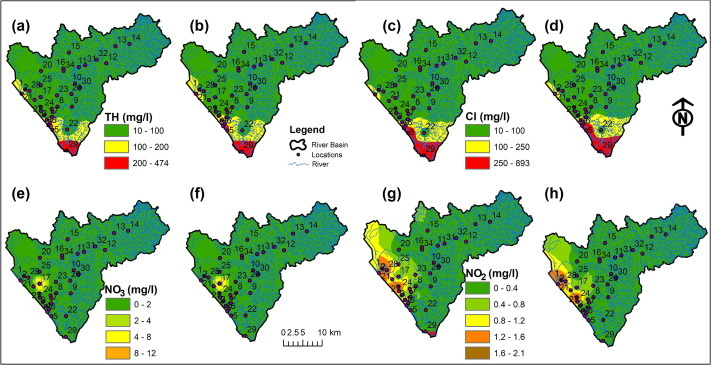
Spatial variation of (a & b) TH, (c & d) Cl−, (e & f) NO3− and (g & h) NO2−, KRB, Kerala. (a, c, e, g) and (b, d, f, h) are the IDW model for 2021 and 2022 respectively. Supplementary Material 4: TH, Cl−, NO3− , NO2−.(a, c, e, g and b, d, f, h) are the 1st Degree Trendsfor 2021 and 2022 respectively.
Fig. 6.
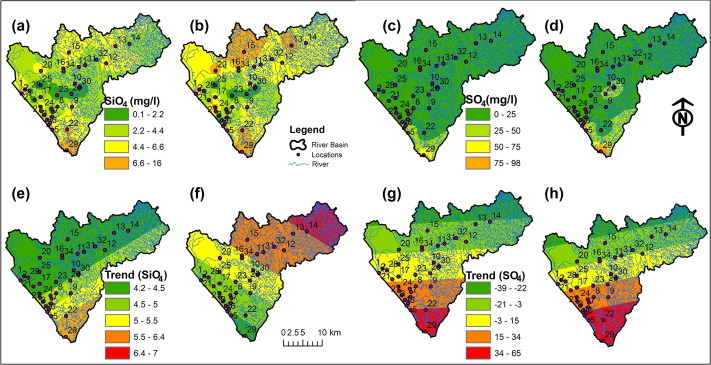
Spatial variation of (a & b) SiO4, (c & d) SO42-, and 1st Degree Trend of (e & f) SiO4 and (g & h) SO42-, KRB, Kerala. (a, c, e, g) and (b, d, f, h) are indicating the year 2021 and 2022 respectively
Fig. 7.

Percentage shift of physico- chemical parameters of surface water samples of KRB. Timelines are 2021 (syn COVID-19) and 2022 (Post-COVID 19)
Table 3.
BIS (2012) limits of Drinking Water parameters, timelines and predicted-cumulative extent of <permissible and >permissible categories, KRB, Kerala.
| No | Parameter | Sampling Year |
BIS Drinking Water Specification |
Predicted Extent in KRB, km2 |
||
|---|---|---|---|---|---|---|
| Acceptable limit | Maximum limit | <Permissible limit | >Permissible limit | |||
| 1 | pH | 2021 | 6.5 to 8.5 | 6.5 to 8.5 | 699.41 | 2.59 |
| 2022 | 692.04 | 9.96 | ||||
| 2 | Total Dissolved Solid (TDS), mg/l | 2021 | 500 | 2000 | 661.18 | 40.82 |
| 2022 | 653.10 | 48.90 | ||||
| 3 | Calcium (Ca2+), mg/l | 2021 | 75 | 200 | 702.00 | 702.00 |
| 2022 | 702.00 | 702.00 | ||||
| 4 | Magnesium (Mg2+), mg/l | 2021 | 30 | 100 | 683.52 | 18.48 |
| 2022 | 627.56 | 74.44 | ||||
| 5 | Total Hardness (TH), mg/l | 2021 | 200 | 600 | 685.58 | 16.42 |
| 2022 | 680.31 | 21.69 | ||||
| 6 | Chloride (Cl-), mg/l | 2021 | 250 | 1000 | 675.01 | 26.99 |
| 2022 | 668.36 | 33.64 | ||||
| 7 | Nitrate (NO3-), mg/l | 2021 | 45 | 100 | 702.00 | 702.00 |
| 2022 | 702.00 | 702.00 | ||||
| 8 | Nitrite (NO2-), mg/l | 2021 | 3 | - | 702.00 | 702.00 |
| 2022 | 702.00 | 702.00 | ||||
| 9 | Silicate (SiO4), mg/l | 2021 | 30 | - | 702.00 | 702.00 |
| 2022 | 702.00 | 702.00 | ||||
| 10 | Sulphate (SO4), mg/l | 2021 | 200 | 400 | 702.00 | 702.00 |
| 2022 | 702.00 | 702.00 | ||||
4.2.1. pH (Hydrogen Ion Concentration)
The pH of drinking water prescribed in BIS (2012) is 6.5 to 8.5. The pH of water samples of KRB is characteristically in the range of 6.2–7.6 during January (PRM) 2021, while it varied between 5.91 and 7.8 during January (PRM) 2022. Though the areal extent of pH falling within the BIS limit is only 2.59 km2 (2021), it later 2022 rose to 9.96 km2(2022). Similarly, the 1st-degree trend of pH shows a rapid increase in North Westerly/westerly or seaward in KRB. From 2021 to 2022, the acid pH (<6.5) expanded from Kannammoola (due to the sewage load from Amayizhanchan Thodu) toward Thiruvallam and Poonthura estuary (latter perhaps also under the influence of proximity to the sea). Even though Kerala had the highest rainfall of 60 years in 2021 (www.imd.gov.in), and the average pH of rainwater in India varied between 6.0 to 7.5 (Ali et al., 2004, Chakraborty and Gupta, 2014, Kulshrestha et al., 2005, Mouli et al., 2005, Safai et al., 2004), the KRB showed a remarkable pH from 2021 to 2022 (Fig. 4).
4.2.2. Total Dissolved Solids (TDS)
TDS depends on the sum of anions and cations, pollutants, and organic substances in water. The recommended BIS limit of TDS in drinking water is <500 ppm, and water samples of KRB fall in a window of 17.57–1999 ppm during January (PRM) 2021, and between 19.03 and 2024.25 ppm during January (PRM) 2022. The share of basin area with TDS under the permissible limit is only 40.82 km2 (in 2021), but later in 2022 it slightly increased to 48.90 km2. Further, the 1st-degree trend of TDS increased seaward (Fig. 4).
4.2.3. Calcium (Ca2+)
BIS (2012) standard, specifies a window for the highest desirable limit of Ca2+ as 75.0 ppm and with a maximum permissible limit of 200.0 ppm. The content of Ca2+ in KRB in January (PRM) of both 2021 and 2022 are within the BIS desirable limits, i.e., in the range of 3.2–43.6 ppm and between 3.37 and 40.27 ppm respectively. When reckoned with the global average, it is suitable for aquatic systems (Sarin et al., 1992). The 1st-degree trend shows that the Ca2+ increased slightly south-westerly or seaward (Fig. 4).
4.2.4. Magnesium (Mg2+)
Mg2+, the major scale-forming cation in industrial water, is commonly present in natural waters and along with calcium contributes to the hardness of the water. Magnesium arises principally from the weathering of rocks containing ferro-magnesium minerals and from some carbonate rocks. Magnesium occurs in many organo-metallic compounds and organic matter since it is an essential element for living organisms. The acceptable BIS limit of Mg2+ in drinking water is 30mg/l or ppm. Although magnesium is used in many industrial processes, it contributes relatively little to the total magnesium in surface waters. Also, their presence in water is often closely correlated with the type of land use in the catchment areas (Wons et al., 2012). Water samples of KRB are characteristically in the range of 1.12–95.69 ppm during January (PRM) 2021, while it is between 1.86 to 98.52 ppm during January (PRM) 2022. The area of Mg2+ under the permissible limit in the basin is only 18.48 km2 (in 2021), which later went up to 74.44 km2(2022). Similarly, the 1st-degree trend portrays a seaward or southerly rise of Mg2+ content in KRB (Fig. 4).
4.2.5. Total Hardness (TH)
TH, an important parameter of water quality (Kumar, 2004)irrespective of its end use (viz., domestic, industrial, or agricultural), though not a polluter per se, is an indicator of water quality chiefly based on Ca2+ and Mg2+. TH levels of water of KRB are typically in the range of 6.31–442.9 ppm during January (PRM) 2021 but rose to 10.14–473.6 ppm during January (PRM) 2022. The BIS permitted limit of TH for drinking water is 200 mg/l or ppm, and the extent of the basin falling under the permissible limit is 16.42 km2 (in 2021) and 21.69 km2 (in 2022). Then, the 1st-degree trend shows the slight but dominant rise of TH southerly and seaward (Fig. 5).
4.2.6. Chloride (Cl-)
In general, inland natural waters have low chloride ion concentrations, often less than that of bicarbonates and sulphates. In fresh waters, a high concentration of chloride is considered to be an indicator of pollution due to organic waste of animal origin (especially animal excreta), and industrial effluents. The distribution of chloride on the water samples of KRB is characteristically in the range of 9.3–838.99ppmduring January (PRM) 2021, but rose to 10.80–892.9ppm during January (PRM) 2022. The BIS (2012) permitted limit of chloride in drinking water is only 250 mg/l or ppm. In KRB extent of area under the permissible limit is 26.99 km2 in January 2021 and 33.64 km2 in January 2022. Further, the 1st-degree trend indicates a southerly rising tendency (Fig. 5).
4.2.7. Nitrate (NO3-)
Nitrate level in the water samples of KRB is only in the range of 0.001–11.06 ppm during January (PRM) 2021 and between null to 11.83 ppm during January (PRM) 2022. The BIS (2012) limit of nitrate in drinking water is 45 mg/l or ppm, and obviously, the KRB water is well within the prescribed limits. Interestingly, though the 1st-degree trend rises northwesterly, perhaps under the influence of the mixing of untreated urban waste water; there is no huge difference between 2021 and 2022 within the KRB (Fig. 5).
4.2.8. Nitrite (NO2-)
The distribution of nitrite in water samples of KRB is typically in the range of 0.011–2.04 ppm during January (PRM) 2021, while in January 2022 samples it varies from 0–2.06 ppm, and well within the set limits of BIS. Further, the 1stdegree trend does have only a marginal difference between 2021 and 2022 but displays a rising north-westerly trend toward the urban footprint of TCC (Fig. 5).
4.2.9. Silicate (SiO4)
Even though the solid crust of the earth contains 80 to 90% of silicates or silicates plus other compounds of silicon such as silica or silicon dioxide (SiO2), most silicate salts, except sodium silicate, are only slightly soluble in water and are widely distributed in nature. The distribution of silicate in water samples of KRB is typically in the range of 0.102–8.77 ppm during January (PRM) 2021, while it is between 0.11–15.89 ppm during January (PRM) 2022, (i.e., well within the BIS prescription). However, the 1stdegree trend shows NErly rise or in an upstream direction for both 2021 and 2022 (Fig. 6).
4.2.10. Sulphate (SO42-)
Sulphate (one of the major anions in natural waters), in KRB water samples for both January 2021 and January 2022, is well within the prescribed BIS limits. Levels of SO4 2-in the water samples of KRB are characteristically in the range of 0.62–94.07ppm during 2021 and between 0.99–97.88ppm during 2022. Similarly, the 1st-degree trend depicts a slight southerly rise in values (Fig. 6).
Table 3 and Fig. 7 indicate that aerial coverage or percentage change of pH over the permissible limit is only 2.59 km2 (0.37%) in 2021, but later in 2022, it rose to 9.96 km2 (1.42%). Similarly, TDS, Mg2+, TH, and Cl- levels ballooned from 40.82 (5.81%) to 48.90 km2 (6.97%), 18.48 (2.63%) to 74.44 km2 (10.6%), 16.42 (2.34%) to 21.69 km2 (3.09%) and 26.99 (3.84%) to 33.64 km2 (4.79%), respectively.
4.3. Weighted Overlay Analysis
Weighted overlay analysis in ArcGIS 10.2 platform with an input of BIS prescribed standard limits (IS 10500, 2012), suggests that water quality of KRB can be empirically divided into three classes (viz., excellent, good, and poor) and enabled predication of the extent of basin area under each class. In 2021, for instance, the extent of the excellent class stood at 533.74 km2 (76.0%), but in 2022, the aerial spread shrunk to 438.45 km2 (62.5%). Meanwhile, during the period under reference, the area of good and poor categories rose from 140.41 km2 (20.0%) to 203.13 km2 (28.9%) and 27.85 km2 (4.0%) to 60.42 km2 (8.6%) respectively. Fig. 8 depicts the drastic decline in the water quality of KRB after revoking lockdown restrictions.
Fig. 8.
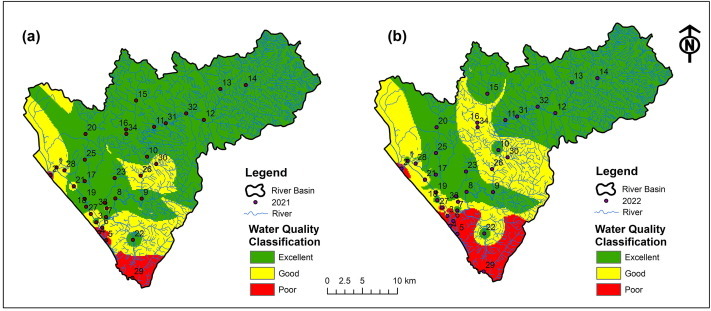
Spatial distribution of physico- chemical parameters of surface water samples of KRB. Timelines are 2021 (syn COVID-19) and 2022 (Post-COVID 19)
5. Conclusions
The study on the river water quality of KRB, based on 34 samples distributed in the basin, has been deciphered to have substantially improved and indeed temporarily touched the excellent class during the lockdown episode of COVID-19. Further, equally importantly, a point deserving special attention is the deterioration of water quality due to revoking of strict lockdown restrictions. The lessons learned from syn-Covid-19, the spike or uptrend of the water quality compared to the past decades, offer ample scientific basis to policymakers, administrators, and environmentalists for restoration of river system health from huge anthropogenic stress. Finally, this study also enabled us to arrive at the following inferences.
-
1.
The estimated WQI of KRB through the weighted arithmetic index method (cf. Brown et al., 1972) reveals that the water quality of KRB has robustly increased and lion’s share of the area at least temporarily touched the excellent category (based on WQI classification) during the COVID-19 lockdown period (24th March–31st May 2020) to January 2021.
-
2.
It is inferred from the calculated WQI that, 45.11km2 area only has been exposed to a downtrend of water quality between January 2021(676.66 km2 or 96.39%) to January 2022 (631.55 km2 or 89.96%), i.e., after lifting of lockdown restrictions (1st June 2020). Similarly, weighted overlay analysis indicates that between 2021 to 2022, the area under excellent class drastically declined from 533.74 km2 (76.0%) to 438.45 km2 (62.5%), while good and poor rose from 140.41 km2 (20.0%) to 203.13 km2 (28.9%) and from 27.85 km2 (4.0%) to 60.42 km2 (8.6%) respectively.
-
3.
Based on BIS (2012) guidelines, the estimated areas in KRB falling under permissible class truly exceeded the prescriptions (viz., pH 2.59 - 9.96 km2, TDS 40.82–48.90 km2, Mg2+ 18.48–74.44 km2, TH 16.42–21.69 km2, Cl- 26.99–33.64 km2 in 2021 and 2022 respectively.
-
4.
4) On river water quality vis-à-vis the COVID-19 lockdown and revoking, many researchers recommend that such short-term positive impacts of COVID-19 should be the foundation of future design, development, and implementation of effective programs to protect the human environment.
-
5.
Finally, this study demonstrates that water chemistry, WQI, water quality standards elected by nation-states along with GIS tools (especially Inverse Distance Weighting, 1st Degree Polynomial Trend) are powerful enablers for visualization of the spatial variability of physico-chemical attributes to an audience of generalist planners and administrators in charge water supply management.
Declaration of Competing Interest
The authors declare that they have no known competing financial interests or personal relationships that could have appeared to influence the work reported in this paper.
Acknowledgments
Prasood and Thrivikramji thank Dr. Babu Ambat, the Executive Director, of the Center for Environment and Development, Thiruvananthapuram, Kerala for providing the essential ambiance for carrying out this research.
Footnotes
Supplementary data to this article can be found online at https://doi.org/10.1016/j.totert.2023.100042.
Appendix A. Supplementary data
The following are the Supplementary data to this article:
Supplementary figure 1.
Supplementary figure 2.

Supplementary figure 3.
Data availability
Data will be made available on request.
References
- Adelagun R.O.A., Etim E.E., Godwin O.E. Application of Water Quality Index for the Assessment of Water from Different Sources in Nigeria. Open access peer-reviewed chapter. 2021 doi: 10.5772/intechopen.98696. [DOI] [Google Scholar]
- Ajayakrishnan K., Santhosh S., Sobha V. A Spatial Model for Water Resource Management in Karamana River Basin Using Geoinfromatics. Int. J. Eng. Innovat. Technol. (IJEIT). 2014;4(4):194–199. [Google Scholar]
- Akimoto Global air quality and pollution. Science. 2003;302:1716–1719. doi: 10.1126/science.1092666. [DOI] [PubMed] [Google Scholar]
- Ali R., Brett C.L., Mukharjee S., Rao R. Inhibition of sodium/proton exchange by a Rab-GTPase-activating protein regulates endosomal traffic in yeast. J. Bio. Chem. 2004;279(6):4498–4506. doi: 10.1074/jbc.M307446200. [DOI] [PubMed] [Google Scholar]
- Allegrante J.P., Auld M.E., Natarajan S. Preventing COVID-19 and Its Sequela: “There Is No Magic Bullet... It's Just Behaviors”. Am. J. Prev. Med. 2020;59(2):288 292. doi: 10.1016/j.amepre.2020.05.004. [DOI] [PMC free article] [PubMed] [Google Scholar]
- Aman M.A., Salman M.S., Yunus A.P. COVID-19 and its impact on environment: Improved pollution levels during the lockdown period—a case from Ahmedabad, India. Remote Sens. Appl.: Soc. Environ. 2020;2020 doi: 10.1016/j.rsase.2020.100382. [DOI] [PMC free article] [PubMed] [Google Scholar]
- APHA . wastewater.21st edn. American Public HealthAssociation; Washington: 2005. Standard methods for examination of waterand. [Google Scholar]
- Aravindan S., Shankar K. Ground water quality maps of Paravanar river sub basin, Cuddalore district, Tamil Nadu. India. J. Indian Soc. Remote Sens. 2011;39(4):565–581. [Google Scholar]
- Aravinthasamy, P., Karunanidhi, D., Shankar, K., Subramani, T., Setia, R., Bhattacharya, P., Das, S., 2021.COVID-19 lockdown impacts on heavy metals and microbes in shallow groundwater and expected health risks in an industrial city of South India. Environmental Nanotechnology, Monitoring & Management. 16:100472. https://doi.org/10.1016/j.enmm.2021.100472 [DOI] [PMC free article] [PubMed]
- Arif, M., Kumar, R., Parveen, S., 2020. Reduction in water pollution in Yamuna river due to lockdown under COVID-19 pandemic. ChemRxiv (2020), 10.26434/CHEMRXIV.12440525.V1
- Arulbalaji P., Padmalal D., Maya K. Impact of urbanization and land surface temperature changes in coastal town in Kerala, India. Environmental Earth Sciences. 2020;79:400. doi: 10.1007/s12665-020-09120-1. [DOI] [Google Scholar]
- Balan A.B.S., Suresh A., Arathi A., Nair A.S., Mini M., Anilkumar E.N. Impact of urbanization on water quality of Karamanariver. J. Environ, Eng. Scope. 2020;3(1):1–15. [Google Scholar]
- BIS Drinking Water – Specification (Second Revision) IS. 2012;10500:2012. [Google Scholar]
- Boah D.K., Twum S.B., Pelig-Ba K.B. Mathematical computation of water quality index of Vea dam in the upper east region of Ghana. Environ. Sci. 2015;3(1):11–16. [Google Scholar]
- Boelee E., Geerling G., Zaan B.V.D., Blauw A., Vethaak A.D. Water and health: From environmental pressures to integrated responses. Acta Trop. 2019;193:217–226. doi: 10.1016/j.actatropica.2019.03.011. [DOI] [PubMed] [Google Scholar]
- Brown, R.M., McClellan, N.I., Deininger, R.A., Tozer, R.G., 1972. A water quality index—do we dare?–Water Sew Works117 : 339—343.
- Cadraku H.S., Beqiraj A. Assessment of water quality in Blinaja River Basin (Kosovo) using the Canadian Water Quality Index (WQI) J. Survey Fisher. Sci. 2022;10(1):29–45. [Google Scholar]
- Chakraborty B., Bera B., Adhikary P.P., Bhattacharjee S., Roy S., Saha S., Ghosh A., Sengupta D., Shit P.K. Positive effects of COVID-19 lockdown on river water quality: evidence from River Damodar, India. Sci. Rep. 2021;11 doi: 10.1038/s41598-021-99689-9. [DOI] [PMC free article] [PubMed] [Google Scholar]
- Chakraborty B., Gupta A. Rainwater Quality Analysis in Selected Areas of Eastern and Northeastern India. Proc. Of the Intl. Conf. on Advances in Civil, Structural. Environ. Bio-Technol.- CSEB. 2014;2014:23–27. [Google Scholar]
- Champion, H.G., Seth, S.K., 1968. A Revised Survey of the Forest Types of India: Government of India Printing Press, New Delhi. 404 p.
- Chandrasekharan, C. 1962. Forest Types of Kerala State: Indian Forester, Dehradun, v. 88 (1, 2 and 3).
- Chang K.C., Strong C., Pakpour A.H., Griffiths M.D., Lin C.Y. Factors related to preventive COVID-19 infection behaviors among people with mental illness. J. Formos. Med. Assoc. 2020;119(12):1772–1780. doi: 10.1016/j.jfma.2020.07.032. [DOI] [PMC free article] [PubMed] [Google Scholar]
- DTE, 2020. No major improvement in river water quality during COVID-19 lockdown: CPCB report. 〈https://www.downtoearth.org.in/news/water/nomajor-improvement-in-river-water-qualityduring- covid-19-lockdown-cpcb-report-73520〉.Accessed 23 Feb 2021.
- Dutta V., Dubey D., Kumar S. Cleaning the river ganga: impact of lockdown on water quality and future implications on river rejuvenation strategies. Sci. Total Environ. 2020;743 doi: 10.1016/j.scitotenv.2020.140756. [DOI] [PMC free article] [PubMed] [Google Scholar]
- Espejo W., Celis J.E., Chiang G., Bahamonde P. Environment and COVID-19: Pollutants, impacts, dissemination, management and recommendations for facing future epidemic threats. Sci. Total Environ. 2020;747 doi: 10.1016/j.scitotenv.2020.141314. [DOI] [PMC free article] [PubMed] [Google Scholar]
- ESRI, 2007. Implementing Inverse Distance Weighted (IDW). ArcGIS 9.2 Desktop Help.www.webhelp.esri.com.
- Harikumar, 2017.Water quality status of Thiruvanathapuram district, Kerala. Unpublished report submitted to Research Unit, Local Self Government (RULSG) Centre for Development Studies Thiruvananthapuram.
- Horton R.E. Erosional Development of streams and Their Drainage Basins; Hydrophysical Approach to Quantitative Morphology. Geol. Soc. Am. Bullet. 1945;56:275–370. [Google Scholar]
- Huyla B. Utilization of the water quality index methodas a classification tool.EnvironmMonit. Assess. 2009;167:115–124. doi: 10.1007/s10661-009-1035-1. [DOI] [PubMed] [Google Scholar]
- ICAR India’s per capita water availability to fall further. Financial Express. 2019 https://www.financialexpress.com/economy/indias-per-capita-water-availability-to-fall-further/1697647/ [Google Scholar]
- Jagadeeswari P.B., Ramesh K. Water quality index forassessment of water quality in south Chennai coastalaquifier, Tamil Nadu. India. Int J Chem Tech Res. 2012;4(4):1582–1588. [Google Scholar]
- Jayaraman P.R., Devi T.G., Nayar T.V. Water quality studies on Karamanariver, Thiruvananthapuram district, South Kerala, India. Pollut. Res. 2003;22(1):89–100. [Google Scholar]
- Kadam A., Wagh V., Jacobs J., Patil S., Pawar N., Umrikar B., Sankhua R., Kumar S. Integrated approach for the evaluation of groundwater quality through hydro geochemistry and human health risk from Shivganga river basin, Pune, Maharashtra. India. Environ. Sci. Pollut. Res. 2021;2021:1–23. doi: 10.1007/s11356-021-15554-2. [DOI] [PubMed] [Google Scholar]
- Kamble B.S., Saxena P.R., Kurakalva R.M., Shankar K. Evaluation of seasonal and temporal variations of groundwater quality around Jawahar Nagar municipal solid waste dumpsite of Hyderabad city. India. SN Appl. Sci. 2020;2(3):1–22. [Google Scholar]
- Karunanidhi D., Aravinthasamy P., Deepali M., Subramani T., Roy P.D. The effects of geochemical processes on groundwater chemistry and the health risks associated with fluoride intake in a semi-arid region of South India. RSC Adv. 2020;10:4840. doi: 10.1039/c9ra10332e. [DOI] [PMC free article] [PubMed] [Google Scholar]
- Karunanidhi D., Aravinthasamy P., Deepali M., Subramani T., Shankar K. Groundwater Pollution and Human Health Risks in an Industrialized Region of Southern India: Impacts of the COVID-19 Lockdown and the Monsoon Seasonal Cycles. Arch. Environ. Contam. Toxicol. 2021;80:259–276. doi: 10.1007/s00244-020-00797-w. [DOI] [PMC free article] [PubMed] [Google Scholar]
- Kedareswarudu U., Aravind U.S., Chattopadhyay M. Analysis of watershed characteristics and basin management using RS and GIS. Int. J. Rem. Sens. Geosci. 2013;2(1):36–42. [Google Scholar]
- Khan, R., Saxena, A., Shukla, S., Selvam, S., Goel, P., 2021. Effect of COVID-19 lockdown on the water quality index of River Gomti, India, with potential hazard of faecal-oral transmission.Environ. Sci. Pollut. Res (2021), 10.1007/s11356-021-13096-1 [DOI] [PMC free article] [PubMed]
- Koppen VersucheinerKlassifikation der Klimate, vorzugsweisenachihrenBeziehungenzurPflanzenwelt. GeographischeZeitschrift. 1900;6:657–679. [Google Scholar]
- Krishan G., Kumar M., Rao M.S., Garg R., Yadav B.K., Kansal M.L., Singh S., Bradley A., Muste M., Sharma L.M. Integrated approach for the investigation of groundwater quality through hydrochemistry and water quality index (WQI) Urban Clim. 2023;47 doi: 10.1016/j.uclim.2022.101383. [DOI] [Google Scholar]
- KSPCB, 2020. Cauvery, Tributaries Look Cleaner as Pandemic Keeps Pollution Away. Available online at: https://www.thehindu.com/news/national/karnataka/cauvery-tributaries-in-old-mysuru-region-look-cleaner-as-pandemic-keeps-pollution-away/article31210429.ece.
- Kulshrestha U.C., Granat L., Engardt M., Rodhe H. Review of precipitation monitoring studies in India- a search for regional pattern. Atmos. Environ. 2005;39:7403–7419. [Google Scholar]
- Kumar C.P. Constraints in the numerical modeling of salt water intrusion. J. Soil Water Conservation, Soil Conservation Society of India. 2004;3(3–4):185–195. [Google Scholar]
- Kumar V., Parihar R.D., Sharma A., Bakshi P., Sindhu G.P.S., Bali A.S., Karaouzas L., Bhardwaj R., Thukral A.K., Gyasi-Agyei Y., Rodrigo-Comino J. Global evaluation of heavy metal content in surface water bodies: A meta-analysis using heavy metal pollution indices and multivariate statistical analyses. Chemosphere. 2019;236 doi: 10.1016/j.chemosphere.2019.124364. [DOI] [PubMed] [Google Scholar]
- Kundu, C., 2020. Has the Covid-19 lockdown returned dolphins and swans to Italian waterways? The India Today, 22 March 2020. 〈https://www.indiatoday.in/fact-chec k/story/has-covid19-lockdown-returned-dolphins-swans-italian-waterways 1658457–2020-03–22〉.(Accessed 14 April 2020).
- Kwon H.G., Jo C.D. Water quality assessment of the Nam River, Korea, using multivariatestatistical analysis and WQI. Int. J. Environ. Sci. Technol. 2023 doi: 10.1007/s13762-023-04756-5. [DOI] [Google Scholar]
- Landrigan, P.J., Fuller, R., Acosta, N.J.R., Adeyi, R., Basu, N.N., BibiBaldé, A., Bertollini, R., Bose-O’Reilly, S., Boufford, J.I., Breysse, P.N., Chiles, T., Mahidol, C., Coll-Seck, A.M., Cropper, M.L., Fobil, J., Fuster, V., Greenstone, M., Haines, A., Hanrahan, D., Hunter, D., Khare, M., Krupnick, A., Lanphear, B., Lohani, B., Martin, K., Mathiasen, K.V., McTeer, M.A., Murray, C.J.L., Ndahimananjara J.D. Perera, F., Potočnik, J., Preker, A.S., Ramesh, J., Rockström, J., Salinas, C., Samson, L.D., Sandilya, K., Sly, P.D., Smith, K.R., Steiner, A., Stewart, R.B., Suk, W.A., van Schayck, O.C.P Yadama, G.N., Yumkella, K., Zhong, M., 2017. The Lancet Commission on pollution and health. Lancet Comm., 391 (10119): 462-512, 10.1016/S0140-6736(17)32345-0.
- Leahy S. From Not Enough to Too Much, the World’s Water Crisis Explained. Natl. Geogr. 2018 https://www.nationalgeographic.com/news/2018/03/world-water-day-water-crisis-explained/ [Google Scholar]
- Mahadevan H., Krishnan K.A., Pillai R.R., Sudhakaran S. Assessment of urban river water quality and developing strategies for phosphate removal from water and wastewaters: Integrated monitoring and mitigation studies. SN Appl. Sci. 2020;2(772):1284. doi: 10.1007/s42452-020-2571-0. [DOI] [Google Scholar]
- Masood N., Zakaria M.P., Halimoon N., Aris A.Z., Magam S.M., Kannan N., Mustafa S., Ali M.M., Keshavarzifard M., Vaezzadeh V., Alkhadher S.A.A., Al-Odaini N.A. Anthropogenic waste indicators (AWIs), particularly PAHs and LABs, in Malaysian sediments: Application of aquatic environment for identifying anthropogenic pollution. Mar. Pollut. Bull. 2016;102(1):160–175. doi: 10.1016/j.marpolbul.2015.11.032. [DOI] [PubMed] [Google Scholar]
- Mouli P.C., Mohan S.V., Reddy S.J. Rainwater chemistry at a regional representative urban site: influence of terrestrial sources on ionic composition. Atmos. Environ. 2005;39:999–1008. [Google Scholar]
- Mousazadeh M., Paital B., Naghdali Z., Mortezania Z., Hashemi M., Niaragh E.K., Aghababaei M., Ghorbankhani M., Lichtfouse E., Sillanpaa M., Hashim K.S., Emamjomeh M.M. Positive environmental effects of the coronavirus 2020 episode: a review. Environ. Dev. Sustain. 2021;23(9):12738–12760. doi: 10.1007/s10668-021-01240-3. [DOI] [PMC free article] [PubMed] [Google Scholar]
- Mukherjee P., Pramanick P., Zaman S., Mitra A. Eco-restoration of River Ganga water quality during COVID19 lockdown period using Total Coliform (TC) as a proxy. J. Cent. Regul. Stud. Gov. Public Policy Pg. 2020;2020:75–82. [Google Scholar]
- Murugesan B., Karuppannan S., Mengistie A.T., Ranganathan M., Gopalakrishnan G. Distribution and trend analysis of COVID-19 in India: geospatial approach. J. Geogr. Stud. 2020;4(1):1–9. [Google Scholar]
- Nathan, M., 2021. India’s water crisis: The seen and unseen. DownToEarth.https://www.downtoearth.org.in/blog/water/india-s-water-crisis-the-seen-and-unseen-76049.
- Ogwueleka T.C. Use of multivariate statistical techniques for the evaluation of temporal and spatial variations in water quality of the Kaduna River, Nigeria. Environ. Monit. Assess. 2015 doi: 10.1007/s10661-015-4354-4. 187:137(2015).https://doi.org/10.1007/s10661-015-4354-4. [DOI] [PubMed] [Google Scholar]
- Paital B. Nurture to nature via COVID-19, a self-regenerating environmental strategy of environment in global context. Sci. Total Environ. 2020;729 doi: 10.1016/j.scitotenv.2020.139088. [DOI] [PMC free article] [PubMed] [Google Scholar]
- Prasood, S.P., Thrivikramji, K.P., Joji, V.S., 2022. Chapter 6 - Modeling short-term trends of ground water chemistry of a compound-barrier-spit aquifer, Alappuzha (district), Kerala, in the southwestern seaboard of India. Groundwater Contamination in Coastal Aquifers. 73-90. https://doi.org/10.1016/B978-0-12-824387-9.00007-4
- Prasood S.P., Mukesh M.V., Rani V.R., Sajinkumar K.S., Thrivikramji K.P. Urbanization and its effects on water resources: Scenario of a tropical river basin in South India. Remote Sens. Appl.: Soc. Environ. 2021;23 doi: 10.1016/j.rsase.2021.100556. [DOI] [Google Scholar]
- Rani, V.R., 2013. Groundwater information booklet of Trivandrum district, Kerala state, Published by Government of India, Ministry of Water Resources, Central Ground Water Board.
- Raoofi A., Takian A., Sari A.A., Olyaeemanesh A., Haghighi H., Aarabi M. COVID-19 pandemic and comparative health policy learning in Iran. Arch. Iran. Med. 2020;23(4):220–234. doi: 10.34172/aim.2020.02. [DOI] [PubMed] [Google Scholar]
- Saadat S., Rawtani D., Hussain C.M. Environmental perspective of COVID-19. Sci. Total Environ. 2020;728 doi: 10.1016/j.scitotenv.2020.138870. [DOI] [PMC free article] [PubMed] [Google Scholar]
- Safai P.D., Rao P.S.P., Momin G.A., Ali K., Chate D.M., Praveen P.S. Chemical composition of precipitation during 1984–2002 at Pune, India. Atmos. Environ. 2004;38:1705–1714. [Google Scholar]
- Sajinkumar K.S., Revathy A., Rani V.R. Hydrogeochemistry and spatio-temporal changes of a tropical coastal wetland system: Veli-Akkulam Lake, Thiruvananthapuram, India. Appl Water Sci. 2017;7:1521–1534. [Google Scholar]
- Sarin M.M., Krishnaswami S., Trivedi J.R., Sharma K.K. Major ion chemistry of the Ganga source waters: Weathering in the high altitude Himalaya. Proc. Indian Acad. Sci. (Earth Planet. Sci. (Earth Planet. Sci.) 1992;101(1):89–98. [Google Scholar]
- Schlacher T.A., Lucrezi S., Connolly R.M., Peterson C.H., Gilby B.L., Maslo B., Olds A.D., Walker S.J., Leon J.X., Huijbers C.M., Weston M.A., Turra A., Hyndes G.A., Holt R.A., Schoeman D.S. Estuarine, Coastal and Shelf. Science. 2016;169:56–73. doi: 10.1016/j.ecss.2015.11.025. [DOI] [Google Scholar]
- Sener S., Sener E., Davraz A. Evaluation of water quality using water quality index (WQI) method and GIS in Aksu River (SW-Turkey) Sci. Total Environ. 2017;584–585:131–144. doi: 10.1016/j.scitotenv.2017.01.102. [DOI] [PubMed] [Google Scholar]
- Shaji, E., Thrivikramji, K.P., Prasood, S.P., 2021. Is the Water Future of Kerala Fuzzy? Special Publication of the Geological Society of India. 10:144-147.
- Shukla, T., Sen, I.S., Boral, S., Sharma, S., 2021. A Time-Series Record during COVID-19 Lockdown Shows the High Resilience of Dissolved Heavy Metals in the Ganga River. ACS Publications Collection (2021), 10.1021/acs.estlett.0c00982 [DOI] [PubMed]
- Singhal, S., Matto, M., 2020. COVID-19 lockdown: A ventilator for rivers. Retrieved July 22, 2020 from https://www.downtoearth.org.in/blog/covid-19-lockdown-a-ventilator-for-rivers-70771. Down To Earth magazine.
- Sreeja R., Arun P.R., Mohan M., Pradeepkumar A.P., Prasad N.B. Evaluation of groundwater conditions in a river basin: a case study using Geographical Information System (GIS) Eco Chronicle. 2018;13(4):187–196. [Google Scholar]
- Sujitha P.C., Mitra D.D., Sowmya P.K., Mini P.R. Physico-chemical parameters of Karamana river water in Trivandrum district, Kerala, India. Int. J. Environ. Sci. 2012;2:1417–1434. [Google Scholar]
- Sukanya, S., Joseph, S., 2020. Water Quality Assessment using Environmetrics and Pollution Indices in a Tropical River, Kerala, SW Coast of India. Curr World Environ.; 15(1). DOI:http://dx.doi.org/10.12944/CWE.15.1.04
- Talib M.A., Tang Z., Shahab A., Siddique J., Faheem M., Fatima M. Hydrogeochemical characterization and suitability assessment of groundwater: a case study in Central Sindh, Pakistan. Int. J. Environ. Res. Public Health. 2019;16(5):886. doi: 10.3390/ijerph16050886. [DOI] [PMC free article] [PubMed] [Google Scholar]
- Thrivikramji, K.P., 1989. River Geochemistry, Unpublished report submitted to the Chairman, State Committee on Science, Technology and Environment, Government of Kerala Trivandrum, PP. 59.
- Tripathy J.K., Sahu K.C. Seasonal hydrochemistry of groundwater in the barrier-spit system of Chilika lagoon. J. Environ. Hydrol. 2005;12(7):1–9. [Google Scholar]
- UNEP, 2016. UNEP Frontiers 2016 Report, Emerging Issues of Environmental Concern.https://wesr.unep.org/media/docs/assessments/UNEP_Frontiers_2016_report_emerging_issues_of_environmental_concern.pdf
- Ustaoğlu F., Tepe Y., Taş B. Assessment of stream quality and health risk in a subtropical Turkey river system: a combined approach using statistical analysis and water quality index. Ecol. Ind. 2020;113 [Google Scholar]
- Volkamer R., Jimenez J.L., Martini F.S., Dzepina K., Zhang Q., Salcedo D., Molina L.T., Worsnop D.R., Molina M.J. Secondary organic aerosol formation from anthropogenic air pollution: Rapid and higher than expected. Geophys. Res. Lett. 2006;33:L17811. doi: 10.1029/2006GL026899. [DOI] [Google Scholar]
- Wons M., Szymczyk S., Glińska-Lewczuk K. Ecological approach to monitoring the hardness of the groundwater. Inż.Ekolog. 2012;31:137–143. in Polish. [Google Scholar]
- Xiao J., Wang L., Chai N., Liu T., Jin Z., Rinklebe J. Groundwater hydrochemistry, source identification and pollution assessment in intensive industrial areas, eastern Chinese loess plateau. Environ. Pollut. 2021;278 doi: 10.1016/j.envpol.2021.116930. [DOI] [PubMed] [Google Scholar]
- Yunus, A.P., Masago, Y., Hijioka, Y., 2020. COVID-19 and surface water quality: Improved lake water quality during the lockdown. Sci. Total Environ. 731: 139012.https://doi.org/10.1016/j.scitotenv.2020.139012 [DOI] [PMC free article] [PubMed]
- Zhang Y., Dai Y., Wang Y., Huang X., Xiao Y., Pei Q. Hydrochemistry, quality and potential health risk appraisal of nitrate enriched groundwater in the Nanchong area, southwestern China. Sci. Total Environ. 2021;784 doi: 10.1016/j.scitotenv.2021.147186. [DOI] [PubMed] [Google Scholar]
Associated Data
This section collects any data citations, data availability statements, or supplementary materials included in this article.
Supplementary Materials
Data Availability Statement
Data will be made available on request.