

Abstract
BACKGROUND:
The ultrasmall, superparamagnetic iron oxide (USPIO) nanoparticle ferumoxytol has unique applications in cardiac, vascular and body MRI due to its long intravascular half-life and suitability as a blood pool agent. However, limited availability and high cost have hindered its clinical adoption. A new ferumoxytol generic, and the emergence of MoldayION as an alternative USPIO, represent opportunities to expand the use of USPIO-enhanced MRI techniques.
PURPOSE:
To compare in-vitro and in-vivo MRI relaxometry and enhancement of Feraheme, generic ferumoxytol, and MoldayION.
STUDY TYPE:
Prospective
ANIMAL MODEL:
10 healthy and 6 swine with artificially-induced coronary narrowing underwent cardiac MRI
FIELD STRENGTH/SEQUENCE:
3.0T; T1-weighted (4D-MUSIC, 3D-VIBE, 2D-MOLLI) and T2-weighted (2D-HASTE) sequences pre- and post-contrast.
ASSESSMENT:
We compared the MRI relaxometry of Feraheme, generic ferumoxytol, and MoldayION using saline, plasma, and whole blood MRI phantoms with contrast concentrations from 0.26 to 2.10 mM. In- vivo contrast effects on T1- and T2-weighted sequences and fractional intravascular contrast distribution volume in myocardium, liver, and spleen were evaluated.
STATISTICAL TESTS:
Analysis of variance and covariance were used for group comparisons. A p value <0.05 was considered statistically significant.
RESULTS:
The r1 relaxivities for Feraheme, generic ferumoxytol, and MoldayION in saline (22°C) were 7.11±0.13mM−1s−1, 8.30±0.29mM−1s−1, 8.62±0.16mM−1s−1, and the r2 relaxivities were 111.74±3.76mM−1s−1, 105.07±2.20mM−1s−1, and 109.68±2.56mM−1s−1, respectively. The relationship between contrast concentration and longitudinal (R1) and transverse (R2) relaxation rate was highly linear in saline and plasma. The three agents produced similar in-vivo contrast effects on T1 and T2 relaxation time-weighted sequences.
DATA CONCLUSION:
Relative to clinically approved ferumoxytol formulations, MoldayION demonstrates minor differences in in-vitro relaxometry and comparable in-vivo MRI characteristics.
Keywords: Intravascular contrast agents, Iron-based contrast agents, Theranostics, Relaxometry, Ultrasmall superparamagnetic iron oxides
INTRODUCTION
The search for new and alternative MRI contrast agents is motivated by the goal of improved diagnostic performance while ensuring patient safety. Ultrasmall superparamagnetic iron oxide (USPIO) agents contain an iron oxide core encased within a carbohydrate shell. In recent years, one commercial USPIO, ferumoxytol (Feraheme, Covis Pharma, Cary, NC), has garnered attention as a blood pool MRI agent with multi-contrast imaging attributes. Feraheme however, is approved by the U.S. FDA for treatment of iron deficiency anemia in patients at all levels of renal function and is only marketed in the U.S. Lacking an approved imaging label, the diagnostic use of ferumoxytol is off-label and its high price point for therapeutic use impedes widespread adoption for diagnostic imaging.
Notable properties of Feraheme include its high longitudinal (r1) and transverse (r2) relaxivities, high r1/r2 ratio, and long intravascular half-life of 10 – 14 hours (1, 2). Ferumoxytol is typically metabolized by the reticuloendothelial system and incorporated into essential physiologic processes (3, 4), and has shown strong biocompatibility in-vitro and in-vivo (5). It has also been employed successfully for magnetic resonance angiography (MRA), particularly blood pool imaging and tissue compartmental modelling (6–9), as well as theranostic applications in oncology (10). Feraheme’s suitability for use in patients with renal failure represents an additional notable advantage (11).
Similar in characteristics to Feraheme, two alternative USPIOs have recently gained attention: MoldayION (BioPal, Worcester, MA) and a generic ferumoxytol formulation (Sandoz, Princeton, NJ). Currently used as a research agent for cell labeling (12) and pre-clinical imaging (13–15), MoldayION shares many chemical and biological properties with Feraheme. According to its manufacturer, MoldayION was developed to achieve a comparable r1 and r2 relaxivity, biological half-life, and likely similar safety profile to Feraheme. Generic ferumoxytol on the other hand, has U.S. FDA approval for the same therapeutic indication as Feraheme and its suitability for in vivo imaging has, to our knowledge, not been previously assessed.
We hypothesized that at 3.0T, Feraheme, generic ferumoxytol, and MoldayION (a) demonstrate similar r1 and r2 relaxivities; (b) have similar contrast effects on bright-blood and dark-blood imaging sequences; and might (c) serve as surrogates for tissue vascularity, such that the computed intravascular blood volume of the myocardium, liver, and spleen derived from each agent will be similar across a cohort of normal swine.
MATERIALS AND METHODS
In-Vitro Phantom Experiments
Three units of healthy human whole blood were combined to form a homogeneous blood sample. Five additional units of whole blood underwent centrifugation and separation. Separated plasma was combined to yield a homogeneous plasma sample. We prepared an MRI phantom composed of an array of plastic tubes containing normal saline, human plasma, and human whole blood. The samples were doped with either Feraheme, generic ferumoxytol, or MoldayION respectively, over a range of contrast concentrations: 1/2048 [0.26 mM] (least concentrated), 1/1024 [0.52 mM], 1/512 [1.05 mM], and 1/256 [2.10 mM] (most concentrated). For reference, a contrast concentration of 1.0 mM corresponds to an in-vivo dose of approximately 4.0 mg/kg in a 75 kg patient with a total circulating blood volume of 5 liters. Relaxation measurements were performed using a 3.0T clinical MRI scanner (Skyra®, Siemens Medical Solutions, Malvern, PA) at ambient temperature (22° C). All phantoms were scanned together rather than in batches and were allowed one hour to equilibrate to the same temperature as the MRI scanning room. The temperature of the non-contrast normal saline tube was measured with a digital thermometer immediately prior to and following completion of the experiment. To prevent particulate settling, the phantoms were gently inverted between each imaging session. Scan parameters are provided in Table S1. To measure the longitudinal spin relaxation rate R1 (s−1) in three coronal slices (upper, middle, lower), we used an inversion-recovery spin echo sequence with variable inversion times (TIs) and without parallel imaging. To determine the transverse relaxation rate R2 (s−1), we performed multiple applications of a single-echo spin echo sequence with variable echo times (TEs) in successive repetition. A long TR was also chosen to allow complete recovery of the longitudinal magnetization between the excitations in R2 measurements and following the longest inversion time in R1 measurements. The single-echo spin echo sequence was chosen to minimize the effects of stimulated echoes at short TE times, as well as the effect of the noise floor at long TEs. R1 and R2 acquisitions were performed twice for repeatability. We performed a simple linear regression of R1 and R2 against contrast concentration to estimate the r1 and r2 relaxivities (mM−1s−1) of Feraheme, generic ferumoxytol, and MoldayION in saline, plasma, and whole blood; TI and TE values at which image signal registered below the noise floor were excluded. A second-order polynomial regression was used to describe r1 and r2 relaxivity in blood for all three agents. R1 and R2 maps were fitted in MATLAB (MathWorks, Natick, MA) using a nonlinear least-squares fitting algorithm with a three- and two-parameter fit, respectively.
In-Vivo Imaging
Swine experiments were performed with the approval of our Institutional Animal Care and Use Committee. All juvenile Yorkshire swine (Premier BioSource, Ramona, CA) received intramuscular ketamine (10mg/kg) and midazolam (1mg/kg) and inhaled 1–2% isoflurane to achieve sedation and anesthesia. To minimize respiratory motion, we delivered intravenous rocuronium (2.5mg/kg/hr). Veterinary technologists maintained a surgical plane of anesthesia and monitored vital signs (InVivo Expression MR, Philips, Cambridge, MA, USA) throughout all procedures.
Ten healthy and six swine with artificially-induced coronary narrowing underwent MRI on a whole body clinical 3.0T magnet (Prisma®, Siemens Medical Solutions USA, Malvern, PA). The artificially-induced coronary narrowing without myocardial infarction was not performed specifically for this study and the full analysis is reported in another manuscript. To demonstrate the feasibility of quantitative MRI using MoldayION, Feraheme, and generic ferumoxytol for estimation of fractional intravascular contrast distribution volume in myocardium, liver, and spleen, we performed contrast-enhanced multi-dose T1 mapping studies (9) in all swine (N=16). Briefly, we acquired native (non-contrast) T1 maps of the left ventricular (LV) basal, mid, and apical short-axis using the 5(3)3(3)3 Modified Look-Locker Inversion (MOLLI) recovery sequence with a balanced steady-state free precession (bSSFP) readout and a non-selective inversion pulse (16), without contrast (dose zero). Representative scan parameters are provided in Table S2. Then, MOLLI T1 imaging was repeated following sequential cumulative contrast doses of 0.25, 0.5, 1.0, 2.0, 3.0 and 4.0 mg/kg (20-fold dilution, infusion rate 0.33 mg/kg/min). Based on LV blood pool T1 measurements sampled at 1-minute intervals for 10 minutes after contrast injection, contrast enhancement reached steady-state between 5–6 minutes. For reference, a maximum cumulative dose of 4.0 mg/kg corresponds to a contrast concentration of approximately 1 mM.
In N=9 swine (N = 7 with MoldayION, N=1 with Feraheme, N=1 with generic ferumoxytol), we acquired: (1) pre- and post-contrast 3D bright-blood T1-weighted (T1w) gradient echo images using the VIBE (volumetric interpolated breath-hold examination) sequence (17), (2) pre- and post-contrast multiplanar 2D dark-blood T2-weighted (T2w) images using HASTE (half-Fourier acquisition single-shot spin echo) (18), and (3) post-contrast high resolution 4D cardiac phase-resolved images using the MUSIC (Multiphase, Steady-state Imaging with Contrast) pulse sequence. Representative scan parameters are provided in Table S2 (19). The MUSIC sequence is a 3D cardiac-gated spoiled gradient echo pulse sequence with segmented acquisition to produce high-resolution 4D cardiac phase-resolved bright-blood images of the beating heart. It was specifically designed for contrast-enhanced imaging using intravascular MR contrast agents. Post-contrast coronal HASTE and VIBE imaging was performed 60 minutes after completion of the contrast infusion protocol. Thoracic and abdominal VIBE images were acquired in coronal views (100 – 200 mm overlap) and processed inline to produce a composed, extended field-of-view (eFOV) image series. Total scan duration was approximately three hours because other imaging pulse sequences unrelated to the current work were also performed. Swine were humanely euthanized with sodium pentobarbital (100 mg/kg) while under general anesthesia following completion of experiments.
Image Processing and Analysis of In-Vivo Experimental Data
We analyzed the left ventricular ejection fraction (LVEF), left ventricular end diastolic volume (LVEDV), left ventricular end systolic volume (LVESV) and left ventricular stroke volume (LVSV) of all swine that underwent 4D MUSIC imaging (N = 9) using a reformatted short-axis view (slice thickness 6mm, slice gap 4mm; Medis Suite 2.1.12.10, Medis Medical Imaging Systems, Schuttersveld, Netherlands).
Across our VIBE and HASTE images, signal-to-noise ratio (SNR) and contrast-to-noise ratio (CNR) were analyzed across the blood pool (abdominal aorta and inferior vena cava), longissimus muscle, liver, and spleen. The ROI area was typically 1 cm2, and when necessary, smaller ROIs within vessels were used. The standard deviation (SD) of signal intensity (SI) was recorded in the air outside the body to quantify image noise: SNR=mean(SItissue/SD(SIair)). The CNR values of muscle, liver, and spleen tissue were computed relative to blood signal: CNR=(SItissue - SIblood)/SD(SIair).
To compute the intravascular contrast distribution volume as a surrogate for fractional tissue blood volume, we used the Instantaneous Signal Loss simulation (InSiL) algorithm (20) to fit MOLLI T1 images for functional quantitative estimation of fractional myocardial blood volume (fMBV) and abdominal organ blood volume. The InSiL algorithm was developed to minimize T1 fitting error due longitudinal magnetization loss incurred during the single-shot bSSFP readout (20). To analyze left ventricular (LV) blood pool and myocardial T1, we contoured ROIs (Osirix, Pixmeo, Bernex, Switzerland) within the anterolateral – lateral myocardial wall (base, mid, apex), and in the mid-LV blood pool (excluding trabeculations and papillary muscles). We co-registered each set of multi-dose InSiL T1 maps (Elastix 5.0.0 (21), MATLAB 2020a) and applied a two-compartment water exchange model to fit for fMBV (9). We segmented each fMBV map based on the AHA 17-segment model (22), excluding segments with severe artifacts (CMC, 4 years cardiovascular MRI experience; KLN, 9 years cardiovascular MRI experience) and recorded the mean pixel-wise fMBV in each segment. To compare the performance of the contrast agents as abdominal organ blood volume imaging agents, we fit for fractional blood volume (FBV) using MOLLI images that captured liver and splenic tissues.
Statistical Analysis
Data were tested for normality using the Kolmogorov-Smirnov test. Data are reported as mean ± SD or median and interquartile range (IQR) according to normality. We used Pearson R-correlation to analyze linearity of R1 and R2 with contrast concentration for all three contrast agents and analyzed the coefficient of variation (CoV) of R1 and R2 between repeated acquisitions. We used analysis of covariance (ANCOVA) (23) to compare r1 and r2 relaxivity constants among Feraheme, generic ferumoxytol, and MoldayION. We used a two-way analysis of variance (ANOVA) to compare the change in LV blood pool and myocardial T1 dependence on contrast agents. We used a nonparametric Mann-Whitney test to compare estimates of fMBV in normal swine. A p-value of 0.05 was considered statistically significant. Statistical analyses were performed using MedCalc 19.0.5 (MedCalc Software, Ostend, Belgium).
RESULTS
In Vitro MRI Relaxometry of Feraheme, MoldayION, and Generic Ferumoxytol
The r1 and r2 relaxivity constants and corresponding relaxivity curves for Feraheme, MoldayION, and generic ferumoxytol are shown in Table 1 and Figure 1. The r1/r2 ratio for Feraheme, MoldayION, and generic ferumoxytol in saline at 3.0T were 0.063, 0.079, and 0.079, respectively. Relative to Feraheme and generic ferumoxytol, MoldayION showed higher r1. In saline, Feraheme had the highest r2 relaxivity at 3.0T. Computed pixel-wise grayscale R1 and R2 maps of the contrast phantoms illustrate increasing R1 and R2 with increasing contrast concentration (Figure 2). A comprehensive summary of R1 and R2 relaxation rates at different contrast concentrations is provided in Table S3. We observed a highly linear correlation (R2 > 0.99) between R1 and contrast concentration for all three contrast agents in saline and in plasma (Figure 1). A two-way ANCOVA found statistically significant differences in the variance of R1 with contrast concentration among the three agents. R2 was also highly linear (R2 ≥ 0.99) with contrast concentration in all media (Figure 1; Table S3). Moreover, a two-way ANCOVA also found a significant difference in R2 among contrast agents. We found a coefficient of variation of 3.7% (95% confidence interval (CI) 2.8 – 4.6%) for R1 and 9.4% (95% CI 7.0 – 11.8%) for R2 between the two repeated acquisitions.
Table 1:
Relaxivity constants for Feraheme, MoldayION, and generic ferumoxytol in normal saline, human plasma, and human whole blood at 3.0T (22° C).
| Contrast | Medium | r1 relaxivity (mM−1s−1) | SE | R2 | r2 relaxivity (mM−1s−1) | SE | R2 |
|---|---|---|---|---|---|---|---|
|
| |||||||
| Feraheme (AMAG) | Saline | 7.11 | 0.13 | 1.00 | 111.74 | 3.76 | 1.00 |
| Plasma | 7.83 | 0.07 | 1.00 | 98.61 | 0.92 | 1.00 | |
| Blood | 6.68 | 0.20 | 1.00 | 123.60 | 5.22 | 1.00 | |
|
| |||||||
| MoldayION (BioPal) | Saline | 8.62 | 0.16 | 1.00 | 109.68 | 2.56 | 1.00 |
| Plasma | 9.14 | 0.47 | 0.99 | 112.35 | 2.88 | 1.00 | |
| Blood | 7.55 | 0.21 | 1.00 | 138.02 | 8.90 | 0.99 | |
|
| |||||||
| Generic Ferumoxytol (Sandoz) | Saline | 8.30 | 0.29 | 1.00 | 105.07 | 2.20 | 1.00 |
| Plasma | 8.30 | 0.17 | 1.00 | 101.11 | 0.24 | 1.00 | |
| Blood | 7.30 | 0.22 | 1.00 | 129.64 | 8.70 | 0.99 | |
Note: ΔR1 = r1*C and ΔR2 = r2*C, where r1 and r2 are the relaxivity constants (mM−1s−1) and C is the iron concentration (mM). A two-way analysis of covariance (ANCOVA) found a significant difference in the variance of R1 (p<0.001) or R2 (p=0.001) among the three contrast agents. SE, standard error.
Figure 1:
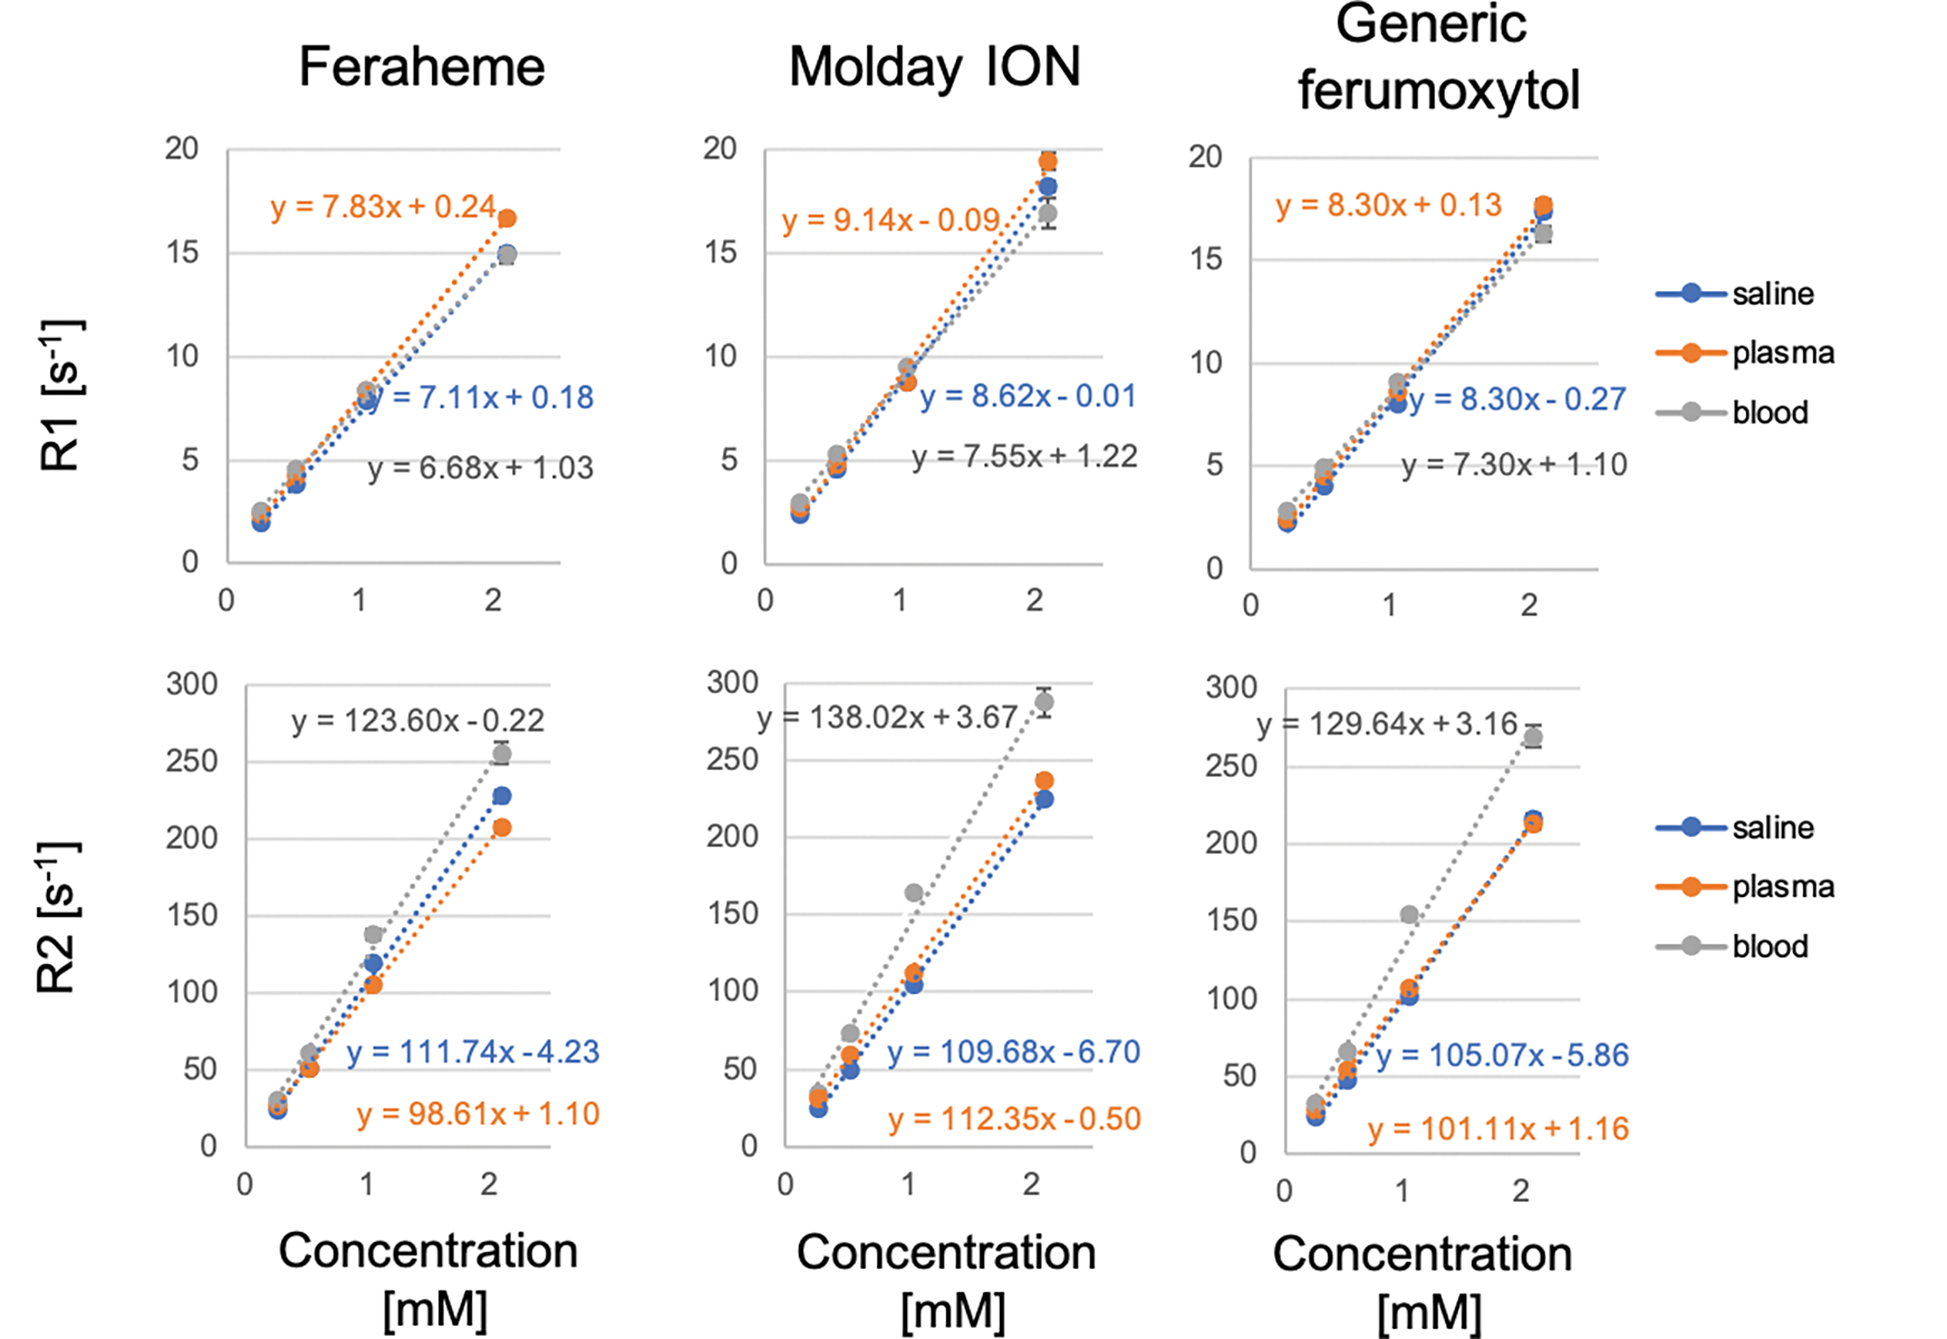
In-vitro magnetic resonance relaxometry of Feraheme, MoldayION and generic ferumoxytol was measured in saline, plasma, and whole blood (3.0T, 22° C). r1 relaxivity was measured using an inversion recovery spin echo while r2 relaxivity was measured using a spin echo sequence across contrast concentration range of 0.26–2.10 mM. R1 and R2 relaxation rates are plotted against contrast concentration to determine r1 and r2 relaxivity. Note: some error bars are too small for depiction.
Figure 2:

Grayscale pixelwise R1 (left) and R2 (right) maps of phantoms consisting of Feraheme, MoldayION and generic ferumoxytol in saline, whole blood, and plasma (3.0T, coronal view) across contrast concentration range of 0.26–2.10 mM. Inversion recovery spin echo and spin echo magnitude images of control and contrast-doped phantoms were fitted in MATLAB (MathWorks, Natick, MA) using a nonlinear least-squares fitting algorithm to generate R1 (left) and R2 (right) maps. A contrast concentration of 1.0 mM corresponds to an in-vivo dose of approximately 4.0 mg/kg.
In Vivo MRI Performance of Feraheme, MoldayION, And Generic Ferumoxytol
Seven swine received MoldayION, eight received Feraheme, and one received generic ferumoxytol (Figure S1). No contrast-related hypotension (defined as a decrease in systolic blood pressure of >20mmHg) occurred within 6–8 hours post contrast administration. We observed a mean heart rate (HR) of 91±13 bpm, systolic blood pressure (SBP) of 98±5 mmHg, and diastolic blood pressure (DBP) of 58±5 mmHg in the MoldayION group and a mean HR of 83±6 bpm, SBP of 92±11 mmHg, and DBP of 59±11 mmHg in the Feraheme group.
We found the imaging performance of Feraheme, MoldayION, and generic ferumoxytol at 3.0T using T1w (MUSIC, VIBE) and T2w (HASTE) imaging pulse sequences to be similar. MUSIC images acquired with Feraheme, MoldayION, and generic ferumoxytol showed similar SNR in the LV blood pool (46.9, 43.0±8.8, and 49.9 respectively) and skeletal muscle (10.9, 7.2±2.0, 9.1, respectively) (Figure 3). The LVEF, LVEDV, LVESV, and LV SV derived from 4D MUSIC images are reported in Table S4. 4D MUSIC images from one swine which received MoldayION was excluded from the LVEF and volume quantification due to low image quality secondary to ECG mistriggering. On T1w 3D-VIBE, MoldayION showed the expected positive contrast enhancement of the liver (pre-, post-contrast SNR: 231.9±73.5, 317.5±149.6), and spleen (pre-, post-contrast SNR: 186.3±57, 285.9±128.9) (Figure 4). Representative pre- and post-contrast coronal HASTE images with MoldayION, Feraheme, and generic ferumoxytol are shown in Figure 5. Post-MoldayION HASTE images of the liver showed the expected negative contrast enhancement and low signal from the vascular liver parenchyma (pre-, post-contrast SNR: 58.7±30.9, 8.8±5.8) with low liver-blood pool contrast (CNR 0.1±5.6). On VIBE and HASTE images, the SNR (liver, spleen, skeletal muscle, and blood pool), and CNR (liver, spleen, and skeletal muscle relative to blood) were similar across all three agents (Table 2).
Figure 3:

In vivo comparison of (A) MoldayION 4.0mg/kg, (B) Feraheme 4.0mg/kg, and (C) generic ferumoxytol 4.0mg/kg using the multiphase, steady-state imaging with contrast (MUSIC) pulse sequence at 3.0T in a representative animal. MUSIC is a 4D cardiac phase-resolved, spoiled gradient recalled echo pulse sequence that produces high spatial resolution, contrast-enhanced, bright-blood images of the beating heart and related vasculature within a large field of view (Video S1). The intravascular fidelity and high r1/r2 ratio of MoldayION, Feraheme, and generic ferumoxytol result in bright blood pool, while the T2 effects (high r2 relaxivity of each contrast agent) contribute to the darker appearance of the highly vascularized myocardium, relative to skeletal muscle. LA (left atrium), LV (left ventricle), RA (right atrium), RV (right ventricle), SAX (short axis).
Figure 4:

In vivo comparison of non-contrast (upper) and contrast-enhanced (lower) coronal multiplanar reformatted Volumetric Interpolated Breath-hold Exam (VIBE) images in three swine with (A) MoldayION, (B) Feraheme, and (C) generic ferumoxytol at 3.0T. VIBE is a 3D T1-weighted, gradient-echo pulse sequence that depicts highly vascularized tissues and blood vessels as bright regions on MRI. A contrast dose of 4.0 mg/kg was administered approximately 60 minutes prior to acquisition of contrast-enhanced images. Contrast-enhanced images show greater conspicuity of hypervascularized tissues (liver) and vasculature compared to darker signal in less vascularized tissues (skeletal muscle). MoldayION, Feraheme, and generic ferumoxytol produce comparable contrast enhancement (see Video S2 for multi-slice images).
Figure 5:

In vivo comparison of non-contrast (upper images) and contrast-enhanced (lower images) (A) MoldayION, (B) Feraheme, and (C) generic ferumoxytol using Half-Fourier-Acquired Single-shot Turbo spin Echo (HASTE) at 3.0T. HASTE is a fast T2-weighted pulse sequence used for sequential acquisition of 2D slices. On non-contrast images, fluid is typically bright (hyperintense) and moving blood is typically dark (hypointense), but variable blood flow can cause non-uniform blood signal suppression with HASTE. A contrast dose of 4.0 mg/kg was administered approximately 60 minutes prior to acquisition of contrast-enhanced images. The contrast agents comparably induced homogenous signal suppression of moving blood, most noticeably in the thoracic vascular lumen and intracardiac blood pool. The inherent T2-weighting of HASTE results in highly vascularized tissues (such as the liver) appearing dark (hypointense) post-contrast relative to gray (isointense) areas on corresponding non-contrast images.
Table 2:
SNR and CNR of HASTE and VIBE images with Feraheme, MoldayION, and Generic Ferumoxytol contrast.
| Signal-to-noise ratio (SNR) | ||||||
|
|
||||||
| T2w HASTE* | T1w VIBE* | |||||
|
| ||||||
| Tissue | Feraheme | Molday ION | Generic Ferumoxytol | Feraheme | Molday ION | Generic Ferumoxytol |
|
| ||||||
| Blood | 8.3 | 8.6±4.0 | 9.6 | 482.8 | 459.1±171.8 | 723.9 |
| Muscle | 69.9 | 57.5±33.9 | 72.9 | 147.4 | 123.9±41.2 | 127.2 |
| Liver | 6.3 | 8.8±5.8 | 7.3 | 310.3 | 317.5±149.6 | 365.1 |
| Spleen | 34.8 | 49.6±45.7 | 83.4 | 261.8 | 285.9±128.9 | 279.2 |
| Contrast-to-noise ratio (CNR) | ||||||
|
|
||||||
| T2w HASTE* | T1w VIBE* | |||||
|
| ||||||
| Tissue | Feraheme | Molday ION | Generic Ferumoxytol | Feraheme | Molday ION | Generic Ferumoxytol |
|
| ||||||
| Muscle | 61.6 | 48.9±32.7 | 66.4 | −335.3 | −335.2±133.8 | −596.8 |
| Liver | −2.0 | 0.1±5.6 | 0.8 | −172.5 | −141.6±29.9 | −358.9 |
| Spleen | 26.5 | 41±45.5 | 76.8 | −221.0 | −173.2±52.5 | −444.8 |
SNR of blood pool (descending aorta), longissimus (skeletal) muscle, liver, and spleen from regions of interest drawn on coronal HASTE and axial VIBE images. The Feraheme, MoldayION, and generic ferumoxytol contrast dose was 4.0 mg/kg. CNR of longissimus muscle, liver, and spleen relative to blood pool were calculated based on signal intensity measurements from regions of interest on post-contrast HASTE and VIBE images.
Mean SNR and CNR reported in Feraheme (N = 1 swine) and Generic Ferumoxytol (N = 1) cohorts; SNR and CNR reported as mean ± SD in MoldayION cohort (N = 16 swine).
HASTE, Half-Fourier-Acquired Single-shot Turbo spin Echo; VIBE, Volumetric Interpolated Breath-hold Exam
For functional, quantitative MRI using MOLLI T1 mapping, all three USPIOs showed closely comparable post-contrast T1 shortening. Across all swine, we found a mean MoldayION-enhanced T1 of 103±16 ms in the LV blood pool and 832±107 ms in the myocardium. We observed similar T1 values with Feraheme (LV blood pool: 112 ms [109, 119 ms]; myocardium: 860±47 ms) and generic ferumoxytol (LV blood pool: 94±2.5 ms; myocardium: 764±16 ms). We defined Δ T1(%) = (T1post −T1pre)*100 (T1post, post-contrast T1; T1pre, pre-contrast T1). Overall, MoldayION induced a mean Δ T1 shortening of −94.7±0.7% and −40.8±6.3% in the LV blood pool and myocardium, respectively. Feraheme induced a median Δ T1 shortening of −94.2% (−94.4, −93.7) and −38.3±3.2%, respectively. Generic ferumoxytol caused a mean Δ T1 of −95±0.0% and −43±1.4% in the LV blood pool and myocardium. Two-way ANOVA found no significant difference in myocardial T1 (p=0.08) or blood pool T1 (p=0.933) between MoldayION and Feraheme.
As a method to map the fractional intravascular distribution volume in solid tissues, T1 mapping with the three USPIOs produced similar fMBV (Figure 6) in normal swine models. We found a median fMBV of 8.7% (7.4, 10.6%) in normal swine imaged with MoldayION (N=4 swine, 64 segments), a mean fMBV of 8.6±2.2% when imaged with Feraheme (N=5 swine, 80 segments), and a mean fMBV of 6.7±1.5% (N=1 swine, 16 segments) with generic ferumoxytol. No significant difference in fMBV between the MoldayION and Feraheme groups (p=0.13) was observed. In the MoldayION group, we found a mean FBV of 44.1±7.5% in the liver and 23.9±5.5% in the spleen. With Feraheme, we observed a mean FBV of 58.8% in the liver and 17.1% in the spleen. With generic ferumoxytol, we computed a mean FBV of 58.8% in the liver and 15.9% in the spleen.
Figure 6:
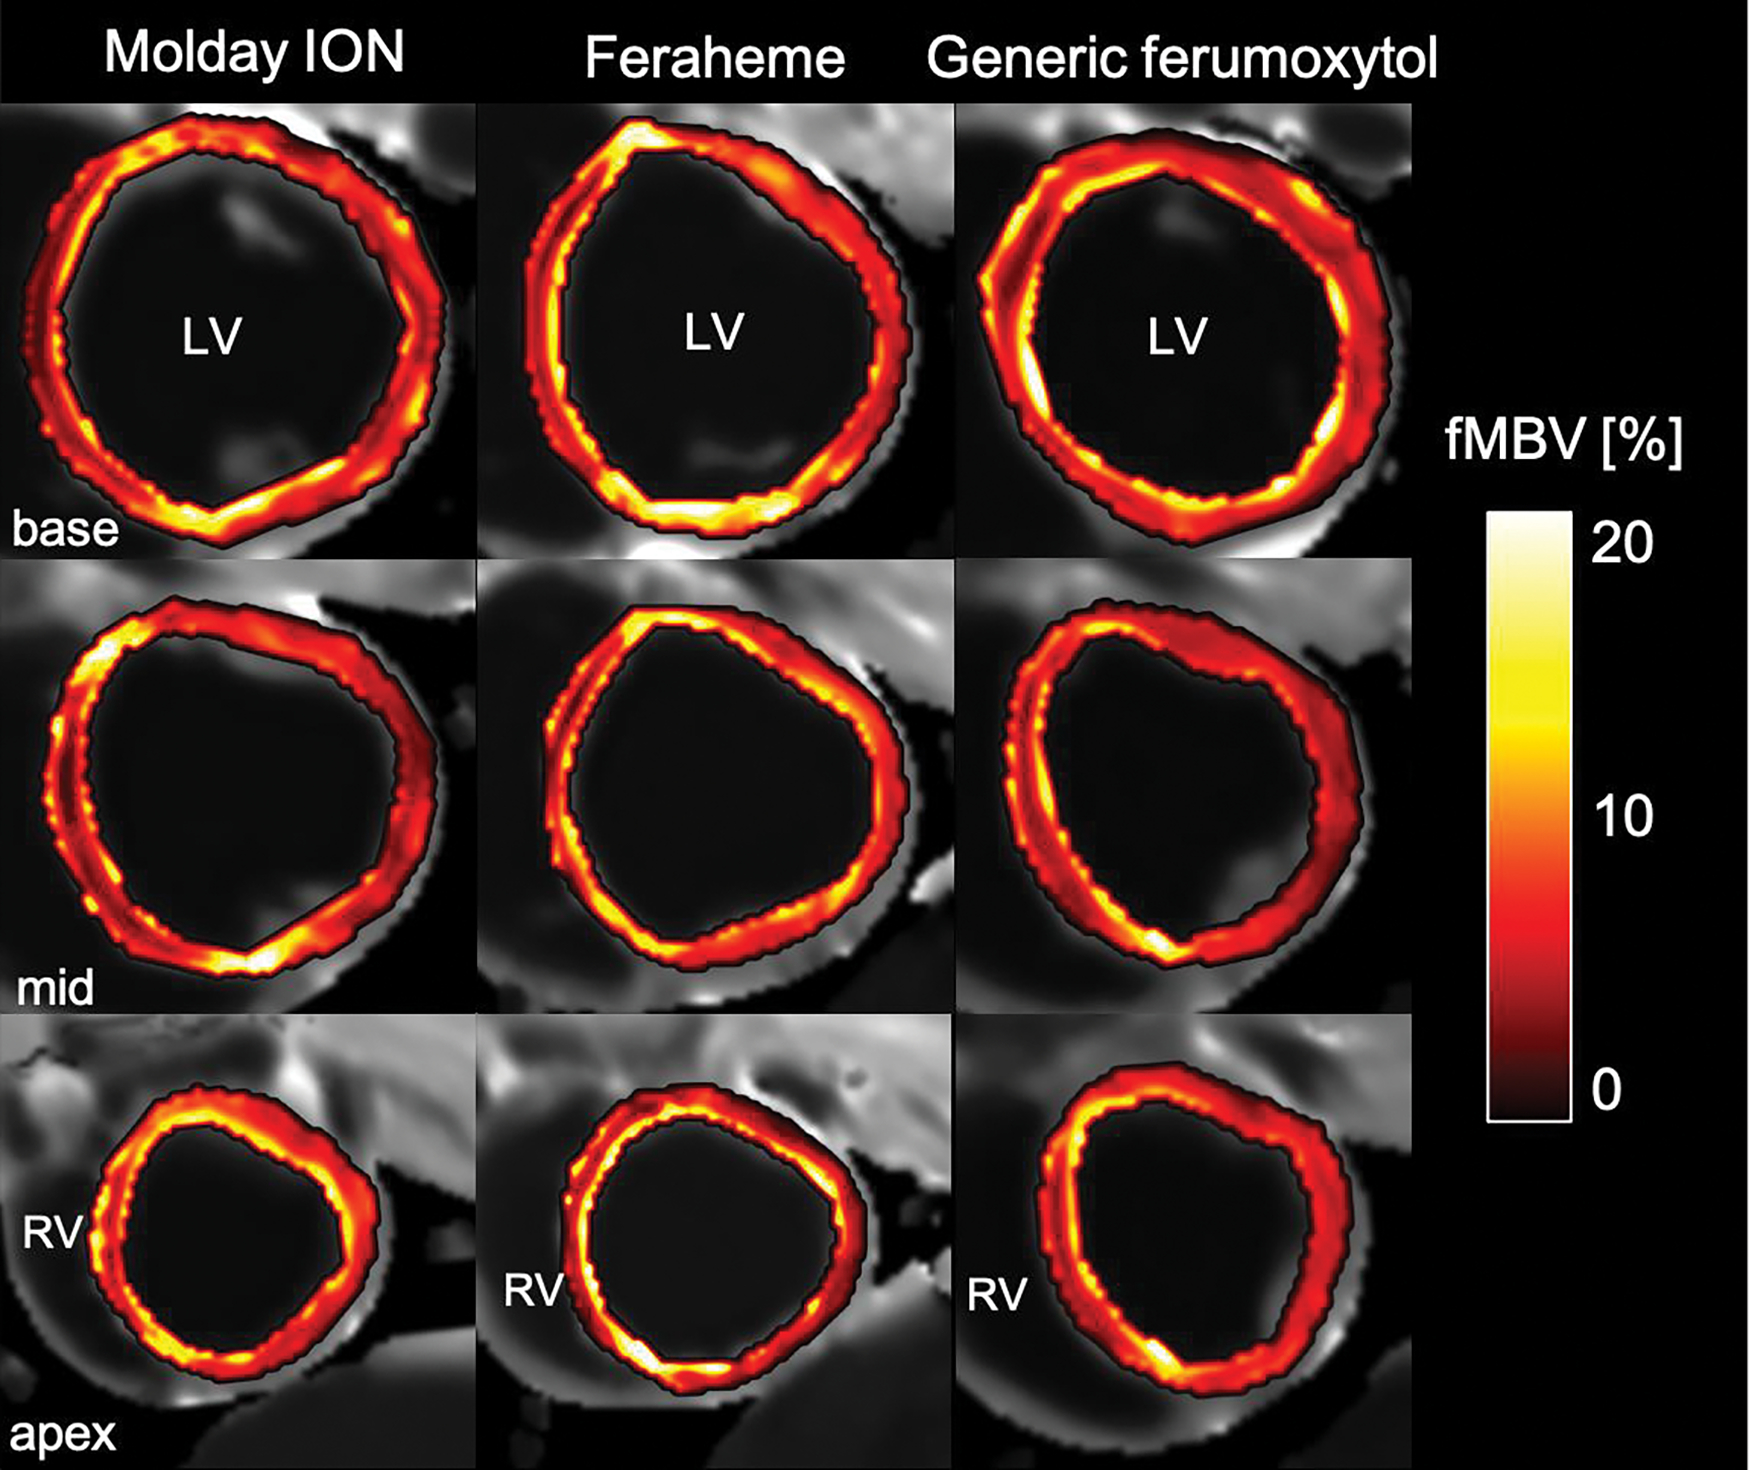
Representative pixel-wise fractional myocardial blood volume (fMBV) maps of the left ventricular (LV) short-axis in normal swine. The fBMV maps are computed from MOLLI T1 images acquired at steady-state contrast administration of MoldayION (left panel, 4 mg/kg), Feraheme (center panel), 4 mg/kg), or generic ferumoxytol (right panel, 4 mg/kg). These maps provide illustrative examples for quantitative mapping of the fractional intravascular contrast distribution volume as surrogates of tissue vascularity within solid organs. MOLLI, modified Look-Locker inversion
DISCUSSION
In this study, we compared the in vitro and in vivo MRI performance of Molday ION, Feraheme, and generic ferumoxytol contrast agents. Relative to Feraheme and generic ferumoxytol, MoldayION had higher r1 relaxivity at 3.0T. In saline, the r2 relaxivity was highest for Feraheme. SNR and CNR values of post-contrast images acquired using VIBE and HASTE pulse sequences were indistinguishable. Relative to both ferumoxytol formulations, MoldayION produced the expected positive T1 contrast on T1w pulse sequences (4D MUSIC and VIBE), and the expected negative T2 contrast on T2w HASTE images in healthy swine. All three agents also produced comparable blood T1 shortening and similar fractional intravascular contrast distribution volume in myocardium, liver, and spleen of normal swine using MOLLI T1 mapping. Due to high intravascular and low extracellular concentration, visual inspection of parenchymal enhancement can be limited.
The core diameter of a USPIO agent is closely coupled with its magnetic susceptibility, and consequently its relaxivity (24). The iron oxide crystallite core is complexed with a low molecular weight semi-synthetic carbohydrate shell. The uniquely high r1/r2 ratio of Feraheme, MoldayION, and generic ferumoxytol makes all 3 agents desirable for T1w (bright-blood) imaging. These are attractive features for applications that enable theranostic use. Relative to both ferumoxytol formulations, MoldayION has a slightly lower particle size range (17–32 nm) with a shorter expected intravascular half-life due to its lower zeta potential (−4.8 mV) (MoldayION package insert, BioPAL). Our study, however, did not directly address the relative blood half-lives of the respective agents. Feraheme has a mean hydrodynamic diameter of 30 nm (25), and a stated intravascular half-life of 10–14 hours (2). Compared to those of Knobloch et al., our in vitro relaxometry results for Feraheme demonstrated lower r1 relaxivity values in saline and plasma at 3.0T. We observed an r1 relaxivity of 7.11±0.13 mM−1s−1 in saline and 7.83±0.07 mM−1s−1 in plasma at 22° C, while Knobloch et al report values of 10.0±0.3 mM−1s−1 and 9.5±0.2 mM−1s−1 at 37° C (1). Our methods differed from those used by Knobloch et al in several ways. Although the magnet field strengths were both 3.0T, the manufacturers were different. We also imaged our sample tubes in air at ambient temperature (22° C), while Knobloch et al. maintained their samples at 37° C (1). Despite variation in the in-vitro relaxivity values among the agents, our in vivo imaging results showed that the three USPIOs induce similar contrast effects on representative T1w and T2w pulse sequences at 3.0T.
Linearity of MRI contrast agent relaxation rates (R1 and R2), corresponding to constant r1 and r2 relaxivity values over the diagnostic dose range, is an important assumption made by many pharmacologic models (26, 27). For a theoretical 75 kg patient with a total circulating blood volume of 5 liters, a ferumoxytol dose of 4.0 mg/kg maps to a blood concentration of approximately 1 milli mole per liter (mmol/L) or 1mM. The concentrations used in our in-vitro imaging study range from 0.26 – 2.10 mM, or a corresponding in vivo dose range of approximately 1 mg/kg to 8 mg/kg. Our relaxometry study and previous work (1) indicate largely linear R1 and R2 with contrast concentration up to 8 mg/kg, twice the maximum dose used in our in-vivo swine study and for typical off-label diagnostic purposes in patients (28).
In clinical practice, sometimes T1w 3D-VIBE or 4D-MUSIC bright-blood imaging pulse sequences are used with T2w 2D-HASTE dark-blood imaging to evaluate the morphology of the vascular lumen and vessel walls on MRI exams. The signal from native blood pool on HASTE images is highly variable, due to the complex interplay between radiofrequency pulses and pulsatile blood flow through and within the slice (29). Although many technically sophisticated methods exist to suppress blood signal on MR images, the results can be unreliable and technique dependent. Feraheme has been shown to suppress intraluminal blood signal reliably on HASTE images without any magnetization preparation or flow dephasing maneuvers, based purely on T2 effects (6). Our results from the current in vivo experiments indicate that MoldayION performed comparably to both formulations of ferumoxytol and shows promise as a viable candidate for further exploration.
While gadolinium-based contrast agents (GBCAs) are powerful and have proven value over a wide range of diagnostic applications, there are persistent concerns about long term tissue deposition even in the setting of normal kidney function (30). Despite diminished concerns about nephrogenic systemic fibrosis in patients with impaired renal function, rare occurrence could be fatal and the mechanisms remain ill-defined (31). Additionally, in the context of pharmacokinetic models, using true intravascular contrast agents can eliminate the need to account for contrast leakage into the extravascular space (32). Intravascular USPIOs and extravasating GBCAs also have the potential to be used in concert for complementary applications and is a topic of ongoing work in our lab.
Limitations
First, the small number of animal subjects included in the study is a notable limitation. Second, our measurements were made at 3.0T and extrapolation to other field strengths can only be inferred. Third, the fitting of in-vitro r2 relaxivity measurements in plasma and blood did not account for factors related to water-protein interactions at the molecular and cellular level. Although the phantoms were inverted between each imaging session, the lengthy nature of the single-echo spin echo experiments may have resulted in the settling of erythrocytes and proteinaceous material that may affect the variance of the R1 and R2 measurements in the plasma and blood phantoms. Fourth, while MoldayION showed promise as an intravascular imaging agent in our in-vivo study of normal swine models, no human data are yet available. In the meantime, further work will be required to characterize the biodistribution and metabolism of MoldayION, its biological half-life, the optimal dose for various applications, and its overall safety profile before it may be considered for use in human subjects. Last, all intravenous iron agents carry a risk of minor infusion reactions including chest or lumbar discomfort and flushing (11). Although Feraheme has been associated with serious adverse events including fatalities at therapeutic doses (510 mg Fe) administered as a bolus infusion over 17 seconds (33), its safety profile for off-label diagnostic MRI in multicenter settings has been favorable to date (11).
Conclusion
Despite minor differences in the in-vitro relaxometry of MoldayION relative to clinically approved ferumoxytol formulations, MoldayION, Feraheme and generic ferumoxytol demonstrate comparable in-vivo MRI characteristics at 3.0T. MoldayION shows promise as a candidate for further testing, development, and possible use in humans as an alternative to existing ferumoxytol formulations.
Supplementary Material
Acknowledgements:
We thank staff members at the UCLA Lux Lab, the UCLA Translational Research Imaging Center (TRIC), the Division of Laboratory Animal Medicine at UCLA, and the UCLA Clinical Translational Research Center (CTRC). We thank cardiac MRI technologists at the VA West Los Angeles Medical Center. We also thank MRI physicists at Siemens Healthcare for facilitating the access and usage of the MOLLI work-in-progress sequence (Siemens WIP 1080C) in this study. We especially thank Dr. Xiaodong Zhong for additional information about the Siemens multi-echo spin echo pulse sequence. We thank BioPal Incorporated for providing samples of MoldayION. The authors had complete oversight of the study design, data collection, data analysis, and drafting of the manuscript.
Grant support:
This work is supported by grants from the Veterans Health Administration (I01-CX001901), the National Institutes of Health (R01HL148182, R01HL127153), and Siemens Medical Solutions (Malvern, Pennsylvania).
ABBREVIATIONS
- GBCA
Gadolinium-based contrast agent
- HASTE
Half-Fourier-Acquired Single-shot Turbo-spin Echo
- MOLLI
Modified Look-Locker Recovery Inversion
- MUSIC
Multiphase Steady-state Imaging with Contrast
- ROI
Region of interest
- T1w
T1-weighted
- T2w
T2-weighted
- TE
Echo time
- TI
Inversion time
- TR
Repetition time
- USPIO
Ultrasmall superparamagnetic iron oxide
- VIBE
Volumetric interpolated breath-hold exam
REFERENCES
- 1.Knobloch G, Colgan T, Wiens CN, et al. : Relaxivity of Ferumoxytol at 1.5 T and 3.0 T. Invest Radiol 2018; 53:257–263. [DOI] [PMC free article] [PubMed] [Google Scholar]
- 2.Li W, Tutton S, Vu AT, et al. : First-pass contrast-enhanced magnetic resonance angiography in humans using ferumoxytol, a novel ultrasmall superparamagnetic iron oxide (USPIO)-based blood pool agent. J Magn Reson Imaging 2005; 21:46–52. [DOI] [PubMed] [Google Scholar]
- 3.Hasan DM, Amans M, Tihan T, et al. : Ferumoxytol-Enhanced MRI to Image Inflammation Within Human Brain Arteriovenous Malformations: A Pilot Investigation. Transl Stroke Res 2012; 3(SUPPL. 1):166–173. [DOI] [PMC free article] [PubMed] [Google Scholar]
- 4.Bashir MR, Bhatti L, Marin D, Nelson RC: Emerging applications for ferumoxytol as a contrast agent in MRI. J Magn Reson Imaging 2015:884–898. [DOI] [PubMed] [Google Scholar]
- 5.Ledda M, Fioretti D, Lolli MG, et al. : Biocompatibility assessment of sub-5 nm silica-coated superparamagnetic iron oxide nanoparticles in human stem cells and in mice for potential application in nanomedicine. Nanoscale 2020; 12:1759–1778. [DOI] [PubMed] [Google Scholar]
- 6.Nguyen K-L, Park EA, Yoshida T, Hu P, Finn JP: Ferumoxytol enhanced black-blood cardiovascular magnetic resonance imaging. J Cardiovasc Magn Reson 2017; 19. [DOI] [PMC free article] [PubMed] [Google Scholar]
- 7.Finn JP, Nguyen KL, Han F, et al. : Cardiovascular MRI with ferumoxytol. Clin Radiol 2016; 71:796–806. [DOI] [PMC free article] [PubMed] [Google Scholar]
- 8.Bane O, Lee DC, Benefield BC, et al. : Leakage and water exchange characterization of gadofosveset in the myocardium. Magn Reson Imaging 2014; 32:224–235. [DOI] [PMC free article] [PubMed] [Google Scholar]
- 9.Colbert CM, Thomas MA, Yan R, et al. : Estimation of fractional myocardial blood volume and water exchange using ferumoxytol-enhanced magnetic resonance imaging. J Magn Reson Imaging 2021; 53:1699–1709. [DOI] [PMC free article] [PubMed] [Google Scholar]
- 10.Toth GB, Varallyay CG, Horvath A, et al. : Current and potential imaging applications of ferumoxytol for magnetic resonance imaging. Kidney Int 2017:47–66. [DOI] [PMC free article] [PubMed] [Google Scholar]
- 11.Nguyen K-L, Yoshida T, Kathuria-Prakash N, et al. : Multicenter Safety and Practice for Off-Label Diagnostic Use of Ferumoxytol in MRI. Radiology 2019; 293:554–564. [DOI] [PMC free article] [PubMed] [Google Scholar]
- 12.Mcfadden C, Mallett CL, Foster PJ: Labeling of multiple cell lines using a new iron oxide agent for cell tracking by MRI. Contrast Media Mol Imaging 2011; 6:514–522. [DOI] [PubMed] [Google Scholar]
- 13.Krishna: Estimation of tumor microvessel density by MRI using a blood pool contrast agent. Int J Oncol 2009; 35. [DOI] [PMC free article] [PubMed] [Google Scholar]
- 14.Sharma S, Mantini D, Vanduffel W, Nelissen K: Functional specialization of macaque premotor F5 subfields with respect to hand and mouth movements: A comparison of task and resting-state fMRI. Neuroimage 2019; 191:441–456. [DOI] [PubMed] [Google Scholar]
- 15.Wang F, Jiang RT, Tantawy MN, et al. : Repeatability and sensitivity of high resolution blood volume mapping in mouse kidney disease. J Magn Reson Imaging 2014; 39:866–871. [DOI] [PMC free article] [PubMed] [Google Scholar]
- 16.Messroghli DR, Greiser A, Fröhlich M, Dietz R, Schulz-Menger J: Optimization and validation of a fully-integrated pulse sequence for modified look-locker inversion-recovery (MOLLI) T1 mapping of the heart. J Magn Reson Imaging 2007; 26:1081–1086. [DOI] [PubMed] [Google Scholar]
- 17.Rofsky NM, Lee VS, Laub G, et al. : Abdominal MR imaging with a volumetric interpolated breath-hold examination. Radiology 1999; 212:876–884. [DOI] [PubMed] [Google Scholar]
- 18.Semelka RC, Kelekis NL, Thomasson D, Brown MA, Laub GA: HASTE MR imaging: Description of technique and preliminary results in the abdomen. J Magn Reson Imaging 1996; 6:698–699. [DOI] [PubMed] [Google Scholar]
- 19.Han F, Rapacchi S, Khan S, et al. : Four-dimensional, multiphase, steady-state imaging with contrast enhancement (MUSIC) in the heart: A feasibility study in children. Magn Reson Med 2015; 74:1042–1049. [DOI] [PubMed] [Google Scholar]
- 20.Shao J, Nguyen K-L, Natsuaki Y, Spottiswoode B, Hu P: Instantaneous signal loss simulation (InSiL): An improved algorithm for myocardial T1 mapping using the MOLLI sequence. J Magn Reson Imaging 2015; 41:721–729. [DOI] [PubMed] [Google Scholar]
- 21.Klein S, Staring M, Murphy K, Viergever MA, Pluim JPW: Elastix: A toolbox for intensity-based medical image registration. IEEE Trans Med Imaging 2010; 29:196–205. [DOI] [PubMed] [Google Scholar]
- 22.Cerqueira MD, Weissman NJ, Dilsizian V, et al. : Standardized myocardial segmentation and nomenclature for tomographic imaging of the heart: A Statement for Healthcare Professionals from the Cardiac Imaging Committee of the Council on Clinical Cardiology of the American Heart Association. Circulation 2002:539–542. [DOI] [PubMed] [Google Scholar]
- 23.Wildt A, Ahtola O: Analysis of Covariance. Thousand Oaks, CA: SAGE Publications, Inc.; 1978. [Google Scholar]
- 24.Khandhar AP, Wilson GJ, Kaul MG, Salamon J, Jung C, Krishnan KM: Evaluating size-dependent relaxivity of PEGylated-USPIOs to develop gadolinium-free T1 contrast agents for vascular imaging. J Biomed Mater Res Part A 2018; 106:2440–2447. [DOI] [PubMed] [Google Scholar]
- 25.Bullivant JP, Zhao S, Willenberg BJ, Kozissnik B, Batich CD, Dobson J: Materials characterization of feraheme/ferumoxytol and preliminary evaluation of its potential for magnetic fluid hyperthermia. Int J Mol Sci 2013; 14:17501–17510. [DOI] [PMC free article] [PubMed] [Google Scholar]
- 26.Sourbron S: Technical aspects of MR perfusion. Eur J Radiol 2010; 76:304–313. [DOI] [PubMed] [Google Scholar]
- 27.Rivera-Rivera LA, Schubert T, Knobloch G, et al. : Comparison of ferumoxytol-based cerebral blood volume estimates using quantitative R1 and R2* relaxometry. Magn Reson Med 2018; 79:3072–3081. [DOI] [PMC free article] [PubMed] [Google Scholar]
- 28.Nguyen K-L, Yoshida T, Han F, et al. : MRI with ferumoxytol: A single center experience of safety across the age spectrum. J Magn Reson Imaging 2017; 45:804–812. [DOI] [PMC free article] [PubMed] [Google Scholar]
- 29.Bradley WG: Flow phenomena in MR imaging. Am J Roentgenol 1988; 150:983–994. [DOI] [PubMed] [Google Scholar]
- 30.Guo BJ, Yang ZL, Zhang LJ: Gadolinium Deposition in Brain: Current Scientific Evidence and Future Perspectives. Front Mol Neurosci 2018:335. [DOI] [PMC free article] [PubMed] [Google Scholar]
- 31.Fraum TJ, Ludwig DR, Bashir MR, Fowler KJ: Gadolinium-based contrast agents: A comprehensive risk assessment. J Magn Reson Imaging 2017:338–353. [DOI] [PubMed] [Google Scholar]
- 32.Peters AM: Fundamentals of tracer kinetics for radiologists. Br J Radiol 1998:1116–1129. [DOI] [PubMed] [Google Scholar]
- 33.FDA Drug Safety Communication: FDA strengthens warnings and changes prescribing instructions to decrease the risk of serious allergic reactions with anemia drug Feraheme (ferumoxytol). [https://www.fda.gov/drugs/drug-safety-and-availability/fda-drug-safety-communication-fda-strengthens-warnings-and-changes-prescribing-instructions-decrease]
Associated Data
This section collects any data citations, data availability statements, or supplementary materials included in this article.