

Summary
Trees constitute promising renewable feedstocks for biorefinery using biochemical conversion, but their recalcitrance restricts their attractiveness for the industry. To obtain trees with reduced recalcitrance, large‐scale genetic engineering experiments were performed in hybrid aspen blindly targeting genes expressed during wood formation and 32 lines representing seven constructs were selected for characterization in the field. Here we report phenotypes of five‐year old trees considering 49 traits related to growth and wood properties. The best performing construct considering growth and glucose yield in saccharification with acid pretreatment had suppressed expression of the gene encoding an uncharacterized 2‐oxoglutarate‐dependent dioxygenase (2OGD). It showed minor changes in wood chemistry but increased nanoporosity and glucose conversion. Suppressed levels of SUCROSE SYNTHASE, (SuSy), CINNAMATE 4‐HYDROXYLASE (C4H) and increased levels of GTPase activating protein for ADP‐ribosylation factor ZAC led to significant growth reductions and anatomical abnormalities. However, C4H and SuSy constructs greatly improved glucose yields in saccharification without and with pretreatment, respectively. Traits associated with high glucose yields were different for saccharification with and without pretreatment. While carbohydrates, phenolics and tension wood contents positively impacted the yields without pretreatment and growth, lignin content and S/G ratio were negative factors, the yields with pretreatment positively correlated with S lignin and negatively with carbohydrate contents. The genotypes with high glucose yields had increased nanoporosity and mGlcA/Xyl ratio, and some had shorter polymers extractable with subcritical water compared to wild‐type. The pilot‐scale industrial‐like pretreatment of best‐performing 2OGD construct confirmed its superior sugar yields, supporting our strategy.
Keywords: enzymatic saccharification, field trial, secondary cell wall, SilviScan, subcritical water extraction, transgenic Populus
Five‐year field experiment with GM aspen targeting genes involved in wood formation identified a 2‐oxoglutarate‐dependent digoxygenase which suppression increased growth and saccharification yields after a pilot‐scale industrial‐like pretreatment.

Introduction
Wood is the most abundant, naturally degradable and renewable carbon source on Earth (Bar‐On et al., 2018), and technologies are currently being developed allowing its complete utilization. In biochemical conversion, pretreatment is used as an initial fractionation facilitating enzymatic saccharification of cellulose prior to microbial fermentation of sugars and recovery of hydrolysis lignin (Martín et al., 2022). However, the recalcitrance of wood hampers its biochemical conversion, which is problematic considering that mild reaction conditions with low input of chemicals and energy, and high product yields are important for sustainable and competitive processes (Li et al., 2014; Martín et al., 2022). Thus, overcoming recalcitrance and achieving high sugar yields are main priorities in developing new generation biorefinery feedstocks.
Hardwood species including fast‐growing poplars or aspens are well suited for biochemical conversion provided that their recalcitrance is reduced (Hinchee et al., 2009; Ko et al., 2020; Kumar and Verma, 2021; Sannigrahi et al., 2010). Recalcitrance is a multiscale phenomenon, related not only to the composition and molecular structure of the different lignocellulosic components but also to their supramolecular interactions and hierarchical organization (Himmel et al., 2007; McCann and Carpita, 2015; Silveira et al., 2013). It could be reduced by breeding, which is a slow process in trees, or by more direct genetic engineering of wood (Chanoca et al., 2019; Donev et al., 2018). There are many examples of recalcitrance reduction by genetic engineering (Biswal et al., 2014, 2015; Eudes et al., 2012; Gandla et al., 2015; Hao et al., 2021; Macaya‐Sanz et al., 2017; Park et al., 2004; Pawar et al., 2017; Wilkerson et al., 2014). In some cases, the beneficial impact on enzymatic saccharification comes at the expense of growth and survival (Gandla et al., 2015; Van Acker et al., 2014), which calls for better understanding of plant traits related to saccharification. Moreover, in most cases, transgenic plants are tested in the greenhouse experiments. It is however recognized that novel off‐target effects can be observed in genetically engineered trees in the field (Derba‐Maceluch et al., 2020; Funahashi et al., 2014; Pramod et al., 2021; Strauss et al., 2016; Taniguchi et al., 2012). Therefore, there is a need to generate more field experimental data to identify promising genetic engineering strategies that improve tree productivity and wood properties in woody feedstocks designated for biochemical conversion.
The aim of this study was to evaluate the productivity and wood properties related to biochemical conversion of field‐grown transgenic hybrid aspen (Populus tremula L. × tremuloides Michx.) lines that were selected by extensive greenhouse screening and are part of a large collections of transgenic lines generated to understand and characterize the functions of genes highly expressed in wood‐forming tissues (Bjurhager et al., 2010; Escamez et al., 2017; Gerber et al., 2014). Selected constructs targeted genes encoding enzymes with known or predicted functions as well genes which functions have not yet been characterized (Table 1). The recalcitrance of analysed genotypes was assessed by analytical saccharification with and without acid pretreatment (Gandla et al., 2015), nanoporosity (Wang et al., 2019) and subcritical water extractability (Martínez‐Abad et al., 2018). Further, we have explored relationships between 49 different traits reflecting productivity, wood quality and saccharification efficiency and built predictive models for saccharification yields. The best construct was tested in a pilot‐scale pretreatment followed by analytical saccharification, to confirm its superiority in industrially relevant conditions. The study evaluates the benefits of transgenic manipulation of known and unknown genes and gives invaluable information on the importance of different traits in natural field conditions for saccharification outputs. This information can be used in tree genetic engineering as well as in tree breeding aiming at reducing recalcitrance of wood.
Table 1.
List of constructs used in this study
| Cons‐truct | Type | P. trichocarpa gene ID (v3.1) | P. tremula gene ID (v2.2) | A. thaliana ortholog | Activity | Function | References |
|---|---|---|---|---|---|---|---|
| UAP | RNAi | Potri.003G074700 | Potra2n3c7862 |
AT2G35020 GLCNA.UT2 |
UDP‐N‐acetylglucosamine pyrophosphorylase | Synthesis of glycoproteins and glycolipids | Yang et al., (2010), Chen et al. (2014) |
| SuSy | RNAi | Potri.006G136700, SUS1 | Potra2n6c14105 |
AT3G43190 SUS4 |
Sucrose synthase | Cell wall polymer biosynthesis | Gerber et al. (2014), Dominguez et al. (2021) |
| C4H | RNAi | Potri.013G157900 | Potra2n13c24959 |
AT2G30490 C4H |
Cinnamate 4‐hydroxylase | Lignin biosynthesis | Bjurhager et al. (2010), Sewalt et al. (1997) |
| SAM | RNAi | Potri.014G114700 | Potra2n14c27264 |
AT4G01850 SAM2 |
S‐adenosylmethionine synthetase | General methylation reactions | Jin et al. (2017) |
| 2OGD | RNAi | Potri.009G107600 | Potra2n9c19173 | AT3G19000 | 2‐Oxoglutarate‐dependent dioxygenase family | Unknown | |
| MYBL | OE LMP1‐promoter | Potri.006G000800 | Potra2n6c15386 | AT2G01060 | MYB‐like HTH transcriptional regulator | Unknown | |
| ZAC | OE 35 S‐promoter | Potri.001G372000 | Potra2n1c3260 |
AT4G21160 ZAC/AGD‐12 |
ARF‐GTPase‐activating protein | Vesicle trafficking | Jensen et al. (2000) |
Results
Target gene expression in transgenic lines and wild type
All targeted genes (Table 1) were initially selected based on their high expression during wood formation (Hertzberg et al., 2001). We used AspWood database (Sundell et al., 2017), which contains high‐resolution gene expression profiles in wood‐forming aspen (P. tremula L.) tissues to determine at which stage of wood development these genes are active. All targeted genes were found upregulated at the stage of secondary cell wall (SCW) formation in the xylem (Figure 1a). Their expression declined during maturation of the xylem, except for 2OGD and MYBL, which were highly expressed during late maturation stage when the only living cells are the ray parenchyma cells (Sundell et al., 2017).
Figure 1.

Analysis of target gene expression. (a) Expression pattern of target genes listed in Table 1 at different stages of wood formation in field‐grown aspen (Populus tremula L.) based on AspWood (http://aspwood.popgenie.org/aspwood‐v3.0/) database. (b–h) RT‐qPCR analysis of the target gene expression in the cambium‐enriched tissues (g) and in developing wood (b–f and h) of transgenic hybrid aspen (Populus tremula × tremuloides) lines and WT after 5 years of growth in the field for the constructs: UAP (b), SuSy (c), C4H (d), SAM (e), 2OGD (f), MYBL (g) and ZAC (h). Overexpressing lines marked with a red hash sign. Three biological replicates from each transgenic line and WT were used. Bars = SE. Asterisks show significant differences compared to WT (Dunnett's test, ・P ≤ 0.1; *P ≤ 0.05; **P ≤ 0.01; ***P ≤ 0.001). Data in (c) for SuSy lines were included in (Dominguez et al., 2021) and are shown here for comparison with other transgenic lines.
The expression levels of targeted genes were determined by RT‐qPCR (Table S1) in July 2016 during the high cambial activity period. They were measured in xylem cells developing secondary walls and for the LMP1:MYBL construct they were additionally measured in the cambium‐enriched tissues. The majority of constructs showed expected change in a target gene expression with some variation among the lines, with two exceptions; all lines of the UAP – RNAi construct showed elevated levels compared to wild‐type (WT) and should be treated as overexpressing lines, whereas the LMP1 promoter driven expression of MYBL resulted in suppressed levels of MYBL transcript in the cambium‐enriched tissues (Table S1) and no differences compared to WT in developing xylem (not shown).
Analysis of height and diameter in all lines grown in the field (Table S1) revealed growth defects in several constructs and a poor correlation between field‐ and greenhouse‐measured height (Figure S1). We subsequently selected three lines per construct for a more thorough characterization based on their strongest change in the target gene expression compared to WT, and their consistent growth behaviour with other lines of the same construct. The three lines were designated as A, B and C, where C had the strongest change in target gene expression (Figure 1). This resulted in a collection of 21 transgenic lines for in‐depth phenotypical characterization.
Growth of selected lines
Three of the analysed constructs, C4H, SuSy and ZAC, showed strong reduction in stem height, diameter and biomass (Figure 2a–d). The severity of growth defects in these lines correlated with a change in target gene expression level (Figure 1). Lines of the 2OGD construct tended to grow better than WT, and their growth improvement correlated with target gene suppression level (Figures 1 and 2). SAM lines had inconsistent growth phenotypes; the line with most reduced levels of target transcript (SAM‐C) had strongly reduced growth, while the line with less reduced transcript levels (SAM‐B) showed an opposite phenotype. The line with least affected SAM expression as well as MYBL and UAP constructs did not show any significant alterations in growth compared to WT.
Figure 2.

Growth phenotypes of transgenic aspen after 5 years in the field. Stem height (a), diameter (b) and dry weight (c). Three independent lines, labelled A, B or C of each transgenic construct are shown, where A has the least affected and C has the most affected target gene levels, compared to WT. Overexpressing lines are marked with a red hash sign. Eight and 130 biological replicates were analysed for each transgenic line and WT, respectively. Bars = SE. Asterisks show significant differences compared to WT (Dunnett's test, *P ≤ 0.05; **P ≤ 0.01; ***P ≤ 0.001). Horizontal lines above bars that lie at the same level show means that are not significantly different based on Tukey's multirange test at P ≤ 0.05. Data for SuSy lines were included in (Dominguez et al., 2021) and are shown here for comparison with other transgenic lines. (d) Images of transgenic trees at the time of harvest. Scale bar – 30 cm.
Wood anatomy and quality traits by SilviScan
SilviScan analysis (Cieszewski et al., 2013; Lundqvist et al., 2017) of stem was performed to analyse anatomical and physical wood properties in each annual ring starting from ring two (made by the two‐year old vascular cambium) (Figure 3a). The strongest phenotypes were detected in SuSy transgenic lines, showing a reduction in growth (ring width and ring area) and several wood density‐related parameters (number of fibres per vessel, wood density, fibre coarseness, modulus of elasticity (MOE), fibre cell wall thickness) associated with high values of radial and tangential fibre diameters already in year two. C4H and ZAC lines exhibited similar but weaker phenotypes that became more pronounced in the more mature wood.
Figure 3.

SilviScan analysis of anatomical, growth and wood quality traits in transgenic and wild‐type (WT) hybrid aspen grown in field conditions for 5 years. (a) A heatmap showing variability in all measured traits among genotypes in annual rings 2012–2015 corresponding to cambial age 2–4 years. Traits were measured along the stem radius and means for each annual ring are used in the heatmap. Data were scaled and centered to WT values separately for each year. Four and 32 biological replicates were used for each transgenic line and WT, respectively. Asterisks show significant differences compared to WT (Dunnett's test, P ≤ 0.05). (b) Spearman's correlations for growth‐ and wood‐ related traits between the years. Traits were measured at the end of 2015 and the end of 2011 (for growth traits only), 2012, 2013 and 2014.
Since the history of wood formation is recorded in annual rings, we could estimate average values of wood‐quality related traits that would be observed at the end of each year in the field (excluding the first year). These end‐of‐the‐year estimates were used to evaluate stability of different traits across the years by Spearman's correlation. We also calculated Spearman's correlations for stem height and diameter for comparison, including the first‐year growth data. The analysis revealed that wood density and tangential fibre diameter have high correlation coefficients between all years and the final year (Figure 3b), indicating that these traits are already established after the second growth season. However, fibre coarseness, MOE, MFA, radial fibre diameter and fibre cell wall thickness displayed low Spearman's correlation between year 2012 and year 2015, indicating that these traits stabilize later and require at least three growth seasons in the field to rank the transgenic lines with respect to these traits correctly. Stem height and diameter growth, on the other hand, stabilized after the second growth season, whereas the ranking based on measurements at the end of the first growth season was different from the one carried out in later years.
Average anatomical and wood quality traits observed at the end of year 2015 are shown in Figures S2 and S3, respectively. All SuSy and C4H lines and most affected ZAC and SAM lines had increased fibre tangential and radial diameters (Figure S2A,B). The number of fibres per area (Figure S2D) was consequently reduced in these lines compared to WT. Moreover, their cell wall thickness tended to be reduced (Figure S2F), and the number of vessels per area increased (Figure S2E). The most affected C4H, SuSy, SAM and ZAC lines had decreased vessel diameter (Figure S2C), which was correlated with increased vessel number per area (Figure S2E). Consistent with these anatomical changes, wood density, MOE and fibre coarseness were reduced in all SuSy, and most affected C4H lines (Figure S3A–D). None of the lines showed improvement in any quality traits. MFA was sharply reduced in C4H‐C line (Figure S3E), which correlated with high occurrence of tension wood (TW) in this line (Figure S4). Overall, SuSy, C4H and ZAC lines displayed most clear‐construct related alterations in wood anatomy and reduction in quality traits, compared to WT.
Wood chemistry and recalcitrance traits
Pyrolysis–GC/MS (Py–GC/MS) analysis (Meier et al., 2005) revealed major changes in wood chemistry in all SuSy lines that showed severely reduced levels of carbohydrates (Figure 4a), an increase in S and total lignin (Figure 4b,e) and in S/G ratio (Figure 4d). The two most affected C4H lines showed opposite changes in these parameters, a reduction in G lignin (Figure 4c) and an increase in phenolic compounds (Figure 4f), which reached levels several times higher compared to WT or any other line. These two constructs exhibited the most prominent and opposite changes in wood chemistry.
Figure 4.
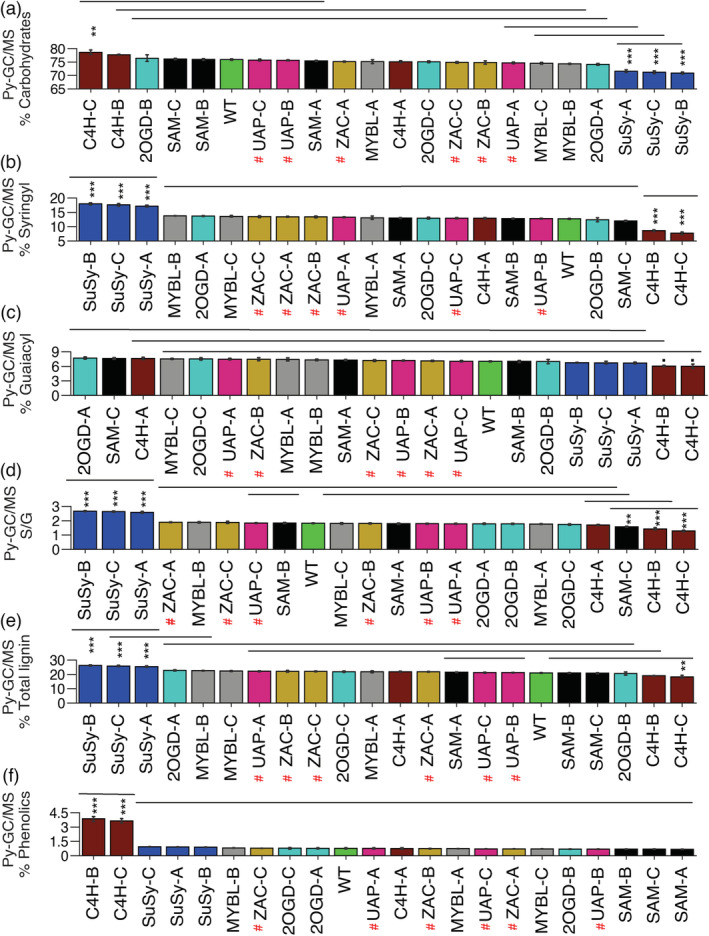
Wood chemistry‐related traits of transgenic and wild‐type (WT) hybrid aspen grown in field conditions for 5 years based on Py–GC/MS analysis. Proportions of carbohydrates (a), syringyl lignin (b), guaiacyl lignin (c). (d) Syringyl to guaiacyl ratio (S/G). (e) Total lignin. (f) Proportion of phenolics. Three independent lines, labelled A, B or C of each transgenic construct are presented; where A indicates the line with the least affected levels of expression of the targeted gene and C is the line with most affected levels, compared to WT. Overexpressing lines are marked with a red hash sign. Four and 32 biological replicates were used for each transgenic line and WT, respectively. Bars = SE. Asterisks show significant differences compared to WT (Dunnett's test, ・P ≤ 0.1; *P ≤ 0.05; **P ≤ 0.01; ***P ≤ 0.001). Horizontal lines above bars that lie at the same level show means that are not significantly different based on Tukey's multirange test at P ≤ 0.05.
The susceptibility to biochemical conversion of the transgenic lines was analysed by analytical enzymatic saccharification of either non‐pretreated biomass (NP) or acid‐pretreated biomass (PT) and is expressed as glucose (Glc) yield per wood weight or per stem. Whereas the yield per wood weight is a measure of lignocellulose processing properties, the yield per stem reflects both processing properties and plant productivity in the field and is therefore the ultimate measure of line performance. The two most affected lines of the C4H construct had strongly improved Glc yield per wood weight in NP (Figure 5a) but no improvement in PT (Figure 5b). Their yields per stem, in both NP and PT, were severely reduced (Figure 5c,d) due to a strong growth defect (Figure 2c). All 2OGD lines showed significantly higher levels of Glc yield per wood weight in PT (Figure 5b), which combined with their good growth (Figure 2c) resulted in high yields per stem in PT (Figure 5d). SuSy lines also had improved yields per wood weight in PT, but their yields per stem (both NP and PT) were very strongly reduced (Figure 5b–d) due to growth defect (Figure 2c). The two most affected ZAC lines showed reduced Glc yields per stem in both NP and PT due to poor growth (Figure 5c,d). A complete summary of the sugar and biomass yields of the transgenic lines is shown in Table S2.
Figure 5.

Glucose yields of transgenic and wild‐type (WT) aspen grown in field conditions for 5 years. (a) Glucose yield per wood weight in saccharification without pretreatment (NP). (b) Glucose yield per wood weight in saccharification with acid pretreatment (PT). (c) Glucose yield per stem in NP. (d) Glucose yield per stem in PT. Three independent lines, labelled A, B or C of each transgenic construct are presented; where A indicates the line with the least affected levels of expression of the targeted gene and C is the line with most affected levels, compared to WT. Overexpressing lines are marked with a red hash sign. Four biological replicates were used from each transgenic line and eight biological replicates from WT. Bars = SE. Asterisks show significant differences compared to WT (Dunnett's test, ・P ≤ 0.1; *P ≤ 0.05; **P ≤ 0.01; ***P ≤ 0.001). Horizontal lines above bars that lie at the same level show means that are not significantly different based on Tukey's multirange test at P ≤ 0.05.
Traits associated with wood Glc yields
To reveal traits associated with improved saccharification yields, we selected eight lines (2OGD‐A, 2OGD‐B, C4H‐B, C4H‐C, SAM‐A, SAM‐B, SuSy‐B and SuSy‐C), which showed positive effects of genetic manipulation on one or more parameters of saccharification, and we analysed their biomass in more detail. Biomass sugar composition based on total acid hydrolysis (Figure S5) showed significant changes compared to WT in SuSy lines that had reduced Glc content and increased content of sugars related to hemicelluloses (Xyl, and in one line also Man) and RGI (Ara, Gal and Rha). C4H lines had strongly decreased content of Man, and they occasionally were showing an increase in pectin‐related sugars and mGlcA. SAM lines and the 2ODG‐B line showed an increase in mGlcA. Based on these data, the ratio of mGlcA to Xyl increased in 2OGD, C4H and SAM lines at P < 0.0001, P < 0.0006 and P < 0.0001, respectively. Thus, in most cases, improved saccharification parameters were associated with changes in hemicelluloses and pectins. We next estimated Glc conversion rates in NP and PT to address the question if the Glc yields in saccharification were dependent on wood Glc content or rather on the conversion rate of glucan to Glc. In NP, both C4H lines had over twofold higher conversion than WT (Figure S6). For PT, the Glc conversion rates were increased in SuSy and 2OGD lines. Thus, the improved saccharification yields in these lines, C4H in NP and SuSy and 2OGD in PT (Figure 5a,b), were caused by increased Glc conversion. To investigate the cause of increased Glc conversion in these lines, we analysed their nanoporosity using Brunauer–Emmett–Teller (BET) analysis. Remarkably, all three constructs had increased nanoporosity (Figure S7).
We further carried out supervised, predictive multivariate modelling to reveal tree traits correlated with saccharification yields and to find best predictors of different saccharification traits. Two orthogonal partial least squares (OPLS) models were constructed with significantly predictive power (Qcum > 0.6) to identify traits responsible for Glc yield per wood weight in NP and in PT (Figure 6a,b; Table S3). For each of the investigated 49 traits, we calculated the predictive, orthogonal and total variable importance for the projection (VIP) value. Traits considered as significant for yield prediction (VIPtotal – 95% confidence interval > 0 and VIPpredictive > 1) are displayed along with the OPLS‐DA scores plots in Figure 6. Yields of Glc per wood weight in NP (Figure 6a) positively correlated with TW content, carbohydrate content, carbohydrate to lignin ratio, phenolics content and yields of other sugars in NP and NP‐Glc production rate. Remarkably, these yields negatively correlated with growth (plant height, ring width) and with lignin content (G ‐, S ‐, total) and S/G ratio. Further, the yields were negatively related to Man content, yields of Xyl and Man in pretreatment liquid (PL) and to yield of Xyl and Glc production rate (GPR) in PT. The score plot of the samples showed better yields (higher predictive components) for C4H, SAM and marginally for 2ODG lines than for WT (Figure 6a).
Figure 6.

Contributions of different variables to predicted glucose yields in saccharification. OPLS predictive models for: glucose yield per wood weight in saccharification without pretreatment (NP) (a), glucose yield per wood weight in saccharification with pretreatment (PT) (b). For each model, a scatter plot showing the distribution of samples (dots) coloured according to constructs is presented on the left and a loading plot showing variables significantly contributing to the predicted yields on the right. In the scatter plots, the horizontal axes show spreads of samples according to the predictive component, while the vertical axes show spreads along the orthogonal component not correlating with glucose yields. The loadings considered as significant for the predictive component are those which have VIPpredictive > 1 and VIPtotal – 95% confidence interval > 0 and are marked by asterisks. The model details are shown in Table. Abbreviations: Ara – arabinose, C – carbohydrates, EH – enzymatic hydrolysate, Fuc – fucose, G – guaiacyl lignin, Gal – galactose, Glc – glucose, GPR – glucose production rate, L – lignin, Man – mannose, PL – pretreatment liquid, S – syringyl lignin, P – phenolics, TW – tension wood, Xyl – xylose.
Yields of Glc in PT (Figure 6b), positively correlated with S‐ and total lignin, yields of sugars in pretreatment liquid, yields of Glc and Xyl in enzymatic saccharification following acid pretreatment and yield of Xyl and GPR in PT. In contrast, the yields negatively correlated with % TW, carbohydrate content and carbohydrate to lignin ratio, as well as with sugar yields and GPR in NP. The latter underscored a negative correlation between yields in NP and in PT. Indeed, a number of variables, such as % TW, carbohydrate content, S‐lignin, pretreatment liquid Xyl and Man yields, Xyl yield in PT and yields of Gal, Xyl and GPR in NP, showed reversed profiles between the NP and PT models (Figure 6a,b). The predictive component for Glc yield in PT was improved in all transgenic samples, with best results for 2OGD and SuSy lines.
To further our understanding of biomass properties relevant for saccharification, we analysed selected lines by subcritical water extractability (Figure 7; Figure S8). During the successive supercritical water extraction, the different polymers are extracted according to their bonding within cell wall (Martínez‐Abad et al., 2018). We found reduced yields of extracts in SAM‐A, 2OGD‐B and C4H‐B lines, primarily due to reduced yields of 10‐min extractions (Figure S8A) and reduced yields of polysaccharides in all transgenic lines (Figure S8B). The size exclusion chromatography of consecutive extracts of transgenic lines (Figure 7a) revealed differences from WT in 10‐ and 20‐min extracts, containing diverse polymers with high participation of glucans, pectins, mannans and lignin (Figure S8C; Figure 7d), whereas the extracts that were most enriched in xylan (30‐ and 60‐min) had similar profiles in transgenic lines and WT. C4H‐B and SuSy‐B 10‐min extracts had contrasting profiles that deviated most distinctly from the profiles of WT plants. The SuSy‐B extracts were missing the high molecular weight tail present in all other samples, whereas the C4H‐B extracts exhibited the most prominent high molecular weight peak. The profiles of 2OGD‐B and SAM‐A extracts were similar and had exaggerated low molecular weight part of the profile in both 10‐min and 20‐min, suggesting the presence of shorter polymers in these lines. The yields of all polysaccharides in the 10‐min extracts were strongly reduced in all transgenic lines compared to WT, with strongest reductions in 2GOD‐B and SAM‐A lines (Figure 7b). The composition analysis (Figure 7d; Figure S8C) revealed that the extracts of SuSy‐B lines that performed well in PT (Figure 5b) contained less carbohydrates (mainly less pectins and glucans) and more S‐lignin than WT, whereas extracts of C4H‐B lines that performed well in NP were enriched in lignins and depleted in carbohydrates. The extracts of 20‐ and 30‐min treatments in C4H‐B and SAM‐A lines were enriched in pectins, whereas the pectins were more abundant in residues remaining after extraction of 2OGD‐B and SuSy‐B lines compared to WT (Figure S8C). The glucan content was reduced in extracts of 2OGD‐B, SAM‐A and SuSy‐B lines, and the mannan content was reduced in 2OGD‐B and C4H‐B compared to WT. The mGlcA to Xyl ratio, which is a proxy for xylan glucuronosylation, was highest in 10‐min extracts, indicating that highly glucuronosylated xylan is easily extracted (Figure 7b). All transgenic lines with improved saccharification exhibited increased mGlcA to Xyl ratio in the starting material and/or extracts compared to WT. The overall conclusion is that the subcritical water extractability reflects biomass polysaccharide cross‐linking and is intimately linked to the saccharification potential of transgenic lines.
Figure 7.

Subcritical water extractability of lignocellulose in transgenic and wild‐type (WT) hybrid aspen grown in the field conditions for 5 years. Milled wood was successively extracted for indicated time intervals and the composition of extracted polysaccharides was determined. (a) Size exclusion chromatography of successive extracts. (b) The yields and composition of extracted polysaccharides. Polysaccharide content was based on the following sugar contents: pectins – Fuc, Ara, Rha, Gal, GalA, GlcA; glucan – Glc, xylan – Xyl, mGlcA, mannan – Man. The content of each polysaccharide is given in mg per g of wood powder. (c) Ratio of mGlcA to Xyl in the successive extracts illustrating degree of xylan glucuronosylation. (d) Pyrolyzate content. C‐carbohydrates, S – S‐lignin, G – G‐lignin, H – H‐lignin, P – phenolics. Means ± SE of two technical replicates of pooled wood powder from four trees per genotype. Asterisks show significant differences compared to WT (Dunnett's test, *P ≤ 0.05), black asterisks indicate upregulation, white asterisk – downregulation. P‐values indicate significance for total polysaccharide yield.
Considering growth (Figure 2), wood development (Figure 3; Figure S2), improved saccharification yield per wood weight in PT (Figure 5), glucose conversion (Figure S6) and nanoporosity (Figure S7), we selected the 2OGD lines for testing in a pilot‐scale pretreatment facility. The lignocellulose milled with bark was pretreated in bioreactors in two independent experiments and analysed by enzymatic saccharification that was continued for three days. The final yields of glucose from transgenic biomass were nominally increased compared to the WT by 17%, P < 0.12, whereas the yields of xylose were increased by 15%, P < 0.05 (Figure 8a,b). These yields were a little less compared to those from analytical pretreatment, but the pattern of glucose and xylose releases followed similar dynamics in the two types of pretreatment processes.
Figure 8.
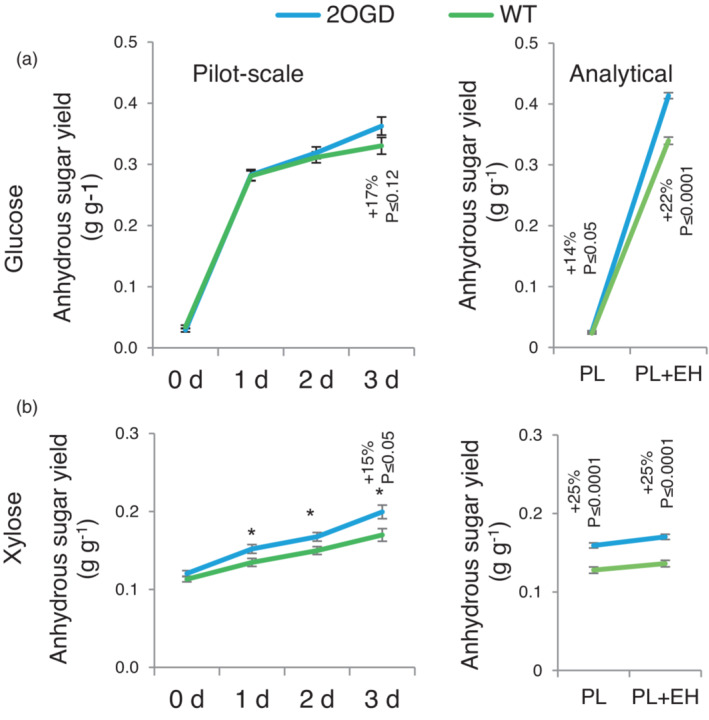
Comparison of sugar yields of 2OGD lines and wild‐type (WT) after a pilot scale industrial‐like acid pretreatment and after analytical pretreatment. Glucan (a) and xylan (b) unit yields in enzymatic saccharification for 0–3 days after industrial pilot scale acid pretreatment obtained in two independent pretreatment runs (left) or analytical pretreatment (right). Three biological replicates of WT were compared with three biological replicates of transgenic lines with suppressed 2OGD expression (three transgenic lines), each replicate represented by four trees. Means ± SE. P values correspond to F test; asterisks show P ≤ 0.05.
Discussion
Line performance changes after the first year in the field
In this study, 32 transgenic lines belonging to seven constructs were tested over five years in the field trial. The targeted genes represented variety of functions and were upregulated during secondary wall formation in developing xylem (Figure 1). All tested lines showed changes in target gene expression in the developing wood of field‐grown trees (Figure 1) consistent with previous greenhouse analyses (Bjurhager et al., 2010; Gerber et al., 2014), supporting the long‐term stability of transgene expression in the field reported previously (Hawkins et al., 2003; Pramod et al., 2021; Strauss et al., 2016). However, line growth performance in the field was in some cases different than in the greenhouse (Figure 2; Figure S1; Bjurhager et al., 2010; Gerber et al., 2014). A major re‐ordering of transgenic lines with regard to several parameters occurred after the first dormant period (Figure 3b) indicating that the overwintering is a critical test of transgenic trees (Strauss et al., 2016). This could be related to several reasons: (i) transgene expression could interfere with physiological processes during overwintering; (ii) transgene insertion could disrupt genes having a critical role for overwintering and (iii) transgene insertion could interfere with genomic rearrangements that occurs in meristems of overwintering trees (Lloyd et al., 1996; Mellerowicz et al., 1989, 1992). Thus in boreal climate, at least a two‐year testing period is needed to evaluate growth of transgenic perennial crops and results from shorter duration field studies (Kim et al., 2018; Macaya‐Sanz et al., 2017) should be treated with caution.
Function of targeted genes revealed by field testing
SuSy encoded sucrose synthase provides UDP‐Glc from sucrose for cellulose and other cell wall polymers (Stein and Granot, 2019), and it is proposed as a key enzyme regulating wood cellulose biosynthesis (Coleman et al., 2009). In contrast to mild effects of SuSy downregulation in the greenhouse (Gerber et al., 2014), which were explained by an alternative route of UDP‐Glc biosynthesis mediated by invertase (Dominguez et al., 2021), the growth of SuSy‐suppressed lines was greatly reduced in the field (Figure 2; Dominguez et al., 2021). Moreover, their wood displayed anatomical abnormalities, reduced cell wall thickness and density, reduced carbohydrate and increased lignin contents and its sugar composition indicated a reduction in cellulose compensated by higher hemicellulose and pectin contents (Figures 3 and 4; Figures [Link], [Link]). These observations indicate that SuSy‐encoded activity mediates C‐flux not uniformly to all wall components but primarily to cellulose, which is needed for cambial activity and secondary wall biosynthesis in developing xylem, and which cannot be efficiently substituted by any alternative pathway in the field conditions.
C4H encodes a cinnamate 4‐hydroxylase involved in the conversion of t‐cinnamic acid to p‐coumaric acid (Boerjan et al., 2003; El Houari et al., 2021a). Mutation in C4H in Arabidopsis thaliana reduces lignin content and induces growth abnormalities (Schilmiller et al., 2009) that were recently shown to be caused by accumulation of c‐cinnamic acid interfering with polar auxin transport (El Houari et al., 2021b). C4H downregulation in aspen also induced dwarfism and anatomical wood abnormalities, reduced lignin and increased phenolics content (Figures 2, 3, 4; Figures S2 and S3; Bjurhager et al., 2010), consistent with reports in A. thaliana (Boerjan et al., 2003; El Houari et al., 2021a).
Arabidopsis thaliana ZAC encodes a protein activating GTPase activity of arabinosylation factors (ARFs) involved in endosomal vesicle trafficking (Jensen et al., 2000) and mediating gravitropic bending in response to Ca+2 fluxes (Dümmer et al., 2016). In aspen, ZAC is broadly expressed in wood‐forming tissues (Figure 1), and its upregulation strongly inhibits height and diameter growth (Figure 2) and affects wood cell structure (Figures S2 and S3). These results indicate that ZAC has an essential cellular function for cell division, radial cell expansion and secondary wall thickening.
SAM is predicted to encode a methionine adenosyltransferase – an essential enzyme synthesizing S‐adenosylmethionine that serves as general methyl donor in a variety of reactions including lignin and ethylene biosynthesis (Jin et al., 2017). SAM downregulation in aspen affected tree growth with different outcomes; a strong downregulation inhibited height and diameter growth, but a mild downregulation stimulated it (Figure 2), but there were no changes in lignin content even in the most suppressed line (Figure 4). As the suppression of two SAM homologues in switchgrass resulted in growth inhibition and strong lignin reduction (Li et al., 2022), we hypothesize that the lack of similar effect on lignin in aspen is due to the redundancy in the gene family. It would be also interesting to investigate if the nonlinear growth response of transgenic lines to SAM transcript dosage could be related to an epigenetic effect via DNA and histone methylation known to be regulated by the methionine level (Yan et al., 2019).
Aspen 2OGD is a member of a large family of 2‐oxoglutarate‐dependent dioxygenases, which couple two‐electron oxidation of diverse substrates with decarboxylation of 2‐oxoglutarate to succinate. The family has three subclades (Kawai et al., 2014). 2OGD belongs to the subclade DOXC that includes oxygenases involved in biosynthesis of gibberellins, flavonoids and ethylene, but the branch 21 of this subclade where 2OGD belongs has not yet been functionally characterized. In wood‐forming tissues of aspen, 2OGD is expressed in cells depositing secondary walls (Figure 1), and its suppression tended to stimulate stem height growth and significantly increased stem diameter and biomass in the most suppressed line (Figure 2), suggesting that activity of 2OGD inhibits stem primary and secondary growth.
Constructs with less recalcitrant biomass
The C4H construct had greatly improved Glc yield and conversion in NP (Figure 5; Figure S6), but these positive changes were offset by growth penalty and abnormalities in wood development. The results are similar to those obtained for C4H‐downregulated hybrid eucalyptus grown in the field for 2 years (Sykes et al., 2015) and field‐grown transgenic Populus with downregulated different monolignol biosynthetic pathway genes (Pilate et al., 2002; Voelker et al., 2011; Van Acker et al., 2014). These results show that growth inhibition and developmental abnormalities are observed when the lignin content is significantly reduced, which limits the use of lignin‐reduced transgenic trees. However, recent discoveries in lignin‐downregulated Arabidopsis and Medicago showing that developmental abnormalities had indirectly been induced by signalling involving polygalacturonase or bioactive phenolic compounds (El Houari et al., 2021b; Gallego‐Giraldo et al., 2011, 2020) open possibilities to develop strategies that control the signalling of lignin deficiency. C4H plants had several interesting characteristics from the biorefinery point of view, like a lower S/G ratio, a higher carbohydrate content and nanoporosity (Figures 4 and 7; Figures S5 and S7), and their extracts were enriched in high molecular weight compounds (Figure 8), providing incentive to develop a remedy for the growth defect.
SuSy‐downregulated lines had highly improved Glc yields and conversion in PT (Figure 5; Figure S6). This interestingly occurred despite their increased S‐lignin contents (Figure 4), supporting the efficiency of acid pretreatment in S‐lignin modification such, that its presence does not limit cellulose enzymatic conversion anymore (Li et al., 2016). Increased saccharification can be explained by increased nano‐ and microporosity evidenced by BET analysis and reduced cell wall thickness and wood density (Figure 4; Figures [Link], [Link] and S7; Gerber et al., 2014). These nano‐ and micro‐structural changes did not reduce recalcitrance in NP or made wood more amenable to subcritical water extraction (Figure 7), probably because of the high S‐lignin content in these plants. Improved saccharification properties in PT are of interest, but severe growth inhibition makes these lines unsuitable as biorefinery feedstocks.
2OGD‐suppressed lines exhibited the highest Glc yield and significantly better Glc conversion in PT and increased nanoporosity (Figure 5; Figures S6 and S7), but the reason for this improved phenotype is unclear. The chemotype of these plants was not altered (Figure 4), except for an increased mGlcA content (Figure S5), suggesting higher xylan glucuronosylation. The SEC profile of water extracts of 2OGD plants suggested presence of short loosely bound polymers, which could be related to their improved saccharification. All 2OGD lines had nominally increased growth, with the most highly suppressed line showing the significant increase in diameter and biomass (Figure 2), which resulted in relatively high Glc yields per stem in PT (Figure 5d). The ultimate test of the 2OGD line using pilot scale industrial‐like acid pretreatment showed positive features, although gains and reproducibility of the pretreatment were lower than in the laboratory (Figure 8). To our knowledge this is the first example of genetically modified lignocellulose of a tree species that was improved in a pilot‐scale industrial‐like biorefinery process and was more productive in the field than the WT.
SAM‐suppressed lines A and B had among the highest Glc yields in PT and in NP (Figure 5a,b). These positive effects could not be explained by any of the measured parameters including the biomass pyrolyzate composition (Figure 4), nanoporosity (Figure S7) or wood anatomy parameters (Figure 3; Figure S2). An increase in mGlcA compared to WT was observed in these lines, similar to the 2OGD lines (Figure S5), and molecular weight profiles of water extracts were similar between 2OGD‐ and SAM‐ suppressed plants (Figure 8), suggesting some common features of these plants. SAM‐B also grew well, providing a rare example of transgenic modification having high Glc yield per tree in NP and in PT (Figure 5). However, the most suppressed SAM‐C line was dwarf (Figure 2), which indicates that gene dosage needs to be carefully controlled in SAM‐suppressed plants.
Traits determining saccharification
Several previous studies tried to find determinants of saccharification yields based on biomass variability in natural populations (Davison et al., 2006; Studer et al., 2011), in different genotypes obtained by breeding (Serapiglia et al., 2013), in different transgenic plant collections grown in the greenhouse (Escamez et al., 2017) and in the field (Pramod et al., 2021), or following controlled extraction of biomass (Chang and Holtzapple, 2020; DeMartini et al., 2013). Here we used a collection of field‐grown WT hybrid aspen and eight transgenic lines that exhibited positive changes in different saccharification parameters (Figure 5), to pinpoint which of 49 analysed traits characterizing tree morphology, wood anatomy, wood chemistry and wood physical characteristics are associated with improved wood saccharification. For Glc yields in NP, we confirmed that lignin content (S, G, total lignin) is a negative factor‐limiting enzymatic hydrolysis (Davison et al., 2006; Mansfield et al., 2012; Min et al., 2012; Serapiglia et al., 2013; Studer et al., 2011; Van Acker et al., 2014). The analysis suggested that Glc yield in NP is negatively correlated with growth (Figure 6). It is possible that this correlation was driven by phenotype of C4H lines. However, a negative correlation between Glc yield in NP and growth was also observed in lines with reduced xylan acetylation, and it was explained by a higher S‐lignin content among the better‐growing transgenic lines (Pramod et al., 2021). Whereas there is a link between increased body weight and lignification (Ko et al., 2004), it is uncertain if such relationship universally holds beyond the sets of transgenic lines analysed in these studies. Occurrence of TW was a positive factor determining Glc yields in NP (Figure 7). This result supports conclusions of studies in willow, which identified TW as the main determinant of high Glc yields and Glc conversion rates (Brereton et al., 2012; Foston et al., 2011). This relationship is explained by a higher cellulose and lower lignin contents as well as higher nano‐porosity of TW compared to normal wood (Fagerstedt et al., 2014).
Glc yield in PT was dependent on totally different traits than in NP (Figure 6). Moreover, many traits having positive impact in NP exhibited negative influence in PT. This could be interpreted as evidence of high efficiency of acid pretreatment that decreases recalcitrance due to hemicelluloses and lignin, in particular the S‐lignin that is the major form of lignin in aspen fibres. Other studies showed a negative impact S/G ratio on lignocellulose saccharification with pretreatment in samples with similar lignin content (Mansfield et al., 2012; Studer et al., 2011). S/G ratio is related to wood anatomy since vessel elements are enriched in G‐lignin in hardwoods (Mellerowicz et al., 2001), and it is possible that low S/G ratio corresponds to high vessel‐to‐fibre ratio, thus high microporosity and better access of enzymes to cell wall. But in our data, neither G‐lignin nor vessel frequency was significantly affecting saccharification in PT (Figure 6; Table S3).
Conclusions
This study evaluated seven constructs represented by 32 transgenic lines pre‐selected in large‐scale greenhouse screening by determining their growth and wood properties relevant for saccharification after five‐year cultivation in the field. The results (i) provided relevant information on field testing strategies, (ii) revealed physiological functions of tested genes in natural environment, (iii) identified types of transgenic manipulations suitable for saccharification improvement and (iv) revealed relationships among different traits and saccharification, identifying key parameters governing better saccharification yields. Moreover, the best transgenic lines were processed in a pilot‐scale reactor under industrial‐like conditions, providing proof‐of‐concept results supporting our strategy of developing biorefinery‐improved feedstocks.
Experimental procedures
Generation of transgenic lines
Genes having high expression in wood‐forming tissues (Hertzberg et al., 2001) were selected for engineering RNAi constructs using the pK7GWIWG2 vector with the 35 S promoter (Karimi et al., 2002) and overexpression constructs using the pPCV812 vector (Koncz et al., 1994) with either the original 35 S promoter or the cambium‐specific promoter LMP1 (WO2004097024 A1) (Table 1). The hybrid aspen (Populus tremula L. × tremuloides Michx) clone T89 was transformed by Agrobacterium and individual transgenic lines along with WT control plants were propagated in vitro (Nilsson et al., 1992), and grown in the greenhouse (Gandla et al., 2015) until they reached approximately 70 cm in height.
Field trial establishment and design
The field trial was established with permit 22‐3992/11 from the Swedish Board of Agriculture (Jönköping, Sweden). In total, 32 transgenic lines representing seven transgenic constructs, and WT plants were planted with a 3 m spacing at flat and homogeneous area in Våxtorp, Laholm community, Sweden (56.42° N, 13.07° E) in June 2011, where they were grown for five seasons. βto six lines (Table S1). Trees were planted in eight blocks. Each block included one transgenic tree per line and 16 WT trees. During the two first years, the field was harrowed and later mowed twice a year. After each growing season and before harvesting (summer 2016), height and diameter at the stem base were measured. Stem and branch biomass were determined at harvest by weighing, and their dry weight was determined by drying subsamples in an oven at 60°C. For wood and RNA analyses, 50% of the tallest trees were selected from each genotype. A 20‐cm stem segment was dissected from the previous‐year‐formed stem, split into the bark and the wood core and stored at −80°C until used for RNA analyses and a 10‐cm‐long stem segment was collected from 23 to 32 cm from the ground, debarked, cut into four pieces, dried at 60°C in the oven and stored at room temperature until wood chemical analyses. Additionally, a 6‐cm‐long segment (10–16 cm from the ground) was collected with bark and frozen for NIR analyses, and another similar segment (16–22 cm from the ground) was dissected, dried in ambient temperature and stored at room temperature for SilviScan analysis.
Quantitative polymerase chain reactions
Developing xylem or cambium tissues were scrapped from the exposed wood core and bark surface, respectively, and ground in liquid N2. Three trees from each line were analysed. RNA was extracted as described in Ratke et al. (2015), reverse‐transcribed using iScript™ cDNA Synthesis with random hexamer primers (Bio‐Rad). Quantitative polymerase chain reactions (qPCRs) were performed using LIGHTCYCLER 480 SYBR GREEN I Master Mix (Roche) in a LightCycler® 480 System II (Roche) and 20 μL reaction volume. PCR program was 95°C for 5 min, then 50 cycles of 95°C for 30 s, 60°C for 15 s and 72°C for 30 s. UBQ‐L (Potri.005G198700) and CYP (Potri.004G168800) were selected as reference genes from four tested genes based on GeNorm (Vandesompele et al., 2002). The primer sequences are listed in Table S4. The relative expression level was calculated according to Pfaffl (2001) in Python (Van Rossum and Drake, 2009).
Wood anatomical and structural features
SilviScan (CSIRO, Australia) measurements were conducted at INNVENTIA/RISE using procedures described previously (Cieszewski et al., 2013; Lundqvist et al., 2017). Stem segments were cut with a precision twin blade saw at a 2 mm thickness in the tangential direction and 7 mm height in the longitudinal direction to obtain sample strips from pith to bark, which were sanded on upper cross‐sectional surface. All analyses were carried out at 25°C and 43% relative humidity. The average density of each sample was obtained by measuring its volume and weight and used for calibration. The samples were analysed by a cell scanner using an optical lens to provide microscopic images, then by an X‐ray densitometer to provide density variation at a 25 μm resolution and finally by an X‐ray diffractometer to provide microfibril angles (MFA) and wood stiffness (MOE) at a 5 mm resolution. SilviScan data were displayed using ComplexHeatmap with default parameters (Gu et al., 2016).
NIR analysis
Stem segments were cut to 15 mm heigth and sanded prior to NIR‐imaging at 0.5 mm2 resolution using 256 wavelengths between 900 and 2500 nm. TW prediction models were built using samples with induced TW as reference data. TW and normal wood areas were identified using cell‐scanner images and MFA obtained by SilviScan. Multivariate predictive models were built using partial least squares in Evince (Prediktera – AB), and evaluated using Breeze (Prediktera – AB).
Grinding of wood
Wood samples were ground using the Cutting Mill SM 2000 with 4‐mm, followed by 1‐mm sieve (Retsch, Haan, Germany) and sieved using the analytical sieve shaker AS 200 (Retsch) to obtain particle size fractions: <50 μm, 50–100 μm, 100–500 μm and >500 μm.
Pyrolysis coupled to gas chromatography/mass spectrometry (Py‐GC/MS)
Wood powder with particle size <50 μm was used for Py‐GC/MS as described by Gandla et al. (2015). A portion of 50–60 μg was applied to a pyrolizer equipped with an auto sampler (PY‐2020iD and AS‐1020 E, Frontier Lab, Japan) connected to a GC/MS (7890A/5975C; Agilent Technologies AB, Sweden) and analysed according to Gerber et al. (2012).
Analytical enzymatic saccharification
Portions of 50 mg of dry wood powder (particle size 100–500 μm) from each of four biological replicates per line each with three technical replicates were used for enzymatic saccharification before and after acid pretreatment as described previously (Gandla et al., 2021). Pretreatment was performed using a single‐mode microwave system (Initiator Exp, Biotage, Uppsala, Sweden). Each reaction mixtures with pretreated or non‐pretreated material contained 5 mg liquid enzyme preparation (Cellic CTec‐2 obtained from Sigma‐Aldrich, St. Louis, MO, U.S.A.). Reaction mixtures were incubated for 72 h at 45°C and 170 rpm (Ecotron incubator shaker, Infors, Bottmingen, Swizerland). GPR was determined after 2 h using a glucometer (Accu‐Chek® Aviva; Roche Diagnostics Scandinavia AB, Bromma, Sweden), and monosaccharide sugar yields were determined after 72 h using a high‐performance anion‐exchange chromatography (HPAEC) system (ICS 5000, Dionex, Sunnyvale, CA) and standard monosaccharide solutions (Wang et al., 2018).
Subcritical water extraction
For extraction and sugar composition analysis by two‐step hydrolysis, 50–100 μm sized wood particles of four trees per genotype were pooled and used as biological replicates. Portions of 2 g of pooled wood powder were successively extracted for 10, 20, 30 and 60 min with 0.2 m formate buffer, pH 5.0, at 170 °C and 100 bar, using an accelerated solvent extractor (ASE‐300, Dionex), with fresh extraction buffer added at each step. Salts and low molecular weight compounds were removed by dialysis using Spectra/Por 3 membranes (Spectrum) and the extracts were freeze‐dried. Extracts (3 mg) were dissolved at 2 mg/mL in dimethyl sulfoxide (DMSO Anhydrous, Sigma‐Aldrich) with 0.5% w/w LiBr (Anhydrous free‐flowing Redi‐Dri, Sigma‐Aldrich) at 60 °C, and filtered through 0.45 um PTFE syringe filters (VWR) and analysed by size exclusion chromatography coupled to refractive index and UV‐detectors (SECurity 1260, Polymer Standard Services, Mainz, Germany). The separation was carried through GRAM Analytical columns of 100 and 10 000 Å (Polymer Standard Services, Mainz, Germany) at a flow rate of 0.5 mL/min and 60 °C. The columns were calibrated using pullulan standards between 345 and 708 000 Da (Polymer Standard Services, Mainz, Germany).
The sugar composition of extracts and solids (wood powder starting material and residues) were determined by methanolysis and two‐step sulfuric acid hydrolysis, respectively. For methanolysis, 1 mg of samples were incubated with 1 mL of 2 m HCl in dry methanol for 5 h at 100°C, neutralized with pyridine, dried under inert gas and further hydrolyzed with 2 m trifluoroacetic acid (TFA) at 120°C for 1 h. The hydrolysates were dried and dissolved in water prior to analysis. Sulfuric acid hydrolysis was performed by incubating 1 mg of sample with 125 μL of 72% sulfuric acid at room temperature for 1 h, dilution with 1375 μL of deionized water and subsequent incubation at 100°C for 3 h as described by Saeman et al. (1954). Hydrolysates were diluted with MilliQ water, filtered through 0.2 mm syringe filters (Chromacol 17‐SF‐02‐N) into HPAEC‐PAD vials and analysed by HPAEC with pulsed amperometric detection (HPAEC‐PAD) using a Dionex ICS‐6000 system equipped with a CarboPac PA1 column (4 × 250 mm, Dionex) held at 30°C and using the eluent gradients previously reported (McKee et al., 2016). Quantification of carbohydrate composition (hydrous form) was performed by standard calibration of ten monosaccharides (Ara, Rha, Fuc, Xyl, Man, Gal, Glc, GalA, 4‐O‐MeGlcA and GlcA) with concentrations between 0.005 and 0.1 g/L.
Porosity analysis
The surface area of wood powder (particle size 100–500 μm) was analysed as described in Pramod et al. (2021). Briefly, samples were subjected to degassing using a SmartPrep Degasser (Micromeritics) to remove nonspecific adsorbents and analysed with a single‐point TriStar 3000 Brunauer–Emmett–Teller (BET) Analyser (Micromeritics, Atlanta, GA). Four biological replicates of selected transgenic lines and eight biological replicates of WT were analysed, each in triplicate.
Pilot‐scale pretreatment
Three transgenic lines of the 2OGD construct and WT hybrid aspen from the field were used in a pilot‐scale saccharification at RISE Processum, Örnsköldsvik, Sweden. Stems were dried with the bark and roughly ground to chips. Six samples (three WT samples and three transgenic lines), each represented by approx. 8 kg of pooled stem material from four trees, were subjected to thermochemical pretreatment in technical duplicates, each duplicate in a separate experiment, in a 40‐litre steam‐explosion reactor, using sulfuric acid as catalyst and uniform retention times and temperature settings for all samples. The saccharification potential of the pretreated materials was evaluated by enzymatic hydrolysis for 0, 1, 2, and 3 days, after which their sugar yields were analysed in triplicates as described above.
Statistical analyses
Statistical analyses, data processing and graphs preparation were performed using R (v3.4.0; R Core Team, 2019) and Python (Van Rossum and Drake, 2009). Similarity of individual lines to WT was evaluated by a Dunnett's test in R using the multicomp (Hothorn et al., 2008). Multivariate statistical modelling was done for 49 traits (Table S3) and nine genotypes. Contributions of selected traits to glucose yield in saccharification were estimated by Orthogonal Projections to Latent Structures (OPLS) and Variable Influence on Projection (VIP; Galindo‐Prieto et al., 2014) model, using SIMCA software (version 17.0.0.0, Sartorius Stedim Data Analytics AB, with built‐in options). The data were subjected to UV scaling prior to analysis. For each trait, the total, the predictive and the orthogonal VIP values were exported. Cut‐off for significant traits, which predicted Glc yields was set to VIPpredictive > 1 and VIPtotal – 95% CI > 0.
Funding
This work was supported by grants from the Knut and Alice Wallenberg Foundation (KAW), the Swedish Governmental Agency for Innovation Systems (VINNOVA), Swedish Foundation for Strategic Research (SSF; project ValueTree RBP14‐0011), Bio4Energy and the Swedish University of Agricultural Sciences (SLU).
Conflict of interest
The authors declare no conflict of interest.
Author contributions
END and VK analysed RNA, END compiled all data and wrote the manuscript, MDM designed and carried out sample collection, analysed growth data and analysed samples by Py‐GC/MS; ZY and GS analysed wood samples by Silviscan and NIR, MLG, AH, BA, SW and LJJ planned and performed pretreatment experiments, analysed wood samples by analytical and pilot‐scale saccharification and investigated nanoporosity, PS, SEH and FV – carried out wood extractability analyzes, UJ carried out field maintenance and phenotyping, MH, BS and EJM designed the study, EJM coordinated the study and finalized manuscript with contribution of all authors.
Supporting information
Figure S1 Correlation between the height growth in the field at harvest in 2016 and the height observed in the greenhouse.
Figure S2 Wood anatomy traits of transgenic and wild‐type (WT) hybrid aspen grown in the field conditions for 5 years based on SilviScan analysis of growth rings 2012–2015.
Figure S3 Wood quality traits at the end of year 2015 of transgenic and wild‐type (WT) hybrid aspen grown in the field conditions for 5 years based on SilviScan analysis of growth rings 2012–2015.
Figure S4 Cross‐sectional area occupied by tension wood (TW) at the end of year 2015 in transgenic and wild‐type (WT) lines grown in the field conditions for 5 years based on NIR spectral analysis.
Figure S5 Sugar composition of wood in transgenic and wild‐type (WT) hybrid aspen grown in the field conditions for 5 years.
Figure S6 Glucose (Glc) conversion in saccharification of transgenic and wild‐type (WT) hybrid aspen grown in the field conditions for 5 years.
Figure S7 Nanoporosity of lignocellulose in transgenic and wild‐type (WT) hybrid aspen grown in the field conditions for 5 years based on Brunauer–Emmett–Teller (BET) analysis.
Figure S8 Total and polysaccharide yields and polysaccharide composition of extracts obtained by subcritical water extraction of lignocellulose in transgenic and wild‐type (WT) hybrid aspen grown in the field conditions for 5 years.
Table S1 Lines used in this study. Target gene expression levels analysed by RT‐qPCR, height, diameter, biomass and biomass per ha for all trees planted in the field after five growth seasons.
Table S2 Complete summary of sugar yields in saccharification without (NP) and with (PT) acid pretreatment and stem and total (stem and branches) biomass yields for trees used for saccharification.
Table S3 OPLS‐VIP models of glucose saccharification yields for wood lignocellulose from field grown transgenic lines and WT.
Table S4 Primers used in this study.
Acknowledgements
We thank Dr. Junko Takahashi‐Schmidt from the Biopolymer Analytical Platform at UPSC, supported by Bio4Energy and TC4F projects, for help in cell wall analyses.
References
- Bar‐On, Y.M. , Phillips, R. and Milo, R. (2018) The biomass distribution on Earth. Proc. Natl. Acad. Sci. U. S. A. 115, 6506–6511. [DOI] [PMC free article] [PubMed] [Google Scholar]
- Biswal, A.K. , Soeno, K. , Gandla, M.L. , Immerzeel, P. , Pattathil, S. , Lucenius, J. , Serimaa, R. et al. (2014) Aspen pectate lyase PtxtPL1‐27 mobilizes matrix polysaccharides from woody tissues and improves saccharification yield. Biotechnol. Biofuels 7, 11. [DOI] [PMC free article] [PubMed] [Google Scholar]
- Biswal, A.K. , Hao, Z. , Pattathil, S. , Yang, X. , Winkeler, K. , Collins, C. et al. (2015) Downregulation of GAUT12 in Populus deltoides by RNA silencing results in reduced recalcitrance, increased growth and reduced xylan and pectin in a woody biofuel feedstock. Biotechnol. Biofuels 8, 1. [DOI] [PMC free article] [PubMed] [Google Scholar]
- Bjurhager, I. , Olsson, A.M. , Zhang, B. , Gerber, L. , Kumar, M. , Berglund, L.A. , Burgert, I. et al. (2010) Ultrastructure and mechanical properties of Populus wood with reduced lignin content caused by transgenic down‐regulation of cinnamate 4‐hydroxylase. Biomacromolecules 11, 2359–2365. [DOI] [PubMed] [Google Scholar]
- Boerjan, W. , Ralph, J. and Baucher, M. (2003) Lignin biosynthesis. Annu. Rev. Plant Biol. 54, 519–546. [DOI] [PubMed] [Google Scholar]
- Brereton, N.J. , Ray, M.J. , Shield, I. , Martin, P. , Karp, A. and Murphy, R.J. (2012) Reaction wood – a key cause of variation in cell wall recalcitrance in willow. Biotechnol. Biofuels 5, 83. [DOI] [PMC free article] [PubMed] [Google Scholar]
- Chang, V.F. and Holtzapple, M.T. (2020) Fundamental factors affecting biomass enzymatic reactivity. Appl. Biochem. Biotechnol. 84–86, 5–37. [DOI] [PubMed] [Google Scholar]
- Chanoca, A. , de Vries, L. and Boerjan, W. (2019) Lignin engineering in forest trees. Front. Plant Sci. 10, 912. [DOI] [PMC free article] [PubMed] [Google Scholar]
- Chen, Y.H. , Shen, H.L. , Hsu, P.J. , Hwang, S.G. and Cheng, W.H. (2014) N‐acetylglucosamine‐1‐P uridylyltransferase 1 and 2 are required for gametogenesis and embryo development in Arabidopsis thaliana . Plant Cell Physiol. 55, 1977–1993. [DOI] [PubMed] [Google Scholar]
- Cieszewski, C.J. , Strub, M. , Antony, F. , Bettinger, P. , Dahlen, J. and Lowe, R.C. (2013) Wood quality assessment of tree trunk from the tree branch sample and auxiliary data based on NIR spectroscopy and SilviScan. Math. Comput. For. Nat. Res. Sci. 5, 86–111. [Google Scholar]
- Coleman, H.D. , Yan, J. and Mansfield, S.D. (2009) Sucrose synthase affects carbon partitioning to increase cellulose production and altered cell wall ultrastructure. Proc. Natl. Acad. Sci. U. S. A. 106, 13118–13123. [DOI] [PMC free article] [PubMed] [Google Scholar]
- Davison, B.H. , Drescher, S.R. , Tuskan, G.A. , Davis, M.F. and Nghiem, N.P. (2006) Variation of S/G ratio and lignin content in a Populus family influences the release of xylose by dilute acid hydrolysis. Appl. Biochem. Biotechnol. 129–132, 427–435. [DOI] [PubMed] [Google Scholar]
- DeMartini, J.D. , Pattathil, S. , Miller, J.S. , Li, H.X. , Hahn, M.G. and Wyman, C.E. (2013) Investigating plant cell wall components that affect biomass recalcitrance in poplar and switchgrass. Energy Environ. Sci. 6, 898. [Google Scholar]
- Derba‐Maceluch, M. , Amini, F. , Donev, E.N. , Pawar, P.M. , Michaud, L. , Johansson, U. et al. (2020) Cell wall acetylation in hybrid aspen affects field performance, foliar phenolic composition and resistance to biological stress factors in a construct‐dependent fashion. Front. Plant Sci. 11, 651. [DOI] [PMC free article] [PubMed] [Google Scholar]
- Dominguez, P.G. , Donev, E. , Derba‐Maceluch, M. , Bünder, A. , Hedenström, M. , Tomášková, I. , Mellerowicz, E.J. et al. (2021) Sucrose synthase determines carbon allocation in developing wood and alters carbon flow at the whole tree level in aspen. New Phytol. 229, 186–198. [DOI] [PubMed] [Google Scholar]
- Donev, E. , Gandla, M.L. , Jönsson, L.J. and Mellerowicz, E.J. (2018) Engineering non‐cellulosic polysaccharides of wood for the biorefinery. Front. Plant Sci. 9, 1537. [DOI] [PMC free article] [PubMed] [Google Scholar]
- Dümmer, M. , Michalski, C. , Essen, L.O. , Rath, M. , Galland, P. and Forreiter, C. (2016) EHB1 and AGD12, two calcium‐dependent proteins affect gravitropism antagonistically in Arabidopsis thaliana . J. Plant Physiol. 206, 114–124. [DOI] [PubMed] [Google Scholar]
- El Houari, I. , Boerjan, W. and Vanholme, B. (2021a) Behind the scenes: the impact of bioactive phenylpropanoids on the growth phenotypes of Arabidopsis lignin mutants. Front. Plant Sci. 12, 734070. [DOI] [PMC free article] [PubMed] [Google Scholar]
- El Houari, I. , Van Beirs, C. , Arents, H.E. , Han, H. , Chanoca, A. , Opdenacker, D. et al. (2021b) Seedling developmental defects upon blocking CINNAMATE‐4‐HYDROXYLASE are caused by perturbations in auxin transport. New Phytol. 230, 2275–2291. [DOI] [PubMed] [Google Scholar]
- Escamez, S. , Latha Gandla, M. , Derba‐Maceluch, M. , Lundqvist, S.O. , Mellerowicz, E.J. , Jönsson, L.J. and Tuominen, H. (2017) A collection of genetically engineered Populus trees reveals wood biomass traits that predict glucose yield from enzymatic hydrolysis. Sci. Rep. 7, 15798. [DOI] [PMC free article] [PubMed] [Google Scholar]
- Eudes, A. , George, A. , Mukerjee, P. , Kim, J.S. , Pollet, B. , Benke, P.I. , Yang, F. et al. (2012) Biosynthesis and incorporation of side‐chain‐truncated lignin monomers to reduce lignin polymerization and enhance saccharification. Plant Biotechnol. J. 10, 609–620. [DOI] [PubMed] [Google Scholar]
- Fagerstedt, K.V. , Mellerowicz, E. , Gorshkova, T. , Ruel, K. and Joseleau, J.‐P. (2014) Cell wall polymers in reaction wood. In The Biology of Reaction Wood. Springer series in wood science. ( Gardiner, B. , Barnett, J. , Saranpää, P. and Gril, J. , eds), pp. 37–106. Berlin: Springer‐Verlag. [Google Scholar]
- Foston, M. , Hubbell, C.A. , Samuel, R. , Jung, S. , Fan, H. , Shi‐You Ding, S.‐H. et al. (2011) Chemical, ultrastructural and supramolecular analysis of tension wood in Populus tremula x alba as a model substrate for reduced recalcitrance. Energy Environ. Sci. 4, 4962–4971. [Google Scholar]
- Funahashi, F. , Ohta, S. , Taniguchi, T. , Kurita, M. , Konagaya, K. and Hayashi, T. (2014) Architectural and physiological characteristics related to the depressed growth of poplars overexpressing xyloglucanase in a field study. Trees 28, 65–76. [Google Scholar]
- Galindo‐Prieto, B. , Eriksson, L. and Trygg, J. (2014) Variable influence on projection (VIP) for orthogonal projections to latent structures (OPLS). J. Chemom. 28, 623–632. [Google Scholar]
- Gallego‐Giraldo, L. , Escamilla‐Trevino, L. , Jackson, L.A. and Dixon, R.A. (2011) Salicylic acid mediates the reduced growth of lignin down‐regulated plants. Proc. Natl. Acad. Sci. U. S. A. 108, 20814–20819. [DOI] [PMC free article] [PubMed] [Google Scholar]
- Gallego‐Giraldo, L. , Liu, C. , Pose‐Albacete, S. , Pattathil, S. , Peralta, A.G. , Young, J. , Westpheling, J. et al. (2020) ARABIDOPSIS DEHISCENCE ZONE POLYGALACTURONASE 1 (ADPG1) releases latent defense signals in stems with reduced lignin content. Proc. Natl. Acad. Sci. U. S. A. 117, 3281–3290. [DOI] [PMC free article] [PubMed] [Google Scholar]
- Gandla, L.M. , Derba‐Maceluch, M. , Liu, X. , Gerber, L. , Master, E.R. , Mellerowicz, E.J. et al. (2015) Expression of a fungal glucuronoyl esterase in Populus: effects on wood properties and saccharification efficiency. Phytochemistry 112, 210–220. [DOI] [PubMed] [Google Scholar]
- Gandla, M.L. , Mähler, N. , Escamez, S. , Skotare, T. , Obudulu, O. , Möller, L. , Abreu, I.N. et al. (2021) Overexpression of vesicle‐associated membrane protein PttVAP27‐17 as a tool to improve biomass production and the overall saccharification yields in Populus trees. Biotechnol. Biofuels 14, 43. [DOI] [PMC free article] [PubMed] [Google Scholar]
- Gerber, L. , Eliasson, M. , Trygg, J. , Moritz, T. and Sundberg, B. (2012) Multivariate curve resolution provides a high‐throughput data processing pipeline for pyrolysis‐gas chromatography/mass spectrometry. J. Anal. Appl. Pyrolysis 95, 95–100. [Google Scholar]
- Gerber, L. , Zhang, B. , Roach, M. , Rende, U. , Gorzsás, A. , Kumar, M. , Burgert, I. et al. (2014) Deficient sucrose synthase activity in developing wood does not specifically affect cellulose biosynthesis, but causes an overall decrease in cell wall polymers. New Phytol. 203, 1220–1230. [DOI] [PubMed] [Google Scholar]
- Gu, Z. , Eils, R. and Schlesner, M. (2016) Complex heatmaps reveal patterns and correlations in multidimensional genomic data. Bioinformatics 32, 2847–2849. [DOI] [PubMed] [Google Scholar]
- Hao, Z. , Yogiswara, S. , Wei, T. , Benites, V.T. , Sinha, A. , Wang, G. , Baidoo, E.E.K. et al. (2021) Expression of a bacterial 3‐dehydroshikimate dehydratase (QsuB) reduces lignin and improves biomass saccharification efficiency in switchgrass (Panicum virgatum L.). BMC Plant Biol. 21, 56. [DOI] [PMC free article] [PubMed] [Google Scholar]
- Hawkins, S. , Leplé, J.‐C. , Cornu, D. , Jouanin, L. and Pilate, G. (2003) Stability of transgene expression in poplar: a model forest tree species. Ann. For. Sci. 60, 427–438. [Google Scholar]
- Hertzberg, M. , Aspeborg, H. , Schrader, J. , Andersson, A. , Erlandsson, R. , Blomqvist, K. , Bhalerao, R. et al. (2001) A transcriptional roadmap to wood formation. Proc. Natl. Acad. Sci. U. S. A. 98, 14732–14737. [DOI] [PMC free article] [PubMed] [Google Scholar]
- Himmel, M.E. , Ding, S.‐Y. , Johnson, D.K. , Adney, W.S. , Nimlos, M.R. , Brady, J.W. and Foust, T.D. (2007) Biomass recalcitrance: engineering plants and enzymes for biofuels production. Science 315, 804–807. [DOI] [PubMed] [Google Scholar]
- Hinchee, M. , Rottmann, W. , Mullinax, L. , Zhang, C. , Chang, S. , Cunningham, M. , Pearson, L. et al. (2009) Short‐rotation woody crops for bioenergy and biofuels applications. In Vitro Cell Dev. Biol. Plant 45, 619–629. [DOI] [PMC free article] [PubMed] [Google Scholar]
- Hothorn, T. , Bretz, F. and Westfall, P. (2008) Simultaneous inference in general parametric models. Biom. J. 50, 346–363. [DOI] [PubMed] [Google Scholar]
- Jensen, R.B. , Lykke‐Andersen, K. , Frandsen, G.I. , Nielsen, H.B. , Haseloff, J. , Jespersen, H.M. , Mundy, J. et al. (2000) Promiscuous and specific phospholipid binding by domains in ZAC, a membrane‐associated Arabidopsis protein with an ARF GAP zinc finger and a C2 domain. Plant Mol. Biol. 44, 799–814. [DOI] [PubMed] [Google Scholar]
- Jin, Y. , Ye, N. , Zhu, F. , Li, H. , Wang, J. , Jiang, L. and Zhang, J. (2017) Calcium‐dependent protein kinase CPK28 targets the methionine adenosyltransferases for degradation by the 26 S proteasome and affects ethylene biosynthesis and lignin deposition in Arabidopsis. Plant J. 90, 304–318. [DOI] [PubMed] [Google Scholar]
- Karimi, M. , Inzé, D. and Depicker, A. (2002) GATEWAY vectors for Agrobacterium‐mediated plant transformation. Trends Plant Sci. 7, 193–195. [DOI] [PubMed] [Google Scholar]
- Kawai, Y. , Ono, E. and Mizutani, M. (2014) Evolution and diversity of the 2‐oxoglutarate‐dependent dioxygenase superfamily in plants. Plant J. 78, 328–343. [DOI] [PubMed] [Google Scholar]
- Kim, N.Y. , Jeon, H.S. , Lee, M.‐H. , Cha, A. , Lee, D.S. , Lee, H.J. , Kim, H.G. et al. (2018) Field evaluation of transgenic poplars expressing the constitutively active small G protein for improved biomass traits. Biomass Bioenergy 109, 16–22. [Google Scholar]
- Ko, J.‐H. , Han, K.‐H. , Park, S. and Yang, J. (2004) Plant body weight‐induced secondary growth in Arabidopsis and its transcription phenotype revealed by whole‐transcriptome profiling. Plant Physiol. 135, 1069–1083. [DOI] [PMC free article] [PubMed] [Google Scholar]
- Ko, J.K. , Lee, J.H. , Jung, J.H. and Lee, S.‐M. (2020) Recent advances and future directions in plant and yeast engineering to improve lignocellulosic biofuel production. Renew. Sust. Energ. Rev. 134, 110390. [Google Scholar]
- Koncz, C. , Martini, N. , Szabados, L. , Hrouda, M. , Bachmair, A. and Schell, J. (1994) Specialized vectors for gene tagging and expression studies. In Plant Molecular Biology Manual, 2nd edn, Vol. B ( Gelvin, S.B. , Schilperoort, R.A. and Verma, D.P.S. , eds), pp. 1–22. Dordrecht, The Netherlands: Kluwer Academic Publisher. [Google Scholar]
- Kumar, B. and Verma, P. (2021) Life cycle assessment: blazing a trail for bioresources management Energy Convers . Manage X10, 100063. [Google Scholar]
- Li, Q. , Song, J. , Peng, S. , Wang, J.P. , Qu, G.Z. , Sederoff, R.R. and Chiang, V.L. (2014) Plant biotechnology for lignocellulosic biofuel production. Plant Biotechnol. J. 12, 1174–1192. [DOI] [PubMed] [Google Scholar]
- Li, M. , Pu, Y. and Ragauskas, A.J. (2016) Current understanding of the correlation of lignin structure with biomass recalcitrance. Front. Chem. 4, 45. [DOI] [PMC free article] [PubMed] [Google Scholar]
- Li, Y. , Xiong, W. , He, F. , Qi, T. , Sun, Z. , Liu, Y. , Bai, S. et al. (2022) Down‐regulation of PvSAMS impairs S‐adenosyl‐L‐methionine and lignin biosynthesis, and improves cell wall digestibility in switchgrass. J. Exp. Bot. 73, 4157–4169. [DOI] [PubMed] [Google Scholar]
- Lloyd, A.D. , Mellerowicz, E.J. , Riding, R.T. and Little, C.H.A. (1996) Changes in nuclear genome size and relative ribosomal RNA gene content in the vascular cambium of Abies balsamea during the annual activity‐dormancy transition. Can. J. Bot. 74, 290–298. [Google Scholar]
- Lundqvist, S.‐O. , Grahn, T. , Olsson, L. and Seifert, T. (2017) Comparison of wood, fibre and vessel properties of drought‐tolerant eucalypts in South Africa. Southern Forests 79, 215–225. [Google Scholar]
- Macaya‐Sanz, D. , Chen, J.G. , Kalluri, U.C. , Muchero, W. , Tschaplinski, T.J. , Gunter, L.E. , Simon, S.J. et al. (2017) Agronomic performance of Populus deltoides trees engineered for biofuel production. Biotechnol. Biofuels 10, 253. [DOI] [PMC free article] [PubMed] [Google Scholar]
- Mansfield, S.D. , Kang, K.‐Y. and Chapple, C. (2012) Designed for deconstruction –poplar trees altered in cell wall lignification improve the efficacy of bioethanol production. New Phytol. 194, 91–101. [DOI] [PubMed] [Google Scholar]
- Martín, C. , Dixit, P. , Momayez, F. and Jönsson, L.J. (2022) Hydrothermal pretreatment of lignocellulosic feedstocks to facilitate biochemical conversion. Front. Bioeng. Biotechnol. 10, 846592. [DOI] [PMC free article] [PubMed] [Google Scholar]
- Martínez‐Abad, A. , Giummarella, N. , Lawoko, M. and Vilaplana, F. (2018) Differences in extractability under subcritical water reveal interconnected hemicellulose and lignin recalcitrance in birch hardwoods. Green Chem. 20, 2534–2546. [Google Scholar]
- McCann, M.C. and Carpita, N.C. (2015) Biomass recalcitrance: a multi‐scale, multi‐factor, and conversion‐specific property. J. Exp. Bot. 66, 4109–4118. [DOI] [PubMed] [Google Scholar]
- McKee, L.S. , Sunner, H. , Anasontzis, G.E. , Toriz, G. , Gatenholm, P. , Bulone, V. , Vilaplana, F. et al. (2016) A GH115 α‐glucuronidase from Schizophyllum commune contributes to the synergistic enzymatic deconstruction of softwood glucuronoarabinoxylan. Biotechnol. Biofuels 9, 2. [DOI] [PMC free article] [PubMed] [Google Scholar]
- Meier, D. , Fortmann, I. , Odermatt, J. and Faix, O. (2005) Discrimination of genetically modified poplar clones by analytical pyrolysis‐gas chromatography and principal component analysis. J. Anal. Appl. Pyrolysis 74, 129–137. [Google Scholar]
- Mellerowicz, E.J. , Riding, R.T. and Little, C.H.A. (1989) Genomic variability in the vascular cambium of Abies balsamea . Can. J. Bot. 67, 990–996. [Google Scholar]
- Mellerowicz, E.J. , Riding, R.T. and Little, C.H.A. (1992) Periodicity of cambial activity in Abies balsamea. II. Effects of temperature and photoperiod on the size of nuclear genome in fusiform cambial cells. Physiol. Plant. 85, 526–530. [Google Scholar]
- Mellerowicz, E.J. , Baucher, M. , Sundberg, B. and Bojeran, W. (2001) Unraveling cell wall formation in the woody dicot stem. Plant Mol. Biol. 47, 239–274. [PubMed] [Google Scholar]
- Min, D. , Li, Q. , Jameel, H. , Chiang, V. and Chang, H.‐M. (2012) The cellulase‐mediated saccharification on wood derived from transgenic low‐lignin lines of black cottonwood (Populus trichocarpa). Appl. Biochem. Biotechnol. 168, 947–955. [DOI] [PubMed] [Google Scholar]
- Nilsson, O. , Aldén, T. , Sitbon, F. , Little, C.H.A. , Chalupa, V. , Sandberg, G. et al. (1992) Spatial pattern of cauliflower mosaic virus 35 S promoter‐luciferase expression in transgenic hybrid aspen trees monitored by enzymatic assay and non‐destructive imaging. Transgenic Res. 1, 209–220. [Google Scholar]
- Park, Y.W. , Baba, K. , Furuta, Y. , Iida, I. , Sameshima, K. , Arai, M. et al. (2004) Enhancement of growth and cellulose accumulation by overexpression of xyloglucanase in poplar. FEBS Lett. 564, 183–187. [DOI] [PubMed] [Google Scholar]
- Pawar, P.M.‐A. , Derba‐Maceluch, M. , Chong, S.‐L. , Gandla, M.L. , Bashar, S.S. , Sparrman, T. , Ahvenainen, P. et al. (2017) In muro deacetylation of xylan increases lignin extractability and improves saccharification of aspen wood. Biotechnol. Biofuels 10, 98. [DOI] [PMC free article] [PubMed] [Google Scholar]
- Pfaffl, M.W. (2001) A new mathematical model for relative quantification in real‐time RT‐PCR. Nucleic Acids Res. 29, e45. [DOI] [PMC free article] [PubMed] [Google Scholar]
- Pilate, G. , Guiney, E. , Holt, K. , Petit‐Conil, M. , Lapierre, C. , Leplé, J.C. , Pollet, B. et al. (2002) Field and pulping performances of transgenic trees with altered lignification. Nature Biotech 20, 607–612. [DOI] [PubMed] [Google Scholar]
- Pramod, S. , Gandla, M.L. , Derba‐Maceluch, M. , Jönsson, L.J. , Mellerowicz, E.J. and Winestrand, S. (2021) Saccharification potential of transgenic greenhouse‐ and field‐grown aspen engineered for reduced xylan acetylation. Front. Plant Sci. 12, 704960. [DOI] [PMC free article] [PubMed] [Google Scholar]
- R Core Team (2019) R: A Language and Environment for Statistical Computing. Vienna, Austria: R Foundation for Statistical Computing. https://www.R‐project.org. [Google Scholar]
- Ratke, C. , Pawar, P.M. , Balasubramanian, V.K. , Naumann, M. , Duncranz, M.L. , Derba‐Maceluch, M. et al. (2015) Populus GT43 family members group into distinct sets required for primary and secondary wall xylan biosynthesis and include useful promoters for wood modification. Plant Biotechnol. J. 13, 26–37. [DOI] [PubMed] [Google Scholar]
- Saeman, J.F. , Moore, W.E. , Mitchell, R.L. and Millett, M.A. (1954) Technique for the determination of pulp constituents by quantitative paper chromatography. TAPPI J. 37, 336–343. [Google Scholar]
- Sannigrahi, P. , Ragauskas, A.J. and Tuskan, G.A. (2010) Poplar as a feedstock for biofuels: a review of compositional characteristics. Biofpr. 4, 209–226. [Google Scholar]
- Schilmiller, A.L. , Stout, J. , Weng, J.K. , Humphreys, J. , Ruegger, M.O. and Chapple, C. (2009) Mutations in the cinnamate 4-hydroxylase gene impact metabolism, growth and development in Arabidopsis. The Plant J. 60, 771–782. [DOI] [PubMed] [Google Scholar]
- Serapiglia, M.J. , Humiston, M.C. , Xu, H. , Hogsett, D.A. , de Orduña, R.M. , Stipanovic, A.J. and Smart, L.B. (2013) Enzymatic saccharification of shrub willow genotypes with differing biomass composition for biofuel production. Front. Plant Sci. 4, 57. [DOI] [PMC free article] [PubMed] [Google Scholar]
- Sewalt, V. , Ni, W. , Blount, J.W. , Jung, H.G. , Masoud, S.A. , Howles, P.A. , Lamb, C. et al. (1997) Reduced lignin content and altered lignin composition in transgenic tobacco down‐regulated in expression of L‐phenylalanine ammonia‐lyase or cinnamate 4‐hydroxylase. Plant Physiol. 115, 41–50. [DOI] [PMC free article] [PubMed] [Google Scholar]
- Silveira, R.L. , Stoyanov, S.R. , Gusarov, S. , Skaf, M.S. and Kovalenko, A. (2013) Plant Biomass Recalcitrance: effect of hemicellulose composition on nanoscale forces that control cell wall strength. J. Am. Chem. Soc. 135, 19048–19051. [DOI] [PubMed] [Google Scholar]
- Stein, O. and Granot, D. (2019) An overview of sucrose synthases in plants. Front. Plant Sci. 10, 95. [DOI] [PMC free article] [PubMed] [Google Scholar]
- Strauss, S.H. , Ma, C. , Ault, K. and Klocko, A.L. (2016) Lessons from two decades of field trials with genetically modified trees in the USA: biology and regulatory compliance. In Biosafety of Forest Transgenic Trees( Vettori, C. , Gallardo, F. , Häggman, H. , Kazana, V. , Migliacci, F. , Pilate, G. and Fladung, M. , eds), pp. 101–124. Dordrecht: Springer. [Google Scholar]
- Studer, M.H. , DeMartini, J.D. , Davis, M.F. , Sykes, R.W. , Davison, B. , Keller, M. , Tuskan, G.A. et al. (2011) Lignin content in natural Populus variants affects sugar release. Proc. Natl. Acad. Sci. U. S. A. 108, 6300–6305. [DOI] [PMC free article] [PubMed] [Google Scholar]
- Sundell, D. , Street, N.R. , Kumar, M. , Mellerowicz, E.J. , Kucukoglu, M. , Johnsson, C. , Kumar, V. et al. (2017) AspWood: high‐spatial‐resolution transcriptome profiles reveal uncharacterized modularity of wood formation in Populus tremula . Plant Cell 29, 1585–1604. [DOI] [PMC free article] [PubMed] [Google Scholar]
- Sykes, R.W. , Gjersing, E.L. , Foutz, K. , Rottmann, W.H. , Kuhn, S.A. , Foster, C.E. , Ziebell, A. et al. (2015) Down‐regulation of p‐coumaroyl quinate/shikimate 3′‐hydroxylase (C3'H) and cinnamate 4‐hydroxylase (C4H) genes in the lignin biosynthetic pathway of Eucalyptus urophylla × E. grandis leads to improved sugar release. Biotechnol. Biofuels 8, 128. [DOI] [PMC free article] [PubMed] [Google Scholar]
- Taniguchi, T. , Konagaya, K. , Kurita, M. , Takata, N. , Ishii, K. , Kondo, T. , Funahashi, F. et al. (2012) Growth and root sucker ability of field‐grown transgenic poplars overexpressing xyloglucanase. J. Wood Sci. 58, 550–556. [Google Scholar]
- Van Acker, R. , Leplé, J.C. , Aerts, D. , Storme, V. , Goeminne, G. , Ivens, B. et al. (2014) Improved saccharification and ethanol yield from field‐grown transgenic poplar deficient in cinnamoyl‐CoA reductase. Proc. Natl. Acad. Sci. U. S. A. 111, 845–850. [DOI] [PMC free article] [PubMed] [Google Scholar]
- Van Rossum, G. and Drake, F.L. (2009) Python 3 Reference Manual. Scotts Valley, CA: CreateSpace. [Google Scholar]
- Vandesompele, J. , De Preter, K. , Pattyn, F. , Poppe, B. , Van Roy, N. , De Paepe, A. et al. (2002) Accurate normalization of real‐time quantitative RT‐PCR data by geometric averaging of multiple internal control genes. Genome Biol. 3, 0034. [DOI] [PMC free article] [PubMed] [Google Scholar]
- Voelker, S.L. , Lachenbruch, B. , Meinzer, F.C. , Kitin, P. and Strauss, S.H. (2011) Transgenic poplars with reduced lignin show impaired xylem conductivity, growth efficiency and survival. Plant Cell Environ. 34, 655–668. [DOI] [PubMed] [Google Scholar]
- Wang, Z. , Winestrand, S. , Gillgren, T. and Jönsson, L.J. (2018) Chemical and structural factors influencing enzymatic saccharification of wood from aspen, birch and spruce. Biomass Bioenergy 109, 125–134. [Google Scholar]
- Wilkerson, C.G. , Mansfield, S.D. , Lu, F. , Withers, S. , Park, J.Y. , Karlen, S.D. , Gonzales‐Vigil, E. et al. (2014) Monolignol ferulate transferase introduces chemically labile linkages into the lignin backbone. Science 344, 90–93. [DOI] [PubMed] [Google Scholar]
- Yan, X. , Ma, L. , Pang, H. , Wang, P. , Liu, L. , Cheng, Y. , Cheng, J. et al. (2019) METHIONINE SYNTHASE1 is involved in chromatin silencing by maintaining DNA and histone methylation. Plant Physiol. 181, 249–261. [DOI] [PMC free article] [PubMed] [Google Scholar]
- Yang, T. , Echols, M. , Martin, A. and Bar‐Peled, M. (2010) Identification and characterization of a strict and a promiscuous N‐acetylglucosamine‐1‐P uridylyltransferase in Arabidopsis. The Biochem. J. 430, 275–284. [DOI] [PubMed] [Google Scholar]
Associated Data
This section collects any data citations, data availability statements, or supplementary materials included in this article.
Supplementary Materials
Figure S1 Correlation between the height growth in the field at harvest in 2016 and the height observed in the greenhouse.
Figure S2 Wood anatomy traits of transgenic and wild‐type (WT) hybrid aspen grown in the field conditions for 5 years based on SilviScan analysis of growth rings 2012–2015.
Figure S3 Wood quality traits at the end of year 2015 of transgenic and wild‐type (WT) hybrid aspen grown in the field conditions for 5 years based on SilviScan analysis of growth rings 2012–2015.
Figure S4 Cross‐sectional area occupied by tension wood (TW) at the end of year 2015 in transgenic and wild‐type (WT) lines grown in the field conditions for 5 years based on NIR spectral analysis.
Figure S5 Sugar composition of wood in transgenic and wild‐type (WT) hybrid aspen grown in the field conditions for 5 years.
Figure S6 Glucose (Glc) conversion in saccharification of transgenic and wild‐type (WT) hybrid aspen grown in the field conditions for 5 years.
Figure S7 Nanoporosity of lignocellulose in transgenic and wild‐type (WT) hybrid aspen grown in the field conditions for 5 years based on Brunauer–Emmett–Teller (BET) analysis.
Figure S8 Total and polysaccharide yields and polysaccharide composition of extracts obtained by subcritical water extraction of lignocellulose in transgenic and wild‐type (WT) hybrid aspen grown in the field conditions for 5 years.
Table S1 Lines used in this study. Target gene expression levels analysed by RT‐qPCR, height, diameter, biomass and biomass per ha for all trees planted in the field after five growth seasons.
Table S2 Complete summary of sugar yields in saccharification without (NP) and with (PT) acid pretreatment and stem and total (stem and branches) biomass yields for trees used for saccharification.
Table S3 OPLS‐VIP models of glucose saccharification yields for wood lignocellulose from field grown transgenic lines and WT.
Table S4 Primers used in this study.