

Abstract
Background
Schizophrenia is a mental illness causing disordered beliefs, ideas and sensations. Many people with schizophrenia smoke cannabis, and it is unclear why a large proportion do so and if the effects are harmful or beneficial. It is also unclear what the best method is to allow people with schizophrenia to alter their cannabis intake.
Objectives
To assess the effects of specific psychological treatments for cannabis reduction in people with schizophrenia. To assess the effects of antipsychotics for cannabis reduction in people with schizophrenia. To assess the effects of cannabinoids (cannabis related chemical compounds derived from cannabis or manufactured) for symptom reduction in people with schizophrenia.
Search methods
We searched the Cochrane Schizophrenia Group Trials Register, 12 August 2013, which is based on regular searches of BIOSIS, CINAHL, EMBASE, MEDLINE, PUBMED and PsycINFO.
We searched all references of articles selected for inclusion for further relevant trials. We contacted the first author of included studies for unpublished trials or data.
Selection criteria
We included all randomised controlled trials involving cannabinoids and schizophrenia/schizophrenia‐like illnesses, which assessed:
1) treatments to reduce cannabis use in people with schizophrenia;
2) the effects of cannabinoids on people with schizophrenia.
Data collection and analysis
We independently inspected citations, selected papers and then re‐inspected the studies if there were discrepancies, and extracted data. For dichotomous data we calculated risk ratios (RR) and for continuous data, we calculated mean differences (MD), both with 95% confidence intervals (CI) on an intention‐to‐treat basis, based on a fixed‐effect model. We excluded data if loss to follow‐up was greater than 50%. We assessed risk of bias for included studies and used GRADE to rate the quality of the evidence.
Main results
We identified eight randomised trials, involving 530 participants, which met our selection criteria.
For the cannabis reduction studies no one treatment showed superiority for reduction in cannabis use. Overall, data were poorly reported for many outcomes of interest. Our main outcomes of interest were medium‐term data for cannabis use, global state, mental state, global functioning, adverse events, leaving the study early and satisfaction with treatment.
1. Reduction in cannabis use: adjunct psychological therapies (specifically about cannabis and psychosis) versus treatment as usual
Results from one small study showed people receiving adjunct psychological therapies specifically about cannabis and psychosis were no more likely to reduce their intake than those receiving treatment as usual (n = 54, 1 RCT, MD ‐0.10, 95% CI ‐2.44 to 2.24, moderate quality evidence). Results for other main outcomes at medium term were also equivocal. No difference in mental state measured on the PANSS positive were observed between groups (n = 62, 1 RCT, MD ‐0.30 95% CI ‐2.55 to 1.95, moderate quality evidence). Nor for the outcome of general functioning measured using the World Health Organization Quality of Life BREF (n = 49, 1 RCT, MD 0.90 95% CI ‐1.15 to 2.95, moderate quality evidence). No data were reported for the other main outcomes of interest
2. Reduction in cannabis use: adjunct psychological therapy (specifically about cannabis and psychosis) versus adjunct non‐specific psychoeducation
One study compared specific psychological therapy aimed at cannabis reduction with general psychological therapy. At three‐month follow‐up, the use of cannabis in the previous four weeks was similar between treatment groups (n = 47, 1 RCT, RR 1.04 95% CI 0.62 to 1.74, moderate quality evidence). Again, at a medium‐term follow‐up, the average mental state scores from the Brief Pscychiatric Rating Scale‐Expanded were similar between groups (n = 47, 1 RCT, MD 3.60 95% CI ‐ 5.61 to 12.81, moderate quality evidence). No data were reported for the other main outcomes of interest: global state, general functioning, adverse events, leaving the study early and satisfaction with treatment.
3. Reduction in cannabis use: antipsychotic versus antipsychotic
In a small trial comparing effectiveness of olanzapine versus risperidone for cannabis reduction, there was no difference between groups at medium‐term follow‐up (n = 16, 1 RCT, RR 1.80 95% CI 0.52 to 6.22, moderate quality evidence). The number of participants leaving the study early at medium term was also similar (n = 28, 1 RCT, RR 0.50 95% CI 0.19 to 1.29, moderate quality evidence). Mental state data were reported, however they were reported within the short term and no difference was observed. No data were reported for global state, general functioning, and satisfaction with treatment.
With regards to adverse effects data, no study reported medium‐term data. Short‐term data were presented but overall, no real differences between treatment groups were observed for adverse effects.
4. Cannabinoid as treatment: cannabidiol versus amisulpride
Again, no data were reported for any of the main outcomes of interest at medium term. There were short‐term data reported for mental state using the BPRS and PANSS, no overall differences in mental state were observed between treatment groups.
Authors' conclusions
Results are limited and inconclusive due to the small number and size of randomised controlled trials available and quality of data reporting within these trials. More research is needed to a) explore the effects of adjunct psychological therapy that is specifically about cannabis and psychosis as currently there is no evidence for any novel intervention being better than standard treatment,for those that use cannabis and have schizophrenia b) decide the most effective drug treatment in treating those that use cannabis and have schizophrenia, and c) assess the effectiveness of cannabidiol in treating schizophrenia. Currently evidence is insufficient to show cannabidiol has an antipsychotic effect.
Keywords: Humans, Amisulpride, Antipsychotic Agents, Antipsychotic Agents/therapeutic use, Benzodiazepines, Benzodiazepines/therapeutic use, Cannabinoids, Cannabinoids/therapeutic use, Marijuana Abuse, Marijuana Abuse/psychology, Marijuana Abuse/therapy, Medical Marijuana, Medical Marijuana/therapeutic use, Olanzapine, Psychotherapy, Randomized Controlled Trials as Topic, Risperidone, Risperidone/therapeutic use, Schizophrenia, Schizophrenia/drug therapy, Sulpiride, Sulpiride/analogs & derivatives, Sulpiride/therapeutic use
Plain language summary
Cannabis for schizophrenia
Many people with the serious mental illness schizophrenia smoke cannabis but it is not known why people do so or the effects of smoking cannabis. It is unclear what the best methods are that help people to reduce or stop smoking cannabis. Cannabis is the most consumed illicit drug in the world – amounting to 120 to 224 million users. Cannabis, which is usually smoked or eaten, gives a feeling of well‐being, but in high doses it may also cause mental illness or psychosis. Clinical evidence suggests people who have schizophrenia have a worse overall outcome from using cannabis, however, there are some people with schizophrenia who claim that using cannabis helps their symptoms and reduces the side effects of antipsychotic medication. This review aims to look at the effects of cannabis, both its use and withdrawal, in people who have schizophrenia. A search for trials was conducted in 2013, eight randomised trials, involving 530 participants were included. Five trials investigated the effects of using a specific psychotherapy aimed at reducing cannabis intake, two investigated the effects of antipsychotic medication for cannabis reduction and one investigated the use of cannbidiol (a compound found in cannabis) as a treatment for the symptoms of schizophrenia.
The results of the review are limited as trial sizes were small and data were poorly reported.
Overall, there is currently no evidence for any intervention, whether it is psychological therapy or medication, being better than standard treatment or each other in reducing or stopping the use of cannabis. More research is needed to explore the benefits of medication or psychological therapy for those with schizophrenia who use cannabis. It is unclear if cannabidiol has an antipsychotic effect.
Ben Gray, Service User Expert, Rethink Mental Illness.
Summary of findings
Summary of findings for the main comparison. CANNABIS REDUCTION: ADJUNCT PSYCHOLOGICAL THERAPY versus TREATMENT AS USUAL for schizophrenia.
| REDUCTION IN CANNABIS USE: TREATMENT AS USUAL AND PSYCHOLOGICAL THERAPY compared with TREATMENT AS USUAL | ||||||
| Patient or population: patients with SCHIZOPHRENIA AND CANNABIS USE Settings: Inpatient, outpatient Intervention: TREATMENT AS USUAL AND PSYCHOLOGICAL THERAPY Comparison: TREATMENT AS USUAL | ||||||
| Outcomes | Illustrative comparative risks* (95% CI) | Relative effect (95% CI) | No of Participants (studies) | Quality of the evidence (GRADE) | Comments | |
| Assumed risk | Corresponding risk | |||||
| TREATMENT AS USUAL | CANNABIS WITHDRAWL: TREATMENT AS USUAL AND PSYCHOLOGICAL THERAPY | |||||
| Behaviour: Cannabis use: 1. frequency of use (group‐based therapy) (high = bad) ‐ medium term Cannabis use. Scale from: 0 to 17. Follow‐up: 1 year | The mean behaviour: cannabis use: 1. frequency of use (group‐based therapy) (high = bad) ‐ medium term in the control groups was 0 points | The mean behaviour: cannabis use: 1. frequency of use (group‐based therapy) (high = bad) ‐ medium term in the intervention groups was 0.1 lower (2.44 lower to 2.24 higher) | 54 (1 study) | ⊕⊕⊕⊝ moderate1 | ||
| Mental state 4 PANSS score Positive symptoms ‐ medium term PANSS Scale from: 7 to 49. Follow‐up: 12 months | The mean mental state 4 PANSS score positive symptoms ‐ medium term in the control groups was ‐0.8 points | The mean mental state 4 PANSS score positive symptoms ‐ medium term in the intervention groups was 0.3 lower (2.55 lower to 1.95 higher) | 62 (1 study) | ⊕⊕⊕⊝ moderate1 | ||
| Global state: relapse ‐ medium term ‐ not reported | See comment | See comment | Not estimable | ‐ | See comment | |
| General Functioning 1: Subjective quality of life (WHO QOL, BREF) ‐ medium term WHO QOL questionnaire. Scale from: 0 to 20. Follow‐up: 1 years | The mean general functioning 1: subjective quality of life (WHO QOL, BREF) ‐ medium term in the control groups was ‐0.7 points | The mean general functioning 1: subjective quality of life (WHO QOL, BREF) ‐ medium term in the intervention groups was 0.9 higher (1.15 lower to 2.95 higher) | 49 (1 study) | ⊕⊕⊕⊝ moderate1 | ||
| Adverse effects: no clinically important adverse effects ‐ medium term ‐ not measured | See comment | See comment | Not estimable | ‐ | See comment | |
| Leaving the study early ‐ medium term ‐ not reported | See comment | See comment | Not estimable | ‐ | See comment | |
| Satisfaction with treatment ‐ medium term ‐ not measured | See comment | See comment | Not estimable | ‐ | See comment | |
| *The basis for the assumed risk (e.g. the median control group risk across studies) is provided in footnotes. The corresponding risk (and its 95% confidence interval) is based on the assumed risk in the comparison group and the relative effect of the intervention (and its 95% CI). CI: Confidence interval; | ||||||
| GRADE Working Group grades of evidence High quality: Further research is very unlikely to change our confidence in the estimate of effect. Moderate quality: Further research is likely to have an important impact on our confidence in the estimate of effect and may change the estimate. Low quality: Further research is very likely to have an important impact on our confidence in the estimate of effect and is likely to change the estimate. Very low quality: We are very uncertain about the estimate. | ||||||
1 Imprecision: rated 'serious' ‐ only one study included with few participants, few events and wide confidence intervals.
Summary of findings 2. CANNABIS REDUCTION: PSYCHOLOGICAL THERAPY (SPECIFICALLY ABOUT CANNABIS AND PSYCHOSIS) versus NON‐SPECIFIC PSYCOEDUCTION for schizophrenia.
| REDUCTION IN CANNABIS USE: "CANNABIS AND PSYCHOSIS THERAPY" versus PSYCHOEDUCATION | ||||||
| Patient or population: patients with SCHIZOPHRENIA AND CANNABIS USE Settings: Outpatient Intervention: CANNABIS AND PSYCHOSIS THERAPY Comparison: PSYCHOEDUCATION | ||||||
| Outcomes | Illustrative comparative risks* (95% CI) | Relative effect (95% CI) | No of Participants (studies) | Quality of the evidence (GRADE) | Comments | |
| Assumed risk | Corresponding risk | |||||
| PSYCHOEDUCATION | CANNABIS WITHDRAWAL: CANNABIS AND PSYCHOSIS THERAPY | |||||
| Behaviour: Cannabis use: Used cannabis in last 4 weeks ‐ medium term Cannabis use Follow‐up: 6 months | Study population | RR 1.04 (0.62 to 1.74) | 47 (1 study) | ⊕⊕⊕⊝ moderate1 | ||
| 542 per 1000 | 563 per 1000 (336 to 943) | |||||
| Moderate | ||||||
| 542 per 1000 | 564 per 1000 (336 to 943) | |||||
| Mental state: 1. Average score (BPRS‐E total endpoint, higher scores = poor) ‐ medium term BPRS‐E. Scale from: 0 to 168. Follow‐up: mean 6 months | The mean mental state: 1. average score (BPRS‐E total endpoint, higher scores = poor) ‐ medium term in the control groups was 47.7 Points | The mean mental state: 1. average score (BPRS‐E total endpoint, higher scores = poor) ‐ medium term in the intervention groups was 3.60 lower (12.81 lower to 5.61 higher) | 47 (1 study) | ⊕⊕⊕⊝ moderate1 | ||
| Global state: relapse ‐ medium term ‐ not reported | See comment | See comment | Not estimable | ‐ | See comment | |
| General functioning: no clinically important change in general functioning ‐ medium term ‐ not reported | See comment | See comment | Not estimable | ‐ | See comment | |
| Adverse effects: no clinically important adverse effects ‐ medium term ‐ not measured | See comment | See comment | Not estimable | ‐ | See comment | |
| Leaving the study early ‐ medium term ‐ not reported | See comment | See comment | Not estimable | ‐ | See comment | |
| Satisfaction with treatment ‐ medium term ‐ not measured | See comment | See comment | Not estimable | ‐ | See comment | |
| *The basis for the assumed risk (e.g. the median control group risk across studies) is provided in footnotes. The corresponding risk (and its 95% confidence interval) is based on the assumed risk in the comparison group and the relative effect of the intervention (and its 95% CI). CI: Confidence interval; RR: Risk ratio; | ||||||
| GRADE Working Group grades of evidence High quality: Further research is very unlikely to change our confidence in the estimate of effect. Moderate quality: Further research is likely to have an important impact on our confidence in the estimate of effect and may change the estimate. Low quality: Further research is very likely to have an important impact on our confidence in the estimate of effect and is likely to change the estimate. Very low quality: We are very uncertain about the estimate. | ||||||
1 Imprecision: rated 'serious' ‐ only one study included with few participants, few events and wide confidence intervals.
Summary of findings 3. CANNABIS REDUCTION: ANTIPSYCHOTIC 'A' versus ANTIPSYCHOTIC 'B' for.
| REDUCTION IN CANNABIS USE: ANTIPSYCHOTIC compared with ANTIPSYCHOTIC. | ||||||
| Patient or population: patients with SCHIZOPHRENIA. Settings: Inpatient, outpatient. Intervention: ANTIPSYCHOTIC versus ANTIPSYCHOTIC | ||||||
| Outcomes | Illustrative comparative risks* (95% CI) | Relative effect (95% CI) | No of Participants (studies) | Quality of the evidence (GRADE) | Comments | |
| Assumed risk | Corresponding risk | |||||
| RISPERIDONE vs CLOZAPINE | OLANZAPINE | |||||
| Behaviour: Cannabis use 3: Traces of cannabis breakdown products in urine ‐ medium term Follow‐up: 14 weeks | Study population | RR 1.8 (0.52 to 6.22) | 16 (1 study) | ⊕⊕⊕⊝ moderate1 | ||
| 333 per 1000 | 600 per 1000 (173 to 1000) | |||||
| Moderate | ||||||
| 333 per 1000 | 599 per 1000 (173 to 1000) | |||||
| **Mental state: Obsessive–Compulsive Drug Use Scale (OCDUS) (short‐term, higher=bad) ‐ short term Scale from: 0 to 44. Follow‐up: 6 weeks | 2 | The mean mental state: obsessive–compulsive drug use scale (OCDUS) (short term, higher = bad) ‐ medium term in the intervention groups was 1.3 lower (6.11 lower to 3.51 higher) | 41 (1 study) | ⊕⊕⊕⊝ moderate1 | ||
| Global state: relapse ‐ medium term ‐ not measured | See comment | See comment | Not estimable | ‐ | See comment | |
| General functioning: no clinically important change in general functioning ‐ medium term ‐ not measured | See comment | See comment | Not estimable | ‐ | See comment | |
| Adverse effects: measured adverse events ‐ Simpson scale ‐ medium term Scale from: 0 to 40. Follow‐up: 14 weeks | 2 | The mean adverse effects: measured adverse events ‐ Simpson scale ‐ medium term in the intervention groups was 0.08 higher (1.06 lower to 1.22 higher) | 2 (1 study) | ⊕⊕⊕⊝ moderate1 | ||
| Leaving the study early: any reason ‐ medium term Follow‐up: 14 weeks | Study population | RR 0.5 (0.19 to 1.29) | 28 (1 study) | ⊕⊕⊕⊝ moderate1 | ||
| 571 per 1000 | 286 per 1000 (109 to 737) | |||||
| Moderate | ||||||
| 571 per 1000 | 285 per 1000 (108 to 737) | |||||
| Satisfaction with treatment ‐ medium term ‐ not measured | See comment | See comment | Not estimable | ‐ | See comment | |
| *The basis for the assumed risk (e.g. the median control group risk across studies) is provided in footnotes. The corresponding risk (and its 95% confidence interval) is based on the assumed risk in the comparison group and the relative effect of the intervention (and its 95% CI). ** Main outcome was specified as medium term, however no data was available at this time point, and so short term was used instead. CI: Confidence interval; RR: Risk ratio; | ||||||
| GRADE Working Group grades of evidence High quality: Further research is very unlikely to change our confidence in the estimate of effect. Moderate quality: Further research is likely to have an important impact on our confidence in the estimate of effect and may change the estimate. Low quality: Further research is very likely to have an important impact on our confidence in the estimate of effect and is likely to change the estimate. Very low quality: We are very uncertain about the estimate. | ||||||
1 Imprecision: rated 'serious' ‐ only one study included with few participants, few events and wide confidence intervals. 2 No control arm ‐ comparison between two antipsychotics.
Summary of findings 4. CANNABINOID AS TREATMENT: CANNABIDIOL compared with AMISULPRIDE for SCHIZOPHRENIA.
| CANNABINOID AS TREATMENT: CANNABIDIOL compared with AMISULPRIDE for SCHIZOPHRENIA | ||||||
| Patient or population: patients with SCHIZOPHRENIA Settings: Inpatient Intervention: CANNABIDIOL Comparison: AMISULPRIDE | ||||||
| Outcomes | Illustrative comparative risks* (95% CI) | Relative effect (95% CI) | No of Participants (studies) | Quality of the evidence (GRADE) | Comments | |
| Assumed risk | Corresponding risk | |||||
| AMISULPRIDE | CANNABIDIOL | |||||
| Behaviour: Cannabis use: 1. frequency of use (group‐based therapy) (high = bad) ‐ medium term ‐ not measured | See comment | See comment | Not estimable | ‐ | See comment | not measured |
| Mental state: PANSS total (high = bad) ‐ medium term ‐ not measured | See comment | See comment | Not estimable | ‐ | See comment | not measured |
| Global state: relapse ‐ medium term ‐ not measured | See comment | See comment | Not estimable | ‐ | See comment | not measured |
| General functioning: no clinically important change in general functioning ‐ medium term ‐ not measured | See comment | See comment | Not estimable | ‐ | See comment | not measured |
| Adverse effects: measured adverse events ‐ medium term ‐ not measured | See comment | See comment | Not estimable | ‐ | See comment | not measured |
| Leaving the study early: any reason ‐ medium term ‐ not measured | See comment | See comment | Not estimable | ‐ | See comment | not measured |
| Satisfaction with treatment ‐ medium term ‐ not measured | See comment | See comment | Not estimable | ‐ | See comment | not measured |
| *The basis for the assumed risk (e.g. the median control group risk across studies) is provided in footnotes. The corresponding risk (and its 95% confidence interval) is based on the assumed risk in the comparison group and the relative effect of the intervention (and its 95% CI). CI: Confidence interval; | ||||||
| GRADE Working Group grades of evidence High quality: Further research is very unlikely to change our confidence in the estimate of effect. Moderate quality: Further research is likely to have an important impact on our confidence in the estimate of effect and may change the estimate. Low quality: Further research is very likely to have an important impact on our confidence in the estimate of effect and is likely to change the estimate. Very low quality: We are very uncertain about the estimate. | ||||||
Background
Description of the condition
Schizophrenia is a complex mental condition that affects approximately 1% of the population at some stage in their life (Kolliakou 2011). It is characterised by three symptom categories: positive symptoms, including delusions, thought and speech disorders, and hallucinations that range from visual to gustatory; negative symptoms, such as blunted affect, avolition, anhedonia and asociality; and cognitive dysfunction related to executive function, attention and working memory (Tanda 1997; Lynskey 2002). Schizophrenia is a condition that can be severely disabling, producing multiple effects which impact on sufferers, their relatives, and ln the broader social context. Schizophrenia is associated with low rates of employment, low levels of activity, a low prevalence of intimate relationships, and a quality of life that links with anxiety, depression and substance abuse (Miles 2001). The dramatic impact of schizophrenia as an affective disorder is represented in the mortality rates of sufferers, which are significantly higher than in the wider population, and which highlight the fact that suicide is the largest single cause of this excess mortality (Henquet 2008).
Description of the intervention
Cannabis (Cannabis sativa and Cannabis indica) is a plant that grows wild throughout the world (Figure 1). It has been used to make rope and material, and has been used as a psychoactive drug for at least 2700 years (Russo 2008). When used as a recreational drug it is normally either as a compressed resin or made from the flowering tops and leaves, which is then either smoked or ingested. There are around 60 chemical compounds within the plant which have been described as “cannabinoids”; these are cannabis‐related compounds either derived from the cannabis plant or synthetically manufactured. Of these, the major active cannabinoid is the psychoactive constituent delta‐9‐tetrahydrocannabinol (THC). THC produces a euphoric high, feeling of relaxation, and intensification of sensation, but it can cause some short‐lived schizophrenic symptoms in some healthy people (D'Souza 2009).
1.

Cannabis sativa
Cannabis is at present the most consumed illicit drug in the world – the prevalence of which in 2010 was 2.6% to 5.0%, amounting to 120 to 224 million users. It is produced and consumed in every country in the world, and in amounts which far exceed other illicit drugs. Within developed countries the amount of consumption is broadly stable, although in many developing countries it is increasing (UNODOC). The proportion of people with schizophrenia who use cannabis varies, yet surveys commonly find prevalence rates to be about 40% (Table 5), much higher than the general population. Cannabis is used to reduce distressing psychotic symptoms as a form of self‐medication (Dixon 1990), or to reduce the unpleasant adverse effects caused by antipsychotic drug treatment. It has also been proposed that the negative symptoms of schizophrenia (affective flattening, poor volition, poverty of thought, social withdrawal) may be improved by the use of cannabis (D'Souza 2005). This theory may be corroborated by recent literature that suggests therapy with cannabidiol can lead to significant clinical improvement in psychotic symptoms (Casadio 2011).
1. Prevalence of cannabis use in people with schizophrenia.
| Proportion | Country | Study |
| 5% | Germany | Soyka 1993 |
| 13% | Germany | Hambrecht 2000 |
| 18.9% | UK | Duke 2001 |
| 23% | USA | Regier 1990 |
| 40% | UK | Virgo 2001 |
| 40% | Australia | Baigent 1995 |
| 41.8% | USA | Warner 1994 |
| 42% | Ireland | Condren 2001 |
| 43% | Italy | Bersani 2002 |
| 69% | Sweden | Allebeck 1993 |
How the intervention might work
There is some research evidence supporting the theory that reducing the intake of cannabis can help prevent and improve the symptoms of schizophrenia. The use of cannabis has been associated with an increased risk of developing psychosis and also exacerbating the symptoms of schizophrenia. Although there has been suggestions that the increased risk of developing schizophrenia could be due to confounders such as other drug use, urbanicity or social class; or be due to reverse causality, whereby people who are at risk of developing schizophrenia, start taking cannabis in order to diminish their prodromal symptoms; however, even when taking these factors into account, cannabis has been associated with an increased risk of developing schizophrenia (Matheson 2011). Multiple meta‐analyses have demonstrated an increased risk due to cannabis. An increase in psychosis has been significantly associated with cannabis use in several meta‐analyses with odds ratios of 1.41 and 2.93 reported.This effect also appeared to be dose‐dependent and more acute with use at an early age (Henquet 2005, Semple 2005, Moore 2007, D'Souza 2009).
Conversly, some research suggest cannabinoids in small doses can have a beneficial effect on the symptoms of schizophrenia. Cannabinoids (Figure 2) exert their effect through cannabinoid receptors, CB1 and CB2. CB1 receptors are distributed within the central nervous system (brain and spine) and in various peripheral organs and tissues. The location of CB receptors may explain the effects of cannabis use on learning, memory, emotion, motivation and motor (control of muscle) ability (Freund 2003). Normally, these receptors are activated by endogenous cannabinoids ‐ these are chemicals with a similar structure to cannabinoids found within cannabis but which are made by the body. The major effect of these endogenous cannabinoids is control of neurotransmitter release such as GABA (gamma‐aminobutyric acid) and glutamate within the brain.
2.

delta‐9‐tetrahydrocannabinol (THC)
Why it is important to do this review
Substance misuse has been reported to be the most prevalent co‐morbid condition associated with schizophrenia (Regier 1990) and cannabis is the most frequently used substance (Sinclair 2008, Kavanagh 2004, Hall 1999, Farrell 1998). The reported rates of cannabis abuse among people with schizophrenia vary widely both within and between different countries, but are consistently higher than in other people with mental illnesses or in the general population (Smith 1994).
The association between schizophrenia and cannabinoids has been well documented; as a result this review aims to look at methods that assist patients in altering their consumption of cannabis, and if consumption of cannabinoids affects the symptoms of a person with schizophrenia.
Objectives
To assess the effects of specific psychological treatments for cannabis reduction in people with schizophrenia. To assess the effects of antipsychotics for cannabis reduction in people with schizophrenia. To assess the effects of cannabinoids for symptom reduction in people with schizophrenia.
Methods
Criteria for considering studies for this review
Types of studies
We included randomised controlled trials. If a trial had been described as 'double‐blind', but it was only implied that the study was randomised, we would have included these trials in a sensitivity analysis. If there was no substantive difference within primary outcomes (see Types of outcome measures) when these 'implied randomisation' studies were added, then we would have included these in the final analysis. If there was a substantive difference, we would only use clearly randomised trials and would have described the results of the sensitivity analysis in the text. We excluded quasi‐randomised studies, such as those allocating by using alternate days of the week.
Types of participants
We included people with schizophrenia and other types of schizophrenia‐like psychosis (e.g. schizophreniform and schizoaffective disorders), irrespective of the diagnostic criteria used. There is no clear evidence that the schizophrenia‐like psychoses are caused by fundamentally different disease processes or require different treatment approaches (Carpenter 1994). The interventions, which included cannabis reduction specific psychological treatment and antipsychotic versus placebo or antipsychotic, included only people with schizophrenia and who used cannabis.
Types of interventions
1. Cannabis reduction: specific psychological treatment (any dose and pattern of administration) versus:
1.1 treatment as usual
1.2 non cannabis specific psychological treatment
2. Cannabis reduction: any (atypical/typical) antipsychotic (any dose and pattern of administration) versus:
2.1. placebo
2.2. any (atypical/typical) antipsychotics
3. Cannabinoids as treatment: (any dose and pattern of administration) versus:
3.1 placebo
3.2 any (atypical/typical) antipsychotics
Types of outcome measures
We grouped outcomes into the short term (up to 12 weeks), medium term (13 to 26 weeks), and long term (more than 26 weeks).
Primary outcomes
1. Behaviour ‐ Cannabis use
2. Mental state ‐ No clinically important change in general mental state (medium term)
3. Global state ‐ Relapse (medium term)
Secondary outcomes
1. Mental state
1.1 No clinically important change in general mental state (short and long term) 1.2 Not any change in general mental state 1.3 Average endpoint general mental state score 1.4 Average change in general mental state scores 1.5 No clinically important change in specific symptoms (positive symptoms, negative symptoms, depression, mania) 1.6 Not any change in specific symptoms 1.7 Average endpoint specific symptom score 1.8 Average change in specific symptom scores
2. Global state
2.1 Relapse (short and long term) 2.2 Time to relapse 2.3 No clinically important change in global state 2.4 Not any change in global state 2.5 Average endpoint global state score 2.6 Average change in global state scores
3. Behaviour
3.1 No clinically important change in general behaviour (short and long term) 3.2 Not any change in general behaviour 3.3 Average endpoint general behaviour score 3.4 Average change in general behaviour scores 3.5 No clinically important change in specific aspects of behaviour 3.6 Not any change in specific aspects of behaviour 3.7 Average endpoint specific aspects of behaviour 3.8 Average change in specific aspects of behaviour
4 General functioning
4.1 No clinically important change in general functioning 4.2 Not any change in general functioning 4.3 Average endpoint general functioning score 4.4 Average change in general functioning scores 4.5 No clinically important change in specific aspects of functioning, such as social or life skills 4.6 Not any change in specific aspects of functioning, such as social or life skills 4.7 Average endpoint specific aspects of functioning, such as social or life skills 4.8 Average change in specific aspects of functioning, such as social or life skills
5. Adverse effects
5.1 Death (suicide, natural causes, resulting from adverse effects) 5.2 Clinically important general adverse effects 5.3 Any general adverse effects 5.4 Average endpoint general adverse effect score 5.5 Average change in general adverse effect scores 5.6 No clinically important change in specific adverse effects 5.7 Not any change in specific adverse effects 5.8 Average endpoint specific adverse effects 5.9 Average change in specific adverse effects
6. Leaving the study early
6.1 For specific reasons 6.2 For general reasons
7. Engagement with services
7.1 No clinically important engagement 7.2 Not any engagement 7.3 Average endpoint engagement score 7.4 Average change in engagement scores
8. Satisfaction with treatment
8.1 Recipient of care not satisfied with treatment 8.2 Recipient of care average satisfaction score 8.3 Recipient of care average change in satisfaction scores 8.4 Carer not satisfied with treatment 8.5 Carer average satisfaction score 8.6 Carer average change in satisfaction scores
9. Quality of life
9.1 No clinically important change in quality of life 9.2 Not any change in quality of life 9.3 Average endpoint quality of life score 9.4 Average change in quality of life scores 9.5 No clinically important change in specific aspects of quality of life 9.6 Not any change in specific aspects of quality of life 9.7 Average endpoint specific aspects of quality of life 9.8 Average change in specific aspects of quality of life
10. Economic outcomes
10.1 Direct costs 10.2 Indirect costs
11. 'Summary of findings' table
We used the GRADE approach to interpret findings (Schunemann 2008) and used the GRADEPRO profiler to import data from Review Manager (RevMan) to create 'Summary of findings' tables. These tables provide outcome‐specific information concerning the overall quality of evidence from each included study in the comparison, the magnitude of effect of the interventions examined, and the sum of available data on all outcomes we rated as important to patient‐care and decision making. We selected the following main outcomes for inclusion in the 'Summary of findings' table.
1. Behaviour ‐ cannabis use (medium term). 2. Mental state ‐ no clinically important change in general mental state (medium term). 3. Global state ‐ relapse (medium term). 4. General functioning ‐ no clinically important change in general functioning (medium term). 5. Adverse effects ‐ no clinically important adverse effects were observed (medium term). 6. Leaving the study early ‐ there were not excessive attrition rates (medium term). 7. Satisfaction with treatment ‐ participants were broadly satisfied with treatment (medium term).
Search methods for identification of studies
Electronic searches
1. Electronic searching We searched the Cochrane Schizophrenia Group register (25 July, 2013) with the phrase:((*Marijuana* or *Marihuana* or *Cannabi* or *Hashish* or *Skunk* or *Hemp* or *Ganja* or *Bhang* or *Sinsemilla*):TI or (*Marijuana* or *Marihuana* or *Cannabi* or *Hashish* or *Skunk* or *Hemp* or *Ganja* or *Bhang* or *Sinsemilla*):AB) in Appendix 1.
This register is compiled by systematic searches of major databases, handsearches and conference proceedings (see Group Module).
Searching other resources
1. Reference lists
We searched all references of articles selected for inclusion for further relevant trials.
2. Personal contact
If necessary we contacted the first author of each included study for information regarding unpublished trials or data.
Data collection and analysis
Methods used in data collection and analysis for this update (2013 search) are below; for previous methods please see Appendix 3.
Selection of studies
Review authors Mr B.C Mcloughlin (BM) and Mr J Pushpa‐Rajah (JP) inspected citations from the new electronic search and identified relevant abstracts. BM and JP also inspected full articles of the abstracts meeting the inclusion criteria. Co‐author Dr Donna Gillies (DG) carried out the reliability checks on 20% of citations from the new electronic search.
Data extraction and management
1. Extraction
Review authors BC and JP extracted data from included studies. If we found data presented only in graphs and figures, we extracted this data whenever possible but only used these data if both authors independently had obtained the same result. If further information was necessary, we contacted authors of studies in order to obtain missing data or for clarification. If studies were multi‐centre, where possible, we extracted data relevant to each component centre separately. Co‐author DG carried out reliability checks on 20% of the data.
2. Management
2.1 Forms
We extracted data onto standard, simple forms.
2.2 Scale‐derived data
We included continuous data from rating scales only if: a. the psychometric properties of the measuring instrument have been described in a peer‐reviewed journal (Marshall 2000); and b. the measuring instrument has not been written or modified by one of the trialists for that particular trial.
Ideally, the measuring instrument should either be i. a self‐report or ii. completed by an independent rater or relative (not the therapist). We realise that this is not often reported clearly; we have noted whether or not this is the case in Description of studies and in the 'Risk of bias' tables.
2.3 Endpoint versus change data
There are advantages of both endpoint and change data. Change data can remove a component of between‐person variability from the analysis. On the other hand, calculation of change needs two assessments (baseline and endpoint), which can be difficult in unstable and difficult to measure conditions such as schizophrenia. We decided primarily to use endpoint data, and only use change data if the former were not available. We combined endpoint and change data in the analysis as we used mean differences (MD) rather than standardised mean differences throughout (Higgins 2011, Chapter 9.4.5.2).
2.4 Skewed data
Continuous data on clinical and social outcomes are often not normally distributed. To avoid the pitfall of applying parametric tests to non‐parametric data, we aimed to apply the following standards to all data before inclusion: a) standard deviations (SFs) and means are reported in the paper or obtainable from the authors; b) when a scale starts from the finite number zero, the SD, when multiplied by two, is less than the mean (as otherwise the mean is unlikely to be an appropriate measure of the centre of the distribution (Altman 1996)); c) if a scale started from a positive value (such as the Positive and Negative Syndrome Scale (PANSS, Kay 1986), which can have values from 30 to 210), we modified the calculation described above to take the scale starting point into account. In these cases skew is present if 2 SD > (S‐S min), where S is the mean score and S min is the minimum score. Endpoint scores on scales often have a finite start and end point and these rules can be applied. We entered skewed endpoint data from studies of fewer than 200 participants as other data within the data and analyses section rather than into statistical analysis. Skewed data pose less of a problem when looking at mean if the sample size is large; we would have entered skewed endpoint data from studies with over 200 participants into statistical analyses.
When continuous data are presented on a scale that includes a possibility of negative values (such as change data), it is difficult to tell whether data are skewed or not, we entered skewed change data into statistical analyses.
2.5 Common measure
To facilitate comparison between trials, we intended to convert variables that can be reported in different metrics, such as days in hospital (mean days per year, per week or per month) to a common metric (e.g. mean days per month).
2.6 Conversion of continuous to binary
Where possible, we made efforts to convert outcome measures to dichotomous data. This can be done by identifying cut‐off points on rating scales and dividing participants accordingly into 'clinically improved' or 'not clinically improved'. It is generally assumed that if there is a 50% reduction in a scale‐derived score such as the Brief Psychiatric Rating Scale (BPRS, Overall 1988) or the PANSS (Kay 1986) this could be considered as a clinically significant response (Leucht 2005; Leucht 2005a). If data based on these thresholds were not available, we used the primary cut‐off presented by the original authors.
2.7 Direction of graphs
Where possible, we entered data in such a way that the area to the left of the line of no effect indicated a favourable outcome for the relevant intervention in each case. Where keeping to this made it impossible to avoid outcome titles with clumsy double‐negatives (e.g. 'Not improved') we reported data where the left of the line indicates an unfavourable outcome. This was noted in the relevant graphs.
Assessment of risk of bias in included studies
Review authors, BM and JP worked independently by using criteria described in the Cochrane Handbook for Systematic Reviews of Interventions (Higgins 2011) to assess trial quality. This new set of criteria is based on evidence of associations between overestimate of effect and high risk of bias due to sequence generation, allocation concealment, blinding, incomplete outcome data and selective reporting.
Where inadequate details of randomisation and other characteristics of trials were provided, we contacted authors of the studies in order to obtain additional information. We noted any response in Characteristics of included studies.
We have noted the level of risk of bias in both the text of the review and in the 'Summary of findings' tables.
Measures of treatment effect
1. Binary data
For binary outcomes, we calculated a standard estimation of the risk ratio (RR) and its 95% confidence interval (CI). It has been shown that RR is more intuitive (Boissel 1999) than odds ratios and that odds ratios tend to be interpreted as RR by clinicians (Deeks 2000). If heterogeneity had been identified (Assessment of heterogeneity), we would have used a random‐effects model. For statistically significant results, we used 'Summary of findings' tables to calculate the number needed to treat/harm for an additional beneficial/harmful outcome statistic and its 95% CI.
2. Continuous data
For continuous outcomes, we estimated mean difference (MD) between groups. We prefer not to calculate effect size measures (standardised mean difference (SMD)). However, if scales of very considerable similarity had been used, we would have presumed there was a small difference in measurement, and calculated effect size and transformed the effect back to the units of one or more of the specific instruments.
Unit of analysis issues
1. Cluster trials
Studies increasingly employ 'cluster randomisation' (such as randomisation by clinician or practice), but analysis and pooling of clustered data pose problems. Authors often fail to account for intra‐class correlation in clustered studies, leading to a 'unit of analysis' error (Divine 1992), whereby P values are spuriously low, confidence intervals unduly narrow and statistical significance overestimated. This causes type I errors (Bland 1997; Gulliford 1999).
If we had included any cluster trials, and found cases where clustering was not accounted for in primary studies, we would have presented data in a table, with an (*) symbol to indicate the presence of a probable unit of analysis error. In subsequent versions of this review, if any cluster trials are identified, we will seek to contact first authors of such studies to obtain intra‐class correlation coefficients (ICCs) for their clustered data and to adjust for this by using accepted methods (Gulliford 1999).
Had clustering been incorporated into the analysis of primary studies, we would have presented these data as if from a non‐cluster randomised study, with adjustment for the clustering effect.
We have sought statistical advice and have been advised that the binary data as presented in a report should be divided by a 'design effect'. This is calculated by using the mean number of participants per cluster (m) and the ICC [Design effect = 1 + (m1) * ICC] (Donner 2002). Again, if we had found any cluster trials, or if subsequent versions of this review should identify such trials, when the ICC is not reported it will be assumed to be 0.1 (Ukoumunne 1999).
2. Cross‐over trials
A major concern of cross‐over trials is the carry‐over effect. It occurs if an effect (e.g. pharmacological, physiological or psychological) of the treatment in the first phase is carried over to the second phase. As a consequence, on entry to the second phase the participants can differ systematically from their initial state, despite a wash‐out phase. For the same reason cross‐over trials are not appropriate if the condition of interest is unstable (Elbourne 2002). As both effects are very likely in severe mental illness, we planned to use only the data of the first phase of cross‐over studies. However, although one study would have required this method, we were unable to obtain the requisite data, and so none of the studies included in the final review required this.
3. Studies with multiple treatment groups
Had a study involved more than two treatment arms, if relevant, we planned to present the additional treatment arms in comparisons. If data were binary, we would simply have added these and combined them within the two‐by‐two table. If data were continuous, we would have combined data following the formula in section 7.7.3.8 (Combining groups) of the Handbook (Higgins 2011). If the additional treatment arms were not relevant, we would not have reproduced these data. However, none of the studies included in the final review required this.
Dealing with missing data
1. Overall loss of credibility
At some degree of loss of follow‐up, data must lose credibility (Xia 2009). We chose that, for any particular outcome, should more than 50% of data be unaccounted for, we would not reproduce these data or use them within analyses. If, however, more than 50% of those in one arm of a study were lost, but the total loss was less than 50%, we would address this within the 'Summary of findings' tables by down‐rating quality. Finally, we also downgraded quality within the 'Summary of findings' tables where loss was 25% to 50% in total.
2. Binary
In the case where attrition for a binary outcome is between 0% and 50% and where these data were not clearly described, we presented such data on a 'once‐randomised‐always‐analyse' basis (an intention‐to‐treat analysis). Those leaving the study early were all assumed to have the same rates of negative outcome as those who completed. We undertook a sensitivity analysis to test how prone the primary outcomes were to change when data only from people who complete the study to that point were compared to the intention‐to‐treat analysis using the above assumptions.
3. Continuous
3.1 Attrition
In the case where attrition for a continuous outcome was between 0% and 50%, and data only from people who complete the study to that point were reported, we used these data.
3.2 Standard deviations
If standard deviations (SDs) were not reported, we first tried to obtain the missing values from the authors. If not available, where there are missing measures of variance for continuous data, but an exact standard error (SE) and confidence intervals available for group means, and either 'P' value or 't' value available for differences in mean, we can calculate them according to the rules described in the Cochrane Handbook for Systemic reviews of Interventions (Higgins 2011): When only the SE is reported, SDs are calculated by the formula SD = SE * square root (n). Chapters 7.7.3 and 16.1.3 of the Cochrane Handbook for Systemic reviews of Interventions (Higgins 2011) present detailed formulae for estimating SDs from P values, t or F values, confidence intervals, ranges or other statistics. If these formulae do not apply, we can calculate the SDs according to a validated imputation method which is based on the SDs of the other included studies (Furukawa 2006). Although some of these imputation strategies can introduce error, the alternative would be to exclude a given study’s outcome and thus to lose information. We nevertheless examined the validity of the imputations in a sensitivity analysis excluding imputed values.
3.3 Last observation carried forward
We anticipated that in some studies the method of last observation carried forward (LOCF) would have been employed within the study report. As with all methods of imputation to deal with missing data, LOCF introduces uncertainty about the reliability of the results (Leucht 2007). Therefore, where LOCF data had been used in the trial, if less than 50% of the data have been assumed, we presented and used these data and indicated that they are the product of LOCF assumptions.
Assessment of heterogeneity
1. Clinical heterogeneity
We considered all included studies initially, without seeing comparison data, to judge clinical heterogeneity. We simply inspected all studies for clearly outlying people or situations which we had not predicted would arise. When such situations or participant groups arose, we fully discussed these.
2. Methodological heterogeneity
We considered all included studies initially, without seeing comparison data, to judge methodological heterogeneity. We simply inspected all studies for clearly outlying methods which we had not predicted would arise. When such methodological outliers arose, we fully discussed these.
3. Statistical heterogeneity
3.1 Visual inspection
We visually inspected graphs to investigate the possibility of statistical heterogeneity.
3.2 Employing the I2 statistic
We investigated heterogeneity between studies by considering the I2 method alongside the Chi2 P value. The I2 provides an estimate of the percentage of inconsistency thought to be due to chance (Higgins 2003). The importance of the observed value of I2 depends on i. magnitude and direction of effects and ii. strength of evidence for heterogeneity (e.g. P value from Chi2 test, or a confidence interval for I2). An I2 estimate greater than or equal to around 50% accompanied by a statistically significant Chi2 statistic was interpreted as evidence of substantial levels of heterogeneity (Higgins 2011). When substantial levels of heterogeneity were found in the primary outcome, we explored reasons for heterogeneity (Subgroup analysis and investigation of heterogeneity).
Assessment of reporting biases
Reporting biases arise when the dissemination of research findings is influenced by the nature and direction of results (Egger 1997). These are described in Section 10 of the Handbook (Higgins 2011). We are aware that funnel plots may be useful in investigating reporting biases but are of limited power to detect small‐study effects. However, as funnel plots were only planned for analyses of 10 or more studies, there were not enough studies which could be synthesised for a funnel plot to be done
Data synthesis
We understand that there is no closed argument for preference for use of fixed‐effect or random‐effects models. The random‐effects method incorporates an assumption that the different studies are estimating different, yet related, intervention effects. This often seems to be true to us and the random‐effects model takes into account differences between studies even if there is no statistically significant heterogeneity. There is, however, a disadvantage to the random‐effects model: it puts added weight onto small studies, which often are the most biased ones. Depending on the direction of effect, these studies can either inflate or deflate the effect size. We chose the fixed‐effect model for all analyses. The reader is, however, able to choose to inspect the data using the random‐effects model.
Subgroup analysis and investigation of heterogeneity
1. Subgroup analyses
1.1 Clinical state, stage or problem
We proposed to undertake this review and provide an overview of the effects of the interventions for people with schizophrenia in general. In addition, however, we tried to report data on subgroups of people in the same clinical state, stage and with similar problems. However as there were not enough data to produce any comparisons, it was impossible/unnecessary to subgroup.
2. Investigation of heterogeneity
If inconsistency was high, we have reported this. First, we investigated whether data had been entered correctly. Second, if data were correct, we visually inspected the graph and successively removed outlying studies to see if homogeneity was restored. For this review we decided that should this occur with data contributing to the summary finding of no more than around 10% of the total weighting, we would present data. If not, then we would not pool data but would discuss these issues. We know of no supporting research for this 10% cut‐off, but we use prediction intervals as an alternative to this unsatisfactory state. Should unanticipated clinical or methodological heterogeneity be obvious, we will simply state hypotheses regarding this observation for future reviews or versions of this review. However none of the studies included in the final review required this.
Sensitivity analysis
We would have applied the following sensitivity analyses to only primary outcomes of this review if required, however none of the studies finally included did require this.
1. Implication of randomisation
We aimed to include trials in a sensitivity analysis if they were described in some way so as to imply randomisation. For the primary outcomes we would have included these studies and if there was no substantive difference when the implied randomised studies were added to those with better description of randomisation, then we would have entered all data from these studies. However none of the studies included in the final review required this.
2. Assumptions for lost binary data
Where assumptions had to be made regarding people lost to follow‐up and missing SD data (see Dealing with missing data), we planned to compare the findings on primary outcomes when we used our assumption compared with complete data only. We planned to undertake a sensitivity analysis to test how prone results were to change when 'completer' data only were compared to the imputed data using the above assumption. If there was a substantial difference, we would have reported results and discussed them but continued to employ our assumption.However none of the studies included in the final review required this.
3. Risk of bias
We planned to analyse the effects of excluding trials that were judged to be at high risk of bias across one or more of the domains of randomisation (implied as randomised with no further details available): allocation concealment, blinding and outcome reporting for the meta‐analysis of the primary outcome. If the exclusion of trials at high risk of bias did not substantially alter the direction of effect or the precision of the effect estimates, then we would have included data from these trials in the analysis. However none of the studies included in the final review required this.
4. Imputed values
We also planned to undertake a sensitivity analysis to assess the effects of including data from trials where we used imputed values for ICC in calculating the design effect in cluster randomised trials.
If we noted substantial differences in the direction or precision of effect estimates in any of the sensitivity analyses listed above, we would not have pooled the data from the excluded trials with the other trials contributing to the outcome, but would have presented them separately. However none of the studies included in the final review required this.
5. Fixed‐effect and random‐effects
We synthesised data using a fixed‐effect model.
Results
Description of studies
Results of the search
Our search identified a total of 250 references, with three more found through other sources; 226 studies were identified for initial screening once duplicates had been removed. Fifty studies were then screened via the abstract, resulting in 15 studies retrieved in full text that were assessed for eligibility, finally eight studies were considered acceptable for inclusion in the quantitative analysis (Figure 3). All eight were published in English.
3.

Study flow diagram: 2013 search.
Included studies
We were able to include eight studies involving 530 participants (please see Characteristics of included studies). Seven compared the effects of therapies on reducing cannabis use (of those, six used psychological therapies and one used drug therapy) and one compared the effects of cannabinoids on symptoms.
4.1 Length of trials
The length varied from 28 days (Leweke 2012) to 12 months (Madigan 2012 and Bonsack 2011). The mean length was 28 weeks and four days.
| Duration (weeks) | Number of studies | Studies |
| 1‐6 | 2 | Leweke 2012, van Nimwegen 2008 |
| 6‐36 | 2 | Brunette 2011, Akerele 2007 |
| 36‐52 | 2 | Edwards 2006, Hjorthoj 2013 |
| 52 | 2 | Madigan 2012, Bonsack 2011 |
4.2 Participants
Participants included in the studies were all diagnosed with schizophrenia/schizoaffective disorder plus current co‐morbid substance use problems and were diagnosed using the DSM‐IV (Diagnostic and Statistical Manual of Mental Disorders) schedule. One study used the ICD‐10 (International Classification of Diseases) criteria (Hjorthoj 2013); all others used DSM‐IV. Edwards 2006 specifically used first episode psychosis criteria; Leweke 2012 used "acutely exacerbated schizophrenia". All other studies used a broad criteria for inclusion: any DSM IV diagnosis of psychotic disorder i.e. schizophrenia, schizophreniform, schizoaffective, delusional disorder, bipolar disorder, major depressive disorder with psychotic features, psychosis not otherwise stated, and brief reactive psychosis.
4.3 Setting
The studies varied in geographical location, however all took place within more economically developed countries. Five studies took place in Europe (Switzerland, Denmark, Germany, Ireland); two took place in USA and one took place in Australia.
4.4 Study size
The number of participants ranged from 28 (Akerele 2007) to 129 participants (van Nimwegen 2008), the mean size of study was 66.25; the total number of participants was 530.
4.5 Interventions
Seven studies compared treatments in reducing cannabis use. One compared two different psychological treatments (Edwards 2006), and three compared psychological treatments versus treatment as usual (Madigan 2012, Hjorthoj 2013, Bonsack 2011). Two trials compared the effects of using different antipsychotics on cannabis use (Akerele 2007, van Nimwegen 2008), and one compared the effects of clozapine versus continuing with previous antipsychotic (Brunette 2011).
One trial (Leweke 2012), investigated cannabis as a treatment using drug intervention: amisulpride versus cannabidiol.
4.5.1 Psychoeducation versus psychological treatment (cannabis and psychosis therapy)
Edwards 2006 compared cannabis and psychosis therapy ‐ an individually delivered cognitive behaviour therapy involving ideally 10 (mean = 7.6) weekly 20‐ to‐60 minute sessions over three months designed to influence behaviour change. Delivered over three months, it involves education about cannabis and psychosis, motivational interviewing, goal setting, and relapse prevention. Participants receive a booster session three months after the end of treatment.
The active control was psychoeducation; this involved ideally 10 (mean = 8.4) individual sessions guided by presentation slides and covering the nature of psychosis, treatment and relapse, but avoided discussing cannabis.
The treatments were given by four clinical psychologists trained in cognitive behaviour therapy and first episode psychosis.
In addition to the above interventions, participants also received standard care, which included regular psychiatric review and medication. access to mobile assessment and treatment, family and group work and a recovery clinic
4.5.2 Treatment as usual versus psychological treatment
Three studies compared psychological treatment versus treatment as usual. In two of those studies (Hjorthoj 2013 and Bonsack 2011), patients in the treatment as usual arm still received some psychological input that they would have received if they were not within the trial but in standard care.
Each study tested a different specific psychological intervention that had been developed within the centre. Broadly, these included motivational interviewing, cognitive behavioural therapy and psychoeducation.
The intervention in Madigan 2012 was Group Psychological Intervention (plus treatment as usual) once a week for 12 weeks plus one booster session six weeks afterwards, provided by a clinical psychologist. The intervention included anxiety management, motivational interviewing and cognitive behavioural therapy. The techniques used were based on Edwards 2006.
Treatment as usual in Madigan 2012 involved care from a multidisciplinary team including medication and regular review.
In Hjorthoj 2013 the intervention was CapOpus. It lasted six months and consisted of ideally two sessions a week for the first month and one weekly session for the remaining five months. The intervention started with motivational interviewing and then moved between cognitive behavioural therapy and repeat motivational interviewing depending on individual need, there was also development of personalised strategies.
The control was treatment as usual, which was provided by staff not involved by CapOpus. The treatment involved anti psychotic medication and cognitive behavioural therapy but not specifically targeted at cannabis use. Treatment as usual continued after the six months.
In Bonsack 2011, the intervention was motivational Intervention + treatment as usual. The main aim of motivational intervention is reduction of cannabis use. The sessions were on an individual basis and consisted of four to six motivational Intervention sessions; the first session consisted of 60 minutes, followed by a feedback session of 45 to 60 minutes within the next week. Two to four booster sessions of 30 to 45 minutes took place during the first six months; these sessions explored the connection between cannabis use and psychosis, and would discuss the advantages and disadvantages of cannabis use. In addition, participants were offered three optional group motivational sessions.
Treatment as usual consisted of psychiatric management by a clinical team consisting of a psychiatrist and a nurse/clinical psychologist, with access to community or inpatient treatment. Treatment included medication, regular visits within the community or clinic, rehabilitation, and standard psychoeducation and counselling on substance abuse. Participants were not exposed to any specific motivational intervention, and no attempt was made to standardise treatment, as this was based on the participants needs.
4.5.3 Clozapine versus any antipsychotic; olanzapine versus risperidone
Three studies looked at differing antipsychotic medication interventions and their effect on cannabis usage. Two studies looked at olanzapine versus risperidone, the other study looked at clozapine versus the participant's current antipsychotic medication.
In Akerele 2007 participants received either olanzapine (dose 5 to 20 mg/day or risperidone: dose 3 to 9 mg/day). The trial was divided into three phases; during the first two weeks participants were kept on their current medication; during the second phase participants were tapered off their current medication on to either olanzapine or risperidone. The final phase lasted 10 weeks during which the participants were maintained on the intervention, either risperidone or olanzapine.
Doses were increased in a steps; in the risperidone group, participants received 3 mg/day for three days, then 6 mg/day for four days, then 9 mg until the end of the study.
In the olanzapine group, participants received 5 mg/day for three days, then 10 mg/day for the next four days, then 15 mg/day for the next five days, then 20 mg/day until the end of the study.
Doses were adjusted if a participant's symptoms worsened. Participants met the research team three times per week for the entire 14 weeks of the study for monitoring of symptoms.
van Nimwegen 2008 also compared olanzapine versus risperidone. In the first week, participants received flexible dosing of olanzapine (dose: 5, 10, 15, or 20 mg/day); or risperidone (dose: 1.25, 2.5, 3.75, or 5 mg/day), which was then given as a fixed dose for the following five weeks. All participants also received psychoeducation about psychosis, substance abuse and social skills training.
In Brunette 2011, if the participant was randomised to clozapine, their dose of clozapine was increased over four weeks to reach an ideal daily dose of 400 mg; during this period the participant's current medication was gradually reduced and then stopped within four weeks. The dose was adjusted according to response and side effects, so if required the maximum daily dose of clozapine could be increased to 550 mg per day subsequently.
Those randomised to stay on their current medication were kept on a steady dose if possible, but if symptoms or side effects increased the dose was adjusted accordingly.
Participants attended weekly visits over 12 weeks and were assessed at each visit.
4.5.4 Amisulpride versus cannabidiol
Only one study Leweke 2012, compared amisulpride versus cannabidiol (a non‐psychotropic component of cannabis). Participants had no medication at all for the first three days, then received either amisulpride or cannabidiol, both starting with 200 mg per day and then increasing stepwise to 200 mg four times a day (total daily dose was 800 mg) within the first week; this dose then continued for a further three weeks. If there were increased side effects, the total daily dose could be reduced to 600 mg per day. In addition, up to 7.5 mg per day of lorazepam was allowed during the study if necessary.
4.6 Outcomes
4.6.1 Rating scales
4.6.1.1 Mental state
4.6.1.1.1 Brief Psychiatric Rating Scale‐E (BPRS) (Overall 1988) The BPRS is an 18‐item scale measuring positive symptoms, general psychopathology and affective symptoms. The original scale has 16 items, but a revised 18‐item scale is commonly used. Scores can range from zero to 126. Each item is rated on a seven‐point scale varying from 'not present' to 'extremely severe', with high scores indicating more severe symptoms. The BPRS‐E is an expanded positive symptom subscale formed by summing conceptual disorganisation, hallucinations, unusual thought content and suspiciousness items. Higher scores indicate a worse outcome.
4.6.1.1.2 Beck Depression Inventory (BDI SF) (Beck 1972) This is a 13‐item self‐rating scale for depression. Each item comprises four statements (rated zero to four) describing increasing severity of the abnormality concerned. The person completing the scale is required to read each group of statements and identify the one that best describes the way they have felt over the preceding week. A total of 12/13 is an indicative score for presence of significant depression.
4.6.1.1.3 Scale for the Assessment of Negative Symptoms (SANS) (Andreasen 1983) This scale allows a global rating of the following negative symptoms of schizophrenia: alogia (impoverished thinking), affective blunting, avolition‐apathy, anhedonia‐asociality and attention impairment. Assessments are made on a six‐point scale (0 = not at all to 5 = severe). Higher scores indicate more symptoms.
4.6.1.1.3 Scale for the Assessment of Positive Symptoms (SAPS) (Andreasen 1984)
This scale allows a global rating of the following positive symptoms of schizophrenia: hallucinations, delusions, formal thought disorder and bizarre behaviour. Assessments are made on a six‐point scale (0 = not at all to 5 = severe). Higher scores indicate more symptoms.
4.6.1.1.4 Positive and Negative Syndrome Scale for Schizophrenia (PANSS) (Kay 1987)
The 30‐item PANSS is an operationalised, drug‐sensitive instrument that provides balanced representation of positive and negative symptoms and gauges their relationship to one another and to global psychopathology. It thus constitutes four scales measuring positive and negative syndromes, their differential, and general severity of illness
4.6.1.1.5 Calgary Depression Scale for Schizophrenia (CDSS) (Addington 1993)
This is a nine‐item scale, scored on a four‐point basis, where the higher the score, the more severe the depressive symptoms.
4.6.1.1.6 Birchwood Insight Scale (Birchwood 1993)
This measures three areas of insight: awareness of illness, symptoms and the need for treatment, scored on a 13‐point basis. Higher scores indicate better insight.
4.6.1.1.7 Obsessive Compulsive Drug use Scale (OCDUS) (Franken 2002)
This scale has 12 items each with five points, measuring drug craving in the past week. Higher scores equal higher craving for cannabis
4.6.1.2 Global state
4.6.2.2.1 Knowledge About Psychosis Questionnaire (KAPQ) (Birchwood 1992) This questionnaire tests people's understanding of psychosis and treatments.
4.6.1.3 Behaviour
4.6.1.3.1 Cannabis and Substance Use Assessment Schedule (CASUAS) (Wing 1990) This scale measures the percentage of days using cannabis in the past four weeks and includes an index of severity of cannabis use. The scale is modified from the Schedule for Clinical Assessment on Neuropsychiatry and includes similar information to the Addiction Severity Index.
4.6.1.3.2. Marijuana Craving Questionaire (MCQ) (Heishman 2006)
The MCQ consists of four constructs or factors that characterise cannabis craving: compulsivity, emotionality, expectancy, and purposefulness. A separate score is calculated for each factor. The MCQ can be used to measure cue‐elicited craving in a research setting or natural craving in cannabis‐dependent individuals presenting for treatment.
4.6.1.3.3 Addiction Severity Index (ASI) (McLellan 1980)
The ASI is a structured clinical interview that evaluates six areas within addiction, each area is scaled on a 10‐point rating.
4.6.1.3.4 Cannabis use 2 ‐ Percentage days used cannabis in last four weeks
This outcome measured percentage of days in the past four weeks that cannabis had been used. It was used in Edwards 2006.
4.6.1.3.5 Cannabis use 3 ‐ Number of joints of cannabis in preceding month
This was a self‐reported outcome with recall helped with the use of Timeline Follow‐Back (Sobell 1992). Joint sizes were defined as having 0.5 g of cannabis resin, this number was multiplied if more potent cannabis was used, This outcome was used in Hjorthoj 2013.
4.6.1.3.6 Cannabis use 4 ‐ Number of days abstinent
This outcome was measured using the Cannabis and Substance Use assessment scale, although the data are not based on the scale but on the actual raw data; the scale is used to structure the interview. It was used in Bonsack 2011.
4.6.1.3.7 Cannabis use 5 ‐ Number of days of binge use
This outcome was measured using the Cannabis and Substance Use assessment scale (Wing 1990), although the data are not based on the scale but on the actual raw data, the scale is used to structure the interview. It was used in Bonsack 2011.
4.6.1.3.8 Cannabis use 6 ‐ Joints per week
This outcome was self‐reported by participants, number of joints smoked per week. It was used in van Nimwegen 2008 and Brunette 2011.
4.6.1.4. General Functioning
4.6.1.4.1 Social and Occupational Functioning Assessment Scale (SOFAS) (Goldman 1992) The SOFAS focuses on the individual's level of social and occupational functioning while excluding severity of symptoms. It is a 100‐point scale, with higher scores indicating better functioning.
4.6.1.4.2 Global Assessment of Functioning (GAF) (Bodlund 1994)
The GAF is a 100‐point scoring system (higher scores equal better functioning) measuring social, occupational, and psychological functioning.
4.6.1.4.3 The The World Health Organization Quality of Life (WHOQOL) (WHOQOL) This instrument comprises 26 items, which measure the following broad domains: physical health, psychological health, social relationships, and environment. The WHOQOL is a shorter version of the original instrument that may be more convenient for use in large research studies or clinical trials.
4.6.1.4.4 Drug Attitude Inventory (DAI‐30) (Hogan 1983)
This scale determines the participants attitude to the medication and their experience of using it. It is a 30‐item scale; each item is a true or false option.
4.6.1.5.Adverse Effects
4.6.1.5.1 The Simpson Angus Scale (SAS) (Simpson 1970)
The scale is composed of 10 items and used to assess pseudoparkinsonism. Grade of severity of each item is rated using a five‐point scale. SAS scores can range from zero to 40. Signs assessed include gait, arm‐dropping, shoulder shaking, elbow rigidity, wrist rigidity, leg pendulousness, head dropping, glabella tap, tremor, and salivation.
4.6.2 Dichotomous data
4.6.2.1 Cannabis use ‐ used cannabis in last four weeks
This outcome measured whether the participant had used cannabis in the past four weeks, either yes or no. The outcome was then scored as a percentage of participants who had used cannabis in the past four weeks. It was used in Edwards 2006.
4.6.2.2 Cannabis use 7 ‐ traces of cannabis breakdown products in urine
Urine was screened three times a week for cannabis, and either classed as positive or negative, the cut‐off point for positive was 100 nanograms/mL. If any of the three screens in a week were positive, that week was classed as positive. This was used in Akerele 2007.
4.6.2.3 Adverse effects ‐ Measured adverse events
Participants reporting any adverse events were noted, the number of participants and type of adverse event was recorded. This was used in Brunette 2011.
4.6.2.4 Adverse effects 2 ‐ weight gain (kg)
Body weight (kg) was measured to quantify side effects of medication. This was used in Leweke 2012.
4.6.2.5 Adverse effects 3 ‐ prolactin (nanograms/L)
Serum prolactin (nanograms/L) was measured to quantify side effects of medication. This was used in Leweke 2012.
4.6.2.6 Leaving the study early ‐ reasons
Reasons for leaving were grouped into not interested, intolerable adverse effects, needing hospital admission. This outcome was used by Akerele 2007.
4.6.2.7 Leaving the study early ‐ time in treatment (weeks)
To quantify study retention, time to dropout was measured including those that completed the entire trial. This was used by Akerele 2007.
4.7 Contact of Authors
We contacted the lead authors of all included and excluded studies, and requested complete data if possible. Only the authors of Bonsack 2011 replied with complete data, and clarification on queries. This is noted in the Characteristics of included studies
Excluded studies
We excluded six studies all on the basis of no usable data, because the necessary data were not provided by the authors (please see Characteristics of excluded studies).
Awaiting assessment
One study is awaiting assessment. D'Souza 2005 is a randomised, double blind trial comparing placebo with 2.5 mg and 5 mg of delta‐9‐tetrahydrocannabinol in people with schizophrenia. It was a cross‐over study and we are awaiting first phase data from the authors, as our protocol details that only data from the first phase of a cross‐over study may be included.(See Characteristics of studies awaiting classification)
Ongoing studies
We are not aware of any ongoing trials.
Risk of bias in included studies
We assessed the risk of bias in our eight included studies.Generally the risk of bias was considered low across the eight studies. For a graphical overview of the risk of bias see Figure 4 and Figure 5. Details about the studies can be found in Characteristics of included studies.
4.

5.

Allocation
We determined that the risk of allocation (selection) bias in five of our eight included studies was low. Methods of randomisation among these studies ranged from computer‐generated randomisation to drawing lots from a bowl. In the two studies where the level of bias was unclear (Akerele 2007; Brunette 2011) it was not fully apparent how randomisation had been carried out.
Blinding
Of our included studies, five displayed a low risk of bias. These studies utilised single rater blinding or double blinding, and in most cases those using a single blind method employed independent parties to run the blinding. One of our included studies (Akerele 2007) displayed an unclear risk of bias due to blinding not being tested. Two of our included studies displayed a high risk of bias: Brunette 2011 because clinicians and participants were not blinded; and Hjorthoj 2013 because 14 patients or managers accidentally broke the blind.
Incomplete outcome data
In this category, five out of our eight included studies displayed an unclear risk of bias. In four cases the risk of bias was not specified, whilst in Akerele 2007 there was no indication within the report how losses to follow‐up were managed. The risk was found to be low in Bonsack 2011, Edwards 2006 and Leweke 2012, where missing data were handled using last observation carried forward (LOCF). The LOCF method involves imputing missing values based on existing data.
Selective reporting
The reporting bias of Akerele 2007 was high risk, as some outcomes were reported by the groups, whereas others were not. In all of our other included studies it was unclear what the level of risk of reporting bias.
Other potential sources of bias
The key area of concern with regards to other potential sources of bias in the studies we included was the source of funding. Akerele 2007 was funded by a company with pecuniary interest in the results (Eli Lilly ‐ producers of olanzapine), thus the risk of bias was found to be high. It is however unclear to what extent this may have influenced the trial. In contrast, although van Nimwegen 2008 was also funded by Eli‐Lilly, it was stated clearly within this study that the company was not involved in the design of the study, analyses or interpretation of results and therefore the risk of bias here was considered to be low. The risk of bias in Brunette 2011 was also found to be low as the authors reported no financial relationships or commercial interest with regard to the present study. In all of the other included studies there were no allusions to other potential sources of bias, thus the risk of bias was deemed to be unclear.
Effects of interventions
See: Table 1; Table 2; Table 3; Table 4
We calculated risk ratios (RR) for dichotomous data and estimated mean differences (MD) for continuous data, with their respective 95% confidence intervals (CIs) throughout.
COMPARISON 1: CANNABIS REDUCTION: ADJUNCT PSYCHOLOGICAL THERAPY versus TREATMENT AS USUAL
1.1 Behaviour: Cannabis use: 1. Frequency of use (ASI, group‐based therapy, high = bad)
1.1.1 in past 30 days ‐ by medium term
One relevant trial (n = 54) (Madigan 2012) provided data. There was no significant difference between reduction in ASI for treatment as usual and psychological therapy and treatment as usual (1 RCT n = 54, MD ‐0.10 CI ‐2.44 to 2.24, Analysis 1.1).
1.1. Analysis.

Comparison 1 CANNABIS REDUCTION: ADJUNCT PSYCHOLOGICAL THERAPY versus TREATMENT AS USUAL, Outcome 1 Behaviour: Cannabis use: 1. Frequency of use (ASI, group‐based therapy, high = bad).
1.2 Behaviour: Cannabis use: 2. Number of joints of cannabis in preceding month (skewed data)
One relevant trial (Hjorthoj 2013) reported data for this outcome. However, these data were heavily skewed and are best inspected by viewing Analysis 1.2.
1.2. Analysis.
Comparison 1 CANNABIS REDUCTION: ADJUNCT PSYCHOLOGICAL THERAPY versus TREATMENT AS USUAL, Outcome 2 Behaviour: Cannabis use: 2. Number of joints of cannabis in preceding month (skewed data).
| Behaviour: Cannabis use: 2. Number of joints of cannabis in preceding month (skewed data) | ||||
|---|---|---|---|---|
| Study | Intervention | Mean | SD | N |
| medium term | ||||
| Hjorthoj 2013 | CapOpus | 27.2 | 52.8 | 52 |
| Hjorthoj 2013 | TAU | 48.3 | 58.7 | 51 |
| long term | ||||
| Hjorthoj 2013 | CapOpus | 28.2 | 58.1 | 52 |
| Hjorthoj 2013 | TAU | 41.8 | 59.0 | 51 |
1.3 Behaviour: Cannabis use: 3. Number of days abstinent /last month (skewed data)
One relevant trial (Bonsack 2011) reported data for this outcome. However, these data were heavily skewed and are best inspected by viewing Analysis 1.3
1.3. Analysis.
Comparison 1 CANNABIS REDUCTION: ADJUNCT PSYCHOLOGICAL THERAPY versus TREATMENT AS USUAL, Outcome 3 Behaviour: Cannabis use: 3. Number of days abstinent /last month (skewed data).
| Behaviour: Cannabis use: 3. Number of days abstinent /last month (skewed data) | ||||
|---|---|---|---|---|
| Study | Intervention | Mean | SD | N |
| medium term ‐ 3 months | ||||
| Bonsack 2011 | Treatment as usual (TAU) + Motivational interviewing (MI) | 7.8 | 8.4 | 30 |
| Bonsack 2011 | TAU (control) | 9.7 | 9.6 | 32 |
| medium term ‐ 6 months | ||||
| Bonsack 2011 | TAU + MI | 9.7 | 9.9 | 30 |
| Bonsack 2011 | TAU | 9.0 | 9.7 | 32 |
| long term ‐ 12 months | ||||
| Bonsack 2011 | TAU + MI | 9.9 | 10.6 | 30 |
| Bonsack 2011 | TAU | 11.1 | 11.0 | 32 |
1.4 Behaviour: Cannabis use: 4. Number of days binge use (skewed data)
One relevant trial (Bonsack 2011) reported data for this outcome. However, these data were heavily skewed and are best inspected by viewing Analysis 1.4
1.4. Analysis.
Comparison 1 CANNABIS REDUCTION: ADJUNCT PSYCHOLOGICAL THERAPY versus TREATMENT AS USUAL, Outcome 4 Behaviour: Cannabis use: 4. Number of days of binge use (skewed data).
| Behaviour: Cannabis use: 4. Number of days of binge use (skewed data) | ||||
|---|---|---|---|---|
| Study | Intervention | Mean | SD | N |
| medium term ‐ 3 months | ||||
| Bonsack 2011 | Treatment as usual (TAU) + Motivational interviewing (MI) | 1.5 | 1.9 | 30 |
| Bonsack 2011 | TAU | 1.6 | 2.5 | 32 |
| medium term ‐ 6 months | ||||
| Bonsack 2011 | TAU + MI | 1.0 | 1.9 | 30 |
| Bonsack 2011 | TAU | 1.1 | 1.4 | 32 |
| long term ‐ 12 months | ||||
| Bonsack 2011 | TAU + MI | 1.7 | 5.1 | 30 |
| Bonsack 2011 | TAU | 1.7 | 3.9 | 32 |
1.5 Mental state: 1. Average depressive symptom score (CDSS, skewed data)
One relevant trial (Madigan 2012) reported data for this outcome. However these data were heavily skewed and are best inspected by viewing Analysis 1.5.
1.5. Analysis.
Comparison 1 CANNABIS REDUCTION: ADJUNCT PSYCHOLOGICAL THERAPY versus TREATMENT AS USUAL, Outcome 5 Mental state: 1. Average depressive symptom score (CDSS, skewed data).
| Mental state: 1. Average depressive symptom score (CDSS, skewed data) | ||||
|---|---|---|---|---|
| Study | Intervention | Mean | SD | N |
| medium term | ||||
| Madigan 2012 | GPI + TAU | 4.4 | 4.3 | 40 |
| Madigan 2012 | TAU | 4.6 | 4.8 | 20 |
| long term | ||||
| Madigan 2012 | GPI + TAU | 4.3 | 4.4 | 33 |
| Madigan 2012 | TAU | 4.3 | 4.2 | 11 |
1.6 Mental state: 2. Average insight score (Birchwood Insight Scale, higher = better)
1.6.1 medium term
One relevant trial (n = 58) (Madigan 2012) provided data. There was no significant difference between Birchwood Insight Scale for treatment as usual and psychological therapy and treatment as usual (1 RCT n = 58, MD 1.10 CI ‐0.18 to 2.38, Analysis 1.6).
1.6. Analysis.

Comparison 1 CANNABIS REDUCTION: ADJUNCT PSYCHOLOGICAL THERAPY versus TREATMENT AS USUAL, Outcome 6 Mental state: 2. Average insight score (Birchwood Insight Scale, high score = better).
1.6.2 long term
One relevant trial (n = 46) (Madigan 2012) provided data. There was no significant difference between Birchwood Insight Scale for treatment as usual and psychological therapy and treatment as usual (1 RCT n = 46, MD 0.40 CI ‐0.88 to 1.68, Analysis 1.6).
1.7 Mental state: 3. Average negative symptom score (PANSS, higher score = poor)
1.7.1 medium term ‐ three months
Data from one relevant trial (n = 62) (Bonsack 2011) showed no significant difference between reduction in PANSS for treatment as usual and psychological therapy and treatment as usual (1 RCT n = 62, MD ‐0.10 CI ‐2.06 to 1.86, Analysis 1.7).
1.7. Analysis.

Comparison 1 CANNABIS REDUCTION: ADJUNCT PSYCHOLOGICAL THERAPY versus TREATMENT AS USUAL, Outcome 7 Mental state: 3. Average negative symptom score (PANSS, high score = poor).
1.7.2 medium term ‐ six months
Data from one relevant trial (n = 62) (Bonsack 2011) showed no significant difference between reduction in PANSS for treatment as usual and psychological therapy and treatment as usual (1 RCT n = 62, MD 0.00 CI ‐1.80 to 1.80, Analysis 1.7).
1.7.3 long term ‐ 12 months
Data from one relevant trial (n = 62) (Bonsack 2011) showed no statistically significant difference between reduction in PANSS for treatment as usual and psychological therapy and treatment as usual (1 RCT n = 62, MD ‐1.20 CI ‐3.19 to 0.79, Analysis 1.7).
1.8 Mental state: 4.a. Average positive symptom score (SAPS, skewed data)
One relevant trial (1 RCT n = 49) (Madigan 2012) reported data for this outcome. However, these data were heavily skewed and are best inspected by viewing Analysis 1.8.
1.8. Analysis.
Comparison 1 CANNABIS REDUCTION: ADJUNCT PSYCHOLOGICAL THERAPY versus TREATMENT AS USUAL, Outcome 8 Mental state: 4a. Average positive symptom score (SAPS, skewed data).
| Mental state: 4a. Average positive symptom score (SAPS, skewed data) | ||||
|---|---|---|---|---|
| Study | Intervention | Mean | SD | N |
| medium term | ||||
| Madigan 2012 | GPI + TAU | 4.8 | 3.7 | 42 |
| Madigan 2012 | TAU | 5.1 | 4.1 | 22 |
| long term | ||||
| Madigan 2012 | GPI + TAU | 4.9 | 4.0 | 32 |
| Madigan 2012 | TAU | 5.1 | 4.2 | 17 |
1.9 Mental state: 4.b. Average positive symptom score (SANS, skewed data)
One relevant trial (1 RCT n = 49) (Madigan 2012) reported data for this outcome. However, these data were heavily skewed and are best inspected by viewing Analysis 1.9.
1.9. Analysis.
Comparison 1 CANNABIS REDUCTION: ADJUNCT PSYCHOLOGICAL THERAPY versus TREATMENT AS USUAL, Outcome 9 Mental state: 4b. Average positive symptom score (SANS, skewed data).
| Mental state: 4b. Average positive symptom score (SANS, skewed data) | ||||
|---|---|---|---|---|
| Study | Intervention | Mean | SD | N |
| medium term | ||||
| Madigan 2012 | GPI + TAU | 3.8 | 2.4 | 40 |
| Madigan 2012 | TAU | 3.2 | 2.3 | 20 |
| long term | ||||
| Madigan 2012 | GPI + TAU | 4.6 | 3.0 | 32 |
| Madigan 2012 | TAU | 4.8 | 3.2 | 19 |
1.10 Mental state: 4.c. Average positive symptom score (PANSS, higher score = poor)
1.10.1 medium term ‐ three months
One relevant trial (n = 62) (Bonsack 2011) provided data. There was no significant difference between reduction in PANSS for treatment as usual and psychological therapy and treatment as usual (1 RCT n = 62, MD ‐0.30 CI ‐2.55 to 1.95, Analysis 1.10).
1.10. Analysis.

Comparison 1 CANNABIS REDUCTION: ADJUNCT PSYCHOLOGICAL THERAPY versus TREATMENT AS USUAL, Outcome 10 Mental state: 4c. Average positive symptom score (PANSS, high score = poor).
1.10.2 medium term ‐ six months
Data from one relevant trial (n = 62) (Bonsack 2011) showed no significant difference between reduction in PANSS for treatment as usual and psychological therapy and treatment as usual (1 RCT n = 62, MD ‐0.10 CI ‐2.58 to 2.38, Analysis 1.10).
1.10.3 long term ‐ 12 months
Data from one relevant trial (n = 62) (Bonsack 2011) showed no statistically significant difference between reduction in PANSS for treatment as usual and psychological therapy and treatment as usual (1 RCT n = 62, MD ‐1.20 CI ‐3.32 to 0.92, Analysis 1.10).
1.11 General functioning: 1. Subjective quality of life (WHO QOL, brief, higher = better)
1.11.1 medium term
Data from one relevant trial (n = 49) (Madigan 2012) showed no significant difference between WHO QOL for treatment as usual and psychological therapy and treatment as usual (1 RCT n = 49, MD 0.90 CI ‐1.15 to 2.95, Analysis 1.11).
1.11. Analysis.

Comparison 1 CANNABIS REDUCTION: ADJUNCT PSYCHOLOGICAL THERAPY versus TREATMENT AS USUAL, Outcome 11 General functioning: 1. Subjective quality of life (WHO QOL, brief, high score = better).
1.11.2 long term
Data from one relevant trial (n = 48) (Madigan 2012) showed no significant difference between WHO QOL for treatment as usual and psychological therapy and treatment as usual (1 RCT n = 48, MD 1.50 CI ‐0.40 to 3.40, Analysis 1.11).
1.12 General functioning: 3. Global functioning (GAF, higher = better)
1.12.1 medium term ‐ three months
Two relevant trials (n = 120) provided data. There was no significant difference between GAF for treatment as usual and psychological therapy and treatment as usual (2 RCTs n = 120, MD ‐0.11 CI ‐2.57 to 2.36, Heterogeneity: Chi² = 0.17, df = 1 (P = 0.68); I² = 0%, Analysis 1.12).
1.12. Analysis.

Comparison 1 CANNABIS REDUCTION: ADJUNCT PSYCHOLOGICAL THERAPY versus TREATMENT AS USUAL, Outcome 12 General functioning: 3. Global functioning (GAF, high score = better).
1.12.2 medium term ‐ six months
Data from one relevant trial (n = 62) (Bonsack 2011) showed no significant difference between GAF for treatment as usual and psychological therapy and treatment as usual (1 RCT n = 62, MD ‐1.00 CI ‐4.40 to 2.40 Analysis 1.12).
1.12.3 long term
Two relevant trials (n = 109) provided data. There was no significant difference between reduction in GAF for treatment as usual and psychological therapy and treatment as usual (2 RCTs n = 109, MD 1.88 CI ‐1.09 to 4.85, Heterogeneity: Chi² = 0.27, df = 1 (P = 0.60); I² = 0%, Analysis 1.12).
1.13 General functioning: 2. Attitude to treatment (DAI, medium term, skewed data)
One relevant trial (1 RCT n = 49) (Madigan 2012) reported data for this outcome. However, these data were heavily skewed and are best inspected by viewing Analysis 1.13
1.13. Analysis.
Comparison 1 CANNABIS REDUCTION: ADJUNCT PSYCHOLOGICAL THERAPY versus TREATMENT AS USUAL, Outcome 13 General functioning: 2. Attitude to treatment (DAI, medium term, skewed data).
| General functioning: 2. Attitude to treatment (DAI, medium term, skewed data) | ||||
|---|---|---|---|---|
| Study | Intervention | Mean | SD | N |
| medium term | ||||
| Madigan 2012 | GPI + TAU | 8.1 | 9.9 | 33 |
| Madigan 2012 | TAU | 5.9 | 9.6 | 15 |
1.14 General functioning: 4. Global functioning (SOFAS, higher = better)
2.14.1 medium term ‐ three months
Data from one relevant trial (n = 62) (Bonsack 2011) showed no significant difference between in SOFAS: treatment as usual and psychological therapy and treatment as usual (1 RCT n = 62, MD 0.10 CI ‐3.02 to 3.22, Analysis 1.14).
1.14. Analysis.

Comparison 1 CANNABIS REDUCTION: ADJUNCT PSYCHOLOGICAL THERAPY versus TREATMENT AS USUAL, Outcome 14 General functioning: 4. Global functioning (SOFAS, high score = better).
1.14.2 medium term six months
Data from one relevant trial (n = 62) (Bonsack 2011) showed no significant difference between SOFAS: treatment as usual and psychological therapy and treatment as usual (1 RCT n = 62, MD ‐0.10 CI ‐3.63 to 3.43, Analysis 1.14).
1.14.3 long term
Data from one relevant trial (n = 62) (Bonsack 2011) showed no significant difference between SOFAS: treatment as usual and psychological therapy and treatment as usual (1 RCT n = 62, MD 2.70 CI ‐1.08 to 6.48, Analysis 1.14).
COMPARISON 2: CANNABIS REDUCTION: PSYCHOLOGICAL THERAPY (SPECIFCALLY ABOUT CANNABIS AND PSYCHOSIS) versus NON‐SPECIFIC PSYCHOEDUCATION
2.1 Behaviour: Cannabis use: 1. Used cannabis in last four weeks
2.1.1 by three months ‐ end of treatment
One relevant trial (n = 47) (Edwards 2006) provided data. There was no significant difference between cannabis use: cannabis and psychosis therapy and psychoeducation (1 RCT n = 47, RR 1.04 CI 0.62 to 1.74, Analysis 2.1).
2.1. Analysis.

Comparison 2 CANNABIS REDUCTION: PSYCHOLOGICAL THERAPY (SPECIFICALLY ABOUT CANNABIS AND PSYCHOSIS) versus NON‐SPECIFIC PSYCHOEDUCATION, Outcome 1 Behaviour: Cannabis use: 1. Used cannabis in last 4 weeks.
2.1.2 by nine months ‐ six months after end of treatment
One relevant trial (n = 47) (Edwards 2006) provided data. There was no significant difference between cannabis use: cannabis and psychosis therapy and psychoeducation (1 RCT n = 47, RR 1.30 CI 0.79 to 2.15, Analysis 2.1).
2.2 Behaviour: Cannabis use: 2. Percentage days used cannabis in last four weeks (skewed data)
2.2.1 by three months
Data for this outcome were heavily skewed and are best inspected by viewing Analysis 2.2.
2.2. Analysis.
Comparison 2 CANNABIS REDUCTION: PSYCHOLOGICAL THERAPY (SPECIFICALLY ABOUT CANNABIS AND PSYCHOSIS) versus NON‐SPECIFIC PSYCHOEDUCATION, Outcome 2 Behaviour: Cannabis use: 2. Percentage days used cannabis in last 4 weeks (skewed data).
| Behaviour: Cannabis use: 2. Percentage days used cannabis in last 4 weeks (skewed data) | ||||
|---|---|---|---|---|
| Study | Intervention | Mean | SD | N |
| by 3 months ‐ end of treatment | ||||
| Edwards 2006 | CAP | 30.4 | 41.8 | 23 |
| Edwards 2006 | PE | 18.8 | 30.6 | 24 |
| by 9 months ‐ 6 months after end of treatment | ||||
| Edwards 2006 | CAP | 32.4 | 44.9 | 23 |
| Edwards 2006 | PE | 19.3 | 30.4 | 24 |
2.2.2 by nine months
Data for this outcome were heavily skewed and are best inspected by viewing Analysis 2.2.
2.3 Mental state: 1. Average overall score (BPRS‐E total endpoint, higher scores = poor)
2.3.1 by three months ‐ end of treatment
Data from one relevant trial (n = 47) (Edwards 2006) showed no significant difference between reduction in average overall BPRS scores: cannabis and psychosis therapy and psychoeducation (1 RCT n = 47, MD 3.60 CI ‐5.61 to 12.81, Analysis 2.3).
2.3. Analysis.

Comparison 2 CANNABIS REDUCTION: PSYCHOLOGICAL THERAPY (SPECIFICALLY ABOUT CANNABIS AND PSYCHOSIS) versus NON‐SPECIFIC PSYCHOEDUCATION, Outcome 3 Mental state: 1. Average overall score (BPRS‐E total endpoint, high score = poor).
2.3.2 by nine months ‐ six months after end of treatment
Data from one relevant trial (n = 47) (Edwards 2006) showed no significant difference between reduction in average overall BPRS scores: cannabis and psychosis therapy and psychoeducation (1 RCT n = 47, MD ‐0.80 CI ‐9.07 to 7.47, Analysis 2.3).
2.4 Mental state: 2. Average overall score (BPRS‐PS total endpoint, higher scores = poor, skewed data)
2.4.1 by three months ‐ end of treatment
Data for this outcome were heavily skewed and are best inspected by viewing Analysis 2.4.
2.4. Analysis.
Comparison 2 CANNABIS REDUCTION: PSYCHOLOGICAL THERAPY (SPECIFICALLY ABOUT CANNABIS AND PSYCHOSIS) versus NON‐SPECIFIC PSYCHOEDUCATION, Outcome 4 Mental state: 2. Average overall score (BPRS‐PS total endpoint, skewed data).
| Mental state: 2. Average overall score (BPRS‐PS total endpoint, skewed data) | ||||
|---|---|---|---|---|
| Study | Intervention | Mean | SD | N |
| by 3 months ‐ end of treatment | ||||
| Edwards 2006 | CAP | 8.9 | 4.8 | 23 |
| Edwards 2006 | PE | 9.5 | 5.4 | 24 |
| by 9 months ‐ 6 months after end of treatment | ||||
| Edwards 2006 | CAP | 9.4 | 4.6 | 23 |
| Edwards 2006 | PE | 8.8 | 4.8 | 24 |
2.4.2 by nine months ‐ six months after end of treatment
Data for this outcome were heavily skewed and are best inspected by viewing Analysis 2.4.
2.5 Mental state: 3. Average depression score (BDI‐SF total endpoint , higher scores = poorer, skewed data)
2.5.1 by three months ‐ end of treatment
Data for this outcome were heavily skewed and are best inspected by viewing Analysis 2.5.
2.5. Analysis.
Comparison 2 CANNABIS REDUCTION: PSYCHOLOGICAL THERAPY (SPECIFICALLY ABOUT CANNABIS AND PSYCHOSIS) versus NON‐SPECIFIC PSYCHOEDUCATION, Outcome 5 Mental state: 3. Average depression score (BDI‐SF total endpoint, skewed data).
| Mental state: 3. Average depression score (BDI‐SF total endpoint, skewed data) | ||||
|---|---|---|---|---|
| Study | Intervention | Mean | SD | N |
| by 3 months ‐ end of treatment | ||||
| Edwards 2006 | CAP | 6.2 | 5.9 | 23 |
| Edwards 2006 | PE | 7.8 | 8.1 | 24 |
| by 9 months ‐ 6 months after end of treatment | ||||
| Edwards 2006 | CAP | 7.5 | 6.3 | 23 |
| Edwards 2006 | PE | 6.3 | 7.2 | 24 |
1.3.2 by nine months ‐ six months after end of treatment
Data for this outcome were heavily skewed and are best inspected by viewing Analysis 2.5.
2.6 Mental state: 4. Average negative symptom score (SANS endpoint, higher scores = poor, skewed data)
2.6.1 by three months ‐ end of treatment
Data for this outcome were heavily skewed and are best inspected by viewing Analysis 2.6.
2.6. Analysis.
Comparison 2 CANNABIS REDUCTION: PSYCHOLOGICAL THERAPY (SPECIFICALLY ABOUT CANNABIS AND PSYCHOSIS) versus NON‐SPECIFIC PSYCHOEDUCATION, Outcome 6 Mental state: 4. Average negative symptom score (SANS endpoint, skewed data).
| Mental state: 4. Average negative symptom score (SANS endpoint, skewed data) | ||||
|---|---|---|---|---|
| Study | Intervention | Mean | SD | N |
| by 3 months ‐ end of treatment | ||||
| Edwards 2006 | CAP | 21.8 | 14.9 | 23 |
| Edwards 2006 | PE | 23.5 | 14.0 | 24 |
| by 9 months ‐ 6 months after end of treatment | ||||
| Edwards 2006 | CAP | 23.7 | 17.2 | 23 |
| Edwards 2006 | PE | 19.4 | 13.5 | 24 |
2.6.2 by nine months ‐ six months after end of treatment
Data for this outcome were heavily skewed and are best inspected by viewing Analysis 2.6.
2.7 Global state: Average overall score (KAPQ total endpoint, higher = good)
2.7.1 by three months ‐ end of treatment
Data from one relevant trial (n = 47) (Edwards 2006) showed no significant difference between KAPQ scores for cannabis and psychosis therapy and psychoeducation (1 RCT n = 47, MD ‐0.80 CI ‐3.38 to 1.78, Analysis 2.7).
2.7. Analysis.

Comparison 2 CANNABIS REDUCTION: PSYCHOLOGICAL THERAPY (SPECIFICALLY ABOUT CANNABIS AND PSYCHOSIS) versus NON‐SPECIFIC PSYCHOEDUCATION, Outcome 7 Global state: Average overall score (KAPQ total endpoint, high score = good).
2.7.2 by nine months ‐ six months after end of treatment
Data from one relevant trial (n = 47) (Edwards 2006) showed no significant difference between KAPQ scores: cannabis and psychosis therapy and psychoeducation (1 RCT n = 47, MD ‐0.90 CI ‐3.22 to 1.42, Analysis 2.7).
2.8 General functioning: Average score (SOFAS total endpoint, higher scores = good)
2.8.1 by three months ‐ end of treatment
Data from one relevant trial (n = 47) (Edwards 2006) showed no significant difference between SOFAS: cannabis and psychosis therapy and psychoeducation (1 RCT n = 47, MD ‐0.80 CI ‐9.95 to 8.35, Analysis 2.8).
2.8. Analysis.

Comparison 2 CANNABIS REDUCTION: PSYCHOLOGICAL THERAPY (SPECIFICALLY ABOUT CANNABIS AND PSYCHOSIS) versus NON‐SPECIFIC PSYCHOEDUCATION, Outcome 8 General functioning: Average score (SOFAS total endpoint, high score = good).
2.8.2 by nine months ‐ six months after end of treatment
Data from one relevant trial (n = 47) (Edwards 2006) showed no significant difference between SOFAS: cannabis and psychosis therapy and psychoeducation (1 RCT n = 47, MD ‐4.70 CI ‐14.52 to 5.12, Analysis 2.8).
COMPARISON 3: CANNABIS REDUCTION ‐ ANTIPSYCHOTIC 'A' versus ANTIPSYCHOTIC 'B'
3.1 Behaviour: Cannabis use: 1. Traces of cannabis breakdown products in urine (number of patients positive above threshold level ‐ 100 nanograms, olanzapine versus risperidone)
One trial (n = 16) (Akerele 2007) provided data.There was no significant difference between reduction in cannabis use: antipsychotic and antipsychotic (1 RCT n = 16, RR 1.80 CI 0.52 to 6.22, Analysis 3.1).
3.1. Analysis.

Comparison 3 CANNABIS REDUCTION: ANTIPSYCHOTIC 'A' versus ANTIPSYCHOTIC 'B', Outcome 1 Behaviour: Cannabis use: 1. Traces of cannabis breakdown products in urine (number of patients positive above threshold level ‐ 100 nanograms ‐ olanzapine versus risperidone).
3.2 Behaviour: Cannabis use: 2. As defined in each study (skewed data)
In this outcome we found all three trials relevant to comparison three to be pertinent (3 RCTs) : van Nimwegen 2008 (n = 41), Brunette 2011 (n = 31) and Akerele 2007 (n = 16)
3.2.1 Average score per week (Marijuana Craving Report, high score = poor, olanzapine versus risperidone)
Data for this outcome were heavily skewed and are best inspected by viewing Analysis 3.2
3.2. Analysis.
Comparison 3 CANNABIS REDUCTION: ANTIPSYCHOTIC 'A' versus ANTIPSYCHOTIC 'B', Outcome 2 Behaviour: Cannabis use: 2. As defined in each study (skewed data).
| Behaviour: Cannabis use: 2. As defined in each study (skewed data) | ||||
|---|---|---|---|---|
| Study | Intervention | Mean | Standard Deviation | N |
| average score per week (Marijuana Craving Report ‐ olanzapine versus risperidone | ||||
| Akerele 2007 | Olanzapine | 32.0 | 39.0 | 10 |
| Akerele 2007 | Risperidone | 21.0 | 10.0 | 6 |
| average self‐report scores of joints per week (short term) ‐ olanzapine versus risperidone | ||||
| van Nimwegen 2008 | Olanzapine | 1.6 | 2.6 | 20 |
| van Nimwegen 2008 | Risperidone | 3.5 | 5.8 | 21 |
| average intensity of cannabis use in joints per week ‐ clozapine versus other antipsychotics | ||||
| Brunette 2011 | Treatment as usual (TAU) | 16 | 9.79 | 16 |
| Brunette 2011 | Clozapine | 8 | 5.14 | 15 |
3.2.2 Self‐report scores, joints per week (short term) ‐ olanzapine versus risperidone
Data for this outcome were heavily skewed and are best inspected by viewing Analysis 3.2
3.2.3 Intensity of cannabis use (joints per week) ‐ clozapine versus other antipsychotics
Data for this outcome were heavily skewed and are best inspected by viewing Analysis 3.2
3.3 Behaviour: Cannabis use: 3. Average score per week (Marijuana Craving Report, skewed data ‐ olanzapine versus risperidone)
In this outcome we found only one trial to be relevant (1 RCT): Akerele 2007 (n = 16). Data for this outcome were heavily skewed and are best inspected by viewing Analysis 3.3.
3.3. Analysis.
Comparison 3 CANNABIS REDUCTION: ANTIPSYCHOTIC 'A' versus ANTIPSYCHOTIC 'B', Outcome 3 Behaviour: Cannabis use: 3. Average score per week (Marijuana Craving Report skewed data ‐ olanzapine versus risperidone).
| Behaviour: Cannabis use: 3. Average score per week (Marijuana Craving Report skewed data ‐ olanzapine versus risperidone) | |||||
|---|---|---|---|---|---|
| Study | Intervention | Mean | SD | N | Notes |
| Akerele 2007 | Olanzapine | 32 | 39 | 10 | Represented only in graph from which we have taken these estimates |
| Akerele 2007 | Risperidone | 21 | 10 | 6 | |
3.4 Mental state: Average score (OCDUS, short‐term, high = poor ‐ olanzapine versus risperidone)
In this subgroup we only found one relevant trial (n = 41) (van Nimwegen 2008). There was no significant difference between OCDUS for antipsychotic and antipsychotic (1 RCT n = 41, MD ‐1.30 CI ‐6.11 to 3.51, Analysis 3.4).
3.4. Analysis.

Comparison 3 CANNABIS REDUCTION: ANTIPSYCHOTIC 'A' versus ANTIPSYCHOTIC 'B', Outcome 4 Mental state: Average score (OCDUS, short term, high = poor) ‐ olanzapine versus risperdione.
3.5 Adverse effects: 1. Anticholinergic ‐ various (clozapine versus other antipsychotic)
3.5.1 constipation
In this subgroup we only found one relevant trial (n = 30) (Brunette 2011). There was no significant difference in constipation: antipsychotic and antipsychotic (1 RCT n = 30, RR 9.00 CI 0.53 to 153.79, Analysis 3.5).
3.5. Analysis.

Comparison 3 CANNABIS REDUCTION: ANTIPSYCHOTIC 'A' versus ANTIPSYCHOTIC 'B', Outcome 5 Adverse effects: 1. Anticholinergic ‐ various (clozapine vs other antipsychotic).
3.5.2 nasal congestion
In this subgroup we only found one relevant trial (n = 31) (Brunette 2011). There was no significant difference in nasal congestion: antipsychotic and antipsychotic (1 RCT n = 31, RR 0.21 CI 0.01 to 4.1, Analysis 3.5).
3.5.3 salivation ‐ too much
In this subgroup we only found one relevant trial (n = 31) (Brunette 2011). There no was a statistically significant difference in salivation: antipsychotic and antipsychotic (1 RCT n = 31, RR 22.31 CI 1.42 to 350.31, Analysis 3.5).
3.5.4 salivation ‐ too little
In this subgroup we only found one relevant trial (n = 31) (Brunette 2011). There was no significant difference in salivation: antipsychotic and antipsychotic (1 RCT n = 31, RR 1.07 CI 0.17 to 6.64, Analysis 3.5).
3.5.5 urinary incontinence
In this subgroup we only found one relevant trial (n = 31) (Brunette 2011). There was no significant difference in urinary incontinence: antipsychotic and antipsychotic (1 RCT n = 31, RR 5.31 CI 0.28 to 102.38, Analysis 3.5).
3.6 Adverse effects: 2. Cardiac ‐ various (clozapine versus other antipsychotic)
3.6.1 hypertension
In this subgroup we only found one relevant trial (n = 30) (Brunette 2011). There was no significant difference between hypertension: antipsychotic and antipsychotic (1 RCT n = 30, RR 1.00 CI 0.16 to 6.20, Analysis 3.6).
3.6. Analysis.

Comparison 3 CANNABIS REDUCTION: ANTIPSYCHOTIC 'A' versus ANTIPSYCHOTIC 'B', Outcome 6 Adverse effects: 2. Cardiac ‐ various (clozapine vs other antipsychotic).
3.7 Adverse effects: 3. Central nervous system/higher functions ‐ various (clozapine versus other antipsychotic, number of events)
3.7.1 agitation ‐ increased
In this subgroup we only found one relevant trial (n = 30) (Brunette 2011). There was no significant difference in agitation antipsychotic and antipsychotic (1 RCT n = 30, RR 1.00 CI 0.07 to 14.55, Analysis 3.7).
3.7. Analysis.

Comparison 3 CANNABIS REDUCTION: ANTIPSYCHOTIC 'A' versus ANTIPSYCHOTIC 'B', Outcome 7 Adverse effects: 3. Central nervous system / higher functions ‐ various (clozapine vs other antipsychotic).
3.7.2 depression
In this subgroup we only found one relevant trial (n = 30) (Brunette 2011). There was no significant difference in depression: antipsychotic and antipsychotic (1 RCT n = 30, RR 2.00 CI 0.20 to 19.78, Analysis 3.7).
3.7.3 dizziness
In this subgroup we only found one relevant trial (n = 31) (Brunette 2011). There was no significant difference in dizziness: antipsychotic and antipsychotic (1 RCT n = 31, RR 5.33 CI 0.70 to 40.54, Analysis 3.7).
3.7.4 dreams ‐ unusual dream activity
In this subgroup we only found one relevant trial (n = 31) (Brunette 2011). There was no significant difference between in unusual dream activity: antipsychotic and antipsychotic (1 RCT n = 31, RR 0.21 CI 0.01 to 4.10, Analysis 3.7).
3.7.5 fatigue
In this subgroup we only found one relevant trial (n = 31) (Brunette 2011). There was no significant difference between reduction in cannabis use: antipsychotic and antipsychotic (1 RCT n = 31, RR 7.44 CI 0.42 to 132.95, Analysis 3.7).
3.7.6 irritability
In this subgroup we only found one relevant trial (n = 31) (Brunette 2011). There was no significant difference between reduction in cannabis use: antipsychotic and antipsychotic (1 RCT n = 31, RR 1.07 CI 0.07 to 15.57, Analysis 3.7).
3.7.7 libido ‐ decreased
One relevant trial (n = 31) (Brunette 2011) provided data. There was no significant difference between reduction in cannabis use: antipsychotic and antipsychotic (1 RCT n = 31, RR 1.07 CI 0.07 to 15.57, Analysis 3.7).
3.7.8 sleep ‐ too much
One relevant trial (n = 31) (Brunette 2011) provided data. There was a statistically significant difference between reduction in cannabis use: antipsychotic and antipsychotic (1 RCT n = 31, RR 4.80 CI 1.23 to 18.71, Analysis 3.7).
3.7.9 sleep ‐ insomnia
One relevant trial (n = 31) (Brunette 2011) provided data. There was no significant difference in insomnia: antipsychotic and antipsychotic (1 RCT n = 31, RR 2.13 CI 0.22 to 21.17, Analysis 3.7).
3.7.10 suicide attempt
One relevant trial (n = 31) (Brunette 2011) provided data. There was no significant difference in suicide attempts: antipsychotic and antipsychotic (1 RCT n = 31, RR 1.07 CI 0.07 to 15.57, Analysis 3.7).
3.8 Adverse effects: 4. Gastrointestinal ‐ various (clozapine versus 'other antipsychotic', number of events)
3.8.1 nausea
Data from one relevant trial (n = 31) (Brunette 2011) showed no significant difference in nausea: antipsychotic and antipsychotic (1 RCT n = 31, RR 2.13 CI 0.22 to 21.17, Analysis 3.8).
3.8. Analysis.

Comparison 3 CANNABIS REDUCTION: ANTIPSYCHOTIC 'A' versus ANTIPSYCHOTIC 'B', Outcome 8 Adverse effects: 4. Gastrointestinal ‐ various (clozapine vs other antipsychotic).
3.8.2 vomiting
Data from one relevant trial (n = 31) (Brunette 2011) showed no significant difference vomiting in cannabis use: antipsychotic and antipsychotic (1 RCT n = 31, RR 1.07 CI 0.25 to 4.49, Analysis 3.8).
3.9 Adverse effects: 5. Metabolic ‐ weight gain (clozapine versus 'other antipsychotic', number of events)
One relevant trial (Brunette 2011) provided data. There was no significant difference in weight gain cannabis use: antipsychotic and antipsychotic (1 RCT n = 31, RR 3.20 CI 0.76 to 13.46, Analysis 3.9).
3.9. Analysis.

Comparison 3 CANNABIS REDUCTION: ANTIPSYCHOTIC 'A' versus ANTIPSYCHOTIC 'B', Outcome 9 Adverse effects: 5. Metabolic ‐ weight gain (clozapine vs other antipsychotic).
3.10 Adverse effects: 6. a. Movement disorders ‐ various (clozapine versus 'other antipsychotic', number of events)
3.10.1 agitation ‐ increased
One relevant trial (n = 30) (Brunette 2011) provided data. There was no significant difference in agitation: antipsychotic and antipsychotic (1 RCT n = 30, RR 1.00 CI 0.07 to 14.55, Analysis 3.10).
3.10. Analysis.

Comparison 3 CANNABIS REDUCTION: ANTIPSYCHOTIC 'A' versus ANTIPSYCHOTIC 'B', Outcome 10 Adverse effects: 6a. Movement disorders ‐ various (clozapine vs other antipsychotic).
3.10.2 akathisia
One relevant trial (n = 31) (Brunette 2011) provided data. There was no significant difference in akathisia: antipsychotic and antipsychotic (1 RCT n = 31, RR 1.07 CI 0.07 to 15.57, Analysis 3.10).
3.10.3 muscle spasms
One relevant trial (n = 31) (Brunette 2011) provided data. There was no significant difference in muscle spasms: antipsychotic and antipsychotic (1 RCT n = 31, RR 5.31 CI 0.28 to 102.38, Analysis 3.10).
3.11 Adverse events: 6. b. Movement disorders ‐ average score (Simpson scale, high score = poor)
3.11.1 olanzapine versus risperidone
Data from one relevant trial (n = 16) (Akerele 2007) showed no significant difference in Simpson scale: antipsychotic and antipsychotic (1 RCT n = 16, MD 0.08 CI ‐1.06 to 1.22, Analysis 3.11).
3.11. Analysis.
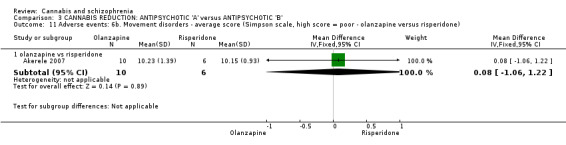
Comparison 3 CANNABIS REDUCTION: ANTIPSYCHOTIC 'A' versus ANTIPSYCHOTIC 'B', Outcome 11 Adverse events: 6b. Movement disorders ‐ average score (Simpson scale, high score = poor ‐ olanzapine versus risperidone).
3.12 Adverse effects: 7. Others ‐ various (clozapine versus 'other antipsychotic', number of events)
3.12.1 chest pain ‐ non‐cardiac
Data from one relevant trial (n = 31) (Brunette 2011) showed no significant difference in chest pain: antipsychotic and antipsychotic (1 RCT n = 31, RR 0.53 CI 0.05 to 5.29, Analysis 3.12).
3.12. Analysis.

Comparison 3 CANNABIS REDUCTION: ANTIPSYCHOTIC 'A' versus ANTIPSYCHOTIC 'B', Outcome 12 Adverse effects: 7. Others ‐ various (clozapine vs other antipsychotic).
3.12.2 flu‐like symptoms
One relevant trial (n = 31) (Brunette 2011) provided data. There was no significant difference reduction in flu like symptoms: antipsychotic and antipsychotic (1 RCT n = 31, RR 0.21 CI 0.01 to 4.10, Analysis 3.12).
3.12.3 headache
One relevant trial (n = 31) (Brunette 2011) provided data. There was no significant difference in headache: antipsychotic and antipsychotic (1 RCT n = 31, RR 2.13 CI 0.22 to 21.17, Analysis 3.12).
3.13 Leaving the study early: 1. Reasons ‐ Olanzapine versus Risperidone (number of patients leaving)
3.13.1 admission
One relevant trial (n = 28) (Akerele 2007) provided data. There was no significant difference in hospital admission: antipsychotic and antipsychotic (1 RCT n = 28, RR 1.00 CI 0.07 to 14.45, Analysis 3.13).
3.13. Analysis.

Comparison 3 CANNABIS REDUCTION: ANTIPSYCHOTIC 'A' versus ANTIPSYCHOTIC 'B', Outcome 13 Leaving the study early: 1. Number leaving (olanzapine vs risperidone).
3.13.2 any
Data from one relevant trial (n = 28) (Akerele 2007) showed no significant difference leaving the study for any reason cannabis use: antipsychotic and antipsychotic (1 RCT n = 28, RR 0.50 CI 0.19 to 1.29, Analysis 3.13).
3.13.3 intolerable adverse effects
Data from one relevant trial (n = 28) (Akerele 2007) showed there was a statistically significant difference between intolerable adverse effects: antipsychotic and antipsychotic (1 RCT n = 28, RR 0.00 CI 0.00 to 0.00, Analysis 3.13).
3.13.4 not interested
Data from one relevant trial (n = 28) (Akerele 2007) showed there was no significant difference between leaving the study due to be not being interested: antipsychotic and antipsychotic (1 RCT n = 28, RR 0.43 CI 0.14 to 1.33, Analysis 3.13).
3.14 Leaving the study early: 2. Time in treatment (weeks)
3.14.1 olanzapine versus risperidone
Data from one relevant trial (n = 28) (Akerele 2007) showed there was no significant difference between time in treatment: antipsychotic and antipsychotic (1 RCT n = 28, MD 0.00 CI ‐3.35 to 3.35, Analysis 3.14).
3.14. Analysis.

Comparison 3 CANNABIS REDUCTION: ANTIPSYCHOTIC 'A' versus ANTIPSYCHOTIC 'B', Outcome 14 Leaving the study early: 2. Weeks in treatment (olanzapine vs risperidone).
COMPARISON 4: CANNABINOID AS TREATMENT ‐ CANNABIDIOL versus AMISULPRIDE
4.1 Mental state: 1. a. Average overall score (BPRS, total endpoint, higher scores = poor)
4.1.1 Day 7 ‐ short term
In this subgroup we only found one relevant trial (n = 39) (Leweke 2012). There was no significant difference in BPRS for cannabidiol and amisulpride (1 RCT n = 39, MD ‐1.50 CI ‐6.54 to 3.54, Analysis 4.1).
4.1. Analysis.

Comparison 4 CANNABINOID AS TREATMENT: CANNABIDIOL versus AMISULPRIDE, Outcome 1 Mental state: 1a. Average overall score (BPRS, total endpoint, high score = poor).
4.1.2 Day 14 ‐ short term
In this subgroup we only found one relevant trial (n = 39) (Leweke 2012). There was no significant difference between in BPRS for cannabidiol and amisulpride (1 RCT n = 39, MD 1.80 CI ‐4.61 to 8.21, Analysis 4.1).
4.1.3 Day 21 ‐ short term
In this subgroup we only found one relevant trial (n = 34) (Leweke 2012). There was no significant difference in BPRS between cannabidiol and amisulpride (1 RCT n = 34, MD 4.20 CI ‐4.24 to 12.64, Analysis 4.1).
4.1.4 Day 28 ‐ short term
In this subgroup we only found one relevant trial (n = 35) (Leweke 2012). There was no significant difference in BPRS between cannabidiol and amisulpride (1 RCT n = 35, MD 1.10 CI ‐8.18 to 10.38, Analysis 4.1).
4.2 Mental state: 1. b. Average overall score (PANSS, total endpoint, higher scores = poor)
4.2.1 day 14 (short term)
In this subgroup we only found one relevant trial (n = 39) (Leweke 2012). There was no significant difference in PANSS between cannabidiol and amisulpride (1 RCT n = 39, MD 0.00 CI ‐10.10 to 10.10, Analysis 4.2).
4.2. Analysis.

Comparison 4 CANNABINOID AS TREATMENT: CANNABIDIOL versus AMISULPRIDE, Outcome 2 Mental state: 1b. Average overall score (PANSS, total endpoint, high score = poor).
4.2.2 day 28 (short term)
In this subgroup we only found one relevant trial (n = 35) (Leweke 2012). There was no significant difference in PANSS between cannabidiol and amisulpride (1 RCT n = 35, MD 0.40 CI ‐13.42 to 14.22, Analysis 4.2).
4.3 Mental state: 2. Average negative symptom score (PANSS, higher score = poor)
4.3.1 Day 14 ‐ short term
In this subgroup we only found one relevant trial (n = 39) (Leweke 2012). There was no significant difference in PANSS between cannabidiol and amisulpride (1 RCT n = 39, MD 1.20 CI ‐2.13 to 4.53, Analysis 4.3).
4.3. Analysis.

Comparison 4 CANNABINOID AS TREATMENT: CANNABIDIOL versus AMISULPRIDE, Outcome 3 Mental state: 2. Average negative symptom score (PANSS, high score = poor).
4.3.2 Day 28 ‐ short term
In this subgroup we only found one relevant trial (n = 35) (Leweke 2012). There was no significant difference in PANSS between cannabidiol and amisulpride (1 RCT n = 35, MD 2.70 CI ‐0.92 to 6.32, Analysis 4.3).
4.4 Mental state: 3. Average positive symptom score (PANSS, higher score = poor)
4.4.1 Day 14 ‐ short term
In this subgroup we only found one relevant trial (n = 39) (Leweke 2012). There was no significant difference in PANSS between cannabidiol and amisulpride (1 RCT n = 39, MD 1.20 CI ‐1.85 to 4.25, Analysis 4.4).
4.4. Analysis.

Comparison 4 CANNABINOID AS TREATMENT: CANNABIDIOL versus AMISULPRIDE, Outcome 4 Mental state: 3. Average positive symptom score (PANSS, high score = poor).
4.4.2 Day 28 ‐ short term
In this subgroup we only found one relevant trial (n = 35) (Leweke 2012). There was no significant difference in PANSS between: cannabidiol and amisulpride (1 RCT n = 35, MD 0.60 CI ‐3.92 to 5.12, Analysis 4.4).
4.5 Adverse effects: 1. Endocrine ‐ prolactin (μg/L, short term)
Data for this outcome were heavily skewed and are best inspected by viewing Analysis 4.5.
4.5. Analysis.
Comparison 4 CANNABINOID AS TREATMENT: CANNABIDIOL versus AMISULPRIDE, Outcome 5 Adverse effects: 1. Endocrine ‐ prolactin (μg/l, short term ‐ skewed data).
| Adverse effects: 1. Endocrine ‐ prolactin (μg/l, short term ‐ skewed data) | ||||
|---|---|---|---|---|
| Study | Intervention | Mean | SD | N |
| Leweke 2012 | Amisulpride | 77 | 28.04 | 21 |
| Leweke 2012 | Cannabidiol | 0 | 31.55 | 21 |
4.6 Adverse effects: 2. Metabolic ‐ weight gain (kg, short term)
Data for this outcome were heavily skewed and are best inspected by viewing Analysis 4.6.
4.6. Analysis.
Comparison 4 CANNABINOID AS TREATMENT: CANNABIDIOL versus AMISULPRIDE, Outcome 6 Adverse effects: 2. Metabolic ‐ weight gain (kg, short term ‐ skewed data).
| Adverse effects: 2. Metabolic ‐ weight gain (kg, short term ‐ skewed data) | ||||
|---|---|---|---|---|
| Study | Intervention | Mean | SD | N |
| Leweke 2012 | Amisulpride | 3.5 | 2.1 | 21 |
| Leweke 2012 | Cannabidiol | 0 | 2.1 | 21 |
4.7 Adverse effects: 3. Movement disorders ‐ change in extrapyramidal symptoms (EPS, short term)
Data for this outcome were heavily skewed and are best inspected by viewing Analysis 4.7.
4.7. Analysis.
Comparison 4 CANNABINOID AS TREATMENT: CANNABIDIOL versus AMISULPRIDE, Outcome 7 Adverse effects: 3. Movement disorders ‐ change in extrapyramidal symptoms (EPS, short term ‐ skewed data).
| Adverse effects: 3. Movement disorders ‐ change in extrapyramidal symptoms (EPS, short term ‐ skewed data) | ||||
|---|---|---|---|---|
| Study | Intervention | Mean | SD | N |
| Leweke 2012 | Amisulpride | 0.17 | 0.12 | 21 |
| Leweke 2012 | Cannabidiol | ‐0.03 | 0.11 | 21 |
Discussion
1. The search
The Cochrane Schizophrenia Group's register of trials is the most comprehensive register of its kind. It is compiled by searching mainstream and less well known bibliographic databases and from manual searches of key journals and conference proceedings. We were able to include eight studies and found one additional study (D'Souza 2005), which was added to awaiting assessment whilst further information is sought. Trials published in languages other than English (we found no studies published in any language other than English), and those with equivocal results are often difficult to find, and our search relied heavily on English phrases. However, it seems unlikely that well designed and reported randomised trials went unnoticed.
Summary of main results
1. COMPARISON 1: CANNABIS REDUCTION: ADJUNCT PSYCHOLOGICAL THERAPY versus TREATMENT AS USUAL
This section of the review compared treatment as usual versus psychological intervention specifically targeted at cannabis use (to encourage reduction in cannabis consumption) combined with treatment as usual. For a summary of the primary outcomes of interest and ratings of the quality of the evidence for each comparison, view Table 1.
1.1 Behaviour: Cannabis use
The main aim of the three studies selected was to see if there was a decrease in cannabis consumption and if there was any subsequent improvement in schizophrenia symptoms, however the comparison suffered due to the trials being small and little data were directly comparable. None of the studies demonstrate any significant difference between treatment as usual and the psychological intervention being tested for outcomes of cannabis use; mental state or general functioning.
The majority of the data for this outcome was skewed.
1.2 General functioning
For one of the four subgroup outcomes the data were skewed. Each outcome was reported by a single paper, as such it is difficult to make any meaningful conclusion. None of the outcomes showed a significant difference in general functioning between psychological intervention and treatment as usual.
1.3 Mental state
All the data for mental state from Bonsack 2011 was skewed; the remaining data were from Madigan 2012. Again, no significant difference was found between the two treatments.
The studies ranged in size from n = 103 to n = 44; and only three could be included, the small size and small number of studies means that it is difficult to draw meaningful conclusions from the studies
There were seven other studies that could have been included on the basis of our inclusion criteria, but they could not be included as the data were not provided in time for publication of the review. Several of the trials involved people with schizophrenia with multiple drug consumption, and although they were stratified for cannabis use, the stratified data were not available at time of publication.
More research needs to be conducted to see if the extra psychological interventions improve outcomes, as the data stand at the moment, they provide no evidence of improvement.
2. COMPARISON 2: CANNABIS REDUCTION: PSYCHOLOGICAL THERAPY (SPECIFICALLY ABOUT CANNABIS AND PSYCHOSIS) versus NON‐SPECIFIC PSYCHOEDUCATION
This section of the review compared cannabis and psychosis therapy versus psychoeducation. For a summary of the primary outcomes of interest and ratings of the quality of the evidence for each comparison, view Table 2.
2.1 Cannabis use
The key aim of this study was to minimise the usage of cannabis in people with first episode psychosis. None of the outcomes revealed any significant difference between groups. Had the study been larger, differences may have emerged. Given the lack of trial‐based data in this area this study provides a welcome appraisal, and hopefully more studies will shed light on the impact of cannabis in people with psychoses.
2.2 Global state
The Knowledge About Psychosis Questionnaire (KAPQ) questionnaire was used to inform participants about psychosis, but did not reveal any differences in the groups understanding at the three‐ and nine‐month assessment points. It is possible that the lack of significant differences to emerge may, in part, have been due to using an active control group.
2.3 Mental state
From the available data on the positive symptoms of psychosis measured with the Brief Psychiatric Rating Scale (BPRS) scale, no differences emerged that demonstrated an overall benefit for Cannabis and Psychosis (CAP) therapy compared with psychoeducation. Other scales were used but these reported skewed data which we had pre‐stated we would not use due to too much inconsistency.
2.4 Social functioning
The participants' social functioning did not improve in either group during the trial whilst interventions were given for three months, or at the follow‐up stage six months later.
3. COMPARISON 3: CANNABIS REDUCTION ‐ ANTIPSYCHOTIC 'A' versus ANTIPSYCHOTIC 'B'
This section of the review compared antipsychotic medication in those with schizophrenia and who used cannabis, comparing the ability to alter the amount of cannabis consumed, and comparing antipsychotic side‐effect profile in specifically that group of patients. For a summary of the primary outcomes of interest and ratings of the quality of the evidence for each comparison, view Table 3.
3.1 Cannabis use
The objective of the three trials that measured the impact of antipsychotics on cannabis usage was to deduce whether use and/or cravings subsided differentially when comparing exposure to certain drugs. In none of the outcomes did any study provide evidence for significant differences between groups. Each trial was limited by a small sample size and skewed data, therefore reliable conclusions regarding the comparative effect of antipsychotics cannot be drawn. In Brunette 2011, data suggest therapy with clozapine may reduce cannabis use more than treatment as usual among patients with schizophrenia and co‐occurring cannabis use disorder, however data are skewed and the sample size small. There appears to be scope for further exploration of the comparative utility of antipsychotics in future trials with larger sample sizes.
3.2 Adverse events
Two trials recorded the adverse effects of interventions that relate to this comparison. In Brunette 2011, significant differences in somnolence and hypersalivation were observed that suggest clozapine associates with better outcomes here. In all other adverse effects measured in Brunette 2011 there were no significant differences between groups, however in several instances (including constipation, weight gain and dizziness), the differences were almost significant. In Akerele 2007, there was no significant difference in terms of movement disorders between groups using the Simpson‐Angus Scale; the study noted that sedation was reported as the most common side effect by both groups; however no patient was withdrawn due to side effects, suggesting a limited need for future investigations into the comparative side effects of olanzapine and risperidone in this context.
3.3 Leaving the study early
There were no significant differences in time until dropout in the olanzapine and risperidone groups in Akerele 2007, and nor were there any significant differences in the reasons for dropout between participants across the two groups. In neither group were intolerable side effects cited by participants as a reason for dropping out. Future trials with larger sample sizes may be better able to elicit differences in motivations for dropping out amongst participants.
3.4 Mental state
In van Nimwegen 2008 there were no significant differences found between groups relating to the Obsessive‐Compulsive Drug Use Scale (OCDUS), which pertains to craving for cannabis. The study noted that most of the changes associated with the scale took place in the first week of the trial, thus a trial extension is unlikely to have uncovered further changes. Measures of changes in mental state relating to cannabis craving that affects usage would be welcome in future studies.
4. COMPARISON 4: CANNABINOID AS TREATMENT ‐ CANNABIDIOL versus AMISULPRIDE
This section of the review compared treatment of schizophrenia with cannabidiol versus amisulpride. For a summary of the primary outcomes of interest and ratings of the quality of the evidence for each comparison, view Table 4.
4.1 Mental state
Leweke 2012 recorded data relating to mental state outcomes. BPRS total endpoint scores appear to favour cannabinoid compared to amisulpride at 7 days, however the difference in scores was not significant and this slight advantage for cannabinoid was not apparent at day 14, 21 and 28. Leweke 2012 also measured mental state using the PANSS and found no found differences in mental state using this scale. The apparent difference in mental state at 7 days is an interesting finding, as there is some slight suggestion that cannabidiol may be have some antipsychotic characteristics, however this result is based on one short term follow‐up and from a very small trial, this overall lack of effect may have been because there was a lack of power to detect a difference in this one very small study. Future studies into its mechanism, efficacy and clinical viability could be of great benefit regarding its potential role as an antipsychotic. Furthermore, research into its antipsychotic role within cannabis could help explain more about associations between cannabis and schizophrenia.
4.2 Adverse effects
In relation to adverse effects, (Leweke 2012) the side‐effect profile for cannabidiol appears to be superior to that of amisulpride. The data are heavily skewed however, thus future studies would be required to clarify whether this is the case.
Overall completeness and applicability of evidence
1. Completeness
Overall, the completeness of evidence was poor; for two comparisons only three of the seven main outcomes were reported, one comparison had two outcomes, and one comparison had no data for any of the seven main outcomes.
There was also a lack of trials for each comparison and for each main outcome; generally there was only one trial for each outcome. The trials were all of moderate quality.
2. Applicability of evidence
Generally the evidence was applicable, all the trials involved patients who were diagnosed on the basis of international standardised diagnostic criteria. All trials took place in developed countries. It is assumed that the healthcare standard amongst these countries is broadly similar; however there are differences in funding structure of health care within these group of countries (private versus publicly funding health care), the main divide being between trials conducted within the United States of America and Western Europe. It is unclear whether these differences in funding would make comparison between trials more difficult. However the lack of comparable data limited the applicability of the evidence to consumers, health professionals and policy makers.
Quality of the evidence
In general, the quality of the evidence was moderate: the main issue with the data were lack of multiple studies, there was usually only one randomised controlled trial (RCT) for each analysis, thus reducing the ability to draw a conclusion. There was also an issue with skewed data. The lack of data are the main limitation with this review.
Generally the trials did attempt to follow the CONSORT statement, however none of the trials adhered very well to the statement, and as a result there was a lack of transparency in several studies, where certain steps or processes within the trial were not clear to the reader. Some trials were excluded due to this lack of transparency, we attempted to contact the authors in order to clarify data or methodology but in several cases no reply was given.
Overall, this review encountered low levels of bias in the studies fit for inclusion. (See Figure 4 and Figure 5.) Potential exceptions occurred in one trial that was funded by a company with pecuniary interest in the result.The only other notable area of bias came where blinding was disrupted or not carried out, this occurred in two trials. Please see the GRADE rating in Table 1; Table 2; Table 3; Table 4.
Potential biases in the review process
There were changes between the first published protocol and the protocol we published above. The key differences were that we partially changed the primary outcomes: we kept relapse and clinically important mental state change; but we did remove hospitalisation. We did this before conducting the review, so any potential bias would be considered unlikely: it would not have affected the selection process of the trials, but it will have changed the results in the discussion. We did not remove or add any main outcomes, however we reordered them, and reclassified death under adverse events,. We also changed the time period for the primary outcomes so that they were all medium term ‐ this was to avoid any ambiguity and to reduce the risk of bias in carrying out the review. Further, we grouped the outcomes within different timeframes of short, medium and long term; this was to ensure applicability of data, and to ensure fair comparison.
We reworded the comparisons, again to avoid ambiguity and reduce risk of bias. In the original protocol, four types of intervention including placebo, cannabinoids, and any other intervention were simply listed; the updated protocol reorganised those four interventions into two specific comparisons: firstly: looking into interventions which affected cannabis use and secondly intervention which involved giving any form of cannabinoids. We believe that did not affect which papers were included in the study, although we did remove the vague intervention of "any other"; there were no papers which we screened that would have come under this category.
There are no known conflicts of interest amongst the authors, none of the authors received any direct funding for the completion of this review.
Agreements and disagreements with other studies or reviews
The scope of this review focuses specifically on schizophrenia and cannabis, an area not directly dealt with by any other reviews. One key review that demonstrates some overlap in findings is Hunt 2013, which agrees overall with the conclusions made in Comparison 2 of this review: that not any one psychosocial treatment is favourable in reducing substance abuse or mental state in people with severe mental illnesses. The specific nature of this review means that there is little wider overlap with other studies and reviews.
Authors' conclusions
Implications for practice.
The question most frequently asked in reference to the relationship between cannabis and schizophrenia is that of whether using cannabis increases the chance of suffering the disorder. However, due to the nature of data available at the time of writing, this review focusses primarily on interventions directed at reducing cannabis use in people with schizophrenia and whether cannabinoids reduce symptoms. There are not enough data to answer these questions.
1. For people with schizophrenia
Cannabis could relieve some of the psychological difficulties that come as part of the illness of schizophrenia, or as reaction to having schizophrenia. However, taking this compound could also make things worse. The evidence is just not clear from the trials. It would seem reasonable that people with schizophrenia who are being advised to stop their cannabis use, when no clear detrimental effect is evident, require better evidence from researchers. People who have schizophrenia and want to stop their cannabis use should also expect better evidence around techniques by which this is assisted.
2. For clinicians
For some people with schizophrenia, cannabis use clearly makes 'positive' symptoms worse. For many, however, using cannabis seems only to have the expected mild soporific effects that probably compound 'negative' symptom languor. Trial‐based research is so limited that it is uninformative. Whether adding the drug is harmful ‐ or helpful is unclear. How best to help people stop when they ask for help in doing so is not well‐researched. There is much work to be done.
3. For policy makers
Adjunctive use of cannabinoid drugs for people with schizophrenia is experimental. Techniques to help people reduce or stop the cannabis are poorly tested.
Implications for research.
1. General
Public registration of a study before participants are randomised would ensure that participants could be confident that people would know that the study had at least taken place. Strict compliance with CONSORT (Moher 2001), both on the part of authors and editors, would help to clarify methodology and ensure outcomes are reported in a manner that is accessible and usable to others. Failure to comply with CONSORT guidelines results in loss of data and confusion in results, neither of which helps clinicians, patients, managers or researchers.
2. Methods
Future trials should ensure that a clear description of the interventions are given. Such a study would only be meaningful if undertaken within usual resources available to routine care and measured outcomes of relevance to clinicians and recipients of care as well as researchers. Study samples should include people with schizophrenia and closely related disorders, or at least allow data on this group of people to be extracted from the paper. Trials conducted in the future would also benefit from increased sample sizes to corroborate study findings.
3. Data
Future trials should ensure that data are presented clearly and thoroughly, which would ensure that it was available for analysis and interpretation. Often data have been inconsistent and missing, which results in difficulty reaching meaningful conclusions; reduced clarity and raises suspicion of bias, when perhaps there is none. We reiterate the importance of researchers to adhere to the Consort Statement, and support the All Trials campaign to ensure all data are published.
4. Suggestions for future reviews
See Characteristics of excluded studies and Characteristics of studies awaiting classification. All studies described within these tables could be possibly included in future reviews as they match inclusion criteria, however at the time of review, no usable data were received and therefore they could not be included.
5. Suggestions for future trials
We recognise that much planning must go into production of a trial protocol but we have now looked at existing evidence is some detail and suggest designs for trials to help people with schizophrenia stop cannabis (Table 6), and, if intent on continuing to use we think that investigating the best antipsychotic to employ (specifically clozapine) could be justified (Table 7).
2. Suggested design for study.
| Methods | Allocation: randomised. Blindness: double blind. Duration: 18 months. Funding: n/a. Setting: multi‐centre. |
| Participants | Diagnosis: psychosis with comorbid cannabis dependence (ICD‐10/DSM‐IV).
N: 450.*
Age: 16‐65. Sex: male/female. History: first psychotic episode or within 3 years following onset of non‐affective or affective psychosis. Included: outpatients and inpatients. Exclusion: learning disability; organic brain damage; unable to consent. |
| Interventions | 1. Standard care. 2. Psychosocial intervention for reduction: package including contingency management, relapse prevention, cognitive therapy. |
| Outcomes | Short term and medium term: Mental state: Clinical Global Impression Scale. Global state: Clinical Global Impression Scale. Behaviour: cannabis consumption, consumption of other substances of abuse. General functioning: Global Assessment of Functioning (GAF). Leaving the study early: dropout rate. Satisfaction with treatment: recipient of care not satisfied with treatment; recipient of care average satisfaction score. Service outcomes: hospitalisation. Economic costs: direct and indirect rates. |
| Notes | * alpha 5%, beta 80% for 20% difference in binary outcome. |
ICD‐10 ‐ International Classification of Diseases DSM‐IV ‐ Diagnostic and Statistical Manual of Mental Disorders
3. Suggested design for a study.
| Methods | Allocation: randomised. Blindness: double blind. Duration: 18 months. Funding: n/a. Setting: multi‐centre. |
| Participants | Diagnosis: Diagnosis: psychosis with comorbid cannabis dependence (ICD‐10/DSM‐IV). N: 450.* Age: 16‐65. Sex: male/female. History: first psychotic episode or within 3 years following onset of non‐affective or affective psychosis. Included: outpatients and inpatients. Exclusion: learning disability; organic brain damage; unable to consent. |
| Interventions | 1. Clozapine: dose 150 mg bd. 2. Risperidone: dose 2 mg bd. 3. Haloperidol: dose 5 mg tds. |
| Outcomes | Short term and medium term: Mental state: Clinical Global Impression Scale. Global state: Clinical Global Impression Scale. Behaviour: cannabis consumption, consumption of other substances of abuse. General functioning: Global Assessment of Functioning (GAF). Leaving the study early: dropout rate. Satisfaction with treatment: recipient of care not satisfied with treatment; recipient of care average satisfaction score. Service outcomes: hospitalisation. Economic costs: direct and indirect rates. Economic costs: direct and indirect rates. |
| Notes | * alpha 5%, beta 80% for 20% difference in binary outcome. |
ICD‐10 ‐ International Classification of Diseases DSM‐IV ‐ Diagnostic and Statistical Manual of Mental Disorders
bd ‐ twice daily tds ‐ three times daily
What's new
| Date | Event | Description |
|---|---|---|
| 8 September 2014 | New citation required but conclusions have not changed | New additional data did not change overall conclusions of the review. |
| 26 February 2014 | New search has been performed | Results from 2013 update search added to review. Protocol changed and format of review updated to reflect new methodology. Seven new trials added to the review. |
History
Protocol first published: Issue 3, 2004 Review first published: Issue 3, 2008
| Date | Event | Description |
|---|---|---|
| 18 December 2008 | Amended | plain language summary added |
| 14 May 2008 | New citation required and conclusions have changed | Full review published |
| 19 March 2008 | Amended | Converted to new review format. |
| 22 August 2007 | New citation required and conclusions have changed | Substantive amendment |
Acknowledgements
Many thanks to Professor Clive Adams, Stephanie Sampson, Claire Irving, Farhad Shokraneh, Jun Xia and Angelique Bodart for all their help. Many thanks to Charles Bonsack for his thorough and efficient response. We would also like to thank and acknowledge Mahdi Moazzen for peer reviewing this version of the review and Hetal Mehta for helping with study selection for previous versions of this review.
Appendices
Appendix 1. Complete set of search terms
We searched the Cochrane Schizophrenia Group register (July 25, 2013) with the phrase:((*Marijuana* or *Marihuana* or *Cannabi* or *Hashish* or *Skunk* or *Hemp* or *Ganja* or *Bhang* or *Sinsemilla*):TI or (*Marijuana* or *Marihuana* or *Cannabi* or *Hashish* or *Skunk* or *Hemp* or *Ganja* or *Bhang* or *Sinsemilla*):AB) in REFERENCE.
This register is compiled by systematic searches of major databases, handsearches and conference proceedings
Appendix 2. Previous searches
1. Electronic searching We searched the Cochrane Schizophrenia Group register (April 2007) with the phrase:
[canna* or marijuana* or marihuana* in title, abstract and index terms of REFERENCE] or [cana* or marijuana* or marihuana* in interventions of STUDY]
This register is compiled by systematic searches of major databases, hand searches and conference proceedings (see Group Module).
2. Reference searching We inspected reference lists of identified studies for more trials.
3. Personal contact We contacted authors of relevant studies to enquire about other sources of relevant information.
Appendix 3. Previous methods and data collection
1. Study selection We (JR, HV) independently inspected all identified citations for relevance independently. Citations were checked again by HM. Where disagreement occurred we attempted to resolve this by discussion, where doubt still remained we acquired the full article for further inspection. We independently decided whether the selected studies met the review criteria. Again, where disagreement occurred attempts were made to resolve this through discussion; if doubt still remained we added these trials to the list of those awaiting assessment pending acquisition of further information.
2. Assessment of quality We assessed the methodological quality of included studies using the criteria described in the Cochrane Handbook (Higgins 2006), which is based on the degree of allocation concealment. Poor concealment has been associated with overestimation of treatment effect (Schulz 1995). Category A includes studies in which allocation has been randomised and concealment is explicit. Category B studies are those which have randomised allocation but in which concealment is not explicit. Category C studies are those in which allocation has neither been randomised nor concealed. Only trials that are stated to be randomised (categories A or B of the handbook) will be included in this review. The categories are defined below:
A. Low risk of bias (adequate allocation concealment) B. Moderate risk of bias (some doubt about the results) C. High risk of bias (inadequate allocation concealment).
When disputes arose as to which category a trial should be allocated, again we attempted resolution by discussion. When this was not possible we did not enter the data and the trial was added to the list of those awaiting assessment until further information could be obtained.
3. Data collection We (JR, HV) independently extracted data from selected trials. When disputes arose we attempted to resolve these by discussion. When this was not possible and further information was necessary to resolve the dilemma, we did not enter data and added the trial to the list of those awaiting assessment.
4. Data synthesis 4.1 Intention‐to‐treat analysis We excluded data from studies where more than 50% of participants in any group were lost to follow‐up (this did not include the outcome of 'leaving the study early'). In studies with less than 50% dropout rate, we assumed that participants had a poor outcome and were included in the analysis (intention‐to‐treat /ITT analysis); except for the event of death, or adverse events in studies using a placebo comparator group. We analysed the impact of including studies with high attrition rates (30‐50%) in a sensitivity analysis. If inclusion of data from this latter group resulted in a substantive change in the estimate of effect, we did not add their data to trials with less attrition, but presented them separately.
4.2 Binary data For binary outcomes (improved/not improved etc.) we calculated the relative risk (RR) and its 95% confidence interval (CI) based on a fixed‐effect model. Relative Risk is more intuitive (Boissel 1999) than odds ratios, and odds ratios tend to be interpreted as RR by clinicians (Deeks 2000). This misinterpretation then leads to an overestimate of the impression of the effect. When the overall results were significant and homogeneous we calculated the number needed to treat (NNT) and the number needed to harm (NNH).
Where possible, efforts were made to convert outcome measures to binary data. This can be done by identifying cut‐off points on rating scales and dividing participants accordingly into "clinically improved" or "not clinically improved". It was generally assumed that if there had been a 50% reduction in a scale‐derived score such as the Brief Psychiatric Rating Scale (BPRS, Overall 1988) or the Positive and Negative Syndrome Scale (PANSS, Kay 1986), this could be considered as a clinically significant response (Leucht 2005a, Leucht 2005b). It was recognised that for many people, especially those with chronic or severe illness, a less rigorous definition of important improvement (e.g. 25% on the BPRS) would be equally valid. If individual patient data were available, the 50% cut‐off was used for the definition in the case of non‐chronically ill people and 25% for those with chronic illness. If data based on these thresholds were not available, we used the primary cut‐off presented by the original authors.
4.3 Continuous data 4.3.1 Normal distribution Continuous data on outcomes in trials relevant to mental health issues are often not normally distributed. To avoid the pitfall of applying parametric tests to non‐parametric data we applied the following standards to continuous final value endpoint data before inclusion: (a) standard deviations and means were reported in the paper or were obtainable from the authors; (b) when a scale started from zero, the standard deviation, when multiplied by two, should be less than the mean (otherwise the mean is unlikely to be an appropriate measure of the centre of the distribution ‐ Altman 1996); In cases with data that are greater than the mean they were entered into 'Other data' table as skewed data. If a scale starts from a positive value (such as PANSS, which can have values from 30 to 210) the calculation described above in (b) should be modified to take the scale starting point into account. In these cases skewness is present if 2SD>(S‐Smin), where S is the mean score and Smin is the minimum score. We reported non‐normally distributed data (skewed) in the 'other data types' tables.
For change data (mean change from baseline on a rating scale) it is impossible to tell whether data are non‐normally distributed (skewed) or not, unless individual patient data are available. After consulting the ALLSTAT electronic statistics mailing list, we presented change data in RevMan graphs to summarise available information. In doing this, we assumed either that data were not skewed or that the analysis could cope with the unknown degree of skew.
4.3.2 Final endpoint value versus change data Where both final endpoint data and change data were available for the same outcome category, we only presented final endpoint data . We acknowledge that by doing this much of the published change data may be excluded, but argue that endpoint data are more clinically relevant and that if change data were to be presented along with endpoint data, it would be given undeserved equal prominence. Where studies reported only change data we contacted authors for endpoint figures.
4.3.3 Summary statistic For continuous outcomes we estimated a weighted mean difference (WMD) between groups based on a fixed effects model. Continuous data presented without use of summary statistics (i.e. mean, SD, SE) were not considered good evidence, though the existence of these data were noted in the text.
4.3.4 Conversion to a common metric To facilitate comparison between trials, we converted variables (such as days in hospital) that could be reported in different metrics (mean days per year, per week or per month) to a common metric (e.g. mean days per month).
4.4 Rating scales A wide range of instruments are available to measure mental health outcomes. These instruments vary in quality and many are not valid, and are known to be subject to bias in trials of treatments for schizophrenia (Marshall 2000). Therefore continuous data from rating scales were included only if the measuring instrument had been described in a peer‐reviewed journal.
4.5 Cluster trials Studies increasingly employ cluster randomisation (such as randomisation by clinician or practice) but analysis and pooling of clustered data poses problems. Firstly, authors often fail to account for intra class correlation in clustered studies, leading to a unit‐of‐analysis error (Divine 1992) whereby p values are spuriously low, confidence intervals unduly narrow and statistical significance overestimated. This causes Type I errors (Bland 1997, Gulliford 1999).
Where clustering was not accounted for in primary studies, we presented the data in a table, with a (*) symbol to indicate the presence of a probable unit of analysis error. In subsequent versions of this review we will seek to contact first authors of studies to obtain intra‐class correlation co‐efficient of their clustered data and to adjust for this using accepted methods (Gulliford 1999). Where clustering has been incorporated into the analysis of primary studies, we will also present these data as if from a non‐cluster randomised study, but adjusted for the clustering effect.
We have sought statistical advice and have been advised that the binary data as presented in a report should be divided by a design effect. This is calculated using the mean number of participants per cluster (m) and the intraclass correlation co‐efficient (ICC) [Design effect=1+(m‐1)*ICC] (Donner 2002). If the ICC was not reported it was assumed to be 0.1 (Ukoumunne 1999). If cluster studies had been appropriately analysed taking into account intra‐class correlation coefficients and relevant data documented in the report, we synthesised these with other studies using the generic inverse variance technique.
5. Investigation for heterogeneity Firstly, we considered all the included studies within any comparison to judge for clinical heterogeneity. Then we visually inspected graphs to investigate the possibility of statistical heterogeneity. We supplemented this by using primarily the I‐squared statistic. This provides an estimate of the percentage of variability due to heterogeneity rather than chance alone. Where the I‐squared estimate was greater than or equal to 50%, we interpreted this as indicating the presence of considerable levels of heterogeneity (Higgins 2003). Where heterogeneity was present, reasons for this were investigated. If it substantially altered the results, data were not summated, but presented separately and reasons for heterogeneity investigated.
6. Addressing publication bias We entered data from all included studies into a funnel graph (trial effect against trial size) in an attempt to investigate the likelihood of overt publication bias (Egger 1997).
7. Sensitivity analyses We analysed the effect of including studies with high attrition rates in a sensitivity analysis.
8. General Where possible, we entered data in such a way that the area to the left of the line of no effect indicated a favourable outcome for cannabis/cannabinoids.
Appendix 4. Previous background
The cannabis plant (Cannabis sativa L.) grows in temperate and tropical areas. Herbal cannabis consists of the dried flowering tops and leaves. Cannabis resin is a compressed solid made from the resinous parts of the plant, and cannabis oil (hash) is a solvent extract of cannabis. Cannabis is usually smoked but occasionally ingested in foodstuffs. Cannabinoids are present in the flowers, leaves, seeds and stalks of cannabis sativa, otherwise known as the hemp plant (Figure 1). Cannabinol was first isolated in 1895. An anonymous British physician working in British Guyana in 1893 (Tunving 1985) indicated that the use of cannabis might be a cause of mental illness. Dr Warnock in 1895, from his experience with inmates of the Cairo asylum in Egypt (Warnock 1903), also related abuse of hashish to mental illness and wondered how those outside the asylum could enjoy the drug without becoming ill. Concerns about its psychoactive properties date from 1928, when Egyptian and South African doctors stated that heavy use could cause mental disturbances (Berridge 2004).
Schizophrenia‐like experiences have been described in cannabis smokers (Talbot 1969) and there have been anecdotal sporadic reports of cannabis‐linked psychosis (Varma 1972, Chopra 1974) including the earliest reported British case of psychosis associated with cannabis abuse (Davison 1972). The diagnostic label of "cannabis psychosis" is less fashionable than it once was. It tended to be attached to young Afro‐Caribbean patients (McGovern 1987), a practice which was rightly disputed (Carney 1984, Littlewood 1988). However, the relationship between cannabis and schizophrenia remains controversial.
In general, substance misuse has been reported to be the most prevalent comorbid condition associated with schizophrenia (Regier 1990) and cannabis is the most frequently used substance (Hall 1999, Farrell 1998). The reported rates of cannabis abuse among people with schizophrenia vary widely both within and between different countries, but are consistently higher than in other people with mental illnesses or in the general population (Smith 1994). The proportion of people with schizophrenia who use cannabis varies, but surveys commonly find prevalence rates to be about 40% ( Table 5).
Cannabis contains the psychoactive constituent cannabinoid delta‐9‐tetrahydrocannabinol (THC). Concerns have been raised that THC concentrations in cannabis are higher than in the past, and therefore today cannabis usage poses a greater risk to health. Cannabis produced from intensive indoor cultivation methods has a higher concentration of THC than imported sources, which typically are not intensively cultivated. The higher concentrations have been attributed to the use of specific seed strains from the female plant which are grown in artificial light and prevented from undergoing fertilization or seed production. However, the majority of cannabis used in the UK originates from North Africa and the available data does not indicate an upward trend in potency from imported cannabis into Europe (EMCDDA).
Cannabis as precipitant A longitudinal follow‐up study of Swedish conscripts Andreasson 1987 has shown that the relative risk for schizophrenia was up to six times greater in people who had reported high cannabis use (on more than 50 occasions) compared with non users, and cannabis was felt to be an independent risk factor for schizophrenia. Similar results were obtained in studies at five years post‐conscription, to exclude the prodromal cases (Zammit 2002). This was replicated by Van Os 2002, and Arseneault 2002 in separate studies. A WHO study (Jablensky 1992) has shown that the use of cannabis early in the onset of schizophrenia is a predictor of a poor outcome. Another theory is that the continuous heavy use of cannabis can induce a psychotic illness, which is distinct from schizophrenia (Nunez 2002). Cannabis as bidirectional perpetuant In general cannabis use is felt to have a negative effect on the course and prognosis of the illness (Negrete 1986, Linszman 1994). A number of hypotheses have been put forward regarding the association between cannabis and schizophrenia. A recently published study (Hides 2006) examined the influence of cannabis use on psychotic relapse and the influence of psychotic symptom severity on relapse in cannabis use in the six months following hospital admission. They found that a higher frequency of cannabis use was predictive of psychotic relapse, after controlling for medication adherence, other substance use and duration of untreated psychosis. Also, an increase in psychotic symptoms was predictive of relapse to cannabis use. They concluded that the relationship between cannabis and psychosis might be "bidirectional".
Self‐medication An alternative theory is that cannabis is used by people with distressing psychotic symptoms as a form of self‐medication (Dixon 1990), or to reduce the unpleasant adverse effects caused by antipsychotic drug treatment. It has also been proposed that the negative symptoms of schizophrenia (affective flattening, poor volition, poverty of thought, social withdrawal) may be improved by use of cannabis.
Technical background The major active principle in all cannabis products is delta‐9‐tetrahydrocannabinol (THC) (Figure 2) It was first identified in 1964 (Gaoni 1964) and this compound seems responsible for most of the psychological effects of marijuana (Isbell 1967). As cannabis or the cannabinoids lead to dopamine release (Tanda 1997) it would seem plausible that its use could precipitate or exacerbate illness.
Cannabinoids are a group of terpenophenolic compounds present in cannabis. Cannabinoids exert their effect through specific endogenous cannabinoid receptors. THC exerts its effect by interaction with neuronal (CB1) receptors which are found in the cerebral cortex, limbic areas, basal ganglia, thalamus and brain stem. Within the brain, THC and other cannabinoids are differentially distributed with high concentrations in cortical, limbic, sensory and motor areas. CB2 receptors have also been identified in macrophages and other immune cells. The cannabinoid system of the brain is modulated by endogenous cannabinoids which include anandamide and palmitoylethanolamide. Concentrations of endogenous cannabinoids have been found to be significantly higher in the cerebrospinal fluid of people with schizophrenia than in non‐schizophrenic controls (Leweke 1999).
THC produces a euphoric effect, but it can cause perceptual alterations, impaired short term memory and attention, anxiety and panic attacks (Ashton 2001, Thomas 1996), and may lead to a withdrawal (Kouri 1999) or dependence syndrome (Stephens 1993). In high doses, visual and auditory hallucinations, delusions and thought disorder may result (Lishman 1998).
Data and analyses
Comparison 1. CANNABIS REDUCTION: ADJUNCT PSYCHOLOGICAL THERAPY versus TREATMENT AS USUAL.
| Outcome or subgroup title | No. of studies | No. of participants | Statistical method | Effect size |
|---|---|---|---|---|
| 1 Behaviour: Cannabis use: 1. Frequency of use (ASI, group‐based therapy, high = bad) | 1 | Mean Difference (IV, Fixed, 95% CI) | Subtotals only | |
| 1.1 in past 30 days ‐ by medium term | 1 | 54 | Mean Difference (IV, Fixed, 95% CI) | ‐0.10 [‐2.44, 2.24] |
| 2 Behaviour: Cannabis use: 2. Number of joints of cannabis in preceding month (skewed data) | Other data | No numeric data | ||
| 2.1 medium term | Other data | No numeric data | ||
| 2.2 long term | Other data | No numeric data | ||
| 3 Behaviour: Cannabis use: 3. Number of days abstinent /last month (skewed data) | Other data | No numeric data | ||
| 3.1 medium term ‐ 3 months | Other data | No numeric data | ||
| 3.2 medium term ‐ 6 months | Other data | No numeric data | ||
| 3.3 long term ‐ 12 months | Other data | No numeric data | ||
| 4 Behaviour: Cannabis use: 4. Number of days of binge use (skewed data) | Other data | No numeric data | ||
| 4.1 medium term ‐ 3 months | Other data | No numeric data | ||
| 4.2 medium term ‐ 6 months | Other data | No numeric data | ||
| 4.3 long term ‐ 12 months | Other data | No numeric data | ||
| 5 Mental state: 1. Average depressive symptom score (CDSS, skewed data) | Other data | No numeric data | ||
| 5.1 medium term | Other data | No numeric data | ||
| 5.2 long term | Other data | No numeric data | ||
| 6 Mental state: 2. Average insight score (Birchwood Insight Scale, high score = better) | 1 | Mean Difference (IV, Fixed, 95% CI) | Subtotals only | |
| 6.1 medium term | 1 | 58 | Mean Difference (IV, Fixed, 95% CI) | 1.10 [‐0.18, 2.38] |
| 6.2 long term | 1 | 46 | Mean Difference (IV, Fixed, 95% CI) | 0.40 [‐0.88, 1.68] |
| 7 Mental state: 3. Average negative symptom score (PANSS, high score = poor) | 1 | 186 | Mean Difference (IV, Fixed, 95% CI) | ‐0.40 [‐1.50, 0.70] |
| 7.1 medium term ‐ 3 months | 1 | 62 | Mean Difference (IV, Fixed, 95% CI) | ‐0.10 [‐2.06, 1.86] |
| 7.2 medium term ‐ 6 months | 1 | 62 | Mean Difference (IV, Fixed, 95% CI) | 0.0 [‐1.80, 1.80] |
| 7.3 long term ‐ 12 months | 1 | 62 | Mean Difference (IV, Fixed, 95% CI) | ‐1.20 [‐3.19, 0.79] |
| 8 Mental state: 4a. Average positive symptom score (SAPS, skewed data) | Other data | No numeric data | ||
| 8.1 medium term | Other data | No numeric data | ||
| 8.2 long term | Other data | No numeric data | ||
| 9 Mental state: 4b. Average positive symptom score (SANS, skewed data) | Other data | No numeric data | ||
| 9.1 medium term | Other data | No numeric data | ||
| 9.2 long term | Other data | No numeric data | ||
| 10 Mental state: 4c. Average positive symptom score (PANSS, high score = poor) | 1 | Mean Difference (IV, Fixed, 95% CI) | Subtotals only | |
| 10.1 medium term ‐ 3 months | 1 | 62 | Mean Difference (IV, Fixed, 95% CI) | ‐0.30 [‐2.55, 1.95] |
| 10.2 medium term ‐ 6 months | 1 | 62 | Mean Difference (IV, Fixed, 95% CI) | ‐0.10 [‐2.58, 2.38] |
| 10.3 long term ‐ 12 months | 1 | 62 | Mean Difference (IV, Fixed, 95% CI) | ‐1.20 [‐3.32, 0.92] |
| 11 General functioning: 1. Subjective quality of life (WHO QOL, brief, high score = better) | 1 | Mean Difference (IV, Fixed, 95% CI) | Subtotals only | |
| 11.1 medium term | 1 | 49 | Mean Difference (IV, Fixed, 95% CI) | 0.90 [‐1.15, 2.95] |
| 11.2 long term | 1 | 48 | Mean Difference (IV, Fixed, 95% CI) | 1.5 [‐0.40, 3.40] |
| 12 General functioning: 3. Global functioning (GAF, high score = better) | 2 | Mean Difference (IV, Fixed, 95% CI) | Subtotals only | |
| 12.1 medium term ‐ 3 months | 2 | 120 | Mean Difference (IV, Fixed, 95% CI) | ‐0.11 [‐2.57, 2.36] |
| 12.2 medium term 6 months | 1 | 62 | Mean Difference (IV, Fixed, 95% CI) | ‐1.0 [‐4.40, 2.40] |
| 12.3 long term | 2 | 109 | Mean Difference (IV, Fixed, 95% CI) | 1.88 [‐1.09, 4.85] |
| 13 General functioning: 2. Attitude to treatment (DAI, medium term, skewed data) | Other data | No numeric data | ||
| 13.1 medium term | Other data | No numeric data | ||
| 14 General functioning: 4. Global functioning (SOFAS, high score = better) | 1 | Mean Difference (IV, Fixed, 95% CI) | Subtotals only | |
| 14.1 medium term ‐ 3 months | 1 | 62 | Mean Difference (IV, Fixed, 95% CI) | 0.10 [‐3.02, 3.22] |
| 14.2 medium term 6 months | 1 | 62 | Mean Difference (IV, Fixed, 95% CI) | ‐0.10 [‐3.63, 3.43] |
| 14.3 long term | 1 | 62 | Mean Difference (IV, Fixed, 95% CI) | 2.70 [‐1.08, 6.48] |
Comparison 2. CANNABIS REDUCTION: PSYCHOLOGICAL THERAPY (SPECIFICALLY ABOUT CANNABIS AND PSYCHOSIS) versus NON‐SPECIFIC PSYCHOEDUCATION.
| Outcome or subgroup title | No. of studies | No. of participants | Statistical method | Effect size |
|---|---|---|---|---|
| 1 Behaviour: Cannabis use: 1. Used cannabis in last 4 weeks | 1 | Risk Ratio (M‐H, Fixed, 95% CI) | Subtotals only | |
| 1.1 by 3 months ‐ end of treatment | 1 | 47 | Risk Ratio (M‐H, Fixed, 95% CI) | 1.04 [0.62, 1.74] |
| 1.2 by 9 months ‐ 6 months after end of treatment | 1 | 47 | Risk Ratio (M‐H, Fixed, 95% CI) | 1.30 [0.79, 2.15] |
| 2 Behaviour: Cannabis use: 2. Percentage days used cannabis in last 4 weeks (skewed data) | Other data | No numeric data | ||
| 2.1 by 3 months ‐ end of treatment | Other data | No numeric data | ||
| 2.2 by 9 months ‐ 6 months after end of treatment | Other data | No numeric data | ||
| 3 Mental state: 1. Average overall score (BPRS‐E total endpoint, high score = poor) | 1 | Mean Difference (IV, Fixed, 95% CI) | Subtotals only | |
| 3.1 by 3 months ‐ end of treatment | 1 | 47 | Mean Difference (IV, Fixed, 95% CI) | 3.60 [‐5.61, 12.81] |
| 3.2 by 9 months ‐ 6 months after end of treatment | 1 | 47 | Mean Difference (IV, Fixed, 95% CI) | ‐0.80 [‐9.07, 7.47] |
| 4 Mental state: 2. Average overall score (BPRS‐PS total endpoint, skewed data) | Other data | No numeric data | ||
| 4.1 by 3 months ‐ end of treatment | Other data | No numeric data | ||
| 4.2 by 9 months ‐ 6 months after end of treatment | Other data | No numeric data | ||
| 5 Mental state: 3. Average depression score (BDI‐SF total endpoint, skewed data) | Other data | No numeric data | ||
| 5.1 by 3 months ‐ end of treatment | Other data | No numeric data | ||
| 5.2 by 9 months ‐ 6 months after end of treatment | Other data | No numeric data | ||
| 6 Mental state: 4. Average negative symptom score (SANS endpoint, skewed data) | Other data | No numeric data | ||
| 6.1 by 3 months ‐ end of treatment | Other data | No numeric data | ||
| 6.2 by 9 months ‐ 6 months after end of treatment | Other data | No numeric data | ||
| 7 Global state: Average overall score (KAPQ total endpoint, high score = good) | 1 | Mean Difference (IV, Fixed, 95% CI) | Subtotals only | |
| 7.1 by 3 months ‐ end of treatment | 1 | 47 | Mean Difference (IV, Fixed, 95% CI) | ‐0.80 [‐3.38, 1.78] |
| 7.2 by 9 months ‐ 6 months after end of treatment | 1 | 47 | Mean Difference (IV, Fixed, 95% CI) | ‐0.90 [‐3.22, 1.42] |
| 8 General functioning: Average score (SOFAS total endpoint, high score = good) | 1 | Mean Difference (IV, Fixed, 95% CI) | Subtotals only | |
| 8.1 by 3 months ‐ end of treatment | 1 | 47 | Mean Difference (IV, Fixed, 95% CI) | ‐0.80 [‐9.95, 8.35] |
| 8.2 by 9 months ‐ 6 months after end of treatment | 1 | 47 | Mean Difference (IV, Fixed, 95% CI) | ‐4.70 [‐14.52, 5.12] |
Comparison 3. CANNABIS REDUCTION: ANTIPSYCHOTIC 'A' versus ANTIPSYCHOTIC 'B'.
| Outcome or subgroup title | No. of studies | No. of participants | Statistical method | Effect size |
|---|---|---|---|---|
| 1 Behaviour: Cannabis use: 1. Traces of cannabis breakdown products in urine (number of patients positive above threshold level ‐ 100 nanograms ‐ olanzapine versus risperidone) | 1 | 16 | Risk Ratio (M‐H, Fixed, 95% CI) | 1.8 [0.52, 6.22] |
| 1.1 olanzapine vs risperidone | 1 | 16 | Risk Ratio (M‐H, Fixed, 95% CI) | 1.8 [0.52, 6.22] |
| 2 Behaviour: Cannabis use: 2. As defined in each study (skewed data) | Other data | No numeric data | ||
| 2.1 average score per week (Marijuana Craving Report ‐ olanzapine versus risperidone | Other data | No numeric data | ||
| 2.2 average self‐report scores of joints per week (short term) ‐ olanzapine versus risperidone | Other data | No numeric data | ||
| 2.3 average intensity of cannabis use in joints per week ‐ clozapine versus other antipsychotics | Other data | No numeric data | ||
| 3 Behaviour: Cannabis use: 3. Average score per week (Marijuana Craving Report skewed data ‐ olanzapine versus risperidone) | Other data | No numeric data | ||
| 4 Mental state: Average score (OCDUS, short term, high = poor) ‐ olanzapine versus risperdione | 1 | 41 | Mean Difference (IV, Fixed, 95% CI) | ‐1.30 [‐6.11, 3.51] |
| 4.1 olanzapine vs risperidone | 1 | 41 | Mean Difference (IV, Fixed, 95% CI) | ‐1.30 [‐6.11, 3.51] |
| 5 Adverse effects: 1. Anticholinergic ‐ various (clozapine vs other antipsychotic) | 1 | Risk Ratio (M‐H, Fixed, 95% CI) | Subtotals only | |
| 5.1 constipation | 1 | 30 | Risk Ratio (M‐H, Fixed, 95% CI) | 9.0 [0.53, 153.79] |
| 5.2 nasal congestion | 1 | 31 | Risk Ratio (M‐H, Fixed, 95% CI) | 0.21 [0.01, 4.10] |
| 5.3 salivation ‐ too much | 1 | 31 | Risk Ratio (M‐H, Fixed, 95% CI) | 22.31 [1.42, 350.31] |
| 5.4 salivation ‐ too little | 1 | 31 | Risk Ratio (M‐H, Fixed, 95% CI) | 1.07 [0.17, 6.64] |
| 5.5 urinary incontinence | 1 | 31 | Risk Ratio (M‐H, Fixed, 95% CI) | 5.31 [0.28, 102.38] |
| 6 Adverse effects: 2. Cardiac ‐ various (clozapine vs other antipsychotic) | 1 | Risk Ratio (M‐H, Fixed, 95% CI) | Subtotals only | |
| 6.1 hypertension | 1 | 30 | Risk Ratio (M‐H, Fixed, 95% CI) | 1.0 [0.16, 6.20] |
| 7 Adverse effects: 3. Central nervous system / higher functions ‐ various (clozapine vs other antipsychotic) | 1 | Risk Ratio (M‐H, Fixed, 95% CI) | Subtotals only | |
| 7.1 agitation ‐ increased | 1 | 30 | Risk Ratio (M‐H, Fixed, 95% CI) | 1.0 [0.07, 14.55] |
| 7.2 depression | 1 | 30 | Risk Ratio (M‐H, Fixed, 95% CI) | 2.0 [0.20, 19.78] |
| 7.3 dizziness | 1 | 31 | Risk Ratio (M‐H, Fixed, 95% CI) | 5.33 [0.70, 40.54] |
| 7.4 dreams ‐ unusual dream activity | 1 | 31 | Risk Ratio (M‐H, Fixed, 95% CI) | 0.21 [0.01, 4.10] |
| 7.5 fatigue | 1 | 31 | Risk Ratio (M‐H, Fixed, 95% CI) | 7.44 [0.42, 132.95] |
| 7.6 irritability | 1 | 31 | Risk Ratio (M‐H, Fixed, 95% CI) | 1.07 [0.07, 15.57] |
| 7.7 libido ‐ decreased | 1 | 31 | Risk Ratio (M‐H, Fixed, 95% CI) | 1.07 [0.07, 15.57] |
| 7.8 sleep ‐ too much | 1 | 31 | Risk Ratio (M‐H, Fixed, 95% CI) | 4.8 [1.23, 18.71] |
| 7.9 sleep‐ insomnia | 1 | 31 | Risk Ratio (M‐H, Fixed, 95% CI) | 2.13 [0.22, 21.17] |
| 7.10 suicide attempt | 1 | 31 | Risk Ratio (M‐H, Fixed, 95% CI) | 1.07 [0.07, 15.57] |
| 8 Adverse effects: 4. Gastrointestinal ‐ various (clozapine vs other antipsychotic) | 1 | Risk Ratio (M‐H, Fixed, 95% CI) | Subtotals only | |
| 8.1 nausea | 1 | 31 | Risk Ratio (M‐H, Fixed, 95% CI) | 2.13 [0.22, 21.17] |
| 8.2 vomiting | 1 | 31 | Risk Ratio (M‐H, Fixed, 95% CI) | 1.07 [0.25, 4.49] |
| 9 Adverse effects: 5. Metabolic ‐ weight gain (clozapine vs other antipsychotic) | 1 | Risk Ratio (M‐H, Fixed, 95% CI) | Subtotals only | |
| 10 Adverse effects: 6a. Movement disorders ‐ various (clozapine vs other antipsychotic) | 1 | Risk Ratio (M‐H, Fixed, 95% CI) | Subtotals only | |
| 10.1 agitation ‐ increased | 1 | 30 | Risk Ratio (M‐H, Fixed, 95% CI) | 1.0 [0.07, 14.55] |
| 10.2 akathisia | 1 | 31 | Risk Ratio (M‐H, Fixed, 95% CI) | 1.07 [0.07, 15.57] |
| 10.3 muscle spasms | 1 | 31 | Risk Ratio (M‐H, Fixed, 95% CI) | 5.31 [0.28, 102.38] |
| 11 Adverse events: 6b. Movement disorders ‐ average score (Simpson scale, high score = poor ‐ olanzapine versus risperidone) | 1 | Mean Difference (IV, Fixed, 95% CI) | Subtotals only | |
| 11.1 olanzapine vs risperidone | 1 | 16 | Mean Difference (IV, Fixed, 95% CI) | 0.08 [‐1.06, 1.22] |
| 12 Adverse effects: 7. Others ‐ various (clozapine vs other antipsychotic) | 1 | Risk Ratio (M‐H, Fixed, 95% CI) | Subtotals only | |
| 12.1 chest pain ‐ non‐cardiac | 1 | 31 | Risk Ratio (M‐H, Fixed, 95% CI) | 0.53 [0.05, 5.29] |
| 12.2 flu‐like symptoms | 1 | 31 | Risk Ratio (M‐H, Fixed, 95% CI) | 0.21 [0.01, 4.10] |
| 12.3 headache | 1 | 31 | Risk Ratio (M‐H, Fixed, 95% CI) | 2.13 [0.22, 21.17] |
| 13 Leaving the study early: 1. Number leaving (olanzapine vs risperidone) | 1 | Risk Ratio (M‐H, Fixed, 95% CI) | Subtotals only | |
| 13.1 admission | 1 | 28 | Risk Ratio (M‐H, Fixed, 95% CI) | 1.0 [0.07, 14.45] |
| 13.2 any | 1 | 28 | Risk Ratio (M‐H, Fixed, 95% CI) | 0.5 [0.19, 1.29] |
| 13.3 intolerable adverse effects | 1 | 28 | Risk Ratio (M‐H, Fixed, 95% CI) | 0.0 [0.0, 0.0] |
| 13.4 not interested | 1 | 28 | Risk Ratio (M‐H, Fixed, 95% CI) | 0.43 [0.14, 1.33] |
| 14 Leaving the study early: 2. Weeks in treatment (olanzapine vs risperidone) | 1 | 28 | Mean Difference (IV, Fixed, 95% CI) | 0.0 [‐3.35, 3.35] |
| 14.1 olanzapine vs risperidone | 1 | 28 | Mean Difference (IV, Fixed, 95% CI) | 0.0 [‐3.35, 3.35] |
Comparison 4. CANNABINOID AS TREATMENT: CANNABIDIOL versus AMISULPRIDE.
| Outcome or subgroup title | No. of studies | No. of participants | Statistical method | Effect size |
|---|---|---|---|---|
| 1 Mental state: 1a. Average overall score (BPRS, total endpoint, high score = poor) | 1 | Mean Difference (IV, Fixed, 95% CI) | Subtotals only | |
| 1.1 Day 7 ‐ short term | 1 | 39 | Mean Difference (IV, Fixed, 95% CI) | ‐1.5 [‐6.54, 3.54] |
| 1.2 Day 14 ‐ short term | 1 | 39 | Mean Difference (IV, Fixed, 95% CI) | 1.80 [‐4.61, 8.21] |
| 1.3 Day 21 ‐ short term | 1 | 34 | Mean Difference (IV, Fixed, 95% CI) | 4.20 [‐4.24, 12.64] |
| 1.4 Day 28 ‐ short term | 1 | 35 | Mean Difference (IV, Fixed, 95% CI) | 1.10 [‐8.18, 10.38] |
| 2 Mental state: 1b. Average overall score (PANSS, total endpoint, high score = poor) | 1 | Mean Difference (IV, Fixed, 95% CI) | Subtotals only | |
| 2.1 day 14 (short term) | 1 | 39 | Mean Difference (IV, Fixed, 95% CI) | 0.0 [‐10.10, 10.10] |
| 2.2 day 28 (short term) | 1 | 35 | Mean Difference (IV, Fixed, 95% CI) | 0.40 [‐13.42, 14.22] |
| 3 Mental state: 2. Average negative symptom score (PANSS, high score = poor) | 1 | Mean Difference (IV, Fixed, 95% CI) | Subtotals only | |
| 3.1 Day 14 ‐ short term | 1 | 39 | Mean Difference (IV, Fixed, 95% CI) | 1.20 [‐2.13, 4.53] |
| 3.2 Day 28 ‐ short term | 1 | 35 | Mean Difference (IV, Fixed, 95% CI) | 2.70 [‐0.92, 6.32] |
| 4 Mental state: 3. Average positive symptom score (PANSS, high score = poor) | 1 | Mean Difference (IV, Fixed, 95% CI) | Subtotals only | |
| 4.1 Day 14 ‐ short term | 1 | 39 | Mean Difference (IV, Fixed, 95% CI) | 1.20 [‐1.85, 4.25] |
| 4.2 Day 28 ‐ short term | 1 | 35 | Mean Difference (IV, Fixed, 95% CI) | 0.60 [‐3.92, 5.12] |
| 5 Adverse effects: 1. Endocrine ‐ prolactin (μg/l, short term ‐ skewed data) | Other data | No numeric data | ||
| 6 Adverse effects: 2. Metabolic ‐ weight gain (kg, short term ‐ skewed data) | Other data | No numeric data | ||
| 7 Adverse effects: 3. Movement disorders ‐ change in extrapyramidal symptoms (EPS, short term ‐ skewed data) | Other data | No numeric data |
Characteristics of studies
Characteristics of included studies [ordered by study ID]
Akerele 2007.
| Methods | Allocation: randomised.
Blinding: double blind.
Duration: 14 weeks.
Setting: Harlem Hospital, New York, USA. Design: randomised controlled trial, parallel. Funding: National Institute on Drug Abuse, Brain and Behaviour Research Foundation, Eli Lily. |
|
| Participants | Diagnosis: schizophrenia/schizoaffective disorder plus current co‐morbid substance use problems (DSM‐IV).*
N = 28.
Age: mean ˜36 years (SD ˜10). Sex: 25 M, 3 F. Ethnicity: African American (n = 15), White (n = 4), Hispanic (n = 9). History: not stated. Included: met DSM‐IV criteria for schizophrenia or schizoaffective disorder; met DSM‐IV criteria for current cocaine and/or marijuana abuse or dependence and were using marijuana at least twice/week, or cocaine at least once/week on average during past 3 months prior to enrolment in study. Excluded: i. pregnant; ii. currently physiologically dependent on alcohol or other drugs; iii. unstable psychiatric symptomatology; iv. unstable medical condition; v. enzyme function tests > 3 times upper limit of normal; vi. history of seizures or neuroleptic malignant syndrome; vii. committed violent crime within past 2 years; viii. not responded to either olanzapine or risperidone in past; ix. had score > 30 on positive and negative subscales of PANSS. Consent: written informed consent. |
|
| Interventions | 1. Olanzapine: dose 5‐20 mg/day + 3 visits per week by specialist worker, n = 14. 2. Risperidone: dose 3‐9 mg/day + 3 visits per week by specialist worker, n = 14. |
|
| Outcomes | Behaviour: Cannabis use ‐ Marijuana Craving Report, cannabis breakdown products in urine (week 1‐6, weekly measurement, proportion of positive patients ‐ above 100 nanograms/mL). Leaving the study early: time in treatment, reason for attrition. Adverse effects:Movement disorders: Simpson scale (week 6). Unable to use ‐ Drug usage: self‐report ‐ any drug use (not reported), days of use (no SD), Cocaine Craving Report (not relevant). Quantitative Substance Use Inventory (no data, not validated scale). Mental state: CGI, HAM‐D, PANSS (no scores reported). Compliance with medication: self‐report, riboflavin fluorescence (reported as % of dose omitted, not by person). Adverse effects: AIMS (not reported by group). Leaving the study early: time to dropout (not reported). |
|
| Notes | *Highly screened: complete history and physical examinations, electrocardiogram, laboratory tests (haematology, blood chemistry ‐ including liver function, and blood pregnancy test for women); further data were requested, but none received. | |
| Risk of bias | ||
| Bias | Authors' judgement | Support for judgement |
| Random sequence generation (selection bias) | Low risk | "Not stratified, 50:50 uniform distribution of groups of 4" ‐ unclear exactly how randomised. |
| Allocation concealment (selection bias) | Unclear risk | Not mentioned. |
| Blinding (performance bias and detection bias) All outcomes | Unclear risk | Risperidone and olanzapine in gelatin capsules containing riboflavin ‐ unclear if successful ‐ not tested. |
| Blinding of participants and personnel (performance bias) All outcomes | Unclear risk | Unclear if successful ‐ not tested. |
| Blinding of outcome assessment (detection bias) All outcomes | Unclear risk | Unclear if successful ‐ not tested. |
| Incomplete outcome data (attrition bias) All outcomes | Unclear risk | No indication in report how managed losses to follow‐up. |
| Selective reporting (reporting bias) | High risk | Some outcomes reported by group, others not. |
| Other bias | Unclear risk | Funded by company with pecuniary interest in result (Eli Lilly ‐ producers of olanzapine). |
Bonsack 2011.
| Methods | Allocation: randomised. Blinding: double blind. Duration: 12 months. Setting: University Department of Psychiatry, Lausanne, Switzerland. Design: randomised controlled trial, parallel. Funding: Swiss Research National. |
|
| Participants | Diagnosis: DSM IV schizophrenia, schizophreniform disorder, bipolar disorder with psychotic features, schizoaffective disorder, psychosis not otherwise specified. N = 62. Age: range 18 – 35 years; mean ˜ 23 years. Sex: 54 M, 8 F. Ethnicity: not stated. History: smoked at least 3 joints/week during the month preceding inclusion. Inclusion: psychosis as specified under diagnosis. Exclusion: organic brain disease, poor command of French, current alcohol or any other substance dependence (except nicotine and alcohol). Consent: Informed consent obtained. |
|
| Interventions | 1. Treatment as usual (TAU), TAU consisted of psychiatric management by a clinical team consisting of a psychiatrist and a nurse/clinical psychologist, with access to community or inpatient treatment. Treatment included medication, regular visits and rehabilitation, and standard psychoeducation on substance abuse n = 32. 2. Motivational Intervention (MI) + TAU: 4‐6 MI sessions; first session consisted of 60 minutes, followed by a feedback session of 45‐60 minutes within the next week. 2‐4 booster sessions of 30‐45 minutes took place during the first 6 months, these sessions explored the connection between cannabis use and psychosis n = 30. |
|
| Outcomes | Mental State: PANSS score: positive symptoms (3, 6, 12 months); negative symptoms (3, 6, 12 months). Behaviour: Cannabis use: Number of days abstinent last month (3, 6, 12 months); Number of days binge use (3, 6, 12 months). General functioning: GAF (3, 6, 12 months); SOFAS (3, 6, 12 months). Unable to use ‐ Readiness to change (data not available). |
|
| Notes | Further data were requested, full data and response to queries was received. | |
| Risk of bias | ||
| Bias | Authors' judgement | Support for judgement |
| Random sequence generation (selection bias) | Low risk | Computer‐generated allocation. |
| Allocation concealment (selection bias) | Low risk | Closed envelopes, kept by member of administrative staff. |
| Blinding (performance bias and detection bias) All outcomes | Low risk | Assessments by independent parties, participants blind. |
| Blinding of participants and personnel (performance bias) All outcomes | Low risk | Assessments by independent parties, participants blind. |
| Blinding of outcome assessment (detection bias) All outcomes | Low risk | Assessments by independent parties, participants blind. |
| Incomplete outcome data (attrition bias) All outcomes | Low risk | Missing data were handled using last observation carried forward. |
| Selective reporting (reporting bias) | Unclear risk | Not specified. |
| Other bias | Unclear risk | Not specified. |
Brunette 2011.
| Methods | Allocation: randomised. Blinding: single blind, raters blinded. Duration: 12 weeks. Setting: outpatients, New Hampshire and South Carolina, USA. Design: randomised controlled trial, parallel. Funding: National Institute on Drug Abuse. |
|
| Participants | Diagnosis: Manual (DSM IV) diagnosis of schizophrenia or schizoaffective disorder and current cannabis use disorder. N = 31. Age: range 18 – 65 years; mean ˜ 36 years. Sex: 24 M, 7 F. Ethnicty: not stated. History: cannabis use on at least 5 days over the 3 weeks prior to screening. Inclusion: outpatient status prior to randomisation and current treatment with antipsychotic medication other than clozapine. Exclusion: patients taking medication with possible effects on alcohol use; patients with active, serious medical illness, suicidality, or severe psychiatric instability. Patients for whom clozapine was contraindicated were also excluded. Consent: not stated. |
|
| Interventions | 1. Clozapine; 400 mg daily (titrated over 4 weeks), n = 15. 2. Continue with current antipsychotic medication, n = 16. |
|
| Outcomes | Behaviour: Cannabis use: Intensity of cannabis use (joints per week) (week 0‐12, weekly measurement).
Adverse effects: measured adverse events (% of patients reporting adverse events over 12 weeks). Unable to use ‐ urine drug (data not available); Substance abuse treatment scale (data not available); motivation to stop cannabis contemplation ladder scale (data not available); BPRS (data not available); SANS (data not available); SAS (data not available); AIMS(data not available); Barnes Akathsia Rating Scale (data not available). |
|
| Notes | Further data were requested, but none received. | |
| Risk of bias | ||
| Bias | Authors' judgement | Support for judgement |
| Random sequence generation (selection bias) | Unclear risk | Block randomisation by site, yet method unclear. |
| Allocation concealment (selection bias) | Unclear risk | Not specified. |
| Blinding (performance bias and detection bias) All outcomes | High risk | Clinicians and participants not blinded. |
| Blinding of participants and personnel (performance bias) All outcomes | High risk | Clinicians and participants not blinded. |
| Blinding of outcome assessment (detection bias) All outcomes | Low risk | Raters making assessments were blinded. |
| Incomplete outcome data (attrition bias) All outcomes | Unclear risk | Not specified. |
| Selective reporting (reporting bias) | Unclear risk | Not specified. |
| Other bias | Low risk | None of the authors report any financial relationships with commercial interest with regard to the present study. |
Edwards 2006.
| Methods | Allocation: randomised, computer‐generated, placed in sealed envelopes.
Blinding: single; attempts to maintain rater blindness included use of separate rooms and admin procedures for staff.
Duration: 3 months intervention phase followed by 6 months of follow‐up.
Setting: Early Psychosis Prevention and Intervention Centre (EPPIC) (youth mental health service), Melbourne, Australia. Design: randomised controlled trial, parallel. Funding: Victorian Government Department of Human Services. |
|
| Participants | Diagnosis: first episode psychosis (DSM‐IV).
N = 47. Age: 15‐29 years; mean ˜ 20.9 years. Sex: 34 M, 13 F. Ethnicity: not stated. History: patients continuing to use cannabis after initial treatment for first episode of psychosis. Inclusion criteria: DSM‐IV diagnosis of a psychotic disorder (i.e. schizophrenia, schizophreniform, schizoaffective, delusional disorder, bipolar disorder, major depressive disorder with psychotic features, psychosis not otherwise stated, brief reactive psychosis. Exclusion criteria: only participants with at least 10 weeks continuous cannabis usage prior to study were eligible for study inclusion. Consent: Not stated. |
|
| Interventions | 1. "Cannabis and Psychosis Therapy": mean no. of CAP sessions 8, CAP is an individually delivered cognitive‐behavioural‐orientated program delivered in weekly sessions by trained clinicians over 3 months, involving education about cannabis and psychosis, motivational interviewing, goal setting, and relapse prevention, n = 23. 2. Psychoeducation: mean no. of sessions 8, this was an active control, involving education of psychosis,medication and relapse prevention but with no specific discussion of cannabis, n = 24. |
|
| Outcomes | Mental state: BPRS‐E, BPRS‐PS, SANS, BDI‐SF (measured at baseline, end of study ‐ 3 months, 6 months after end of study).
Global state: KAPQ (measured at baseline, end of study ‐ 3 months, 6 months after end of study). Behaviour: Cannabis use: in last 4 weeks; percentage used in last 4 weeks (measured at baseline, end of study ‐ 3 months, 6 months after end of study). General functioning: SOFAS (measured at baseline, end of study ‐ 3 months, 6 months after end of study). |
|
| Notes | Further data were requested, but none received. | |
| Risk of bias | ||
| Bias | Authors' judgement | Support for judgement |
| Random sequence generation (selection bias) | Low risk | Quote: 'Randomization codes were computer generated and placed in sealed envelopes, managed by a nonclinical member of the research team.' |
| Allocation concealment (selection bias) | Low risk | Quote: 'Attempts to maintain rater blindness included use of separate rooms and administrative procedures for project staff, limiting information recorded in clinical notes, and requesting participants and clinicians not to disclose treatment conditions to raters.' |
| Blinding (performance bias and detection bias) All outcomes | Low risk | Quote: 'A single‐blind randomised controlled trial.' |
| Blinding of participants and personnel (performance bias) All outcomes | Low risk | Quote: 'A single‐blind randomised controlled trial.' |
| Blinding of outcome assessment (detection bias) All outcomes | Low risk | Quote: 'Two‐way random effects intra‐class correlation coefficients (ICC) with absolute agreement' were derived at levels 'suggesting excellent reliability.' |
| Incomplete outcome data (attrition bias) All outcomes | Low risk | Quote: 'Follow‐up rates were similar across intervention conditions.' |
| Selective reporting (reporting bias) | Unclear risk | Not specified. |
| Other bias | Unclear risk | Not specified. |
Hjorthoj 2013.
| Methods | Allocation: Randomisation. Blinding: single blind, assessor/rater blind. Duration: 6 months. Setting: outpatients, Copenhagen, Denmark. Design: randomised controlled trial, parallel. Funding: Lundbeck Foundation, Municipality of Copenhagen, Egmont Foundation, Health Insurance Foundation, Ministry of Social Welfare, Aase and Ejnar Danielsen's Foundation, Worzner Foundation. |
|
| Participants | Diagnosis: ICD‐10 schizophrenia spectrum psychosis and cannabis use. N = 103. Age: range 18‐35 (and subsequently during the study expanded to 17‐42); mean ˜ 26.9. Sex: 78 M, 25 F. Ethnicity: not stated. History: Cannabis primary substance of abuse. Included: resident of Copenhagen, not requiring interpreter, able to give informed consent. Excluded: not stated. Consent: written informed consent obtained. |
|
| Interventions | 1. CapOpus (motivational interviewing and CBT aimed at cannabis related problems) and treatment as usual, n = 52. 2. Treatment as usual ‐ treatment available to patients had they not participated in the trial (CBT, anti psychotic medication), n = 51. |
|
| Outcomes | Behaviour: Cannabis Use: Number of joints of cannabis in preceding month (baseline, end of intervention: 6 months, 10 months). Unable to use ‐ Number of days with cannabis use (no means) PANSS (no means or SD) Lab data (not per protocol). |
|
| Notes | Further data were requested, but none received. | |
| Risk of bias | ||
| Bias | Authors' judgement | Support for judgement |
| Random sequence generation (selection bias) | Low risk | Computerised central randomisation. |
| Allocation concealment (selection bias) | Low risk | Outcome assessor was kept blind to allocation. |
| Blinding (performance bias and detection bias) All outcomes | High risk | Fourteen patients or managers accidentally broke the blinding. |
| Blinding of participants and personnel (performance bias) All outcomes | Unclear risk | Not specified. |
| Blinding of outcome assessment (detection bias) All outcomes | Unclear risk | Not specified. |
| Incomplete outcome data (attrition bias) All outcomes | Unclear risk | Not specified. |
| Selective reporting (reporting bias) | Unclear risk | Not specified. |
| Other bias | Unclear risk | Not specified. |
Leweke 2012.
| Methods | Allocation: randomised. Blinding: double blind Duration: 28 days. Setting: Inpatients, Department of Psychiatry and Psychotherapy, University of Cologne, Cologne, Germany. Design: randomised controlled trial, parallel. Funding: Stanley Medical Research Institute, National Institute on Drug Abuse. |
|
| Participants | Diagnosis: Schizophrenia; schizophreniform psychosis (DSM‐IV). N = 42. Age: range 18‐50; mean ˜ 30.15. Sex: 32 M, 7 F. Ethnicity: not stated. History: acutely exacerbated schizophrenia. Included: BPRS ≥ 36; BPRS thought disorders (THOT) ≥ 12. Exclusion: Substance use disorders; depot antipsychotic in past 3 months; positive drug urine; history of treatment resistance; relevant/unstable medical condition. Consent: informed consent obtained. |
|
| Interventions | 1. Amisulpride: start with 200 mg per day increasing stepwise to 200 mg four times a day (total dose: 800 mg) within the first week; dose of 800 mg maintained for three further weeks; a reduction to 600 mg in total per day was allowed for clinical reasons such as side effects after week 2, n = 21. 2. Cannabidiol: start with 200 mg per day increasing stepwise to 200 mg four times a day (total dose: 800 mg) within the first week; dose of 800 mg maintained for three further weeks; a reduction to 600 mg in total per day was allowed for clinical reasons such as side effects after week 2, n = 21. |
|
| Outcomes | Mental State: PANSS (day 0, 14, 28); BPRS (day 0, 14, 28). Adverse effects: weight gain (kg) (day 0, 14, 28); EPS (day 0, 14, 28); serum prolactin (micrograms/L) (day 0, 14, 28); Unable to use ‐ serum anandamide (not relevant to this review); serum oleoylethanolamide (not relevant to this review); serum palmitoylethanolamide (not relevant to this review). |
|
| Notes | Further data were requested, but none received. | |
| Risk of bias | ||
| Bias | Authors' judgement | Support for judgement |
| Random sequence generation (selection bias) | Low risk | Prepared by person uninvolved in study. |
| Allocation concealment (selection bias) | Low risk | Prepared by person uninvolved in study. |
| Blinding (performance bias and detection bias) All outcomes | Low risk | Prepared by person uninvolved in study. |
| Blinding of participants and personnel (performance bias) All outcomes | Low risk | Prepared by person uninvolved in study. |
| Blinding of outcome assessment (detection bias) All outcomes | Low risk | Prepared by person uninvolved in study. |
| Incomplete outcome data (attrition bias) All outcomes | Low risk | Last observation carried forward. |
| Selective reporting (reporting bias) | Unclear risk | Not specified. |
| Other bias | Unclear risk | Not specified. |
Madigan 2012.
| Methods | Allocation: randomised. Blinding: single blind. Duration: one year. Setting: multi‐centre, inpatients/outpatients, Ireland. Design: randomised controlled trial, parallel. Funding: Health Research Board of Ireland. |
|
| Participants | Diagnosis: psychosis with comorbid substance dependence (DSM‐IV). N = 88. Age: range 16‐65 years; mean: 27.9 years. Sex: 69 M, 19 F. Ethnicity: not stated. History: first psychotic episode or within 3 years following onset of non‐affective or affective psychosis. Included: outpatients and inpatients, without learning disability; without organic brain damage. Exclusion: failure to meet SCID criteria for psychosis. Consent: written informed consent obtained. |
|
| Interventions | 1. Treatment as usual (TAU), care from a multidisciplinary team including medication and regular review n = 29. 2. Group Psychological Intervention (plus TAU) once a week for twelve weeks plus one session six weeks afterwards, provided by a clinical psychologist, they included anxiety management, motivational interviewing and CBT, n = 59. |
|
| Outcomes | Mental State: SAPS (baseline, 3 months, 1 year); SANS (baseline, 3 months, 1 year); CDSS (baseline, 3 months, 1 year); PANSS positive (baseline, 3 months, 1 year); PANSS negative (baseline, 3 months, 1 year); BSI (baseline, 3 months, 1 year). Behaviour: Cannabis use: frequency of use: ASI (baseline, 3 months, 1 year). General functioning: World Health OrganiZation Quality of Life Assessment (WHOQOL. BREF) (baseline, 3 months, 1 year); Drug Attitude Inventory (DAI‐30) (baseline, 3 months, 1 year); GAF (baseline, 3 months, 1 year). |
|
| Notes | Further data were requested, but none received. | |
| Risk of bias | ||
| Bias | Authors' judgement | Support for judgement |
| Random sequence generation (selection bias) | Low risk | ComputeriSed randomisation. |
| Allocation concealment (selection bias) | Low risk | Single blind (uninvolved researcher responsible for randomisation). |
| Blinding (performance bias and detection bias) All outcomes | Low risk | Single blind (uninvolved researcher responsible for randomisation). |
| Blinding of participants and personnel (performance bias) All outcomes | Low risk | Single blind (uninvolved researcher responsible for randomisation); rater remained blind until final assessment. |
| Blinding of outcome assessment (detection bias) All outcomes | Low risk | Single blind (uninvolved researcher responsible for randomisation); rater remained blind until final assessment. |
| Incomplete outcome data (attrition bias) All outcomes | Unclear risk | Data were analysed on an intention‐to‐treat basis. |
| Selective reporting (reporting bias) | Unclear risk | No indication. |
| Other bias | Unclear risk | No indication. |
van Nimwegen 2008.
| Methods | Allocation: randomised. Blinding: double blind. Duration: 6 weeks. Setting: outpatients, multi‐centre, Netherlands. Design: randomised controlled trial, parallel. Funding: Eli Lily. |
|
| Participants | Diagnosis: DSM‐IV diagnosis of schizophrenia, schizophreniform or schizoaffective disorder.
N = 129.
Age: 18‐30 years. Sex: not stated. Ethnicity: not stated. History: DSM‐IV diagnosis of schizophrenia, schizophreniform or schizoaffective disorder. Inclusion criteria: DSM‐IV‐R criteria for schizophrenia, schizoaffective disorder, or schizophreniform disorder based on the Structured Clinical Interview for the Diagnostic and Statistical Manual of Mental Disorders, fourth edition, patient version. Exclusion criteria: the concomitant use of any other antipsychotic drug (not olanzapine or risperidone), depot antipsychotic medications in the 3 months prior to inclusion, and current use of other psychotropic medications other than oxazepam or biperiden. Consent: not stated. |
|
| Interventions | 1. Olanzapine (5, 10, 15, or 20 mg/day), n = 66. 2. Risperidone (1.25, 2.5, 3.75, or 5 mg/day), n = 72. |
|
| Outcomes | Mental State: OCDUS scores (baseline, 6 weeks). Behaviour: Cannabis use: self‐report scores, joints per week (baseline, 6 weeks). Unable to use ‐ SWN (not relevant). DDQ (validity unknown). |
|
| Notes | Further data were requested, but none received. | |
| Risk of bias | ||
| Bias | Authors' judgement | Support for judgement |
| Random sequence generation (selection bias) | Unclear risk | Not specified. |
| Allocation concealment (selection bias) | Low risk | Double blind. |
| Blinding (performance bias and detection bias) All outcomes | Low risk | Double blind. |
| Blinding of participants and personnel (performance bias) All outcomes | Low risk | Double blind. |
| Blinding of outcome assessment (detection bias) All outcomes | Unclear risk | Not specified. |
| Incomplete outcome data (attrition bias) All outcomes | Unclear risk | Not specified. |
| Selective reporting (reporting bias) | Unclear risk | Not specified. |
| Other bias | Low risk | Eli‐Lilly funded the trial, yet were not involved in the design of the study, analyses, or interpretation of results. |
CBT ‐ cognitive behavioural therapy BPRS‐E ‐ Brief Psychiatric Rating Scale‐Expanded BPRS ‐ Brief Psychiatric Rating Scale BPRS‐PS ‐ Brief Psychiatric Rating Scale‐Positive Symptoms BPRS THOT ‐ Brief Psychiatric Rating Scale Thought Disorder BDI‐SF ‐ Beck Depression Inventory ‐ Short Form ICD‐10 ‐ International Classification of Diseases, tenth revision SAS ‐ Simpson Angus Scale SANS ‐ Scale for the Assessment of Negative Symptoms SOFAS ‐ Social and Occupational Functioning Assessment Scale KAPQ ‐ Knowledge About Psychosis Questionnaire CGI ‐ Clinical Global Impression Scale ASI ‐ Addiction Severity Index HAM‐D ‐ Hamilton Depression Scale AIMS ‐ Abnormal Involuntary Movement Scale PANSS ‐ Positive and Negative Syndrome Scale SCID ‐ Structured Clincal Interview for Diagnosis GAF ‐ Global Assessment of Functoning Scale DSM ‐ The Diagnostic and Statistical Manual of Mental Disorders TAU – Treatment as Usual MI ‐ Motivational Intervention SAPS ‐ Scale for the assessment of positive symptoms CDSS ‐ Calgary Depression Scale for Schizophrenia BSI ‐ Birchwood Insight Scale WHOQOLL. BREF ‐ World Health Organisation Quality of Life Assessment DAI‐30 ‐ Drug Attitude Inventory OCDUS ‐ Obsessive–Compulsive Drug Use Scale DDQ ‐ Drug Desire Questionnaire SWN ‐ Subjective Wellbeing Under Neuroleptics Scale
Characteristics of excluded studies [ordered by study ID]
| Study | Reason for exclusion |
|---|---|
| Baker 2006 | Allocation: randomised. Participants: people with psychotic disorder and who reported hazardous alcohol, cannabis and/or amphetamine use in the previous month. Interventions: Standard care vs motivational interviewing/CBT. Outcomes: usable data were requested, but none received. |
| Barrowclough 2010 | Allocation: randomised. Participants: non‐affective psychotic disorder, illicit drugs/alcohol dependence. Interventions: Standard care vs. MiCBT + standard care. Outcomes: usable data were requested, but none received. |
| Bellack 2006 | Allocation: randomised. Participants: people meeting DSM criteria for drug dependence and serious mental illness. Interventions: BTSAS social learning intervention (includes motivational interviewing, a urinalysis contingency, and social skills training) vs. STAR (a supportive group discussion treatment). Outcomes: usable data were requested, but none received. |
| James 2004 | Allocation: randomised. Participants: axis I diagnosis of a non‐organic psychotic disorder, currently using illicit drugs/alcohol. Interventions: group intervention ‐ weekly 90‐minute sessions over 6 weeks vs. single education session. Outcomes: usable data were requested, but none received. |
| Kemp 2007 | Allocation: randomised. Participants: young people with primary diagnosis of a psychotic illness. Interventions: treatment as usual vs CBT: "Stop using stuff." Outcome: usable data were requested, but none received. |
| Martino 2006 | Allocation: randomised. Participants: Individuals with co‐occurring psychotic and drug‐related disorders. Interventions: two‐session motivational interview adapted for dually diagnosed psychotic and drug‐related disordered patients vs. two‐session standard psychiatric interview. Outcomes: usable data were requested, but none received. |
CBT ‐ cognitive behavioural therapy MiCBT ‐ Integrated Motivational Interviewing and Cognitive Behavioural Therapy DSM ‐ Diagnostic and Statistical Manual of Mental Disorders BTSAS ‐ Behavioural Treatment for Substance Abuse in Severe and Persistent Mental Illness STAR ‐ Supportive Treatment for Addiction Recovery
Characteristics of studies awaiting assessment [ordered by study ID]
D'Souza 2005.
| Methods | Allocation: randomised. Blindness: double blind. Duration 3 days. Setting: Neurobiological Studies Unit. Design: parallel. Funding: Department of Veterans Affairs. |
| Participants | Diagnosis: schizophrenia or schizoaffective disorder (DSM‐IV). N = 13. Age: 44.46 ±10.4 years. Sex M:F 10:3. History: clinically stable. Included: at least one exposure to cannabis. Exclusion: recent/current hospitalisation; homicidality; suicidality; grave disability; cannabis naive; lifetime cannabis use disorder; recent abuse (within 3 months) or dependence (within a year) of any substance of abuse except nicotine. Consent: not known. |
| Interventions | 1. THC: dose 2.5 mg. 2. THC: dose 5 mg. 3. Placebo. |
| Outcomes | Mental state: PANSS. Cannabis use: CADSS. Adverse events: Extrapyramidal effects. |
| Notes | Usable data requested, but none received. |
CADSS ‐ Clinician‐Administered Dissociative Symptom Scale DSM ‐ Diagnostic and Statistical Manual of Mental Disorders PANSS ‐ Positive and Negative Syndrome Scale THC ‐ delta‐9‐tetrahydrocannabinol
Differences between protocol and review
| Minor differences | Major differences |
| Reordered and renamed main outcomes. Grouped the main outcomes within different time frames of short, medium and long term. Reorganised the comparisons from four arms to two comparisons. The time period for the primary outcomes were specified as medium term. |
Primary outcomes: removed hospitalisation |
We felt that the primary outcomes that we removed were not as pertinent to the focus of the study as change in general mental state, relapse and behaviour.
We grouped the main outcomes by time frames to make the comparisons within the review more clear and meaningful; once we had done this, we then had to specify a time for the primary outcome, we decided that medium term would best reflect the comparisons. We reorganised the comparisons to make them more straightforward and specified the primary outcome times based on this rearrangement.
We also updated the methods section to reflect changes in Cochrane methodology since this review was first published.
Contributions of authors
Please note: Benjamin McLoughlin and Jonathan Pushpa‐Rajah contributed equally for this version of the review.
Benjamin McLoughlin updated protocol, selected studies, extracted data, wrote final report.
Jonathan Pushpa‐Rajah updated protocol, selected studies, extracted data, wrote final report.
Donna Gillies performed reliability checks, edited/commented on protocol and review.
From previous version:
John Rathbone ‐ updated protocol, selected studies, extracted data, wrote final report.
Hannele Variend ‐ selected studies, extracted data.
Sources of support
Internal sources
University of Nottingham, Nottingham, UK.
External sources
No sources of support supplied
Declarations of interest
None known.
Co‐lead author with Jonathan Pushpa‐Rajah
Co‐lead author with Benjamin McLoughlin
New search for studies and content updated (no change to conclusions)
References
References to studies included in this review
Akerele 2007 {published data only (unpublished sought but not used)}
- Akerele E, Levin FR. Comparison of olanzapine to risperidone in substance‐abusing individuals with schizophrenia. American Journal on Addictions 2007;16(4):260‐8. [MEDLINE: ] [DOI] [PubMed] [Google Scholar]
Bonsack 2011 {published and unpublished data}
- Bonsack C, Gibellini Manetti S, Favrod J, Montagrin Y, Besson J, Bovet P, et al. Motivational intervention to reduce cannabis use in young people with psychosis: randomised control trial. Psychotherapy and Psychosomatics 2011;80(5):287‐97. [DOI] [PubMed] [Google Scholar]
Brunette 2011 {published data only (unpublished sought but not used)}
- Brunette MF, Dawson R, O’Keefe CD, Narasimhan M, Noordsy DL, Wojcik NJ, et al. A randomized trial of clozapine versus other antipsychotics for cannabis use disorder in patients with schizophrenia. Journal of Dual Diagnosis 2011;7(1‐2):50‐63. [DOI] [PMC free article] [PubMed] [Google Scholar]
Edwards 2006 {published data only (unpublished sought but not used)}
- Edwards J. Early psychosis service developments: becoming real. 3rd International Conference on Early Psychosis; 2002 Sep 25‐28; Copenhagen, Denmark. 2002:56. [KA03]
- Edwards J, Elkins K, Hinton M, Harrigan SM, Donovan K, Athanasopoulos O, et al. Randomized controlled trial of a cannabis‐focused intervention for young people with first‐episode psychosis. Acta Psychiatrica Scandinavica 2006;114(2):109‐17. [MEDLINE: ] [DOI] [PubMed] [Google Scholar]
- Edwards J, Elkins KS, Hinton MF, Harrigan SM, Donovan KD, Athanasopoulos O. Randomized controlled trial of a cannabis‐focused intervention versus psychoeducation for young people continuing to use cannabis in the 12 months following entry to treatment for first‐episode psychosis. Schizophrenia Research 2004;70(1):61. [ISI:000224551100164] [Google Scholar]
Hjorthoj 2013 {published data only (unpublished sought but not used)}
- Hjorthj CR, Fohlmanna A, Larsena AM, Gluuda C, Arendta M, Nordentoft M. Specialized psychosocial treatment plus treatment as usual (TAU) versus TAU for patients with cannabis use disorder and psychosis: the CapOpus randomised trial. Psychological Medicine July 2013;43(7):1499‐510. [DOI] [PubMed] [Google Scholar]
Leweke 2012 {published data only (unpublished sought but not used)}
- Leweke FM, Piomelli D, Pahlisch F, Muhl D, Gerth CW, Hoyer C, et al. Cannabidiol enhances anandamide signalling and alleviates psychotic symptoms of schizophrenia. Translation Psychiatry 2012;2(94):1‐7. [DOI] [PMC free article] [PubMed] [Google Scholar]
Madigan 2012 {published data only (unpublished sought but not used)}
- Madigan K, Brennan D, Lawlor E, Turner N, Kinsella A, O'Connor JJ, et al. A multi‐center, randomized control trial of a group psychological intervention for psychosis with comorbid cannabis dependence over the early course of the illness. Schizophrenia research 2013;143(1):138‐42. [DOI] [PubMed] [Google Scholar]
van Nimwegen 2008 {published data only (unpublished sought but not used)}
- Nimwegen L, Haan L, Beveren N, Laan W, Brink W, Linszen D. Subjective well‐being and craving for cannabis in first psychosis, a randomized double blind comparison of olanzapine vs risperidone. Canadian Jourmal of Psychiatry 2008;53(6):400–5. [DOI] [PubMed] [Google Scholar]
References to studies excluded from this review
Baker 2006 {published data only}
- Baker A, Bucci S, Lewin TJ, Kay‐Lambkin F, Constable PM, Carr VJ. Cognitive behavioural therapy for substance use disorders in people with psychotic disorders. British Journal of Psychiatry 2006;188:439‐48. [DOI] [PubMed] [Google Scholar]
Barrowclough 2010 {published data only}
- Barrowclough C, Haddock G, Wykes T, Beardmore R, Conrod P, Craig T, et al. Integrated motivational interviewing and cognitive behavioural therapy for people with psychosis and comorbid substance misuse: randomised controlled trial. BMJ 2010;341:c6325. [DOI] [PMC free article] [PubMed] [Google Scholar]
Bellack 2006 {published data only}
- Bellack AS, Bennett ME, Gearon JS, Brown CH, Yang Y. A randomized clinical trial of a new behavioural treatment for drug abuse in people with severe and persistent mental illness. Archives of General Psychiatry 2006;63(4):426‐32. [DOI] [PubMed] [Google Scholar]
James 2004 {published data only}
- James W, Preston NJ, Koh G, Spencer C, Kisely SR, Castle DJ. A group intervention which assists patients with dual diagnosis reduce their drug use: a randomised control trial. Psychological Medicine 2004;34(6):983‐90. [DOI] [PubMed] [Google Scholar]
Kemp 2007 {published data only}
- Kemp R, Harris A, Vurel E, Sitharthan T. Stop using stuff: trial of a drug and alcohol intervention for young people with comorbid mental illness and drug and alcohol problems.. Australasian psychiatry 2007;15(6):490‐3. [DOI] [PubMed] [Google Scholar]
Martino 2006 {published data only}
- Matrino S, Carroll KM, Nich C, Rounsaville BJ. A randomised controlled pilot study of motivational interviewing for patients with psychotic and drug use disorders. Addiction 2006;101(10):1479‐92. [DOI] [PubMed] [Google Scholar]
References to studies awaiting assessment
D'Souza 2005 {published data only}
- D'Souza DC, Abi‐Saab WM, Madonick S, Forselius‐Bielen K, Doersch A, Braley G, et al. Delta‐9‐tetrahydrocannabinol effects in schizophrenia: implications for cognition, psychosis, and addiction. Biological Psychiatry 2005;57(6):594‐608. [DOI] [PubMed] [Google Scholar]
Additional references
Addington 1993
- Addington D, Addington J, Maticka‐Tyndale E. Assessing depression in schizophrenia: The Calgary Depression Scale. British Journal of Psychiatry 1993;163(22):39‐44. [PubMed] [Google Scholar]
Allebeck 1993
- Allebeck P, Adamsson C, Engström A. Cannabis and schizophrenia: a longitudinal study of cases treated in Stockholm County. Acta Psychiatrica Scandinavica 1993;88(1):21‐4. [DOI] [PubMed] [Google Scholar]
Altman 1996
- Altman DG, Bland JM. Detecting skewness from summary information. BMJ 1996;313:1200. [DOI] [PMC free article] [PubMed] [Google Scholar]
Andreasen 1983
- Andreasen NC. Negative symptoms in schizophrenia. Archives of General Psychiatry 1983;39:784‐8. [DOI] [PubMed] [Google Scholar]
Andreasen 1984
- Andreasen NC. The Scale for the Assessment of Positive Symptoms(SAPS). University of Iowa. Iowa City, Iowa 1984.
Andreasson 1987
- Andreasson S, Allebeck P, Engstrom A, Rydberg U. Cannabis and schizophrenia: a longitudinal study of Swedish conscripts. Lancet 1987;2:1483‐6. [DOI] [PubMed] [Google Scholar]
Arseneault 2002
- Arseneault L, Cannon M, Poulton R, Murray R, Caspi A, Moffit TE. Cannabis use in adolescence and risk for adult psychosis: longitudinal prospective study. BMJ 2002;325:1212‐3. [DOI] [PMC free article] [PubMed] [Google Scholar]
Ashton 2001
- Ashton CH. Pharmacology and effects of cannabis: a brief review. British Journal of Psychiatry 2001;178:101‐6. [DOI] [PubMed] [Google Scholar]
Baigent 1995
- Baigent M, Holme G, Hafner RJ. Self reports of the interaction between substance abuse and schizophrenia. Australian and New Zealand Journal of Psychiatry 1995;29(1):69‐74. [DOI] [PubMed] [Google Scholar]
Beck 1972
- Beck AT, Beck RW. Screening depressed patients in family practice. A rapid technique. Postgraduate Medicine 1972;52:81‐5. [DOI] [PubMed] [Google Scholar]
Berridge 2004
- Berridge V. Cannabis Britannica: Empire, trade and prohibition. English Historical Review 2004;483:1075‐175. [Google Scholar]
Bersani 2002
- Bersani G, Orlandi V, Kotzalidis GD, Pancheri P. Cannabis and schizophrenia: impact on onset, course, psychopathology and outcomes. European Archives of Psychiatry and Clinical Neuroscience 2002;252(2):86‐92. [DOI] [PubMed] [Google Scholar]
Birchwood 1992
- Birchwood M, Smith J, Cochrane R. Specific and non‐specific effects of educational intervention for families living with schizophrenia. A comparison of three methods. British Journal of Psychiatry 1992;160:806‐14. [DOI] [PubMed] [Google Scholar]
Birchwood 1993
- Birchwood M, Smith J, Drury V, Healy J, Macmillan F, Slade M. A self‐report Insight scale for psychosis: reliability, validity and sensitivity to change. Acta Psychiatrica Scandinavica Jan 1994;89(1):62‐7. [DOI] [PubMed] [Google Scholar]
Bland 1997
- Bland JM, Kerry SM. Statistics notes. Trials randomised in clusters. BMJ 1997;315:600. [DOI] [PMC free article] [PubMed] [Google Scholar]
Bodlund 1994
- Bodlund O, Kullgren G, Ekselius L. Axis V—Global Assessment of Functioning Scale. Evaluation of a self‐report version. Acta Psychiatrica Scandinavica November 1994;90(5):342‐7. [DOI] [PubMed] [Google Scholar]
Boissel 1999
- Boissel JP, Cucherat M, Li W, Chatellier G, Gueyffier F, Buyse M, et al. The problem of therapeutic efficacy indices. 3. Comparison of the indices and their use. Therapie 1999;54(4):405‐11. [PubMed] [Google Scholar]
Carney 1984
- Carney M, Bacelle L, Robinson B. Psychosis after cannabis use. BMJ 1984;288:1047. [DOI] [PMC free article] [PubMed] [Google Scholar]
Carpenter 1994
- Carpenter WT Jr, Buchanan RW. Schizophrenia. New England Journal of Medicine 1994;330:681‐90. [DOI] [PubMed] [Google Scholar]
Casadio 2011
- Casadioa P, Fernandes C, Murray RM, Forti M. Cannabis use in young people: the risk for schizophrenia. Neuroscience and biobehavioral reviews 2011;35(8):1779‐87. [DOI] [PubMed] [Google Scholar]
Chopra 1974
- Chopra GS, Smith JW. Psychotic reactions following cannabis use in East Indians. Archives of General Psychiatry 1974;30:24‐7. [DOI] [PubMed] [Google Scholar]
Condren 2001
- Condren RM, O’Connor J, Browne R. Prevalence and patterns of substance misuse in schizophrenia. A catchment area case‐control study. Psychiatric Bulletin 2001;25(1):17‐20. [Google Scholar]
D'Souza 2009
- D'Souza DC, Sewell RA, Ranganathan M. Cannabis and psychosis/schizophrenia: human studies. European Archives of Psychiatry Clinical Neuroscience 2009;259(7):413‐31. [DOI] [PMC free article] [PubMed] [Google Scholar]
Davison 1972
- Davison K, Wilson H. Psychosis associated with cannabis smoking. Addiction 1972;67(3):225‐8. [DOI] [PubMed] [Google Scholar]
Deeks 2000
- Deeks J. Issues in the selection for meta‐analyses of binary data. Abstracts of 8th International Cochrane Colloquium; 2000 Oct 25‐28th; Cape Town, South Africa. 2000.
Divine 1992
- Divine GW, Brown JT, Frazer LM. The unit of analysis error in studies about physicians' patient care behavior. Journal of General Internal Medicine 1992;7:623‐9. [DOI] [PubMed] [Google Scholar]
Dixon 1990
- Dixon L, Haas G, Wedien PJ, Sweeney J, Frances AJ. Acute effects of drug abuse in schizophrenic patients: clinical observations and patients' self‐reports. Schizophrenia Bulletin 1990;16:69‐79. [DOI] [PubMed] [Google Scholar]
Donner 2002
- Donner A, Klar N. Issues in the meta‐analysis of cluster randomised trials. Statistics in Medicine 2002;21:2971‐80. [DOI] [PubMed] [Google Scholar]
Duke 2001
- Duke PJ, Pantelis C, McPhillips MA, Barnes TR. Comorbid non‐alcohol substance misuse among people with schizophrenia: epidemiological study in central London. British Journal of Psychiatry 2001;179:509‐13. [DOI] [PubMed] [Google Scholar]
Egger 1997
- Egger M, Davey G, Schneider M, Minder C. Bias in meta‐analysis detected by a simple, graphical test. BMJ 1997;315:629‐34. [DOI] [PMC free article] [PubMed] [Google Scholar]
Elbourne 2002
- Elbourne D, Altman DG, Higgins JPT, Curtina F, Worthingtond HV, Vaile A. Meta‐analyses involving cross‐over trials: methodological issues. International Journal of Epidemiology 2002;31(1):140‐9. [DOI] [PubMed] [Google Scholar]
EMCDDA
- An overview of drug potency in Europe. European Monitoring Centre for Drugs and Drug Addiction.
Farrell 1998
- Farrell M, Howes C, Taylor C. Substance misuse of psychiatric co‐morbidity: an overview of the OPCS National Psychiatric Morbidity Survey. Addictive Behavior 1998;23:908‐18. [DOI] [PubMed] [Google Scholar]
Franken 2002
- Franken IH, Hendriks VM, Brink W. Initial validation of two opiate craving questionnaires the obsessive compulsive drug use scale and the desires for drug questionnaire.. Addictive Behaviors, 2002;27(5):675‐85. [DOI] [PubMed] [Google Scholar]
Freund 2003
- Freund TF, Katona I, Piomelli D. Role of endogenous cannabinoids in synaptic signalling. Physiological reviews Jul 2003;83(3):1017‐66. [DOI] [PubMed] [Google Scholar]
Furukawa 2006
- Furukawa TA, Barbui C, Cipriani A, Brambilla P, Watanabe N. Imputing missing standard deviations in meta‐analyses can provide accurate results. Journal of Clinical Epidemiology 2006;59(7):7‐10. [DOI] [PubMed] [Google Scholar]
Gaoni 1964
- Gaoni Y, Mechoulam R. Isolation, structure, and partial synthesis of an active constituent of hashish. Journal of the American Chemical Society 1964;86:1646‐7. [Google Scholar]
Goldman 1992
- Goldman HH, Skodol AE, Lave TR. Revising axis V for DSM‐IV: a review of measures of social functioning. American Journal of Pschiatry 1992;149:1148‐56. [DOI] [PubMed] [Google Scholar]
Gulliford 1999
- Gulliford MC, Ukoumunne OC, Chinn S. Components of variance and intraclass correlations for the design of community‐based surveys and intervention studies: data from the Health Survey for England 1994. American Journal of Epidemiology 1999;149:876‐83. [DOI] [PubMed] [Google Scholar]
Hall 1999
- Hall W, Johnston L, Donnelly N. The Health Effects of Cannabis. 1st Edition. Toronto: Toronto: Additction Research Foundation, 1999. [Google Scholar]
Hambrecht 2000
- Hambrecht M, Häfner H. Cannabis, vulnerability, and the onset of schizophrenia: an epidemiological perspective. Australian and New Zealand Journal of Psychiatry 2000;34(3):468‐75. [DOI] [PubMed] [Google Scholar]
Heishman 2006
- Heishman SJ, Singleton EG. Assessment of cannabis craving using the Marijuana Craving Questionnaire. Methods in Molecular Medicine 2006;123:209‐16. [DOI] [PubMed] [Google Scholar]
Henquet 2005
- Henquet C, Krabbendam L, Spauwen J, Kaplan C, Lieb R, Wittchen HU, et al. Prospective cohort study of cannabis use, predisposition for psychosis, and psychotic symptoms in young people. BMJ 2005;330(11):7481. [DOI] [PMC free article] [PubMed] [Google Scholar]
Henquet 2008
- Henquet C, Forti M, Morrison P, Kuepper R, Murray RM. Gene‐environment interplay between cannabis and psychosis. Schizophrenia Bulletin 2008;34(6):1111‐21. [DOI] [PMC free article] [PubMed] [Google Scholar]
Hides 2006
- Hides L, Dawe S, Kavanagh DJ, Young RM. Psychotic symptom and cannabis relapse in recent‐onset psychosis. Prospective study. British Journal of Psychiatry 2006;189:137‐43. [DOI] [PubMed] [Google Scholar]
Higgins 2003
- Higgins JP, Thompson SG, Deeks JJ, Altman DG. Measuring inconsistency in meta‐analyses. BMJ 2003;327:557‐60. [DOI] [PMC free article] [PubMed] [Google Scholar]
Higgins 2006
- Higgins JPT. Cochrane Handbook for Systematic Reviews of Interventions 4.2.6 [updated September 2006]. In: Higgins JPT, Green S editor(s). The Cochrane Library. Chichester, UK: John Wiley & Sons, Ltd., 2006. [Google Scholar]
Higgins 2011
- Higgins JPT, Green S (editors). Cochrane Handbook for Systematic Reviews of Interventions Version 5.0.2 [updated September 2011]. The Cochrane Collaboration, 2011. Available from www.cochrane‐handbook.org.
Hogan 1983
- Hogan TP, Awad AG, Eastwood R. A self‐report scale predictive of drug compliance in schizophrenics: reliability and discriminative validity. Psychological Medicine Feb 1983;13(1):177‐83. [DOI] [PubMed] [Google Scholar]
Hunt 2013
- Hunt GE, Matheson SL, Siegfried N, Walter G, Cleary M. Psychosocial interventions for people with both severe mental illness and substance misuse. Cochrane Database of Systematic Reviews 2013, Issue 10. [DOI: 10.1002/14651858.CD001088.pub3] [DOI] [PubMed] [Google Scholar]
Isbell 1967
- Isbell H, Gorodetsky CW, Jasinski D, Claussen U, Spulak F, Korte F. Effects of 9‐trans‐tetrahydrocannabinol in man. Psychophormacologia 1967;11:184. [DOI] [PubMed] [Google Scholar]
Jablensky 1992
- Jablensky A, Sartorius N, Ernberg G, Anker, M. Schizophrenia: manifestations, incidence and course in different cultures: A World Health Organization ten‐country study. Psychological Medicine 1992;Suppl 20:97. [DOI] [PubMed] [Google Scholar]
Kavanagh 2004
- Kavanagh DJ, Waghorn G, Jenner L, Chant DC, Carr V, Evans M, et al. Demographic and clinical correlates of comorbid substance use disorders in psychosis: multivariate analyses from an epidemiological sample. Schizophrenia Research 2004;66(2‐3):115‐24. [DOI] [PubMed] [Google Scholar]
Kay 1986
- Kay SR, Opler LA, Fiszbein A. Positive and negative syndrome scale (PANSS) manual. North Tonawanda (NY): Multi‐Health Systems, 1986. [Google Scholar]
Kay 1987
- Kay SR, Fiszbein A, Opler LA. The positive and negative syndrome scale (PANSS) for schizophrenia. Schizophrenia Bulletin 1987;13(2):261‐76. [DOI] [PubMed] [Google Scholar]
Kolliakou 2011
- Kolliakoua A, Joseph C, Ismail K, Atakan Z, Murray RM. Why do patients with psychosis use cannabis and are they ready to change their use?. Neuroscience May 2011;29(3):335‐46. [DOI] [PubMed] [Google Scholar]
Kouri 1999
- Kouri EM, Harrison G, Pope G Jnr. Changes in aggressive behavior during withdrawal from long term marijuana use. Psychopharmacology 1999;143:302‐8. [DOI] [PubMed] [Google Scholar]
Leucht 2005
- Leucht S, Kane JM, Kissling W, Hamann J, Etschel E, Engel RR. What does the PANSS mean?. Schizophrenia Research 2005;79(2‐3):231‐8. [PUBMED: 15982856] [DOI] [PubMed] [Google Scholar]
Leucht 2005a
- Leucht S, Kane JM, Kissling W, Hamann J, Etschel E, Engel R. Clinical implications of Brief Psychiatric Rating Scale Scores. British Journal of Psychiatry 2005;187:366‐71. [DOI] [PubMed] [Google Scholar]
Leucht 2007
- Leucht S, Engel RR, Bauml J, Davis JM. Is the superior efficacy of new generation antipsychotics an artefact of LOCF?. Schizophrenia Bulletin 2007;33(1):183‐91. [PUBMED: 16905632] [DOI] [PMC free article] [PubMed] [Google Scholar]
Leweke 1999
- Leweke FM, Guiffrida A, Wurster U, Emrich HM, Piomelli D. Elevated endogenous cannabinoids in schizophrenia. Neuroreport 1999;10:1665‐69. [DOI] [PubMed] [Google Scholar]
Linszman 1994
- Linszman DH, Dingemans PM, Lenoir ME. Cannabis abuse and the course of recent onset schizophrenic disorders. Archives of General Adult Psychiatry 1994;51:273‐9. [DOI] [PubMed] [Google Scholar]
Lishman 1998
- Lishman WA. Organic Psychiatry: The Psychological Consequences of Cerebral Disorder. 3rd Edition. Oxford: Blackwell, 1998. [Google Scholar]
Littlewood 1988
- Littlewood R. Ideology, camouflage or contingency? Racism in British psychiatry. Transcultural Psychiatry 1988;30(3):243‐90. [Google Scholar]
Lynskey 2002
- Lynskey MT, Heath AC, Nelson EC, Bucholz KK, Madden PA, Slutske WS, et al. Genetic and environmental contributions to cannabis dependence in a national young adult twin sample. Psychological Medicine 2002;32(2):195‐207. [DOI] [PubMed] [Google Scholar]
Marshall 2000
- Marshall M, Lockwood A, Adams C, Bradley C, Joy C, Fenton M. Unpublished rating scales ‐ a major source of bias in randomised controlled trials of treatments for schizophrenia?. British Journal of Psychiatry 2000;176:249‐52. [DOI] [PubMed] [Google Scholar]
Matheson 2011
- Matheson SL, Shepherd AM, Laurens KR, Carr VJ. A systematic meta‐review grading the evidence for non‐genetic risk factors and putative antecedents of schizophrenia. Schizophrenia Research 2011;133(1‐3):133‐42. [DOI] [PubMed] [Google Scholar]
McGovern 1987
- McGovern D, Cope R. First admission rates of first and second generation Afro‐Caribbeans. Journal of Social Distress and the Homeless 1987;22:139‐48. [DOI] [PubMed] [Google Scholar]
McLellan 1980
- Mclellan A, Luborsky T, Woody L, O'Brien GE, Charles P. An improved diagnostic evaluation instrument for substance abuse patients. The Addiction Severity Index. Journal of Nervous and Mental Disease 1980;168(1):26‐33. [DOI] [PubMed] [Google Scholar]
Miles 2001
- Miles DR, Bree MB, Gupman AE, Newlin DB, Glantz MD, Pickens RW. A twin study on sensation seeking, risk taking behavior and marijuana use. Drug and Alcohol Dependence 2001;62:57‐68. [DOI] [PubMed] [Google Scholar]
Moher 2001
- Moher D, Schulz KF, Altman D. The CONSORT statement: revised recommendations for improving the quality of reports of parallel‐group randomised trials. JAMA 2001;285(15):1987‐91. [DOI] [PubMed] [Google Scholar]
Moore 2007
- Moore TH, Zammit S, Lingford‐Hughes A, Barnes TR, Jones PB, Burke M, et al. Cannabis use and risk of psychotic or affective mental health outcomes: a systematic review. Lancet 2007;370(9584):319‐28. [DOI] [PubMed] [Google Scholar]
Negrete 1986
- Negrete JC, Knapp WP, Douglas DE, Smith WB. Cannabis affects the severity of schizophrenic symptoms: results of a clinical survey. Psychological Medicine 1986;16:515‐20. [DOI] [PubMed] [Google Scholar]
Nunez 2002
- Nunez LA, Gurpegui M. Cannabis‐induced psychosis: a cross‐sectional comparison with acute schizophrenia. Acta Psychiatrica Scandinavica 2002;105:173‐8. [DOI] [PubMed] [Google Scholar]
Overall 1988
- Overall JE, Gorham DR. The Brief Psychiatric Rating Scale (BPRS): Recent developments in ascertainment and scaling. Psychopharmacology Bulletin 1988;24:97‐9. [PubMed] [Google Scholar]
Regier 1990
- Regier DA, Farmer ME, Rae DS. Co‐morbidity of mental disorders with alcohol and other drug abuse: results from the Epidemiologic Catchment Area (ECA) study. JAMA 1990;264:2511‐8. [PubMed] [Google Scholar]
Russo 2008
- Russo EB, Jiang HE. Phytochemical and genetic analyses of ancient cannabis from Central Asia. Journal of Experimental Botany 2008;59(15):4171‐82. [DOI] [PMC free article] [PubMed] [Google Scholar]
Schulz 1995
- Schulz KF, Chalmers I, Hayes RJ, Altman DG. Empirical evidence of bias: dimensions of methodological quality associated with estimates of treatment effects in controlled trials. JAMA 1995;273:408‐12. [DOI] [PubMed] [Google Scholar]
Schunemann 2008
- Schunemann HJ, Oxman AD, Vist GE, Higgins JPT, Deeks JJ, Glasziou P, et al. Chapter 12: Interpreting results and drawing conclusions. In: Higgins JPT, Green S editor(s). Cochrane Handbook for Systematic Reviews of Interventions. The Cochrane Collaboration, 2008:359‐83. [Google Scholar]
Semple 2005
- Semple DM, McIntosh AM, Lawrie SM. Cannabis as a risk factor for psychosis: systematic review. Journal of Psychopharmacology 2005;19(2):187‐94. [DOI] [PubMed] [Google Scholar]
Simpson 1970
- Simpson GM, Angus JWS. A rating scale for extrapyramidal side effects. Acta Psychiatrica Scandinavica 1970;212:11‐9. [DOI] [PubMed] [Google Scholar]
Sinclair 2008
- Sinclair J. Co‐morbid substance misuse in psychiatric patients: prevalence and association with length of inpatient stay. Journal of Psychopharmacology 2008;22(1):92‐9. [DOI] [PubMed] [Google Scholar]
Smith 1994
- Smith J, Hucker S. Schizophrenia and substance abuse. British Journal of Psychiatry 1994;165:13‐21. [DOI] [PubMed] [Google Scholar]
Sobell 1992
- Sobell LC, Sobell MB. Timeline Follow‐back: A technique for assessing self‐reported ethanol consumption. In: In J. Allen, R. Z. Litten (Eds.) editor(s). Measuring Alcohol Consumption: Psychosocial and Biological Methods. Totowa, NJ: Humana Press, 1992:41‐72. [Google Scholar]
Soyka 1993
- Soyka M, Immler B, Sand P. Alcohol and drug abuse as risk factors for violence and delinquency in schizophrenic patients. Psychiatrische Praxis 1993;5:172‐5. [PubMed] [Google Scholar]
Stephens 1993
- Stephens RS, Roffman RA, Simpson EE. Adult marijuana users seeking treatment. Journal of Consulting and Clinical Psychology 1993;62:1100‐4. [DOI] [PubMed] [Google Scholar]
Talbot 1969
- Talbot JA, Teague JW. Marihuana psychosis. Acute toxic psychosis associated with the use of Cannabis derivatives. JAMA 1969;210(2):299‐302. [DOI] [PubMed] [Google Scholar]
Tanda 1997
- Tanda G, Pontiere FE, DiChiara G. Cannabinoid and heroin activation of mesolimbic dopamine transmission by a common mu1 opioid receptor mechanism. Science 1997;276:2048‐50. [DOI] [PubMed] [Google Scholar]
Thomas 1996
- Thomas H. A community survey of adverse effects of cannabis use. Drug and Alcohol Dependence 1996;42:201‐7. [DOI] [PubMed] [Google Scholar]
Tunving 1985
- Tunving K. Psychiatric effects of cannabis use. Acta Psychiatrica Scandinavica 1985;72:209‐17. [DOI] [PubMed] [Google Scholar]
Ukoumunne 1999
- Ukoumunne OC, Gulliford MC, Chinn S, Sterne JAC, Burney PGJ. Methods for evaluating area‐wide and organisation‐based intervention in health and health care: a systematic review. Health Technology Assessment 1999;3(5):1‐75. [PubMed] [Google Scholar]
UNODOC
- UNODC. World Drug Report 2012. United Nations publication Vol. 12, issue XI:1.
Van Os 2002
- Os J, Bak M, Hanssen M, Bijl RV, Graaf R, Verdoux H. Cannabis use and psychosis: A longitudinal population‐based study. American Journal of Epidemiology 2002;156:319‐27. [DOI] [PubMed] [Google Scholar]
Varma 1972
- Varma LP. Cannabis psychosis. Indian Journal of Psychiatry 1972;14:241‐55. [Google Scholar]
Virgo 2001
- Virgo N, Bennett G, Higgins D, Bennett L, Thomas P. The prevalence and characteristics of co‐occurring serious mental illness (SMI) and substance abuse or dependence in the patients of Adult Mental Health and Addictions Services in eastern Dorset. Journal of Mental Health 2001;10(2):175‐88. [Google Scholar]
Warner 1994
- Warner R. Recovery from Schizophrenia: Psychiatry and Political Economy. Psychology Press 1994.
Warnock 1903
- Warnock J. Insanity from Hasheesh. Journal of Mental Sciences 1903;49:96‐110. [Google Scholar]
WHOQOL
- WHOQOL. WHOQOL ‐ Brief introduction, administration,scoring and generic version of the assessment. WHO December 1996.
Wing 1990
- Wing JK, Barbo T, Brugha T, Burke J, Cooper J, Giel R, et al. Schedules for Clinical Assessment in Neuropsychiatry. Archives of General Psychiatry 1990;47:589‐93. [DOI] [PubMed] [Google Scholar]
Xia 2009
- Xia J, Adams CE, Bhagat N, Bhagat V, Bhoopathi P, El‐Sayeh H, et al. Loss to outcomes stakeholder survey: the LOSS study. Psychiatric Bulletin 2009;33(7):254‐7. [Google Scholar]
Zammit 2002
- Zammit S, Allebeck P, Andreasson S, Lundberg I, Lewis G. Self reported cannabis use as a risk factor for schizophrenia in Swedish conscripts of 1969: historical cohort study. BNJ 2002;325:1199‐201. [DOI] [PMC free article] [PubMed] [Google Scholar]
References to other published versions of this review
Rathbone 2008
- Rathbone J, Variend H, Mehta H. Cannabis and schizophrenia. Cochrane Database of Systematic Reviews 2008, Issue 3. [DOI: 10.1002/14651858.CD004837.pub2] [DOI] [PMC free article] [PubMed] [Google Scholar]