

ABSTRACT
Toll‐like receptors (TLR) control the activation of dendritic cells that prime CD4+ T cells in draining lymph nodes, where these T cells then undergo massive clonal expansion. The mechanisms controlling this clonal T cell expansion are poorly defined. Using the CD4+ T cell‐mediated disease experimental autoimmune encephalomyelitis (EAE), we show here that this process is markedly suppressed when TLR9 signaling is increased, without noticeably affecting the transcriptome of primed T cells, indicating a purely quantitative effect on CD4+ T cell expansion. Addressing the underpinning mechanisms revealed that CD4+ T cell expansion was preceded and depended on the accumulation of neutrophils in lymph nodes a few days after immunization. Underlying the importance of this immune regulation pathway, blocking neutrophil accumulation in lymph nodes by treating mice with a TLR9 agonist inhibited EAE progression in mice with defects in regulatory T cells or regulatory B cells, which otherwise developed a severe chronic disease. Collectively, this study demonstrates the key role of neutrophils in the quantitative regulation of antigen‐specific CD4+ T cell expansion in lymph nodes, and the counter‐regulatory role of TLR signaling in this process.
Keywords: neutrophil, CD4+ T cells, autoimmunity, Toll‐like receptor, EAE
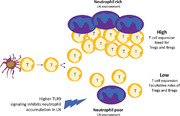
Adaptive immunity strongly relies on the clonal expansion of antigen‐specific CD4+ T cells following challenge. We found that neutrophils decisively contributed to this amplification, and that their inhibition via TLR9 signaling compensated for the lack of regulatory T or B cells in autoimmune disease, underlining the quantitative importance of this process.
Introduction
The development of CD4+ T cell responses is a stepwise process starting in draining lymph nodes with their priming by DC, which is followed by their clonal expansion and differentiation into various effector subsets.
DC control the earliest phases of T cell immunity, transporting antigens from peripheral tissues to draining lymph nodes (dLN) and presenting them to scanning recirculating T cells. Upon the recognition of their cognate antigens, T cells arrest their movement, and enter into a long‐lasting interaction with DC that can last up to 48 h [1]. Following this dialog, T cells regain their mobility, and initiate their clonal expansion [2]. The disengagement of the T cell from the DC is necessary for its proliferation, indicating that T cell clonal expansion takes place in spatial distance from the DC that mediated its priming. Productive T cell activation requires intrinsic signaling in DC via innate receptors such as Toll‐like receptors (TLR). Little is known about the role of TLR signaling in the control of the later events of T cell activation, such as the subsequent phase of clonal expansion.
Here, we investigated how TLR signals modulated CD4+ T cell responses in a model of EAE induced by immunization with the immunodominant peptide spanning the amino acids 35–55 of mouse myelin oligodendrocyte glycoprotein (MOG). This disease is associated with CNS inflammation and shares features with MS. It develops in a CD4+ T cell‐dependent manner, and is thus convenient to uncover novel mechanisms implicated in the development of CD4+ T cell responses.
Results and discussion
TLR agonists CpG‐B, PGN, LPS, and CpG‐A suppress EAE disease course
To study the effects of TLR activation in EAE, we added TLR agonists to the immunization cocktail used to induce disease including peptidoglycan (PGN), lipopolysaccharides (LPS), CpG‐A or CpG‐B oligonucleotides to engage TLR2, TLR4, and TLR9, respectively. Mice treated with these TLR agonists developed a lower global disease burden than untreated controls and a delayed disease onset (Fig. 1A and Supporting Information Appendix, Table S1). The protective effect was particularly pronounced for CpG‐B (Fig. 1A and Supporting Information Appendix, Table S1), which involved TLR9, as expected (Supporting Information Appendix, Fig. S1). We thus specifically investigated how CpG‐B mediated such beneficial effect.
Figure 1.
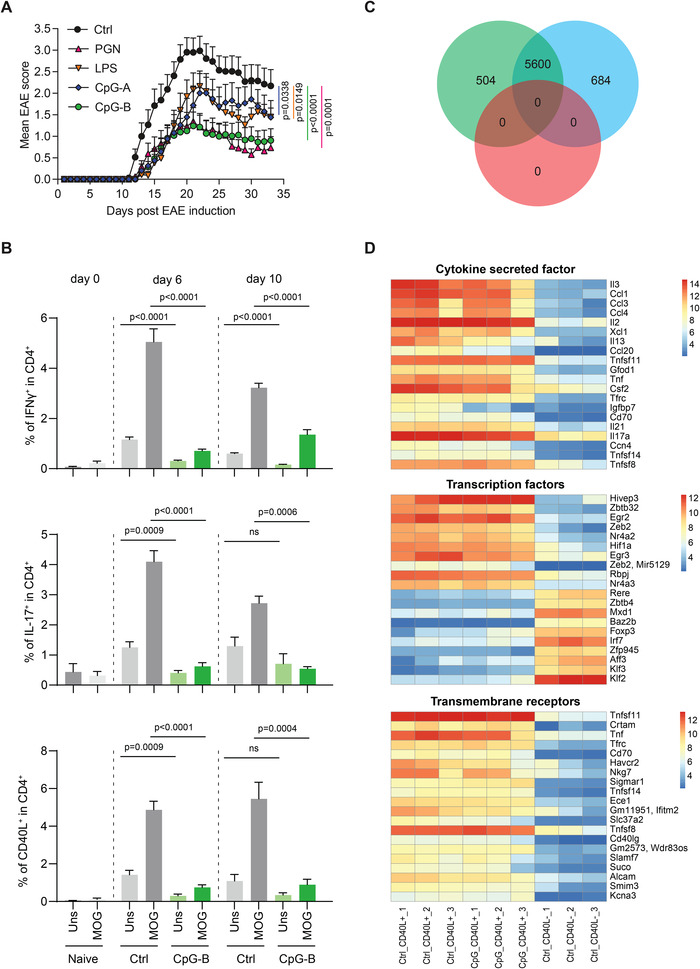
TLR agonists attenuate EAE severity by suppressing the expansion of autoreactive CD4+ T cells. (A) EAE was induced in C57BL/6 mice, with addition of TLR agonists PGN (n = 24), LPS (n = 19), CpG‐A (n = 16), CpG‐B (n = 26), or PBS (ctrl, n = 33). Data show clinical EAE scores (mean ± SEM). The statistical difference between each TLR agonist‐treated group to ctrl group was evaluated using unpaired two‐tailed t‐test. (B) C57BL/6 mice were immunized as in A with or without CpG‐B, and sacrificed on days 0, 6, and 10. DLN were collected and cells were cultured with MOG(35‐55) or left unstimulated for 6 h. Staining for CD4, IFNγ, IL‐17, and CD40L was then conducted, and cells were analyzed by flow cytometry. Data (mean ± SEM) show percentages of a pool of two independent experiments with two to four mice per experiment/group, and were analyzed using unpaired two‐tailed t‐test. (C‐D) EAE was induced in C57BL/6 mice with or without CpG‐B. Mice were sacrificed on day 9. dLN were harvested and cells cultured for 5 h with MOG(35‐55), anti‐CD40, and CD40L‐PE. CD40L+CD4+ and CD40L−CD4+ T cells were then sorted by FACS and analyzed by microarray. (C) Venn diagram depicting the number of genes differentially expressed between (i) CD40L+CD4+ cells and CD40L−CD4+ T cells from ctrl mice (green, 504 + 5600), (ii) CD40L+CD4+ cells from CpG‐B‐treated mice and CD40L−CD4+ T cells from ctrl mice (blue, 684 + 5600), (iii) CD40L+CD4+ cells from ctrl mice and CD40L+CD4+ cells from CpG‐B‐treated mice (pink, 0). (D) Heatmaps showing the expression levels of “cytokine secreted factor”, “transcription factors”, and “transmembrane receptors” differentially expressed between CD40L+CD4+ T cells and CD40L−CD4+ T cells from control mice. Microarrays in triplicate. Expression amounts normalized using GCRMA are shown (Log2 transformed). Differential expression is defined as |log2 Fold Change| > 1.3 and an adjusted P‐value < 0.01.
CpG‐B suppresses the magnitude of the CD4+ T cell response in dLN
EAE involves autoreactive CD4+ T cells that infiltrate the CNS [3]. We compared the activation of encephalitogenic CD4+ T cells in dLN, and the accumulation of immune cells in CNS, in CpG‐B‐treated and control mice.
The autoreactive CD4+ T cell response peaked in dLN (inguinal, paraaortic, and popliteal LN) on day 6 p.i. in control mice, as shown by the frequency of CD4+ T cells up‐regulating the expression of IFN‐γ, IL‐17, or CD154 (CD40L) following a short 6 h re‐stimulation with MOG(35‐55) in vitro (Fig. 1B and Supporting Information Appendix, Fig. S2). The autoreactive CD4+ T cell response was markedly reduced in dLN of CpG‐B‐treated mice compared to controls (Fig. 1B and Supporting Information Appendix, Fig. S2A). The reduced accumulation of autoreactive CD4+ T cells in CpG‐B‐treated mice was confirmed using MOG‐reactive TCR‐transgenic CD4+ T cells from 2D2 mice labeled with the proliferation dye carboxyfluorescein diacetate succinimidyl Ester (CFSE) prior to adoptive transfer (Supporting Information Appendix, Fig. S2B). This experiment suggested that autoreactive CD4+ T cells proliferated but with an impaired overall expansion in the dLN of CpG‐treated mice. This was not caused by the delocalization of the T cell response to the spleen because the autoreactive CD4+ T cell response was also impaired in the spleen (Supporting Information Appendix, Fig. S3). As expected, the suppression of the autoreactive CD4+ T cell response was not observed in Tlr9‐deficient mice (Supporting Information Appendix, Fig. S4).
We next assessed the accumulation of immune cells in CNS and the level of tissue damage in this organ by histology (Supporting Information Appendix, Fig. S5). The spinal cord of control mice displayed a massive accumulation of CD3+ T cells as well as F4/80+ macrophages, and the activation of resident microglia/myeloid cells on day 19 p.i. (Supporting Information Appendix, Fig. S5). In contrast, leukocyte infiltration was barely detectable in the spinal cords of CpG‐B‐treated mice (Supporting Information Appendix, Fig. S5).
We conclude that CpG‐B protects mice from EAE by inhibiting the induction of pathogenic CD4+ T cell response in dLN, thus reducing cell infiltration into CNS.
Autoreactive CD4+ T cells display a normal transcriptome in CpG‐B‐treated mice
We next assessed how CpG‐B treatment affected the quality of the autoreactive CD4+ T cell response. To this end, we determined the transcriptome of MOG‐reactive CD4+ T cells isolated from dLN of CpG‐treated and control mice.
Autoreactive CD4+ T cells were obtained on day 9 p.i. by isolating CD4+CD40L+ T cells from cultures of dLN cells stimulated for 5 h with MOG(35‐55) (Supporting Information Appendix, Fig. S6). Autoreactive CD4+ T cells (CD4+CD40L+) from control mice differed markedly from CD4+CD40L− T cells isolated from the same culture, showing the differential expression of 6104 genes (corresponding to 7841 Affymetrix probes, p<0.01) (Fig. 1C and Supporting Information Appendix, Table S2). We compared the expression of transmembrane receptors, transcription factors, and cytokines in CD4+CD40L+ T cells from control and CpG‐B‐treated mice compared to CD4+CD40L− T cells from control mice (Fig. 1D). As expected, autoreactive CD4+ T cells displayed a higher expression of the transmembrane receptors Cd40l and Tnfsf11 (RANKL), which are essential for EAE induction [4]. They also displayed a higher expression of the transcription factor Rbpj, in line with a role for NOTCH signaling in the differentiation of encephalitogenic T cells [5]. The expression of the secreted factors Csf2 (GM‐CSF) and Il17a, known to be implicated in pathogenic T cell activity in this disease, were also up‐regulated in these T cells (Fig. 1D). Strikingly, no gene was differentially expressed between autoreactive CD4+ T cells from CpG‐treated and control mice (Fig. 1 C and D).
We conclude that CpG‐B treatment suppresses EAE development by quantitatively reducing the autoreactive CD4+ T cell amplification locally in dLN while having no qualitative effect on their gene expression profile.
CpG‐B suppresses the accumulation of neutrophils that promote CD4+ T cell expansion in dLN
In order to identify how CpG‐B regulated T cell expansion in an unbiased manner, we defined the transcriptome of total dLN cells from CpG‐treated and control mice on days 1 and 3 p.i., as well as from naïve mice. The CpG treatment resulted in larger transcriptome changes on day 1 p.i. (Supporting Information Appendix, Table S2), showing differential signals for 669 genes (corresponding to 804 Affymetrix probes), than on day 3 p.i. when only 17 genes were differentially expressed (Supporting Information Appendix, Table S3). This is in agreement with the notion that TLR primarily modulate the early steps of innate immunity. To identify whether the transcriptome changes induced by CpG‐B reflected the differential accumulation of specific cell types in dLN, we analyzed these data using xCell, a deconvolution software to infer cell subsets abundance from transcriptomes [6]. This in silico analysis suggested that EAE induction was associated with an accumulation of neutrophils in dLN on day 3 p.i. that was suppressed in CpG‐treated mice (Fig. 2A). Supporting this notion, several downregulated genes in CpG‐B‐treated groups on day 3 p.i. are known to be expressed in neutrophils [7, 8, 9] (Fig. 2B). We therefore quantified neutrophils (CD11b+Ly6ClowLy6G+ cells) in dLN by flow cytometry. Neutrophils accumulated in dLN on day 3 p.i., and as predicted, their number was drastically reduced in CpG‐B‐treated mice (Fig. 2C). The reduction of neutrophil accumulation on day 3 p.i. temporally preceded the amplification of the autoreactive CD4+ T cell response, which could not be detected on days 1 and 3 p.i., and showed a clear augmentation on day 6 p.i (Fig. 2D). Thus, CpG‐B treatment impairs the accumulation of neutrophils in dLN just before the expansion of autoreactive CD4+ T cells.
Figure 2.
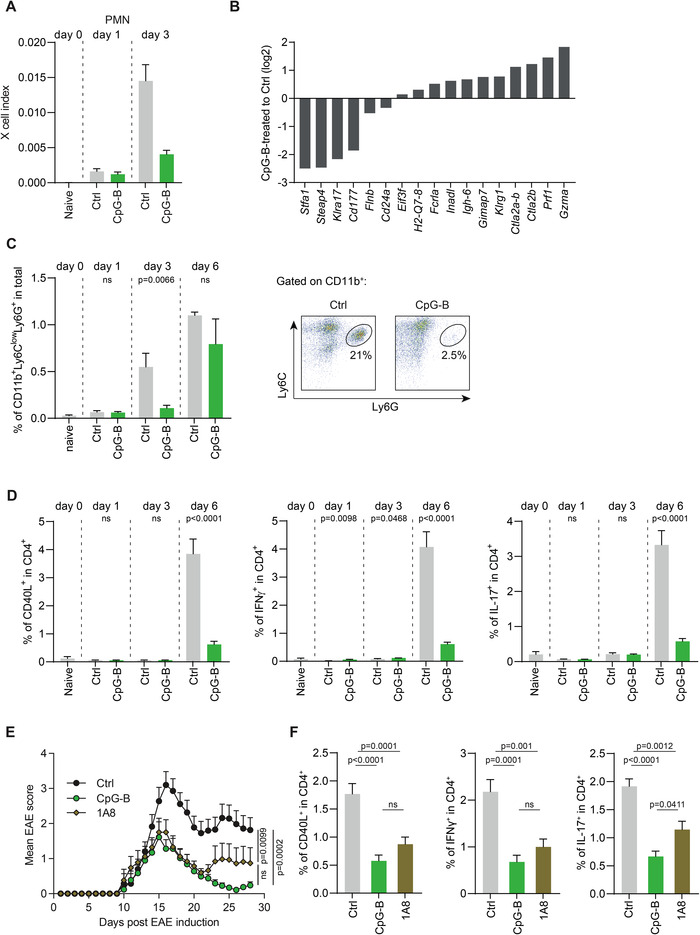
CpG‐B treatment inhibits the accumulation of T cell‐activating neutrophils in dLN. Affymetrix whole genome array analysis were conducted on total dLN cells of ctrl and CpG‐B‐treated mice on days 0, 1, and 3 post EAE induction. (A) The abundance of neutrophils in dLN was inferred from these data using xCell index analysis. (B) Data show the fold change (log2) for the 17 genes differentially expressed between dLN of ctrl and CpG‐B‐treated mice on day 3. (C) FACS analysis of neutrophils in dLN on days 0, 1, 3, 6 after EAE induction (pool of three independent experiments with two or five mice per experiment; mean ± SEM; unpaired two‐tailed t‐test) (left), and representative dot plots (right). (D) EAE was induced in C57BL/6 mice with or without CpG‐B. On days 0, 1, 3, and 6, dLN were collected and cells stimulated with MOG(35‐55) before being analyzed by flow cytometry to determine the percentages of CD40L‐, IFNγ‐, and IL‐17‐expressing CD4+ T cells. Data show mean ± SEM of two independent experiments with three to four mice per experiment/group. Unpaired two‐tailed t‐test. (E and F) EAE was induced in C57BL/6 mice with or without CpG‐B. Some mice not treated with CpG‐B received 300 μg anti‐Ly6G on days 2 and 4. (E) Data show clinical EAE scores (mean ± SEM). Pool of two independent experiments with 4–5 mice per experiment/group. Data were compared using one‐way ANOVA. (F) Mice were sacrificed on day 6, and dLN cells stimulated with MOG(35‐55) for 6 h before FACS analyses. Data show the percentages of CD40L‐, IFNγ‐, and IL‐17‐expressing CD4+ T cells (mean ± SEM). Two independent experiments with three to four mice per experiment/group. Unpaired two‐tailed t‐test.
To investigate whether the neutrophil accumulation on day 3 p.i. was causally implicated in the CD4+ T cell expansion observed on day 6 p.i., we treated control mice with an anti‐Ly6G antibody (1A8) on days 2 and 4 p.i. to mimic the effect of CpG‐B on these cells by selectively reducing the number of neutrophils after T cell priming by DC (Supporting Information Appendix, Fig. S7). Remarkably, mice treated with 1A8 displayed a less severe EAE than controls (Fig. 2E), alike their CpG‐B‐treated counterpart, and a lower autoreactive CD4+ T cell response than controls on day 6 p.i. (Fig. 2F), indicating that reducing neutrophil numbers in dLN after the initial priming of T cells by DC was sufficient to reduce the pathogenic T cell response. Noteworthy, the normal accumulation of neutrophils in dLN at later time points in CpG‐treated mice (day 6, Fig. 2C) was unable to compensate for their earlier deficit, underlining the importance of timing of their presence.
We conclude from these experimental results that neutrophil accumulation in dLN is a key amplifier of autoreactive CD4+ T cells expansion locally, and subsequently of the severity of EAE, in a manner that is controlled by TLR9 signaling.
CpG‐B suppresses EAE in mice lacking regulatory B cells or regulatory T cells
In order to address the importance of the regulatory effect achieved by TLR9 engagement, we assessed whether CpG‐B could protect mice lacking regulatory CD4+Foxp3+ T cells (Tregs) or regulatory B cells (Bregs), which are two essential pathways of immune regulation [10, 11] from EAE.
As expected, the EAE course was more severe in B cell‐deficient mice than in controls (Fig. 3A). CpG‐B achieved a remarkable protective effect in the absence of B cells, reducing EAE severity and restoring complete remission from disease (Fig 3A). This was associated with the inhibition of the autoreactive CD4+ T cell response on day 6 p.i. (Fig. 3B) and of the accumulation of neutrophils in dLN on day 3 p.i. (Fig. 3C). Thus, CpG‐B preserved its immune‐modulatory effect in the absence of B cells, and even compensated for the lack of Bregs to restore disease resolution.
Figure 3.
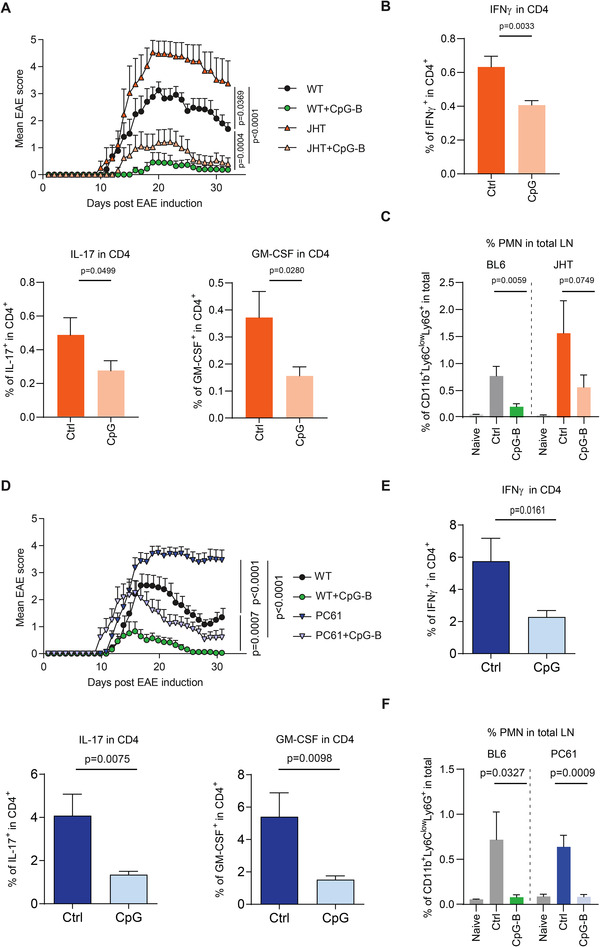
CpG‐B suppresses EAE independently of B cells and Tregs. (A) EAE was induced in C57BL/6 mice and JHT mice with or without CpG‐B. Data show clinical EAE scores (mean ± SEM). Two independent experiments with 4–6 mice per experiment/group. Cumulative disease scores were compared by one‐way ANOVA. (B) EAE was induced in JHT mice with or without CpG‐B. On day 10, splenocytes were collected and stimulated for 6 h with MOG(35‐55). FACS analyses were performed to determine the percentages of IFNγ‐, IL‐17‐, and GM‐CSF‐expressing CD4+ T cells. Data (mean ± SEM) of two independent experiments with 3–4 mice per experiment/group. (C) EAE was induced in C57BL/6 and JHT mice, with or without CpG‐B treatment, and dLN were collected on day 3 to determine the percentage of neutrophils by FACS analysis. Data (mean ± SEM) from two independent experiments with 3 mice per experiment/group. (B‐C) data analyzed using unpaired one‐tailed t‐test. (D‐F) C57BL/6 mice were treated with anti‐CD25 (PC61) i.v., and EAE was induced 3 days later with or without CpG‐B, including untreated mice as controls. (D) Data show clinical EAE scores (mean ± SEM) of two independent experiments with 4–6 mice/group per experiment/group. Disease burdens were compared using one‐way ANOVA. (E) Splenocytes were isolated from anti‐CD25‐treated mice that received CpG‐B or not (ctrl) on day 10 after EAE induction, and stimulated with MOG(35‐55) for 6 h to determine the percentages of IFNγ‐, IL‐17‐, and GM‐CSF‐expressing CD4+ T cells by flow cytometry. Data (mean ± SEM) from two independent experiments with 3–4 mice per experiment/group. (F) Three days after EAE induction, dLN were collected to determine the percentages of neutrophils by FACS analysis. Data (mean ± SEM) from two independent experiments with three mice per experiment/group. (E‐F) data compared using unpaired one‐tailed t‐test.
We next evaluated the effect of CpG‐B in Treg‐depleted mice. Treg depletion resulted in a severe chronic disease, whereas control mice entered in remission a few days after disease onset (Fig. 3D), as previously described [12]. Strikingly, the administration of CpG‐B reduced disease severity and restored disease remission in Treg‐depleted mice, thus compensating for the lack of Tregs. This beneficial effect was associated with the reduction of the encephalitogenic CD4+ T cell response (Fig. 3E), and of the accumulation of neutrophils in dLN (Fig. 3F).
This shows that TLR9 engagement can compensate for defects in Tregs or Bregs by reducing the accumulation of both neutrophils and autoreactive CD4+ T cells in dLN. This highlights neutrophil accumulation in dLN as a key driver of CD4+ T cell activation. It was previously highlighted that neutrophils migrating from inflamed skin contributed to T cell activation in dLN within the first 36 h after immunization [13]. Our data demonstrate that neutrophils additionally contribute to T cell immunity later, controlling the expansion of CD4+ T cells between 48 h and day 6 p.i. How do neutrophils drive T cell expansion? Several mechanisms can be envisioned. Neutrophils can present antigen to CD4+ T cells [14] or fuse with DC to form a “hybrid APC” [15, 16]. Neutrophils can also secrete IL‐1 [17], IL‐6 [18], IL‐12 [19], and the antimicrobial peptide cathelicidin [20] as well as produce neutrophil extracellular traps (NETs) [21] that can all directly increase T cell expansion. It was previously reported that neutrophils could potentiate human CD4+ T cell activation [21], and that neutrophils displayed a primed phenotype in MS, potentially facilitating pathogenic T cell immunity in this disease [22]. Neutrophils might be a key source of T cell stimulating molecules in dLN. It is tempting to speculate that the ability of TLR signaling to shunt this neutrophil‐mediated amplification of T cell immunity might be able to overcome the predisposing effects of some genetic polymorphisms associated with reduced activities of Tregs or Bregs that increase the risk of developing autoimmune diseases. This would be consistent with the hygiene hypothesis, which proposes that exposure to some microbial products protects from immune‐mediated inflammatory diseases [23]. An important future step will be to identify the cell type mediating the suppressive function of TLR9, which is expressed in DC, neutrophils, and B cells [24, 25, 26]. Although CpG‐B achieved a protective effect in B cell‐deficient mice, intrinsic TLR9 signaling induced IL‐10 expression in B cells and promoted their regulatory function in vivo [27]. Several cell types might thus contribute to the suppressive function of TLR9. Such regulatory activities might be defective in diseases in which TLR9 function is reduced as previously observed for B cells in systemic lupus erythematosus [28].
Concluding Remarks
We have addressed how TLR engagement modulated CD4+ T cell‐mediated autoimmunity and found that TLR engagement could protect mice from EAE, even in the presence of major defects in Bregs or Tregs. This protective effect was associated with the diminution of the accumulation of neutrophils in dLN and a lower antigen‐reactive CD4+ T cell response.
Material and methods
Mice
C57BL/6, C57BL/6JHT, 2D2, and TLR9−/− mice were bred under specific pathogen–free conditions in the Bundesinstitut für Risikobewertung (BfR), Berlin. All mice used were at the age of 6–10 weeks. All experiments were validated by LAGeSo Berlin (G0151/09), and animals were treated according to German legislation.
EAE induction and scoring
EAE was induced by subcutaneous immunization of 50 μg MOG(35‐55) peptide (Synthesized at Institute of Medical Immunology, Charité, Berlin) emulsified in Complete Freund´s Adjuvant (Sigma–Aldrich) containing 400 μg Mycobacteria, and intravenous injection of two doses pertussis toxin (Sigma–Aldrich) on day 0 and 2 after immunization. In the case of TLR agonists–treated groups, 50 μg LPS (Sigma‐Aldrich), PGN (Fluka), CpG‐A (TIB MOLBIOL), or CpG‐B (TIB MOLBIOL) were added into the MOG(35‐55)/CFA mixture before emulsification. Clinic signs of EAE were assessed with the following 0–6 scoring system: 0 no signs; 1 flaccid tail; 2 impaired righting reflex; 3 paralysis of one hind limb; 4 paralysis of both hind limbs; 5 paralysis of both hind limbs, severe weight loss (20 %) and reduced mobility (mice with a score of 5 were sacrificed); 6 moribund or dead (moribund mice were sacrificed).
Cell surface staining for flow cytometry analysis
After the preparation of a single cell suspension, cells were incubation with 30 μg/ml FcγR blocking antibody for 15 min at 4°C to block unspecific binding. Cells were then incubated with fluorophore‐conjugated or biotinylated antibodies specific for CD4 (DRFZ house‐made), CD11b (BD Pharmingen), Ly6C (BD Pharmingen), or Ly6G (BD Pharmingen) in 50 μl PBS/BSA for 20 min at 4°C. Unbound antibodies were removed by washing with PBS/BSA. Biotinylated antibodies were detected with fluorophore‐conjugated streptavidin (20 min incubation at 4°C). After two times washing with PBA/BSA, stained samples were resuspended in 200 μl PBS/BSA. CD4+CD25− T cells were labeled with CFSE to follow proliferation following Manufacturer's instructions, incubating cells with 5 mM CFDA‐SE for 3 min at room temperature followed by the addition of serum‐containing medium to stop the reaction. For the detection of dead cells, PI or DAPI were added directly before acquisition by the flow cytometer.
MOG(35‐55) stimulation for intracellular cytokine staining
After the preparation of a single cell suspension, the total cell number of each sample was counted with counting chamber and the suspension was diluted to a density of 8 × 10⁶ cells/ml with complete RPMI. A total of 4 × 10⁶ cells were plated into the wells of a 48‐well plate. Stimulation buffer made of RPMI with MOG(35‐55) (final concentration of 20 μg/ml) and monensin (according to manufacturer's recommendations, “Golgi Stop,” BD) or only Golgi Stop as unstimulated control were added and cells incubated for 6 h at 37°C and 5% CO2. After staining for cell surface molecules, cells were fixed and permeabilized with the intracellular staining kit (BD Pharmingen) according to the manufacturer's recommendations. Subsequently, cells were incubated with fluorophore‐conjugated antibodies specific for IFN‐γ (BD Pharmingen), IL‐17 (BD Pharmingen), GM‐CSF (eBioscience), and CD40L (Miltenyi Biotec GmbH) for 30 min at 4°C. After two times washing with 1× Perm/wash buffer, cell pellets were resuspended in PBS/BSA and analyzed by flow cytometer.
Histological analysis
Mice were killed by CO2 asphyxiation. The spines between cervical and lumbar position were removed and placed in 10% formalin for 2–7 days with 0.5 m EDTA (pH 8.0) at room temperature in the dark. Subsequently, the spines were embedded in paraffin until being cut into sections for histological analysis. Spine sections after being deparaffinized were first rehydrated with distilled water, and were subsequently incubated with primary antibodies specific for CD3 (Dako, Glostrup), F4/80 (eBioscience), or Iba‐1 (Wako) for 30 min, followed by biotinylated donkey anti‐rat or donkey anti‐rabbit secondary antibodies (Dianova). The streptavidin‐AP kit was used for detection.
MOG‐reactive (CD4+CD40L+) and –nonreactive (CD4+CD40L−) T cell isolation
C57BL/6 mice were immunized to induce EAE with or without CpG treatment according to our standard protocol. 9 days later, dLN (a pair of popliteal LN, paraaortic LN, and inguinal LN) and spleens were collected and processed into single cell suspension, separately. The cells were subsequently co‐cultured with MOG(35‐55) peptide (20 μg/ml) and a mixture of anti‐CD40, anti‐CD28, as well as anti‐CD40L‐PE from a commercial kit (Miltenyi Biotec GmbH). Five hours later, CD4‐positive T cells were first enriched by MACS after staining the cells with anti‐CD4 beads (Miltenyi Biotec GmbH) and subsequently subjected to FACS to sort CD4+CD40L+ cells after fluorophore‐conjugated CD4 staining (CD4‐pacific blue, Clone: RM4‐5) with a bin channel including CD8 (53‐6.7) and a marker staining dead cells (NHPO). FACS settings were always controlled with LN cells which were cultured in parallel but without MOG(35‐55) peptide. Sorted CD4+CD40L+ cells were then quickly checked for their purities and directly lysed with RLT buffer containing 1% ß‐mercaptoethnol (Invitrogen). Cell lysates were then stored at ‐80 degree.
For the isolation of CD4+CD25− T cells, spleens, popliteal LNs, paraoartic LNs, inguinal LNS, and branchial LNs were taken from 2D2 mice. After single cell preparation, CD4+ T cells were enriched through depletion of CD11b+, CD11c+, DX5+, CD8+, and CD19+ cells by adding respective antibody‐conjugated magnetic beads for magnetic MACS separation. CD25+ were then removed by staining enriched CD4+ T cells with anti‐CD25‐PE and anti‐PE magnetic beads, followed by MACS separation. Purity of CD4+CD25− cells was routinely above 90%. A total of 1 × 10⁶ 2D2 CD4+ T cells was then transferred per recipient mouse.
RNA isolation and Affymetrix microarray hybridization
RNeasy Mini Kit (Qiagen) was used to extract total RNA from the above isolated CD4+CD40L+ and CD4+CD40L− T cells, and live cells of draining LNs (inguinal LNs, popliteal LNs and paraaortic LNs) that were collected on day 3 after EAE induction. Contaminating genomic DNA was eliminated with an on‐column DNA digestion step (Qiagen). The integrity and amount of isolated RNA was assessed for each sample using an Agilent 2100 Bioanalyzer (Agilent Technologies) and a NanoDrop ND‐1000 spectrophotometer (NanoDrop Technologies, Wilmington, DE, USA). Biotinylated cRNA was synthesized from 100 μg total RNA using the recommended reagents (Affymetrix) suggested in the technical manual for GeneChip 3´IVT Express Kit Labeling Assay. 15 μg fragmented cRNA were hybridized to Affymetrix Mouse Genome 430 2.0 GeneChips. The arrays were scanned with an Affymetrix GeneChip Scanner 3000. Successful chip hybridization was determined by verifying comparable mean expression heights, levels of background, noise, percent of probe‐sets called present, the scaling factor, and the 3’‐5’ ratios of the GAPDH control gene. Additional quality checks were accomplished with the poly‐A RNA controls of four polyadenylated B. subtilis transcripts and biotinylated hybridization controls from Affymetrix. During data acquisition, each chip was globally normalized and scaled to an average intensity of 100 (target value TGT = 100) to adjust for global differences in hybridization. Normalisation has been done using gcrma R package. The significantly differentially regulated genes were calculated using limma R package with the Benjamini‐Hochberg procedure of p‐value adjustment for multiple testing. Differentially expressed genes were then selected and filtered using the gene ontology resource (www.geneontology.org) to focus on transmembrane receptors (GO:0016021, GO:0044214, GO:0004888, GO:0015238, GO:0022857) and cytokine/secreted factors (GO:0005576, GO:0005615, GO:0005125, GO:0005126, GO:0005179, GO:0005184, GO:0008009, GO:0008083, GO:0042379), as well as a compiled list of transcriptional regulators.
Depletion of neutrophils and regulatory T cells
To deplete neutrophils, 300 μg 1A8 (anti‐Ly6G; Bio X Cell) antibodies were intravenously injected on days 2 and 4 after EAE induction. The depletion efficiency was routinely checked on day 3 after EAE induction by quantification of CD11b+Ly6G+ cells in the peripheral blood of recipients. To generate regulatory T cell–depleted mice, 250 μg PC61 (anti‐CD25; DRFZ‐house‐made) were intravenously injected 3 days before EAE induction. The depletion efficiency was routinely controlled on the day of EAE induction by quantifying CD25+CD4+ T cell in blood.
Statistical Analysis
Statistical analysis was performed using GraphPad Prism (v5.02 and v7). Significance was determined using unpaired t‐test, or one‐way ANOVA.
Conflict of interest
The authors declare no commercial or financial conflict of interest.
Ethics approval for animal studies
All animal experiments were approved by LAGeSo Berlin, and animals were treated according to German legislation.
Guidelines for flow cytometry analysis
The authors adhered to the guidelines of flow cytometry analysis [29].
Author contributions
P.S. designed and performed the majority of experiments and analyzed data. M.R., U.S., V.L., E.C.G., T.R., E.H., A.A.K., and S.R. performed specific experiments. L.J. and P.B. performed the transcriptome analyses. P.S. and S.F. wrote the manuscript. S.F. conceived the ideas, oversaw the research program, and received funding.
Peer review
The peer review history for this article is available at https://publons.com/publon/10.1002/eji.202250059.
Abbreviations
- APC
antigen‐presenting cell
- Bregs
regulatory B cells
- dLN
draining lymph node
- LPS
lipopolysaccharides
- MOG
myelin oligodendrocyte glycoprotein
- NK
natural killer
- p.i.
post‐immunization
- PGN
peptidoglycan
- Tregs
regulatory T cells.
Supporting information
Fig. S1. CpG‐B treatment fails to protect mice from EAE in the absence of TLR9.
Fig. S2. CpG‐B treatment reduces CD4+ T cell activation in dLN.
Fig. S3. CpG‐B treatment hindered the inflammatory CD4+ T cell activation in spleen.
Fig. S4. CpG‐B treatment fails to reduce T cell responses in the absence of TLR9.
Fig. S5. CpG‐B treatment restrained immune cell infiltration in CNS.
Fig. S6. CD40L+CD4+ and CD40LCD4+ T cell sorting strategy.
Fig. S7. Neutrophil depletion efficiency.
Table S1: Summary of disease incidence, day of disease onset, maximum disease score, end disease score, and cumulative disease score.
Supplementary information
Supplementary information
Supplementary information
Acknowledgements
The authors thank Stefan H.E. Kaufmann for providing Tlr9‐deficient mice. The authors thank Van Duc Dang and Siska Wilantri for help with some of the experiments. The authors thank the DRFZ FCCF core facility for support with FACS cell sorting. The authors thank Heidi Schliemann and the Regine von Ramin Laboratory (DRFZ) for microarray assays. S.F. is supported by grants from the Deutsche Forschungsgemeinschaft (SFB‐650, TRR‐36, TRR‐130, FI‐1238/02), Hertie Stiftung, ERC PREG‐LAB 647696, and an AXA Chair in Translational Immunology.
Data availability statement
All datasets generated within the framework of this study are included in the manuscript and/or the supplementary files or available from corresponding author upon reasonable request. Transcriptome data are available on GEO database under the accession numbers GSE205600 (CD4+ T cells, related to Figure 1) and GSE205280 (total LN cells, related to Figure 2)
Links:
https://www.ncbi.nlm.nih.gov/geo/query/acc.cgi?acc = GSE205600
https://www.ncbi.nlm.nih.gov/geo/query/acc.cgi?acc = GSE205280
References
- 1. Bousso, P. , T‐cell activation by dendritic cells in the lymph node: lessons from the movies. Nat Rev Immunol 2008. 8: 675–684. [DOI] [PubMed] [Google Scholar]
- 2. Bohineust, A. , Garcia, Z. , Beuneu, H. , Lemaitre, F. and Bousso, P. , Termination of T cell priming relies on a phase of unresponsiveness promoting disengagement from APCs and T cell division. J Exp Med 2018. 215: 1481–1492. [DOI] [PMC free article] [PubMed] [Google Scholar]
- 3. Codarri, L. , Gyulveszi, G. , Tosevski, V. , Hesske, L. , Fontana, A. , Magnenat, L. , Suter, T. et al., RORgammat drives production of the cytokine GM‐CSF in helper T cells, which is essential for the effector phase of autoimmune neuroinflammation. Nat Immunol 2011. 12: 560–567. [DOI] [PubMed] [Google Scholar]
- 4. Guerrini, M. M. , Okamoto, K. , Komatsu, N. , Sawa, S. , Danks, L. , Penninger, J. M. , Nakashima, T. et al., Inhibition of the TNF Family Cytokine RANKL Prevents Autoimmune Inflammation in the Central Nervous System. Immunity 2015. 43: 1174–1185. [DOI] [PubMed] [Google Scholar]
- 5. Jurynczyk, M. , Jurewicz, A. , Raine, C. S. and Selmaj, K. , Notch3 inhibition in myelin‐reactive T cells down‐regulates protein kinase C theta and attenuates experimental autoimmune encephalomyelitis. J Immunol 2008. 180: 2634–2640. [DOI] [PubMed] [Google Scholar]
- 6. Tucker, A. , Mithoo, J. , Cleary, P. , Woodhead, M. , MacPherson, P. , Wingfield, T. , Davies, S. et al., Quantifying the need for enhanced case management for TB patients as part of TB cohort audit in the North West of England: a descriptive study. BMC Public Health 2017. 17: 881. [DOI] [PMC free article] [PubMed] [Google Scholar]
- 7. Tanaka, Y. , Matsumoto, I. , Iwanami, K. , Inoue, A. , Umeda, N. , Tanaka, Y. , Sugihara, M. et al., Six‐transmembrane epithelial antigen of prostate 4 (STEAP4) is expressed on monocytes/neutrophils, and is regulated by TNF antagonist in patients with rheumatoid arthritis. Clin Exp Rheumatol 2012. 30: 99–102. [PubMed] [Google Scholar]
- 8. Sasawatari, S. , Yoshizaki, M. , Taya, C. , Tazawa, A. , Furuyama‐Tanaka, K. , Yonekawa, H. , Dohi, T. et al., The Ly49Q receptor plays a crucial role in neutrophil polarization and migration by regulating raft trafficking. Immunity 2010. 32: 200–213. [DOI] [PubMed] [Google Scholar]
- 9. Stroncek, D. F. , Skubitz, K. M. and McCullough, J. J. , Biochemical characterization of the neutrophil‐specific antigen NB1. Blood 1990. 75: 744–755. [PubMed] [Google Scholar]
- 10. Fillatreau, S. , Sweenie, C. H. , McGeachy, M. J. , Gray, D. and Anderton, S. M. , B cells regulate autoimmunity by provision of IL‐10. Nat Immunol 2002. 3: 944–950. [DOI] [PubMed] [Google Scholar]
- 11. O'Connor, R. A. and Anderton, S. M. , Foxp3+ regulatory T cells in the control of experimental CNS autoimmune disease. J Neuroimmunol 2008. 193: 1–11. [DOI] [PubMed] [Google Scholar]
- 12. Hoehlig, K. , Shen, P. , Lampropoulou, V. , Roch, T. , Malissen, B. , O'Connor, R. , Ries, S. et al., Activation of CD4(+) Foxp3(+) regulatory T cells proceeds normally in the absence of B cells during EAE. Eur J Immunol 2012. 42: 1164–1173. [DOI] [PubMed] [Google Scholar]
- 13. Hampton, H. R. , Bailey, J. , Tomura, M. , Brink, R. and Chtanova, T. , Microbe‐dependent lymphatic migration of neutrophils modulates lymphocyte proliferation in lymph nodes. Nat Commun 2015. 6: 7139. [DOI] [PMC free article] [PubMed] [Google Scholar]
- 14. Culshaw, S. , Millington, O. R. , Brewer, J. M. and McInnes, I. B. , Murine neutrophils present Class II restricted antigen. Immunol Lett 2008. 118: 49–54. [DOI] [PMC free article] [PubMed] [Google Scholar]
- 15. Geng, S. , Matsushima, H. , Okamoto, T. , Yao, Y. , Lu, R. , Page, K. , Blumenthal, R. M. et al., Emergence, origin, and function of neutrophil‐dendritic cell hybrids in experimentally induced inflammatory lesions in mice. Blood 2013. 121: 1690–1700. [DOI] [PMC free article] [PubMed] [Google Scholar]
- 16. Matsushima, H. , Geng, S. , Lu, R. , Okamoto, T. , Yao, Y. , Mayuzumi, N. , Kotol, P. F. et al., Neutrophil differentiation into a unique hybrid population exhibiting dual phenotype and functionality of neutrophils and dendritic cells. Blood 2013. 121: 1677–1689. [DOI] [PMC free article] [PubMed] [Google Scholar]
- 17. Mufazalov, I. A. , Schelmbauer, C. , Regen, T. , Kuschmann, J. , Wanke, F. , Gabriel, L. A. , Hauptmann, J. et al., IL‐1 signaling is critical for expansion but not generation of autoreactive GM‐CSF+ Th17 cells. EMBO J 2017. 36: 102–115. [DOI] [PMC free article] [PubMed] [Google Scholar]
- 18. Lotz, M. , Jirik, F. , Kabouridis, P. , Tsoukas, C. , Hirano, T. , Kishimoto, T. and Carson, D. A. , B cell stimulating factor 2/interleukin 6 is a costimulant for human thymocytes and T lymphocytes. J Exp Med 1988. 167: 1253–1258. [DOI] [PMC free article] [PubMed] [Google Scholar]
- 19. Gately, M. K. , Desai, B. B. , Wolitzky, A. G. , Quinn, P. M. , Dwyer, C. M. , Podlaski, F. J. , Familletti, P. C. et al., Regulation of human lymphocyte proliferation by a heterodimeric cytokine, IL‐12 (cytotoxic lymphocyte maturation factor). J Immunol 1991. 147: 874–882. [PubMed] [Google Scholar]
- 20. Minns, D. , Smith, K. J. , Alessandrini, V. , Hardisty, G. , Melrose, L. , Jackson‐Jones, L. , MacDonald, A. S. et al., The neutrophil antimicrobial peptide cathelicidin promotes Th17 differentiation. Nat Commun 2021. 12: 1285. [DOI] [PMC free article] [PubMed] [Google Scholar]
- 21. Tillack, K. , Breiden, P. , Martin, R. and Sospedra, M. , T lymphocyte priming by neutrophil extracellular traps links innate and adaptive immune responses. J Immunol 2012. 188: 3150–3159. [DOI] [PubMed] [Google Scholar]
- 22. Naegele, M. , Tillack, K. , Reinhardt, S. , Schippling, S. , Martin, R. and Sospedra, M. , Neutrophils in multiple sclerosis are characterized by a primed phenotype. J Neuroimmunol 2012. 242: 60–71. [DOI] [PubMed] [Google Scholar]
- 23. Bach, J. F. , Revisiting the Hygiene Hypothesis in the Context of Autoimmunity. Front Immunol 2020. 11: 615192. [DOI] [PMC free article] [PubMed] [Google Scholar]
- 24. Krieg, A. M. , CpG motifs in bacterial DNA and their immune effects. Annu Rev Immunol 2002. 20: 709–760. [DOI] [PubMed] [Google Scholar]
- 25. Lindau, D. , Mussard, J. , Wagner, B. J. , Ribon, M. , Ronnefarth, V. M. , Quettier, M. , Jelcic, I. et al., Primary blood neutrophils express a functional cell surface Toll‐like receptor 9. Eur J Immunol 2013. 43: 2101–2113. [DOI] [PubMed] [Google Scholar]
- 26. Gururajan, M. , Jacob, J. and Pulendran, B. , Toll‐like receptor expression and responsiveness of distinct murine splenic and mucosal B‐cell subsets. PLoS One 2007. 2: e863. [DOI] [PMC free article] [PubMed] [Google Scholar]
- 27. Miles, K. , Heaney, J. , Sibinska, Z. , Salter, D. , Savill, J. , Gray, D. and Gray, M. , A tolerogenic role for Toll‐like receptor 9 is revealed by B‐cell interaction with DNA complexes expressed on apoptotic cells. Proc Natl Acad Sci U S A 2012. 109: 887–892. [DOI] [PMC free article] [PubMed] [Google Scholar]
- 28. Sieber, J. , Daridon, C. , Fleischer, S. J. , Fleischer, V. , Hiepe, F. , Alexander, T. , Heine, G. et al., Active systemic lupus erythematosus is associated with a reduced cytokine production by B cells in response to TLR9 stimulation. Arthritis Res Ther 2014. 16: 477. [DOI] [PMC free article] [PubMed] [Google Scholar]
- 29. Cossarizza, A. , Chang, H. D. , Radbruch, A. , Acs, A. , Adam, D. , Adam‐Klages, S. , Agace, W. W. et al., Guidelines for the use of flow cytometry and cell sorting in immunological studies (second edition). Eur J Immunol 2019. 49: 1457–1973. [DOI] [PMC free article] [PubMed] [Google Scholar]
Associated Data
This section collects any data citations, data availability statements, or supplementary materials included in this article.
Supplementary Materials
Fig. S1. CpG‐B treatment fails to protect mice from EAE in the absence of TLR9.
Fig. S2. CpG‐B treatment reduces CD4+ T cell activation in dLN.
Fig. S3. CpG‐B treatment hindered the inflammatory CD4+ T cell activation in spleen.
Fig. S4. CpG‐B treatment fails to reduce T cell responses in the absence of TLR9.
Fig. S5. CpG‐B treatment restrained immune cell infiltration in CNS.
Fig. S6. CD40L+CD4+ and CD40LCD4+ T cell sorting strategy.
Fig. S7. Neutrophil depletion efficiency.
Table S1: Summary of disease incidence, day of disease onset, maximum disease score, end disease score, and cumulative disease score.
Supplementary information
Supplementary information
Supplementary information
Data Availability Statement
All datasets generated within the framework of this study are included in the manuscript and/or the supplementary files or available from corresponding author upon reasonable request. Transcriptome data are available on GEO database under the accession numbers GSE205600 (CD4+ T cells, related to Figure 1) and GSE205280 (total LN cells, related to Figure 2)
Links:
https://www.ncbi.nlm.nih.gov/geo/query/acc.cgi?acc = GSE205600
https://www.ncbi.nlm.nih.gov/geo/query/acc.cgi?acc = GSE205280