

Abstract
Watersheds of the Great Lakes Basin (USA/Canada) are highly modified and impacted by human activities including pesticide use. Despite labeling restrictions intended to minimize risks to nontarget organisms, concerns remain that environmental exposures to pesticides may be occurring at levels negatively impacting nontarget organisms. We used a combination of organismal‐level toxicity estimates (in vivo aquatic life benchmarks) and data from high‐throughput screening (HTS) assays (in vitro benchmarks) to prioritize pesticides and sites of concern in streams at 16 tributaries to the Great Lakes Basin. In vivo or in vitro benchmark values were exceeded at 15 sites, 10 of which had exceedances throughout the year. Pesticides had the greatest potential biological impact at the site with the greatest proportion of agricultural land use in its basin (the Maumee River, Toledo, OH, USA), with 72 parent compounds or transformation products being detected, 47 of which exceeded at least one benchmark value. Our risk‐based screening approach identified multiple pesticide parent compounds of concern in tributaries of the Great Lakes; these compounds included: eight herbicides (metolachlor, acetochlor, 2,4‐dichlorophenoxyacetic acid, diuron, atrazine, alachlor, triclopyr, and simazine), three fungicides (chlorothalonil, propiconazole, and carbendazim), and four insecticides (diazinon, fipronil, imidacloprid, and clothianidin). We present methods for reducing the volume and complexity of potential biological effects data that result from combining contaminant surveillance with HTS (in vitro) and traditional (in vivo) toxicity estimates. Environ Toxicol Chem 2023;42:367–384. Published 2022. This article is a U.S. Government work and is in the public domain in the USA. Environmental Toxicology and Chemistry published by Wiley Periodicals LLC on behalf of SETAC.
Keywords: Pesticides, neonicotinoids, Laurentian Great Lakes, biological effects, high‐throughput screening
INTRODUCTION
The number, diversity, and volume of pesticides used across the globe are increasing, and the environmental impact of these chemicals on nontarget species is an ongoing topic of concern (Tang et al., 2021). For example, pesticides have been implicated as one of multiple factors in the reduced health and loss of bees (Tsvetkov et al., 2017; Woodcock et al., 2016) and collapse of a fishery in Japan (Yamamuro et al., 2019). Freshwater ecosystems are particularly vulnerable to nontarget effects, because pesticides have many routes to surface water and groundwater and integrate over large spatial scales (Carter, 2000). The result is that freshwater systems commonly have dozens of detectable pesticide parent compounds and/or transformation products present (Mahler et al., 2021; Nowell et al., 2018). Furthermore, potential biological impacts of pesticides estimated using benchmarks derived from organismal exposure experiments largely focus on the effects of single compounds when, in reality, aquatic organisms are exposed to a complex mixture of compounds that may interact and impact biota in unexpected complex ways (see Nowell et al., 2018; Schäfer et al., 2013).
Streams in the Great Lakes Basin (USA/Canada) are of particular interest regarding pesticides due to a combination of substantial urban and agricultural inputs. Urban and agricultural streams have distinct pesticide signatures, and variability in land use can be a strong driver in the variability of occurrence and concentration of pesticides across the Basin (Ankley et al., 2021; Baldwin et al., 2016; Hladik & Kolpin, 2016). For example, herbicides like atrazine and metolachlor, which are used in Midwestern corn and soybean production, are frequently detected at concentrations above benchmark values in agricultural streams (Hladik et al., 2018; Nowell et al., 2018). In contrast, in urban landscapes, pesticides are used in building materials, home and garden care, and personal care products, and insecticides like fipronil and imidacloprid have higher detection frequencies compared with streams in landscapes with other types of land use (Nowell et al., 2021). We therefore expect the potential impacts of pesticides on aquatic life to vary across Great Lakes tributaries and to be related to patterns of human disturbance in the form of both agriculture and urban land uses.
There are potential unintended biological impacts of pesticide exposures in the Great Lakes Basin given the distribution, number, magnitude, and different mixtures of pesticides in surface waters in the region. First, pesticides are wide‐spread; six herbicides or herbicide transformation products were detected by polar organic chemical integrative samplers at all 97 sites in a recent study of streams in an agricultural region of the Midwest that included tributaries to the Great Lakes (Van Metre et al., 2017). In addition, it has been demonstrated that some pesticides occur at toxicologically relevant concentrations; the herbicide atrazine, for example, frequently exceeds concentrations at which potential biological effects can occur in this region (Baldwin et al., 2016). However, even when benchmark or effects data are available for individual compounds, this likely underestimates the potential cumulative biological impact of pesticide mixtures present in the environment. For example, 28–85 pesticide‐related compounds/stream were detected in passive samplers that were deployed in Midwest streams (Van Metre et al., 2017), and a median of 25 compounds/stream surface water sample was detected during the growing season in the corn and soybean agricultural region in the Midwestern United States (Nowell et al., 2018). To identify specific compounds and sites of concern, using benchmarks derived from in vivo exposure studies in combination with information such as high‐throughput screening (HTS) data could present a more thorough view of the potential impacts of contaminants. This is facilitated by the expanding number of compounds with benchmarks as well as methods to evaluate complex mixtures of chemicals (Ankley et al., 2021; Corsi et al., 2019).
The concentration of a pesticide in the environment does not necessarily correlate with its probability to cause adverse biological effects, because pesticides can vary widely in their potency. In addition, evaluation of the potential ecological effects of pesticide mixtures must involve consideration of the mechanism of action of the chemicals present in the context of organisms of concern. For example, most herbicides are not particularly directly toxic to animals, but can be quite toxic to plants and other photosynthetic organisms, thereby resulting in potential indirect effects on animals through the loss of forage and/or habitat. However pesticides have also been detected at concentrations high enough to elicit direct toxicity, as evidenced by measured concentrations that exceed chronic fish and invertebrate benchmarks (Stackpoole et al., 2021). Effects‐based benchmark values for chemicals detected in environmental samples historically have been derived from whole‐organism assays with apical endpoints such as impaired survival, growth, and reproduction using organisms representing broad taxonomic groups of potential concern (i.e., plants, invertebrates, and vertebrates). Although they are useful for predicting population‐level outcomes relevant to higher level risk assessments, these types of whole‐organism assays can be time intensive and expensive; consequently, there are many compounds, including many pesticide transformation products for which in vivo data are not available. However, in recent years, advances in molecular biology, robotics, and bioinformatics have enabled the development of suites of in vitro assays and systems capable of rapidly assessing the bioactivity of large numbers of chemicals for which there are little (or no) in vivo toxicity data (Schroeder et al., 2016; Villeneuve et al., 2019).
The objective of our study was to evaluate the potential impact of pesticides and their transformation products on aquatic life in tributaries of the Laurentian Great Lakes (USA/Canada). Our goals were to: 1) describe the spatial and temporal occurrence of pesticides in tributaries of the Great Lakes and how those relate to patterns of human disturbance; 2) create metrics that summarize the large amount of information (216 compounds measured at 16 sites for 12 months with many benchmark values/compound) and accommodate different levels of information across compounds; and 3) use this metric to perform a risk‐based screening to prioritize the places where aquatic life is most likely to be deleteriously affected by pesticides and the compounds contributing most to these risk factors. To estimate potential impacts on aquatic organisms, we compared pesticide and transformation product concentrations detected in monthly water samples from 16 Great Lakes tributaries with in vivo aquatic life benchmarks (ALBs) and effect concentrations/potency in data from HTS assays (risk‐based screening). Based on that evaluation, we identified sites where pesticides have the greatest potential for adverse biological effects and those individual pesticides that are likely to be of greatest concern for aquatic organisms in the region. We prioritized sites and compounds by considering metrics that characterized occurrence, traditional benchmark, and HTS assay threshold exceedances, and the potential cumulative impact of mixtures of pesticides. These screening‐level results were intended to identify chemicals that warrant further investigation for verification of biological effects in laboratory or field assays and, if verified, for potential consideration in watershed management activities.
MATERIALS AND METHODS
Site description
Sixteen Great Lakes tributaries were selected for monitoring pesticide compounds in water. The tributaries selected were all in the United States and represent a gradient of agricultural, urban, and undeveloped land cover in their surrounding watersheds (Figure 1 and Supporting Information, Table S1), which was determined using the 2016 version of the National Land Cover Database (Jin et al., 2019). Sites were selected to coincide with the most downstream US Geological Survey (USGS) streamflow monitoring site, typically within the last few miles of the respective lake. At least one tributary was chosen in each of the five Great Lakes. Each tributary was categorized by dominant land cover characteristics including urban (>25% urban), row‐crop agriculture (crops; >30% crops), a mix of agricultural practices (Agmix; >40%) overall agriculture, but >15% pasture, and natural land cover (>40% forested or wetland). Samples from all sites were evaluated using targeted analyses for 226 pesticides and transformation products, and 10 of the 16 sites were monitored for six neonicotinoid insecticides (see Laboratory analysis).
Figure 1.
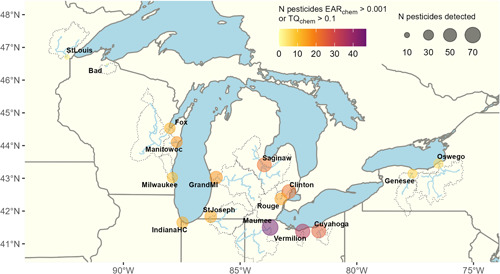
Map of the 16 stream sites where surface water samples were collected from Great Lakes tributaries, October 2015–September 2016. The points represent the sampling location, and the dotted lines represent the watersheds for each point, which were used to calculate the proportion of land use and land cover in each basin. Point size represents the number of unique pesticides that were detected at each site, and point color represents the number of pesticides that exceeded either the exposure activity ratio (EARchem) or the aquatic life benchmarks toxicity quotient (TQchem) thresholds used in our study. The number of compounds with exceedances includes estimated values for transformation products when toxicity information was missing from either database; in these cases, the parent compound values were used after accounting for molecular weight differences. N, number of.
Field collection
Water samples were collected on a fixed monthly interval from October 2015 to September 2016 to capture a range of streamflow and seasonal conditions. The Maumee River (OH, USA), a tributary of Lake Erie, was sampled an additional six times during May and June to capture variability during the primary agricultural pesticide application period. To ensure that a representative water sample was obtained at the time of collection, the equal‐width‐increment method (Edwards & Glysson, 1999) was used to collect subsamples across the width of the stream using a Teflon bottle and nozzle, and subsamples were composited and homogenized in a Teflon churn. The Teflon bottle, nozzle, and churn were triple‐rinsed with native water prior to use. Aliquots of water were subsampled and sent for analysis of pesticides and pesticide transformation products at three laboratories. Unfiltered water was dispensed from the churn into a 1‐L baked amber‐glass bottle (LAB033750000; C&G Containers Scientific) for analysis of six neonicotinoid insecticides (10 of the 16 sites). Filtered samples for analysis of pesticides and pesticide transformation products were collected from the churn using a 50‐ml plastic syringe (4850003000; Norm‐Ject® Luer Lock) and a 0.7‐µm glass fiber filter (6825‐2517; Whatman® GMF) into 40‐ml (glyphosate) and 20‐ml (remaining 224 compounds) amber‐glass vials (LU13‐A000‐A01B and LW74‐A000‐A01B; C&G Containers Scientific). The syringe was prerinsed with native water, and approximately 10 ml of sample was discharged through the filter and discarded prior to collection. A new filter was used for each sample and a new syringe was used at each site. Samples were stored in the dark on ice and within 48 h of collection were shipped overnight for analysis. All sampling equipment was cleaned between sites using Liquinox soap and tap water; 3× rinse with tap water; methanol spray; 2× rinse with MilliQ or deionized water; and rinse with pesticide‐grade blank water (WX0004‐1; MilliporeSigma OmniSolv®).
Field blanks were collected using pesticide‐grade blank water (WX0004‐1; OmniSolv). Field replicates were “churn splits,” collected from the same churn composite as environmental samples. Eighteen field blanks and nine field replicates were collected during environmental sampling (Supporting Information, Table S2). No contamination was detected in field blanks with all results reported as less than method detection limits (MDLs). The replicate samples resulted in 1771 comparisons of results from the full suite of parameters monitored. Confirmed nondetections were observed for 1601 of the paired results (i.e., both results less than the MDLs). Unconfirmed detections were observed in 20 of the paired results (i.e., a detection was only observed in one of the paired results above the MDL). When detections were confirmed in the paired results (n = 150), the median relative percent difference was 8%, and the 90th percentile relative percent difference was 24%.
Laboratory analysis
Chemical analyses included four different analytical methods that have all been previously described: 1) 226 pesticides and pesticide transformation products were quantified at the USGS National Water Quality Laboratory using direct aqueous‐injection liquid chromatography–tandem mass spectrometry (LC–MS/MS; Sandstrom et al., 2016); 2) six neonicotinoid insecticides were quantified at the USGS California Water Science Center using solid‐phase extraction followed by LC–MS/MS (Hladik & Calhoun, 2012); and 3) glyphosate was quantified at the USGS Organic Geochemistry Research Laboratory using two methods: 72 samples across all 16 sites were analyzed for glyphosate by enzyme‐linked immunosorbent assay (ELISA; Mahler et al., 2017), and to confirm the ELISA results, a subset of 29 samples were analyzed for glyphosate and glyphosate transformation product aminomethylphosphonic acid using LC–MS/MS by isotope dilution with online solid‐phase extraction (Meyer et al., 2009). All measured compounds with supporting metadata can be found in the Supporting Information, Table S3, and the final concentrations are provided in the Supporting Information, Table S4.
Data analysis
Data processing
To assess the potential biological impact of pesticides, various data processing steps were taken prior to evaluating concentrations in the context of potential effects. Imidacloprid was measured by the direct injection method (198 samples) and the solid‐phase extraction method (120 samples). When available, the solid‐phase extraction method was used because the solid‐phase method was designed specifically for neonicotinoids, whereas the direct injection method was designed for a broad pesticide schedule and not necessarily optimized for neonicotinoids. Relative to the solid‐phase method, the direct injection method overestimated concentrations of imidacloprid; therefore, for samples when only the direct injection method was available, we adjusted the concentration according to the slope fitted linear relationship between the two methods (slope = 0.48; Supporting Information, Figure S1).
Two methods of measuring glyphosate were also used but only the LC–MS/MS analysis measured concentrations of the glyphosate degradate aminomethylphosphonic acid. We estimated concentrations of aminomethylphosphonic acid in samples when the ELISA method was used by calculating the median ratio (2.03) of transformation product to parent in the 26 samples when both the parent and degradate were above the detection limit and applied this ratio to all samples in which glyphosate was detected with ELISA (n = 19). Two isomers of permethrin were analyzed (cis and trans), and we summed the concentration of the isomers to report a single value for permethrin for data analysis. Values below the detection limit for all compounds were assumed to be zero for analysis of potential biological impacts.
The Maumee River was sampled 18 times, and all other sites were sampled 12 times. In analyses in which the inclusion of all 18 samples would over‐represent the Maumee River relative to other sites, we excluded 6 additional samples from the analysis. We kept 12 samples such that the temporal spacing was approximately 1 month between samples, in a manner consistent with the other sites.
Aquatic life benchmarks
We used the US Environmental Protection Agency (USEPA) Office of Pesticide Programs' ALBs as one way to assess the biological relevance of measured pesticide concentrations (USEPA, 2019a). The database reports one or more benchmarks for each chemical that has been tested, including vascular and nonvascular aquatic plant values and acute and chronic measures for freshwater fish and invertebrates. These benchmarks are based on studies that expose organisms to pesticides, measure organismal‐level effects (in vivo studies), and typically represent the most sensitive lethal concentration that kills 50% of test organisms for acute toxicity studies and the no‐observed‐adverse‐effect level for chronic toxicity studies, each adjusted by their respective regulatory levels of concern (USEPA, 2019b). In the case of multiple benchmarks/chemical, we used the most conservative (lowest) reported toxicity value that could represent plant or animal and acute or chronic benchmarks.
Aquatic life benchmarks available for the chemicals in our study are included in the Supporting Information, Table S5. Toxicity quotients (TQchem) were calculated by dividing the measured concentration of a chemical in each sample by its corresponding ALB. As a conservative approach to prioritize parent compounds, we assumed that the parent and transformation products would have a similar mode of action and that the combined effects of parents and transformation products would be additive (TQparent). The TQparent was used to prioritize compounds because in most cases the parent compound is the active ingredient in the pesticide product and including effects from the parent and transformation products more closely represents the environmental impact of a parent compound. An exceedance was defined as when TQchem or TQparent was >0.1.
ToxCast biological activity estimates
We used the USEPA's (2020) ToxCast database Ver 3.2 as an additional way to evaluate the biological relevance of pesticide concentrations. The ToxCast database is a suite of HTS assays designed to evaluate cellular or molecular responses to chemical exposure (in vitro studies). Concentration–response curves are used to estimate the concentration at which a defined biological response occurs in an assay. We used activity cutoff concentrations (ACCs) as our benchmark value. The ACC is an assay‐specific metric determined as a multiplier of the baseline median absolute deviation of measured activity in the assay that provides an indication of the concentration at which the bioactivity measured first exceeds the baseline concentration. More thorough descriptions of its derivation are provided elsewhere (Filer et al., 2016; Judson et al., 2009). The ACC was selected over the activity concentration at 50% maximum activity (AC50) because the activity threshold is set at a uniform biological response level for all chemicals tested in the assay, whereas in the case of AC50, the response level at which the AC50 is defined varies by chemical. We accessed and analyzed the ToxCast data through the R package toxEval (Ver 1.2.0; De Cicco et al., 2018; R Core Team, 2022).
To generate ACC values as benchmarks for observed environmental concentrations of the pesticide and pesticide transformation products, we largely followed the methods described in Blackwell et al. (2017). Quality assurance flags provided as annotations in the ToxCast database were used to evaluate ToxCast ACC results for inclusion in the analysis. Chemical‐assay combinations were removed if they contained the flags “Borderline,” “OnlyHighest,” “GainAC50,” “Biochemical,” or “ACCLessThan” (Filer, 2019; Friedman et al., 2020). In addition, we inspected the remaining dose–response curves and excluded those that were not robust (e.g., nonmonotonic curves; see Supporting Information, Table S6, for all exclusions). The remaining assays used in our study are provided in the Supporting Information, Table S7.
Exposure activity ratios (EARs) were then calculated as the ratio of the measured concentration in the environment to its ACC value. A consideration when using ToxCast data to screen for potential biological effects is that it is unknown how measured in vitro effects relate to whole‐organism effects and, hence, what EAR value should be used in this screening process is not yet well established. Previous research by Corsi et al. (2019) found that an EAR value of 0.001 corresponded approximately to ALB values of 0.1; that is, they found that water quality benchmarks resulted in a similar list of priority chemicals as the use of EAR analysis at a approximately 1000 times lower concentration than reported ACC values in ToxCast. In our dataset, 56 compounds were represented in both the ToxCast and ALB databases (Supporting Information, Table S3); ACC values (minimum ACC value/chemical) were higher than minimum ALB values in 52 of 56 compounds, and the average ratio of ACC to benchmark value was 2842 (median value was 15; Supporting Information, Figure S2). For consistency with previous studies (Corsi et al., 2019) and because 100 was between our mean and median ratio, values above 0.001 and 0.1 for EAR and TQ, respectively, were considered threshold exceedances at which potential biological effects might occur. However, EARs are best viewed as a relative ranking tool that considers both differences in chemical concentration and its endpoint‐specific potency.
For pesticide concentrations below detection limits, we assumed a value of zero. For some compounds, the detection limit may be above benchmark values, in which case we could underestimate the potential biological effects of a compound by assuming a zero value. To evaluate the consequences of this decision, we calculated the EAR and TQ values of the detection limits for the pesticides measured in our study (Supporting Information, Figure S3). Only one compound (dicamba) had a detection limit that corresponded to an EAR more than 0.001, and no compounds had detection limits with TQ more than 0.1.
In addition, it is unknown how chemical‐specific bioactivities measured in ToxCast might interact to produce an effect in an organism. Because of this uncertainty, we summarized EAR values in two ways. First, as a conservative measure of potential biological impacts and a tool to screen individual chemicals, the impact of a compound was assumed to be additive across endpoints, and we summed all endpoint EARs for each chemical–sample combination (EARchem). Second, to evaluate for possible interactive effects, we assumed that in vitro bioactivity for a given endpoint would be additive across all compounds in a given sample. For each sample endpoint, we summed EAR values across all compounds (EARmix) detected. Then EARmix was used to identify sites where the cumulative mixture of compounds present may be of concern. To assess the importance of mixtures of compounds in the environment, we considered biologically relevant chemical mixtures to be those that had an EARmix > 0.001. We also evaluated the combination of chemicals that led to EARmix exceedances; a chemical was considered part of the mixture if it contributed >1% to an EARmix or had an EAR > 0.001 for that endpoint. For chemical prioritization, we summarized the mixtures by parent compounds; that is, if a parent and/or its transformation product were in a mixture, potential contributions were attributed to the parent compound.
Potential negative effects of pesticide transformation products
To evaluate the potential biological impact of a pesticide, the effect of both the parent and the transformation products should be considered. However, not all transformation products were measured, and there were no benchmark data for 30 of the measured transformation products (Supporting Information, Table S3). Excluding compounds that were detected but have no toxicity or bioactivity estimates could underestimate the total effect of the parent compound. For transformation products missing ALB or ACC benchmarks, we applied the parent value (when available) after accounting for differences in molecular weights. Most transformation products are less toxic than their parent compounds; however, some can be as or more toxic (Belfroid et al., 1998; Boxall et al., 2004; Miller et al., 2020). We therefore expect the actual impact of transformation products to be different from that estimated by the parent compound, but we consider this approach to be a more cautious estimate of the potential impact of pesticides than excluding transformation products without benchmark values.
Because we were interested in the cumulative effect of a parent pesticide and its associated transformation products, all metrics used for chemical prioritization were computed as the combined (summed) effect of the two. For site prioritization, we also used the estimated transformation product toxicity or bioactivity to evaluate potential biological effects at each site. In the following section, we discuss how these metrics were computed, and what assumptions were made during the calculations.
Prioritizing sites and compounds
To prioritize the 16 study sites, we created a relative hazard index (RHI) to evaluate the relative potential for negative biological impact of pesticides. The RHI was calculated from 11 metrics that used occurrence, TQ, and EAR values to assess the potential impact of pesticides at each site. The metrics used were 1–3: the maximum, median, and total number of chemicals detected; 4–7: the median and maximum of the maximum EARmix and TQchem values/sample; 8–9: the median number of EARmix and TQchem exceedances/sample; and 10–11: the number of months with exceedances for EARmix and TQchem values. Metrics were relativized by dividing the raw values by the maximum value across sites (so that 1 was equal to the highest value). A single average relative value for each category (TQ, EAR, occurrence) was calculated to account for different numbers of metrics/category. The average relative values were then weighted according to how confident we were about the category of metrics representing measurable organismal‐level impacts; we were most confident in the ALB data (TQchem weight = 3). Because it is hard to extrapolate in vitro responses to organismal‐level responses, a lower weight was given to ToxCast‐generated EAR metrics (EARmix weight = 2). Occurrence metrics are the least related to organismal impacts but are still useful in cases in which we had no biological effect data (occurrence weight = 1). The RHI was calculated as the weighted average of the three categories, such that a value of 1 corresponds to a site that always had the highest (most impacted) value across all metrics.
To prioritize pesticides of concern, we summed parent and transformation product EAR and TQ values for each parent‐sample (EARparent and TQparent). A parent was considered priority if it met any one of our following criteria: 1) if it exceeded benchmarks at 25% or more sites or in 10% or more samples (according to either EARparent or TQparent); 2) if a chemical was essential to an EARmix exceedance (e.g., EARmix < 0.001 without the chemical) in 25% or more sites or 10% or more samples; or 3) if a parent or associated transformation product was missing information in ToxCast and ALB information and occurred at 50% or more sites or in 20% or more samples. The findings from our study, including the TQ and EAR methods, the RHI, and final prioritization of sites and chemicals, are screening‐level results rather than a definitive determination of biological effects from exposures to these chemicals. These methods help to identify the chemicals that are most and least likely to have biological effects. Verification of effects from priority chemicals will require further investigation in laboratory or field assays.
RESULTS AND DISCUSSION
General overview of occurrence and concentration
Pesticides were detected in all Great Lakes tributaries we sampled despite large variations in watershed size, location, and land use (Figure 1 and Supporting Information, Table S1). Overall, pesticides and/or their transformation products were detected in 190 of 198 samples and all months of the year. Of the 231 parent and transformation compounds targeted analytically, 104 were detected (Supporting Information, Table S3). The median number of compounds detected across all samples was 16, the maximum number of compounds detected in a sample was 58, 14% of samples had at least 30 compounds, 34% of samples had at least 20 compounds, and 80% of samples had at least 10 compounds.
Our study represented a wide range of flow conditions both within and across sites; generally, flow conditions during the 2016 water year were well represented by the sample dates, and 2016 was representative of long‐term (~1986–2016) flow conditions (Supporting Information, Figure S4). Some notable exceptions include the Lake Superior tributaries, where 2016 was a wet year and the sample dates represented higher flow conditions than the long‐term conditions.
Herbicides and their transformation products were the most frequently detected chemicals (Figure 2 and Supporting Information, Table S3), comprised the 10 compounds with the highest frequency of detection, and were present in >50% of samples at 13 or more sites. Atrazine and two of its transformation products (deethylatrazine and hydroxyatrazine) were the most prevalent pesticide‐related compounds measured; all three were detected in >75% of samples and at every site. The herbicide metolachlor and one of its transformation products (metolachlor ethane sulfonic acid [ESA]) were the next two most frequently detected chemicals and were in 76% and 72% of samples, respectively. The neonicotinoid insecticides imidacloprid and clothianidin were the most frequently detected insecticides, with both detected in 44% of samples. Carbendazim was the most frequently detected fungicide (51% samples across 13 sites), followed by azoxystrobin (35% of samples) and propiconazole (21% of samples). Several of the pesticides and transformation products detected are frequently cited as commonly detected compounds in broad‐scale surface water studies; for example, atrazine, metolachlor, and some associated transformation products were detected in >80% of samples in 24 Midwestern US streams (Stackpoole et al., 2021). In addition, frequently detected compounds from these discrete samples were often detected in a companion passive sampler study at the same sites (Loken et al., 2022).
Figure 2.
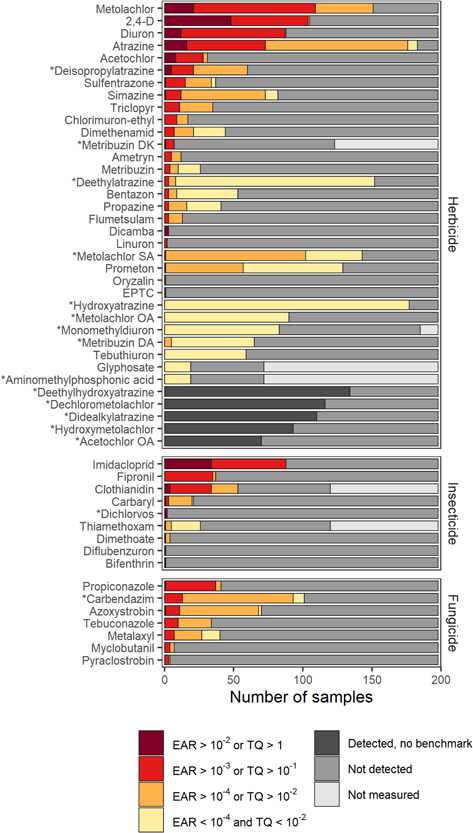
Summary of pesticide compounds (y axis) across all 198 samples (x axis) from 16 Great Lakes tributaries sampled for pesticides and pesticide transformation products measured between October 2015 and September 2016, including whether the compound was above ToxCast or aquatic life benchmarks (ALBs; red colors) or detected but below benchmarks (yellow colors). This figure does not include estimated toxicity quotient (TQ) or exposure activity ratio (EAR) values for compounds missing benchmark values; compounds that were detected but had no ToxCast or ALB information are in dark gray. Samples in which compounds were not detected (medium gray) or not measured (light gray) are also included. Only compounds that had a >25% detection rate or at least one benchmark (TQ or EAR) exceedance were included. Compounds with an asterisk are transformation products. EPTC = S‐ethyl dipropylthiocarbamate; OA = oxalic acid; DA = desaminometribuzin.
Pesticides were detected year‐round, but the occurrence and concentration of compounds peaked during the growing season; the median sum concentration of all detected pesticides across sites increased from May to August and peaked in July (1.51 μg/L), and the median number of pesticides detected peaked at the same time at approximately 20 compounds (Supporting Information, Figure S5). There were differences in the temporal patterns across sites and classes of compounds. Herbicide parent compound concentrations peaked in July, whereas herbicide transformation products had elevated concentrations throughout the year (Supporting Information, Figure S6). Insecticide detections and concentrations peaked in August, and there were no clear seasonal patterns for fungicides. Concentrations of pesticide‐related products in samples from urban sites had a more discrete summer peak (July), compared with agricultural sites, which had elevated concentrations from May to September (Supporting Information, Figure S6). Although the wetland and forest sites had much lower total summed concentrations than other site categories overall, the wetland site (St. Louis River) had concentrations comparable to those of the urban sites during its peak (September), which was driven by the herbicides triclopyr and 2,4‐D.
Prioritizing times, places, and pesticides of concern
Prioritizing the chemicals and sites of potential biological concern in Great Lakes tributaries involves several considerations; the number, timing, co‐occurrence, magnitude, frequency, toxicity, and ubiquitousness of pesticides in surface waters can all contribute to the potential negative impacts on aquatic biota. Any one of these measures is an imperfect way to prioritize sites or chemicals; for example, chemicals are differentially represented in ToxCast and ALBs, and we are more confident in the potential biological effects calculated using ALBs because they are organismal‐level tests. In our study, 64 and 65 of the 104 detected pesticides were in ToxCast and ALB, respectively, and 56 were represented in both whereas 31 were not represent represented in either (Supporting Information, Table S3). The eight additional compounds that were represented by ToxCast but not ALBs were all transformation products, and all compounds that were not represented in either database were transformation products (25 herbicide transformation products and 6 insecticide transformation products). In addition, the potential biological impact resulting from chemical mixtures is not well understood based on data from single chemicals. Therefore, using several metrics rather than a single metric may be a more robust way to prioritize the sites and chemicals of greatest concern. The metrics we used in this prioritization are an attempt to capture features of the severity (magnitude), complexity (mixture), persistence (temporal), and ubiquitousness (spatial) of potential biological impacts of pesticides in surface waters.
Temporal patterns of potential biological impacts
Although potential biological effects of pesticides were greatest in the summer months, pesticides likely present a year‐round threat to aquatic biota in the Great Lakes Basin (Supporting Information, Figure S6). There were threshold exceedances for all classes of compounds throughout the year (Figure 3 and Supporting Information, Figure S7). The number of chemicals with EAR and TQ exceedances peaked in the summer, but TQ values showed a stronger summer signal relative to EAR values (Figure 3 and Supporting Information, Figure S8). Half of all sites had at least one compound with TQchem > 1 in July and August, and these high July and August TQ values were largely insecticides that had much lower EAR values. Both TQchem and EARchem exceedances indicated potential negative biological effects at 50% or more of sites in every month of the year (Supporting Information, Figure S6). The TQparent exceedances for herbicides also peaked during the growing season (May–September) at mixed agriculture, row crop, and urban sites (Supporting Information, Figure S7), but EARparent values indicated elevated threshold exceedances throughout the year (Figure 3). Fungicides only exceeded EAR thresholds and had the greatest number of exceedances at urban sites throughout the year (Figure 3 and Supporting Information, Figure S8).
Figure 3.
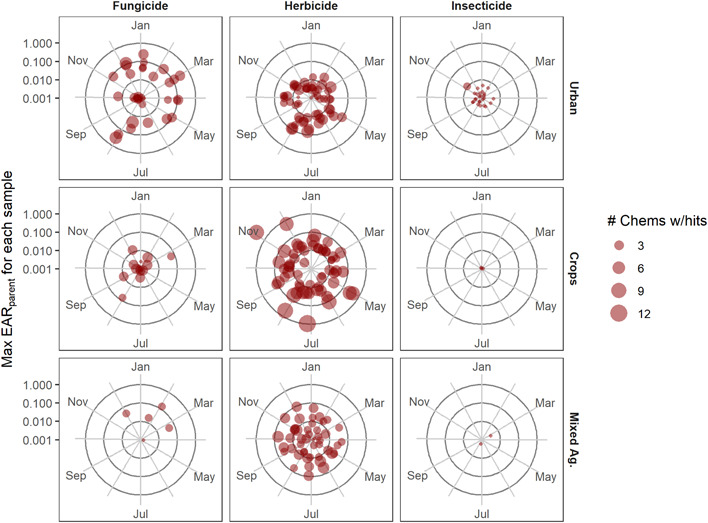
Temporal dynamics of pesticides and pesticide transformation products in water samples collected from 16 Great Lakes tributaries, October 2015–September 2016. Chemicals are grouped by major class (columns), and site data are grouped by dominant land use type (rows). Each dot is an individual sample and represents the maximum exposure activity ratio (EARparent) value for that site‐date‐class of compounds (distance from center) and number of chemicals with EARparent >0.001 (dot size). Parent and transformation product EAR values were summed to calculate EARparent. All sites are represented once a month, and a site‐date without any EARparent >0.001 does not appear in this figure. The wetland and forested site were removed from the figure because of limited threshold exceedances; the wetland site had herbicide exceedances in 4 months, whereas the forested sites had no exceedances. Ag = agriculture.
Both detections and threshold exceedances outside of the growing season when pesticides are typically applied suggest that environmental storage, transport, and transformation of pesticides, are critical processes that affect the potential impacts of pesticides on biota in Great Lakes tributaries. Herbicide transformation product concentrations remained high and consistent all year relative to parent pesticide concentrations (Supporting Information, Figure S6), suggesting that transformation products are temporally decoupled from application. For some individual parent pesticides, transformation products extended the “exposure season,” or the proportion of the year that aquatic biota are exposed to pesticides at a given site. For example, for all parent compounds for which the parent and at least one transformation product were detected in our study, the transformation products were detected in an average of 1.7 months/site when the parent was not (data derived from Supporting Information, Table S4). For some compounds, the transformation products drastically extended the exposure season; sites had on average more than 3 more months of transformation product detections compared with the parents for fipronil, acetochlor, diazinon, propiconazole, and metribuzin. This likely reflects the well‐documented persistence and mobility of pesticide transformation products (see Battaglin et al., 2005), resulting in year‐round exposure of aquatic biota to pesticides in the Great Lakes tributaries.
Seepage to groundwater and subsequent transport to surface waters is another mechanism for extending the spatial and temporal footprint of potential impacts of pesticides (Arias‐Estévez et al., 2008; Kim et al., 2022). Although we did not assess pesticides in the context of flow conditions, other studies have found that parent compounds are associated with higher concentrations from runoff events, whereas transformation products are found at higher concentrations in baseflow conditions (Kalkhoff et al., 2003; Mahler et al., 2021; Thurman et al., 1991); these dynamics may contribute to the year‐round exposures and potential biological effects of pesticides that we observed.
Prioritization of sites of concern and the relationship with land use
All but one of the Great Lakes tributaries sampled (Bad River, which flows into Lake Superior) had pesticide concentrations that exceeded benchmarks (Figures 1 and 4), and our results indicate a potential for adverse biological impacts at all sites with watersheds dominated by row crop agriculture, mixed agriculture, or urban land use. Overall, the relative potential for negative biological effects from pesticides across the 16 sites was related to human disturbance (urban plus agricultural land use; Figure 5). However, even the St. Louis River (a tributary to Lake Superior) site with 51% wetland and 34% forest cover had EARmix exceedances in 4 of 12 sampled months. Sources at this site could include runoff from the small amount of agriculture and urban land use or other anthropogenic activities in this watershed. The Maumee River site was the most potentially impacted by pesticides by almost every metric (RHI = 0.96); 72 chemicals were detected over the course of the year, with a median of 41 pesticides detected/sample, and a median of 5 and 35 TQchem and EARmix exceedances/sample, respectively. By similar measures, the Bad River was the least impacted site (RHI = 0.01), with a total of only six pesticides detected and no recorded EAR or TQ threshold exceedances. Four additional sites were potentially impacted by pesticides; one was dominated by row crops (Vermillion) and three were urban sites (Clinton, Cuyahoga, and Rouge). Although these five sites were relatively more impacted than others (RHI >0.5), it is important to note that all “non‐natural” land cover sites exceeded at least one benchmark every month of the year, indicating that most sites could be affected by pesticides year‐round.
Figure 4.
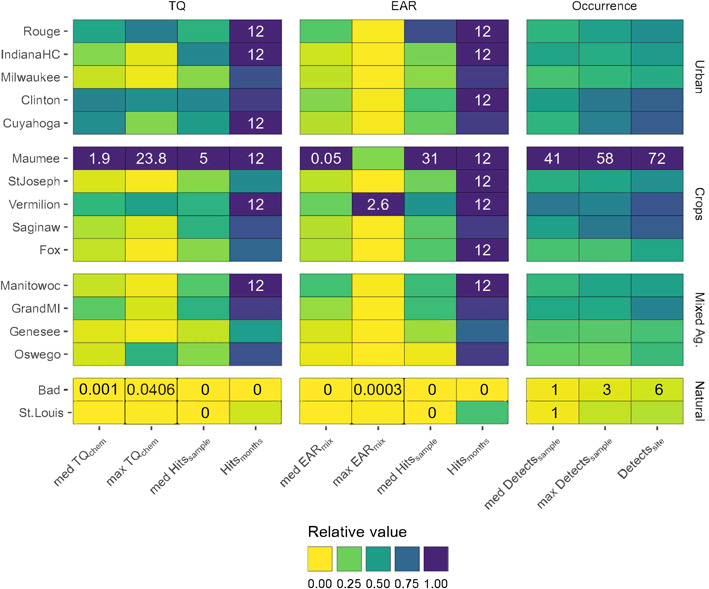
Site prioritization using several metrics that describe the severity, complexity, and seasonal persistence of potential biological effects of pesticides and pesticide transformation products in surface waters for 16 Great Lakes tributaries, October 2015–September 2016. Tile colors represent relative metric values, where the maximum metric value is equal to 1. Minimum and maximum metric values are printed in black and white text, respectively. Metrics are grouped by columns, either toxicity quotients [TQs], exposure activity ratios [EARs], or occurrences. Sites are grouped by dominant land use type, and within dominant land use are ordered from most (top) to least (bottom) disturbed watersheds (sum of all agriculture [Ag] and urban land use).
Figure 5.
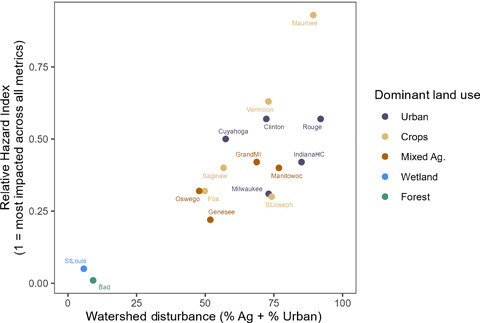
The relationship between the relative hazard index (RHI) and watershed disturbance across 16 tributaries in the Laurentian Great Lakes Basin, October 2015–September 2016. The RHI combines several occurrence, exposure activity ratio (EARmix), and toxicity quotient (TQchem) metrics to rank sites relative to each other according to their potential for negative biological impacts of pesticides. Watershed disturbance was calculated as the sum of the proportion of the watershed that is pasture, row crop agriculture (Ag), and urban land use.
The Maumee River watershed has a history of environmental contamination related to urban (Toledo) and agricultural influences, and surface waters in the Maumee River Basin are contaminated by pesticides (Weaver et al., 1965) and pharmaceuticals (see Ankley et al., 2021; Baldwin et al., 2016 ). The pesticides with the most benchmark exceedances (either from the parent or a transformation product) at this site were the herbicides acetochlor, atrazine, and metolachlor, which had EARchem or TQchem exceedances in all 18 samples taken from the Maumee River, and the insecticide imidacloprid, which had TQchem exceedances in all samples. The potential impact of these compounds is supported by previous studies in the Maumee River; fathead minnows (Pimephales promelas) exposed to summer surface water from the Maumee River had pesticides in their tissue, and exposure of the fish to the mixture of pesticides with other chemicals present may have led to embryonic deformations and loss of fecundity (Cipoletti et al., 2019). The exposure to herbicides in the Maumee could lead to plant community changes that have cascading effects on food webs or ecosystem integrity; in four samples in the months of May, June, and July, atrazine was detected above ALB for vascular plants reported by the USEPA (2019b; ALB < 1.0 µg/L).
The use of pesticides varies in urban and agricultural settings, but both land uses are associated with the potential for negative biological impacts of pesticides (Metcalfe et al., 2019). The proportion of pesticides applied in urban settings that end up in surface water can be much higher than that in agricultural settings, even though application rates in urban areas tend to be lower (Wittmer et al., 2011). The well‐developed conveyance systems including paved (impervious) surfaces and storm sewers tend to deliver nonpoint source contaminants to streams very efficiently. Many threshold responses in urban streams have been documented, and the rapid increase of impervious surfaces even at low total urban land use cover and associated chemical loading may contribute to the potential negative biological effects of pesticides in urban streams (Brabec et al., 2002). Treated and untreated wastewater treatment effluent can also be an important contributor to the presence of pesticides in urban streams resulting from poor removal of some pesticides in wastewater treatment (Kolpin et al., 2004; Webb et al., 2021) and discharge from combined sewer systems that exist in several of the watersheds studied (McLellan et al., 2007; Tavakol‐Davani et al., 2016). In our study, the combined watershed disturbance (percentage of pasture + row crops + urban area in a watershed) varied from 6% to 92% across the 16 sites and was correlated to the RHI (Figure 5). There is evidence that these relationships between estimated RHI and land use might be observable at the population level; for example, loss of imperiled terrestrial birds, mammals, amphibians, and reptiles in Canada has been correlated with intensive agricultural practices and herbicide application (Gibbs et al., 2009). Urban land cover has commonly been associated with degraded aquatic life in streams due to various physical and chemical influences (Roy et al., 2005; Wang et al., 2003; Wang, 2001).
Prioritization of pesticides of concern
As shown in ours and other studies, many pesticides can co‐occur in surface water samples, and decisions about which chemicals to prioritize for management actions would benefit from consideration of the potency and the occurrence across space and time of each compound. Because the amount and quality of biological effects data about parent pesticides and their transformation products vary, we used multiple metrics to determine priority compounds in hopes of creating a method of identifying those of most potential concern even when information from individual compounds is incomplete.
Of the 64 parent compounds that were detected either as parent or as a transformation product, 15 met one or more of our priority compound criteria (Figure 6). The priority compounds included eight herbicides (metolachlor, acetochlor, 2,4‐D, diuron, atrazine, alachlor, triclopyr, and simazine), three fungicides (chlorothalonil, propiconazole, and carbendazim), and four insecticides (fipronil, diazinon, imidacloprid, and clothianidin). The TQ values generated from the USEPA's ALB and the EAR values generated using ToxCast ACC values both indicated that metolachlor, acetochlor, atrazine, and diazinon were priority compounds. Generally, ToxCast assays indicated herbicides and fungicides as having high potential for biological effects, whereas the ALBs emphasized insecticides as having the potential for adverse impacts on aquatic biota. Many of these compounds were also prioritized and discussed in detail in a companion study that used passive samplers to prioritize pesticides at the same sites (Loken et al., 2022). Below, we expand on the priority compound discussion to include compounds uniquely prioritized in our study (alachlor, triclopyr, chlorothalonil, propiconazole, carbendazim, diazinon, and clothianidin).
Figure 6.
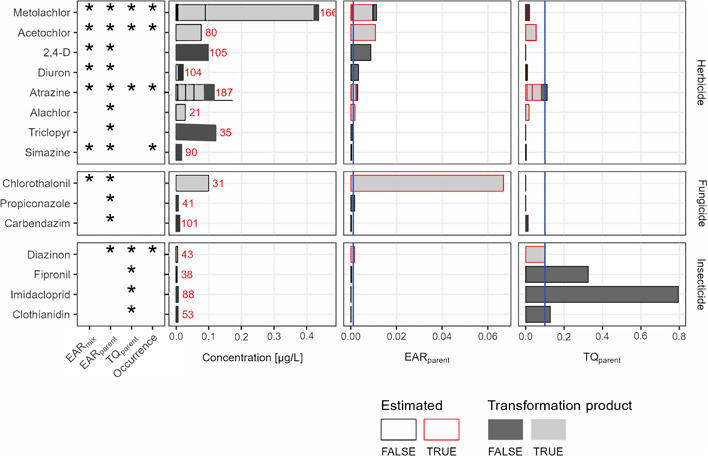
The top parent pesticides of potential biological concern and associated median exposure activity ratio (EARparent), toxicity quotient (TQparent), and concentration from evaluation of pesticide and pesticide transformation product data measured in samples collected from 16 Great Lakes tributaries, October 2015–September 2016. Asterisks in the left‐hand panel designate the metrics that indicated priority; exceedances at >25% of sites and >10% of samples (EARmix, EARparent, TQparent) or at least one compound associated with the parent that had no toxicity information but occurred at >50% of sites or >20% of samples (occurrence). Each bar shows the stacked median values for all parents (dark gray) and associated transformation products (light gray) across samples where any parent or transformation product was detected. When the toxicity of a transformation product was estimated as the equivalent to the parent, the bar is outlined in red. For each parent grouping, not all parents and transformation products were detected in the same samples; we therefore assumed zero values for the “missing” compounds in any sample in which one or more compounds from the parent grouping was detected. Blue vertical lines indicate exceedance thresholds used in the text. Red numbers indicate the number of samples in which either the parent or the transformation product was detected.
Of the eight herbicides that met priority compound criteria, annual applications in the United States for four of them are more than 1 order of magnitude greater than for others; these include atrazine, metolachlor, acetochlor, and 2,4‐D (Wieben, 2020). The detection frequency of these pesticides in our study mirrored the reported widespread use; all four of these parent compounds (or one or more of their transformation products) were detected in 55 of 198 samples, and these parent pesticides or related transformation products were all undetected in only a single sample. When considered together, these four compounds contributed to TQparent and EARparent threshold exceedances in all months, at all sites, and in 56% and 91% of samples for TQparent and EARparent, respectively (Figures 2 and 6). These findings build on studies in the Great Lakes region and Midwest United States that have highlighted atrazine, metolachlor, acetochlor, and 2, 4‐D as compounds of concern (see Guo et al., 2016; Hansen et al. 2019; Nowell et al., 2018). The potential biological effects of these and other priority compounds are discussed further in Loken et al. (2022).
The herbicides prioritized by discrete samples that were not prioritized by the passive sample study (Loken et al., 2022) include triclopyr and alachlor. Triclopyr is a pyridine herbicide that may have adverse effects on aquatic life; it has been detected in previous surface water monitoring efforts (Ensminger et al., 2013; Phillips & Bode, 2004; Reemtsma et al., 2013). Alachlor (a chloroacetanilide herbicide) was not detected in the present study, but three of its transformation products were present. The herbicide was not used extensively in 2016, with <1 million kg applied in the United States (Wieben, 2020). Alachlor has been banned by Canada and the European Union. Other studies have noted the presence of alachlor transformation products despite no detection of the parent compound and limited concurrent use of the pesticide (see Kalkhoff et al., 2003); the presence of the transformation products in streams may reflect historic usage of alachlor and subsequent groundwater contamination of the more stable alachlor transformation products; this contamination contributes significantly to the surface water in tributaries of the Great Lakes (Fisher et al., 2021; Kolpin et al., 2000; Squillace et al., 1993).
Notably, the organophosphorous herbicide glyphosate was not identified as a high‐priority compound, even though it is the most heavily used herbicide in the United States (Benbrook, 2016). Glyphosate was detected in 26% (19/72) of samples and at 9/16 sites but did not have a single benchmark exceedance. Detection frequency of glyphosate in our study is lower than in other reports in the Midwest, although this is likely attributable to the detection limit of the ELISA method in our study (0.1 μg/L) being five times higher than in other reports (see Medalie et al., 2020). However, other studies similarly note that glyphosate in surface waters is being detected at concentrations below human and ecological health benchmarks (Battaglin et al., 2005; Medalie et al., 2020).
The fungicides that met the priority criteria included chlorothalonil, propiconazole, and carbendazim. Chlorothalonil, a broad‐spectrum organochlorine fungicide used for potatoes and tomatoes (among other crops), is applied in volumes approximately five times greater than the conazole fungicide propiconazole in the United States (Wieben, 2020), and the volume of carbendazim (a benzimidazole fungicide) applied each year is unknown. Chlorothalonil is also used on turf grass, and chlorothalonil transformation product detection in streams has recently been associated with the presence of golf courses (Mahler et al., 2021). In the present study, 24 of 31 detections of the chlorothalonil transformation product 4‐hydroxychlorothalonil occurred at sites with watersheds dominated by urban land use. Therefore, in the Great Lakes Basin, chlorothalonil contamination in streams may be driven by use in recreational areas rather than commercial agriculture application. Propiconazole is used on wheat, corn, fruit, turfgrasses, soybeans, and other crops (Thelin & Stone, 2013). Propiconazole is relatively mobile and likely to remain in solution rather than partitioning to soils and sediment (Battaglin et al., 2011). In our study, propiconazole was detected at a frequency (21% of samples) similar to that found in other broad‐scale studies of pesticides in streams (Battaglin et al., 2011; Stackpoole et al., 2021); we also found similarly low concentrations of propiconazole (all samples <0.1 μg/L) compared with a recent national survey (Stackpoole et al., 2021). Carbendazim is a systemic, broad‐spectrum benzimidazole fungicide used in the United States for nonfood production applications (e.g., paints and building supplies) and is also a transformation product of the fungicides benomyl and thiophanate‐methyl (Merel et al., 2018). Benomyl is an unlikely source of carbendazim in the Great Lakes because its use and production have been banned in the United States since 2002, but thiophanate‐methyl is used across the Great Lakes region and is a likely source of carbendazim to streams (Baker & Stone, 2015), although we did not monitor for thiophanate‐methyl. Similarly, carbendazim has been widely detected in Canadian tributaries of the Great Lakes despite similar restrictions (Metcalfe et al., 2019). In our study, detections of carbendazim were generally associated with urban sites, but there were notable exceptions (e.g., Vermillion, which has a watershed dominated by row crops), indicating both urban and agricultural sources.
Several insecticides were also prioritized for potential biological effects based on EAR‐ and/or TQ‐based analysis including the neonicotinoids imidacloprid and clothianidin, the phenylpyrazole fipronil, and the organophosphate diazinon. Fipronil and the neonicotinoid insecticides are neurotoxic systemic insecticides that together account for approximately one‐third of the world insecticide market (van der Sluijs et al., 2015). These insecticides are used for many applications, including agriculture, horticulture, forestry, urban and household pest control, and treatment of companion animals, livestock, and aquaculture. Imidacloprid, clothianidin, and fipronil have been shown to adversely affect a variety of nontarget organisms in terrestrial, aquatic, and benthic environments (Pisa et al., 2015; Starner & Goh, 2012). In addition, some transformation products of fipronil can be more potent and more persistent than fipronil (Miller et al., 2020; Schlenk et al., 2001). In our study, most detections of fipronil and its transformation products were at urban sites (Clinton and Cuyoha; Supporting Information, Table S4), indicating domestic use as a primary source of fipronil in tributaries of the Great Lakes, as has been found in other studies (see Gan et al., 2012). We detected diazinon and its transformation products largely at urban sites, even though residential use of diazinon was discontinued in the United States starting in 2000 (USEPA, 2006). We found that the diazinon transformation product pyrimidinol was largely responsible for the prioritization of diazinon and that it is much less toxic than diazinon (USEPA, 2016), but detection of diazinon in surface water is common (Metcalfe et al., 2019; Ryberg & Gilliom, 2015), and is still periodically found above acute and chronic ALB concentrations (Stackpoole et al., 2021; Wang et al., 2017).
Although our compound prioritization focused on parent pesticides because they are usually the active ingredient that is regulated for use, it was often the transformation products of the parent compounds that led to the pesticide being prioritized. The transformation products were regularly detected, often at high concentrations (Figures 2 and 6 and Supporting Information, Tables S3 and S6), and made up a large proportion of compounds that exceeded toxicity or bioactivity thresholds (Supporting Information, Figure S7). Several parent compounds had transformation products with relatively high concentrations, including metolachlor, acetochlor, atrazine, alachlor, chlorothalonil, and diazinon (Figure 6). Of the 15 priority parent compounds, 9 had transformation products that were not represented in either ToxCast or ALB; in these cases, we assumed potency to be the same as the parent compounds (based on molar concentrations).
If we assume that parent toxicity or bioactivity for transformation products introduces additional uncertainty into prioritization regarding potential biological effects, then this assumption may over‐ or underestimate the potential impact of a transformation product and subsequently its parent compound. For example, although atrazine and metolachlor themselves had high threshold exceedance rates in our study (Figure 2 and Supporting Information, Table S3), the added effects of their transformation products amplified their TQs and EARs. For atrazine, two transformation products (deethyldeisopropyl atrazine and hyroxydeethyl atrazine) were frequently observed and had no ToxCast or ALB data. In the USEPA ecological risk assessment for atrazine, it was concluded that the risk associated with detected atrazine transformation products remains uncertain in both the terrestrial and aquatic environments, and that chronic effects on fish are unknown (Farruggia et al., 2016). In a study of the acute effects of these compounds on the freshwater invertebrate Daphnia magna, deethyldeisopropyl atrazine had similar toxicity compared with atrazine, whereas hyroxydeethyl atrazine was considered nontoxic (Choi et al., 2013). Conversely, in the case of metolachlor, available ALBs suggest that the two transformation products with the highest concentrations (metolachlor oxalic acid (OA) and metolachlor ESA) pose little hazard to aquatic organisms (maximum TQchem values of <0.001), so assuming that metolachlor ESA has the same degree of bioactivity as the parent likely overestimates the importance of metolachlor in the case of the EAR metrics.
For acetochlor, alachlor, chlorothalonil, and diazinon, the overall importance of the compound was driven by transformation products with estimated TQ and EAR (Figure 6). Acetochlor was detected in 30 samples, 7 and 28 of which exceeded TQchem and EARchem thresholds, respectively. Acetochlor OA was detected in 70 samples, and with the toxicity/bioactivity assumed to be equal to that of its parent, 30 and 70 samples exceeded TQchem and EARchem thresholds, respectively. Little is known about the potency of acetochlor OA, but given its relatively high concentrations and frequency of detection, in addition to threshold exceedances of the parent compound, we designated acetochlor as a pesticide of concern. For the transformation products with exceedances for alachlor (alachlor oxanilic acid and alachlor sulfonic acid), chlorothalonil (4‐hydroxychlorothalonil), and diazinon (pyrimidinol), the few studies that exist suggest that these compounds range from nontoxic to less toxic than the parent, and likely contributed to an overestimation of the potential toxicity/bioacitivity of the parent compounds (USEPA, 1999, 2009, 2016). Despite the uncertainty introduced by assuming parent toxicity for these transformation products, previous research has suggested that not accounting for pesticide transformation products can lead to an underestimation of the overall potential toxicity of pesticides to aquatic organisms (Mahler et al., 2021; Sinclair & Boxall, 2003). Assuming parent toxicity for transformation products that are missing bioacitivity or toxicity estimates is typically a conservative and easy approach for ensuring representation of transformation products in prioritizing pesticides of concern. In addition, this approach highlights transformation products that are both prevalent and lack toxicological understanding; our ability to assess potential biological effects would be improved by targeted toxicology research that helps identify concentrations of concern for these compounds.
Mixtures of pesticides in Great Lakes tributaries
In previous studies of tributaries of the Great Lakes, considering mixtures of compounds highlighted additional chemicals of concern, and co‐occurring chemicals elevated the potential biological effects relative to considering the presence of individual compounds (Alvarez et al., 2021; Baldwin et al., 2022; Corsi et al., 2019). We quantified the importance of mixtures by calculating the proportion of EARmix exceedances that were dependent on the presence of multiple chemicals. Overall, 2386 sample‐endpoint combinations resulted in an EARmix of >0.001. In 83% (n = 1972) of these EARmix exceedances, a single compound exceeded the EAR benchmark alone. For EARmix exceedances with >1 compound contributing to the endpoint (n = 2036), the EARmix value was a median of 41% greater when considering all compounds versus considering the maximum EAR value for an individual chemical for that sample‐endpoint. Seven of the 170 samples with EARmix > 0.001 did not have any individual chemical‐endpoint combination with an EAR > 0.001. Although sample and chemical prioritization using EARmix was largely driven by the effects of individual compounds, the number of samples and the potential biological impact increased when chemical co‐occurrence was considered.
Further inquiry into the laboratory assays and specific biological targets (proteins, genes, etc.) for each priority endpoint could be useful in predicting the types of biological systems affected by chemical mixtures (Alvarez et al., 2021; Baldwin et al., 2022). To summarize the potential apical biological effects in each land use category, we identified priority endpoints that had an average of 1 EARmix greater than 0.01 per site (Table 1). Overall, seven unique endpoints met this criterion, and these were reduced to five priority endpoints because there were endpoints that only differed by assay duration (e.g., CLD_CYP3A4_48hr and CLD_CYP3A4_6hr). Sixteen parent compounds contributed at least once to these priority endpoints, and the specific chemicals and endpoints varied among land use categories (Table 1). For example, although watersheds with urban and agricultural land use had overlapping priority endpoints, the chemical mixture that led to those exceedances was very different; the urban mixture that led to bioactivity for endpoint ATG_PXRE_CIS_up was dominated by chlorothalonil, whereas the mixed agriculture and row crop sites had mixtures dominated by metolachlor and acetochlor (Table 1). This highlights that although different pesticides are associated with urban or agricultural land use, the mixtures of pesticides that result in surface water may lead to similar impacts on aquatic biota across different land uses. All priority endpoints identified in our study via discrete water samples were also listed as priority endpoints in the associated passive sampling study; those endpoints and how they related to specific biological pathways are discussed in detail in Loken et al. (2022).
Table 1.
Top ToxCast assays (endpoints; USEPA, 2020) that averaged more than one exposure activity ratio (EARmix) >0.01/site in any land use category for 16 Great Lakes tributaries sampled for pesticides and pesticide transformation products measured in water samples, October 2015–September 2016
| Priority endpoint | No. | Parents in the mixture with activity against the endpoint | Median EARmix of chemicals contributing to mixture |
|---|---|---|---|
| Urban: 5 sites with EARmix > 0.01 | 
|
||
| CLD_CYP2B6_6hr | 16 | 2,4‐D, atrazine, metolachlor, diuron, acetochlor, ametryn |
 |
| ATG_PXRE_CIS_up | 7 | Metolachlor, acetochlor, chlorothalonil, oryzalin, atrazine |
 |
| Crops: 5 sites with EARmix > 0.01 | |||
| *CLD_CYP2B6_6hr | 31 | 2,4‐D, acetochlor, atrazine, diuron, metolachlor, EPTC, ametryn, propazine, metalaxyl |
 |
| ATG_PXRE_CIS_up | 28 | Chlorothalonil, metolachlor, acetochlor, dimethenamid, alachlor, atrazine, sulfentrazone, azoxystrobin |
 |
| CLD_CYP1A1_24hr | 25 | Acetochlor, diuron |
 |
| NVS_ENZ_hPDE4A1 | 14 | Atrazine, propazine, simazine |
 |
| *CLD_CYP3A4_6hr | 12 | 2,4‐D, metolachlor, alachlor |
 |
| Mixed agriculture: 2 sites with EARmix > 0.01 | |||
| ATG_PXRE_CIS_up | 12 | Acetochlor, metolachlor, dimethenamid, chlorothalonil |
 |
| CLD_CYP2B6_6hr | 6 | 2,4‐D, acetochlor, atrazine, metolachlor, ametryn |
 |
Compounds listed in Table 1 are all parent compounds where the parent or degradate contributed at least 1% to any of the sample exceedances in that land use category. The barplot column of the table shows mixtures as the median EAR values of those compounds that contributed to any exceedance of that assay. Parent and associated transformation products are represented with the same color, but the parent portion of the value is outlined in black. Because we used median values for each parent pesticide or group of transformation products across each exceedance, a parent/transformation product group is missing from the figure if it was in fewer than 50% of the mixtures that led to the endpoint exceedance. EPTC = S‐ethyl dipropylthiocarbamate.
CONCLUSIONS AND FUTURE WORK
Year‐round monitoring of pesticides in 16 tributaries to the Great Lakes revealed that despite pesticide use regulations that are designed to protect nontarget species, pesticides are of potential biological concern to aquatic biota across watersheds with a wide range of land uses, including sites with minimal agricultural or urban land use. Although there is a strong seasonal pattern of pesticide use and detection in surface water, concentrations in our study exceeded benchmark values year‐round, indicating that environmental storage, transformation, and transport processes contribute to the impacts of pesticides outside of the growing season. The transformation products played a key role in the prioritization of approximately half of the priority parent pesticides, highlighting the role of transformation products in expanding the effects of the parent compound. Although the HTS techniques we used (e.g., ToxCast) allow for broader evaluation of potential biological effects of environmental contaminants, bioactivity does not necessarily translate to effects on organisms. Instead, prioritization of specific compounds and sites can be used to target research to better understand how pesticides are affecting aquatic biota. Furthermore, we observed many compounds that have unknown bioactivity or toxicity; for example, 31 transformation products were detected but were missing from both ALB and ToxCast. Understanding the potential toxicity of these compounds, particularly for those frequently observed, is critical to providing a complete picture regarding potential biological effects of pesticide exposures in tributaries of the Great Lakes.
Supporting Information
The Supporting Information is available on the Wiley Online Library at !https://doi.org/10.1002/etc.5522.
Disclaimer
Any use of trade, product, or firm names is for descriptive purposes only and does not imply endorsement by the US Government. The views expressed in this article are those of the authors and do not necessarily represent the views or policies of the US Environmental Protection Agency (USPA). This article has been peer reviewed and approved for publication consistent with US Geological Survey Fundamental Science Practices (!https://pubs.usgs.gov/circ/1367/). The USEPA through the Office of Research and Development provided technical direction but did not collect, generate, evaluate, or use the environmental data described in the present study.
Author Contributions Statement
Samantha K. Oliver: Conceptualization; Data curation; Formal analysis; Investigation; Visualization; Writing—original draft; Writing—review & editing. Steven R. Corsi: Conceptualization; Data curation; Funding acquisition; Methodology; Project administration; Supervision; Writing—original draft; Writing—review & editing. Austin K. Baldwin: Data curation; Writing—review & editing. Michele A. Nott: Data curation; Formal analysis; Project administration; Writing—review & editing. Gerald T. Ankley: Data curation; Methodology; Writing—review & editing. Brett R. Blackwell: Data curation; Methodology; Writing—review & editing. Daniel L. Villeneuve: Data curation; Methodology; Writing—review & editing. Michelle L. Hladik: Data curation; Methodology; Writing—review & editing. Dana W. Kolpin: Writing—review & editing. Luke Loken: Data curation; Visualization; Writing—original draft; Writing—review & editing. Laura A. DeCicco: Data curation; Methodology; Software; Visualization; Writing—review & editing. Michael T. Meyer: Methodology; Writing—review & editing. Keith A. Loftin: Methodology; Writing—review & editing.
Supporting information
This article includes online‐only Supporting Information.
Supplementary information.
Supplementary information.
Acknowledgments
The authors gratefully acknowledge the many individuals involved in sample collection, B. Hayhurst, B. Fisher, S. Kula, C. Huitger, E. Bertke, D. Finnegan, S. Janosy, C. Silcox, E. Dobrowolski, P. Buszka, M. Hardebeck, J. Duris, A. Totten, R. Jodoin, A. Brennan, E. Dantoin, D. Housner, and J. Larson. Thanks to S. Stackpoole and K. Potrykus for reviewing the manuscript. The authors thank those involved in programmatic support, including E. Smith, E. Murphy, D. Ager, and M. Tuchman from the US Environmental Protection Agency. and C. Peters from the US Geological Survey.
Data Availability Statement
All data used in this manuscript are publicly available. The reported pesticide concentrations and stream discharges can be access from the US Geological Survey's National Water Information System. Pesticide benchmarks are from the US Environmental Protection Agency's Aquatic Life Benchmarks and ToxCast databases. Data used in the present study are also published in the Supporting Information.
REFERENCES
- Alvarez, D. A. , Corsi, S. R. , De Cicco, L. A. , Villeneuve, D. L. , & Baldwin, A. K. (2021). Identifying chemicals and mixtures of potential biological concern detected in passive samplers from Great Lakes tributaries using high‐throughput data and biological pathways. Environmental Toxicology and Chemistry, 40(8), 2165–2182. 10.1002/etc.5118 [DOI] [PMC free article] [PubMed] [Google Scholar]
- Ankley, G. T. , Berninger, J. P. , Blackwell, B. R. , Cavallin, J. E. , Collette, T. W. , Ekman, D. R. , Fay, K. A. , Feifarek, D. J. , Jensen, K. M. , Kahl, M. D. , Mosley, J. D. , Poole, S. T. , Randolph, E. C. , Rearick, D. , Schroeder, A. L. , Swintek, J. , & Villeneuve, D. L. (2021). Pathway‐based approaches for assessing biological hazards of complex mixtures of contaminants: A case study in the Maumee River. Environmental Toxicology and Chemistry, 40(4), 1098–1122. 10.1002/etc.4949 [DOI] [PMC free article] [PubMed] [Google Scholar]
- Arias‐Estévez, M. , López‐Periago, E. , Martínez‐Carballo, E. , Simal‐Gándara, J. , Mejuto, J.‐C. , & García‐Río, L. (2008). The mobility and degradation of pesticides in soils and the pollution of groundwater resources. Agriculture, Ecosystems & Environment, 123(4), 247–260. 10.1016/j.agee.2007.07.011 [DOI] [Google Scholar]
- Baker, N. , & Stone, W. (2015). Estimated annual agricultural pesticide use for counties of the conterminous United States, 2008–12 (Data Series No. 907; U.S. Geological Survey Data Series, p. 9). U.S. Geological Survey.
- Baldwin, A. K. , Corsi, S. R. , De Cicco, L. A. , Lenaker, P. L. , Lutz, M. A. , Sullivan, D. J. , & Richards, K. D. (2016). Organic contaminants in Great Lakes tributaries: Prevalence and potential aquatic toxicity. Science of the Total Environment, 554–555, 42–52. 10.1016/j.scitotenv.2016.02.137 [DOI] [PubMed] [Google Scholar]
- Baldwin, A. K. , Corsi, S. R. , Stefaniak, O. M. , Loken, L. C. , Villeneuve, D. L. , Ankley, G. T. , Blackwell, B. R. , Lenaker, P. L. , Nott, M. A. , & Mills, M. A. (2022). Risk‐based prioritization of organic chemicals and locations of ecological concern in sediment from Great Lakes tributaries. Environmental Toxicology and Chemistry, 41(4), 1016–1041. 10.1002/etc.5286 [DOI] [PMC free article] [PubMed] [Google Scholar]
- Battaglin, W. A. , Kolpin, D. W. , Scribner, E. A. , Kuivila, K. M. , & Sandstrom, M. W. (2005). Glyphosate, other herbicides, and transformation products in Midwestern streams, 2021. JAWRA Journal of the American Water Resources Association, 41(2), 323–332. 10.1111/j.1752-1688.2005.tb03738.x [DOI] [Google Scholar]
- Battaglin, W. A. , Sandstrom, M. W. , Kuivila, K. M. , Kolpin, D. W. , & Meyer, M. T. (2011). Occurrence of azoxystrobin, propiconazole, and selected other fungicides in US streams, 2005–2006. Water, Air, & Soil Pollution, 218(1–4), 307–322. 10.1007/s11270-010-0643-2 [DOI] [Google Scholar]
- Belfroid, A. C. , van Drunen, M. , Beek, M. A. , Schrap, S. M. , van Gestel, C. A. M. , & van Hattum, B. (1998). Relative risks of transformation products of pesticides for aquatic ecosystems. Science of the Total Environment, 222(3), 167–183. 10.1016/S0048-9697(98)00298-8 [DOI] [PubMed] [Google Scholar]
- Benbrook, C. M. (2016). Trends in glyphosate herbicide use in the United States and globally. Environmental Sciences Europe, 28(1), 3. 10.1186/s12302-016-0070-0 [DOI] [PMC free article] [PubMed] [Google Scholar]
- Blackwell, B. R. , Ankley, G. T. , Corsi, S. R. , DeCicco, L. A. , Houck, K. A. , Judson, R. S. , Li, S. , Martin, M. T. , Murphy, E. , Schroeder, A. L. , Smith, E. R. , Swintek, J. , & Villeneuve, D. L. (2017). An “EAR” on environmental surveillance and monitoring: A case study on the use of exposure–activity ratios (EARs) to prioritize sites, chemicals, and bioactivities of concern in Great Lakes Waters. Environmental Science & Technology, 51(15), 8713–8724. 10.1021/acs.est.7b01613 [DOI] [PMC free article] [PubMed] [Google Scholar]
- Boxall, A. B. A. , Sinclair, C. J. , Fenner, K. , Kolpin, D. , & Maund, S. J. (2004). When synthetic chemicals degrade in the environment. Environmental Science & Technology, 38(19), 368A–375A. 10.1021/es040624v [DOI] [PubMed] [Google Scholar]
- Brabec, E. , Schulte, S. , & Richards, P. L. (2002). Impervious surfaces and water quality: A review of current literature and its implications for watershed planning. Journal of Planning Literature, 16(4), 499–514. 10.1177/088541202400903563 [DOI] [Google Scholar]
- Carter, A. (2000). How pesticides get into water—and proposed reduction measures. Pesticide Outlook, 11(4), 149–156. 10.1039/b006243j [DOI] [Google Scholar]
- Choi, H.‐J. , Kim, D. , & Lee, T.‐J. (2013). Photochemical degradation of atrazine in UV and UV/H2 O2 process: Pathways and toxic effects of products. Journal of Environmental Science and Health, Part B, 48(11), 927–934. 10.1080/03601234.2013.816587 [DOI] [PubMed] [Google Scholar]
- Cipoletti, N. , Jorgenson, Z. G. , Banda, J. A. , Hummel, S. L. , Kohno, S. , & Schoenfuss, H. L. (2019). Land use contributions to adverse biological effects in a complex agricultural and urban watershed: A case study of the Maumee River. Environmental Toxicology and Chemistry, 38(5), 1035–1051. 10.1002/etc.4409 [DOI] [PubMed] [Google Scholar]
- Corsi, S. R. , De Cicco, L. A. , Villeneuve, D. L. , Blackwell, B. R. , Fay, K. A. , Ankley, G. T. , & Baldwin, A. K. (2019). Prioritizing chemicals of ecological concern in Great Lakes tributaries using high‐throughput screening data and adverse outcome pathways. Science of the Total Environment, 686, 995–1009. 10.1016/j.scitotenv.2019.05.457 [DOI] [PubMed] [Google Scholar]
- De Cicco, L. A. , Corsi, S. , Villeneuve, D. L. , Blackwell, B. R. , & Ankley, G. T. (2018). ToxEval. US Geological Survey. 10.5066/P906UQ5I [DOI] [Google Scholar]
- Edwards, T. K. , & Glysson, G. D. (1999). Field methods for measurement of fluvial sediment. US Geological Survey. [Google Scholar]
- Ensminger, M. P. , Budd, R. , Kelley, K. C. , & Goh, K. S. (2013). Pesticide occurrence and aquatic benchmark exceedances in urban surface waters and sediments in three urban areas of California, USA, 2008–2011. Environmental Monitoring and Assessment, 185(5), 3697–3710. 10.1007/s10661-012-2821-8 [DOI] [PubMed] [Google Scholar]
- Farruggia, F. T. , Rossmeisl, C. M. , & Biscoe, M. (2016). Refined ecological risk assessment for atrazine. US Environmental Protection Agency, Office of Pesticides Programs. [Google Scholar]
- Filer, D. L. (2019). tcpl: ToxCast data analysis pipeline . https://CRAN.R-project.org/package=tcpl
- Filer, D. L. , Kothiya, P. , Setzer, R. W. , Judson, R. S. , & Martin, M. T. (2016). tcpl: The ToxCast pipeline for high‐throughput screening data. Bioinformatics, 33(4), 618–620. 10.1093/bioinformatics/btw680 [DOI] [PubMed] [Google Scholar]
- Fisher, I. J. , Phillips, P. J. , Bayraktar, B. N. , Chen, S. , McCarthy, B. A. , & Sandstrom, M. W. (2021). Pesticides and their degradates in groundwater reflect past use and current management strategies, Long Island, New York, USA. Science of the Total Environment, 752, 141895. 10.1016/j.scitotenv.2020.141895 [DOI] [PubMed] [Google Scholar]
- Friedman, K. P. , Gagne, M. , Loo, L.‐H. , Karamertzanis, P. , Netzeva, T. , Sobanski, T. , Franzosa, J. A. , Richard, A. M. , Lougee, R. R. , Gissi, A. , Lee, J.‐Y. J. , Angrish, M. , Dorne, J. L. , Foster, S. , Raffaele, K. , Bahadori, T. , Gwinn, M. R. , Lambert, J. , Whelan, M. , & Thomas, R. S. (2020). Utility of in vitro bioactivity as a lower bound estimate of in vivo adverse effect levels and in risk‐based prioritization. Toxicological Sciences, 173(1), 202–225. 10.1093/toxsci/kfz201 [DOI] [PMC free article] [PubMed] [Google Scholar]
- Gan, J. , Bondarenko, S. , Oki, L. , Haver, D. , & Li, J. X. (2012). Occurrence of fipronil and its biologically active derivatives in urban residential runoff. Environmental Science & Technology, 46(3), 1489–1495. 10.1021/es202904x [DOI] [PubMed] [Google Scholar]
- Gibbs, K. E. , Mackey, R. L. , & Currie, D. J. (2009). Human land use, agriculture, pesticides and losses of imperiled species. Diversity and Distributions, 15(2), 242–253. 10.1111/j.1472-4642.2008.00543.x [DOI] [Google Scholar]
- Guo, J. , Li, Z. , Ranasinghe, P. , Bonina, S. , Hosseini, S. , Corcoran, M. B. , Smalley, C. , Kaliappan, R. , Wu, Y. , Chen, D. , Sandy, A. L. , Wang, Y. , Rockne, K. J. , Sturchio, N. C. , Giesy, J. P. , & Li, A . (2016). Occurrence of atrazine and related compounds in sediments of upper Great Lakes. Environmental Science & Technology, 50(14), 7335–7343. 10.1021/acs.est.6b00706 [DOI] [PubMed] [Google Scholar]
- Hansen, S. P. , Messer, T. L. , & Mittelstet, A. R . (2019). Mitigating the risk of atrazine exposure: Identifying hot spots and hot times in surface waters across Nebraska, USA. Journal of Environmental Management, 250, 109424. 10.1016/j.jenvman.2019.109424 [DOI] [PubMed] [Google Scholar]
- Hladik, M. L. , & Calhoun, D. L. (2012). Analysis of the herbicide diuron, three diuron degradates, and six neonicotinoid insecticides in water—Method details and application to two Georgia streams (No. 2012–5206). US Geological Survey. [Google Scholar]
- Hladik, M. L. , Corsi, S. R. , Kolpin, D. W. , Baldwin, A. K. , Blackwell, B. R. , & Cavallin, J. E. (2018). Year‐round presence of neonicotinoid insecticides in tributaries to the Great Lakes, USA. Environmental Pollution, 235, 1022–1029. 10.1016/j.envpol.2018.01.013 [DOI] [PMC free article] [PubMed] [Google Scholar]
- Hladik, M. L. , & Kolpin, D. W. (2016). First national‐scale reconnaissance of neonicotinoid insecticides in streams across the USA. Environmental Chemistry, 13(1), 12. 10.1071/EN15061 [DOI] [Google Scholar]
- Jin, S. , Homer, C. , Yang, L. , Danielson, P. , Dewitz, J. , Li, C. , Zhu, Z. , Xian, G. , & Howard, D. (2019). Overall methodology design for the United States National Land Cover Database 2016 products. Remote Sensing, 11(24), 2971. 10.3390/rs11242971 [DOI] [Google Scholar]
- Judson, R. , Richard, A. , Dix, D. J. , Houck, K. , Martin, M. , Kavlock, R. , Dellarco, V. , Henry, T. , Holderman, T. , Sayre, P. , Tan, S. , Carpenter, T. , & Smith, E. (2009). The toxicity data landscape for environmental chemicals. Environmental Health Perspectives, 117(5), 685–695. 10.1289/ehp.0800168 [DOI] [PMC free article] [PubMed] [Google Scholar]
- Kalkhoff, S. J. , Lee, K. E. , Porter, S. D. , Terrio, P. J. , & Thurman, E. M. (2003). Herbicides and herbicide degradation products in upper Midwest agricultural streams during August base‐flow conditions. Journal of Environmental Quality, 32(3), 1025–1035. 10.2134/jeq.2003.1025 [DOI] [PubMed] [Google Scholar]
- Kim, H. , Voutchkova, D. D. , Johnsen, A. R. , Albers, C. N. , Thorling, L. , & Hansen, B. (2022). National assessment of long‐term groundwater response to pesticide regulation. Environmental Science & Technology, 56, 14387–14396. 10.1021/acs.est.2c02261 [DOI] [PMC free article] [PubMed] [Google Scholar]
- Kolpin, D. W. , Skopec, M. , Meyer, M. , Furlong, E. , & Zaugg, S. (2004). Urban contribution of pharmaceuticals and other organic wastewater contaminants to streams during differing flow conditions. Science of the Total Environment, 328(1–3), 119–130. 10.1016/j.scitotenv.2004.01.015 [DOI] [PubMed] [Google Scholar]
- Kolpin, D. W. , Thurman, E. M. , & Linhart, S. M. (2000). Finding minimal herbicide concentrations in ground water? Try looking for their degradates. Science of the Total Environment, 248(2), 115–122. 10.1016/S0048-9697(99)00535-5 [DOI] [PubMed] [Google Scholar]
- Loken, L. C. , Corsi, S. R. , Alvarez, D. A. , Ankley, G. T. , Baldwin, A. K. , Blackwell, B. R. , De Cicco, L. A. , Nott, M. A. , Oliver, S. K. , & Villeneuve, D. L. (2022). Prioritizing pesticides of potential concern and identifying potential mixture effects in Great Lakes tributaries using passive samplers. Environmental Toxicology and Chemistry , 42, 1–27. 10.1002/etc.5491 [DOI] [PMC free article] [PubMed] [Google Scholar]
- Mahler, B. J. , Nowell, L. H. , Sandstrom, M. W. , Bradley, P. M. , Romanok, K. M. , Konrad, C. P. , & Van Metre, P. C. (2021). Inclusion of pesticide transformation products is key to estimating pesticide exposures and effects in small U.S. streams. Environmental Science & Technology, 55(8), 4740–4752. 10.1021/acs.est.0c06625 [DOI] [PubMed] [Google Scholar]
- Mahler, B. J. , Van Metre, P. C. , Burley, T. E. , Loftin, K. A. , Meyer, M. T. , & Nowell, L. H. (2017). Similarities and differences in occurrence and temporal fluctuations in glyphosate and atrazine in small Midwestern streams (USA) during the 2013 growing season. Science of the Total Environment, 579, 149–158. 10.1016/j.scitotenv.2016.10.236 [DOI] [PubMed] [Google Scholar]
- McLellan, S. L. , Hollis, E. J. , Depas, M. M. , Van Dyke, M. , Harris, J. , & Scopel, C. O. (2007). Distribution and fate of Escherichia coli in Lake Michigan following contamination with urban stormwater and combined sewer overflows. Journal of Great Lakes Research, 33(3), 566. 10.3394/0380-1330(2007)33[566:DAFOEC]2.0.CO;2 [DOI] [Google Scholar]
- Medalie, L. , Baker, N. T. , Shoda, M. E. , Stone, W. W. , Meyer, M. T. , Stets, E. G. , & Wilson, M. (2020). Influence of land use and region on glyphosate and aminomethylphosphonic acid in streams in the USA. Science of the Total Environment, 707, 136008. 10.1016/j.scitotenv.2019.136008 [DOI] [PubMed] [Google Scholar]
- Merel, S. , Benzing, S. , Gleiser, C. , Di Napoli‐Davis, G. , & Zwiener, C. (2018). Occurrence and overlooked sources of the biocide carbendazim in wastewater and surface water. Environmental Pollution, 239, 512–521. 10.1016/j.envpol.2018.04.040 [DOI] [PubMed] [Google Scholar]
- Metcalfe, C. D. , Helm, P. , Paterson, G. , Kaltenecker, G. , Murray, C. , Nowierski, M. , & Sultana, T. (2019). Pesticides related to land use in watersheds of the Great Lakes basin. Science of the Total Environment, 648, 681–692. 10.1016/j.scitotenv.2018.08.169 [DOI] [PubMed] [Google Scholar]
- Meyer, M. T. , Loftin, K. A. , Lee, E. A. , Hinshaw, G. H. , Dietze, J. E. , & Scribner, E. A. (2009). Determination of glyphosate, its degradation product aminomethylphosphonic acid, and glufosinate, in water by isotope dilution and online solid‐phase extraction and liquid chromatography/tandem mass spectrometry (Techniques and Methods No. 5‐A10; p. 32). US Geological Survey.
- Miller, J. L. , Schmidt, T. S. , Van Metre, P. C. , Mahler, B. J. , Sandstrom, M. W. , Nowell, L. H. , Carlisle, D. M. , & Moran, P. W. (2020). Common insecticide disrupts aquatic communities: A mesocosm‐to‐field ecological risk assessment of fipronil and its degradates in U.S. streams. Science Advances, 6(43), eabc1299. 10.1126/sciadv.abc1299 [DOI] [PMC free article] [PubMed] [Google Scholar]
- Nowell, L. H. , Moran, P. W. , Bexfield, L. M. , Mahler, B. J. , Van Metre, P. C. , Bradley, P. M. , Schmidt, T. S. , Button, D. T. , & Qi, S. L. (2021). Is there an urban pesticide signature? Urban streams in five U.S. regions share common dissolved‐phase pesticides but differ in predicted aquatic toxicity, Science of the Total Environment, 793, 148453. 10.1016/j.scitotenv.2021.148453 [DOI] [PubMed] [Google Scholar]
- Nowell, L. H. , Moran, P. W. , Schmidt, T. S. , Norman, J. E. , Nakagaki, N. , Shoda, M. E. , Mahler, B. J. , Van Metre, P. C. , Stone, W. W. , Sandstrom, M. W. , & Hladik, M. L. (2018). Complex mixtures of dissolved pesticides show potential aquatic toxicity in a synoptic study of Midwestern U.S. streams. Science of the Total Environment, 613–614, 1469–1488. 10.1016/j.scitotenv.2017.06.156 [DOI] [PubMed] [Google Scholar]
- Phillips, P. J. , & Bode, R. W. (2004). Pesticides in surface water runoff in south‐eastern New York State, USA: Seasonal and stormflow effects on concentrations. Pest Management Science, 60(6), 531–543. 10.1002/ps.879 [DOI] [PubMed] [Google Scholar]
- Pisa, L. W. , Amaral‐Rogers, V. , Belzunces, L. P. , Bonmatin, J. M. , Downs, C. A. , Goulson, D. , Kreutzweiser, D. P. , Krupke, C. , Liess, M. , McField, M. , Morrissey, C. A. , Noome, D. A. , Settele, J. , Simon‐Delso, N. , Stark, J. D. , Van der Sluijs, J. P. , Van Dyck, H. , & Wiemers, M. (2015). Effects of neonicotinoids and fipronil on non‐target invertebrates. Environmental Science and Pollution Research, 22(1), 68–102. 10.1007/s11356-014-3471-x [DOI] [PMC free article] [PubMed] [Google Scholar]
- R Core Team . (2022). R: A language and environment for statistical computing. R Foundation for Statistical Computing. https://www.R-project.org/ [Google Scholar]
- Reemtsma, T. , Alder, L. , & Banasiak, U. (2013). Emerging pesticide metabolites in groundwater and surface water as determined by the application of a multimethod for 150 pesticide metabolites. Water Research, 47(15), 5535–5545. 10.1016/j.watres.2013.06.031 [DOI] [PubMed] [Google Scholar]
- Roy, A. H. , Freeman, M. C. , Freeman, B. J. , Wenger, S. J. , Ensign, W. E. , & Meyer, J. L. (2005). Investigating hydrologic alteration as a mechanism of fish assemblage shifts in urbanizing streams. Journal of the North American Benthological Society, 24(3), 656–678. 10.1899/04-022.1 [DOI] [Google Scholar]
- Ryberg, K. R. , & Gilliom, R. J. (2015). Trends in pesticide concentrations and use for major rivers of the United States. Science of the Total Environment, 538, 431–444. 10.1016/j.scitotenv.2015.06.095 [DOI] [PubMed] [Google Scholar]
- Sandstrom, M. W. , Kanagy, L. K. , Anderson, C. A. , & Kanagy, C. J. (2016). Determination of pesticides and pesticide degradates in filtered water by direct aqueous‐injection liquid chromatography‐tandem mass spectrometry (Techniques and Methods No. 5‐B11). US Geological Survey. [Google Scholar]
- Schäfer, R. B. , Gerner, N. , Kefford, B. J. , Rasmussen, J. J. , Beketov, M. A. , de Zwart, D. , Liess, M. , & von der Ohe, P. C. (2013). How to characterize chemical exposure to predict ecologic effects on aquatic communities. Environmental Science & Technology, 47(14), 7996–8004. 10.1021/es4014954 [DOI] [PubMed] [Google Scholar]
- Schlenk, D. , Huggett, D. B. , Allgood, J. , Bennett, E. , Rimoldi, J. , Beeler, A. B. , Block, D. , Holder, A. W. , Hovinga, R. , & Bedient, P. (2001). Toxicity of fipronil and its degradation products to Procambarus sp.: Field and laboratory studies. Archives of Environmental Contamination and Toxicology, 41(3), 325–332. 10.1007/s002440010255 [DOI] [PubMed] [Google Scholar]
- Schroeder, A. L. , Ankley, G. T. , Houck, K. A. , & Villeneuve, D. L. (2016). Environmental surveillance and monitoring – The next frontiers for high‐throughput toxicology: Surveillance and monitoring and high‐throughput toxicology. Environmental Toxicology and Chemistry, 35(3), 513–525. 10.1002/etc.3309 [DOI] [PubMed] [Google Scholar]
- Sinclair, C. J. , & Boxall, A. B. A. (2003). Assessing the ecotoxicity of pesticide transformation products. Environmental Science & Technology, 37(20), 4617–4625. 10.1021/es030038m [DOI] [PubMed] [Google Scholar]
- Squillace, P. J. , Thurman, E. M. , & Furlong, E. T. (1993). Groundwater as a nonpoint source of atrazine and deethylatrazine in a river during base flow conditions. Water Resources Research, 29(6), 1719–1729. 10.1029/93WR00290 [DOI] [Google Scholar]
- Stackpoole, S. M. , Shoda, M. E. , Medalie, L. , & Stone, W. W. (2021). Pesticides in US rivers: Regional differences in use, occurrence, and environmental toxicity, 2013 to 2017. Science of the Total Environment, 787, 147147. 10.1016/j.scitotenv.2021.147147 [DOI] [PubMed] [Google Scholar]
- Starner, K. , & Goh, K. S. (2012). Detections of the neonicotinoid insecticide imidacloprid in surface waters of three agricultural regions of California, USA, 2010–2011. Bulletin of Environmental Contamination and Toxicology, 88(3), 316–321. 10.1007/s00128-011-0515-5 [DOI] [PubMed] [Google Scholar]
- Tang, F. H. M. , Lenzen, M. , McBratney, A. , & Maggi, F. (2021). Risk of pesticide pollution at the global scale. Nature Geoscience, 14, 206–210. 10.1038/s41561-021-00712-5 [DOI] [Google Scholar]
- Tavakol‐Davani, H. , Goharian, E. , Hansen, C. H. , Tavakol‐Davani, H. , Apul, D. , & Burian, S. J. (2016). How does climate change affect combined sewer overflow in a system benefiting from rainwater harvesting systems? Sustainable Cities and Society, 27, 430–438. 10.1016/j.scs.2016.07.003 [DOI] [Google Scholar]
- Thelin, G. , & Stone, W. (2013). Estimation of annual agricultural pesticide use for counties of the conterminous United States, 1992–2009 (No. 2013–5009, p. 54). US Geological Survey Scientific Investigations Report.
- Thurman, E. M. , Goolsby, D. A. , Meyer, M. T. , & Kolpin, D. W. (1991). Herbicides in surface waters of the midwestern United States: The effect of spring flush. Environmental Science & Technology, 25(10), 1794–1796. 10.1021/es00022a018 [DOI] [Google Scholar]
- Tsvetkov, N. , Samson‐Robert, O. , Sood, K. , Patel, H. S. , Malena, D. A. , Gajiwala, P. H. , Maciukiewicz, P. , Fournier, V. , & Zayed, A. (2017). Chronic exposure to neonicotinoids reduces honey bee health near corn crops. Science, 356(6345), 1395–1397. 10.1126/science.aam7470 [DOI] [PubMed] [Google Scholar]
- US Environmental Protection Agency . (1999). Reregistration eligibility decision chlorothalonil. (No. 738‐R‐99–004). https://archive.epa.gov/pesticides/reregistration/web/pdf/0097red.pdf
- US Environmental Protection Agency . (2006). Reregistration eligibility decision for diazinon. (EPA 738‐R‐04‐006). https://www3.epa.gov/pesticides/chem_search/reg_actions/reregistration/red_PC-057801_31-Jul-06.pdf
- US Environmental Protection Agency . (2009). Potential risks of alachlor use to federally threatened California red‐legged frog (Rana aurora draytonii) and Delta smelt (Hypomesus transpacificus). https://www3.epa.gov/pesticides/endanger/litstatus/effects/redleg-frog/alachlor/analysis.pdf [Google Scholar]
- US Environmental Protection Agency . (2016). Biological evaluation for diazinon ESA assessment: Exposure characterization for diazinon. https://www.epa.gov/endangered-species/biological-evaluation-chapters-diazinon-esa-assessment [Google Scholar]
- US Environmental Protection Agency . (2019a). Office of Pesticide Programs. Aquatic life benchmarks . https://www.epa.gov/pesticide-science-and-assessing-pesticide-risks/aquatic-life-benchmarks-and-ecological-risk#benchmarks
- US Environmental Protection Agency . (2019b). Aquatic life benchmarks and ecological risk assessments for registered pesticides . [Data and Tools]. https://www.epa.gov/pesticide-science-and-assessing-pesticide-risks/aquatic-life-benchmarks-and-ecological-risk
- US Environmental Protection Agency . (2020). ToxCast & Tox21 Summary Files from invitrodb_v3.2. https://www.epa.gov/chemical-research/toxicity-forecaster-toxcasttm-data
- van der Sluijs, J. P. , Amaral‐Rogers, V. , Belzunces, L. P. , Bijleveld van Lexmond, M. F. I. J. , Bonmatin, J.‐M. , Chagnon, M. , Downs, C. A. , Furlan, L. , Gibbons, D. W. , Giorio, C. , Girolami, V. , Goulson, D. , Kreutzweiser, D. P. , Krupke, C. , Liess, M. , Long, E. , McField, M. , Mineau, P. , Mitchell, E. A. D. , & Wiemers, M. (2015). Conclusions of the Worldwide Integrated Assessment on the risks of neonicotinoids and fipronil to biodiversity and ecosystem functioning. Environmental Science and Pollution Research, 22(1), 148–154. 10.1007/s11356-014-3229-5 [DOI] [PMC free article] [PubMed] [Google Scholar]
- Van Metre, P. C. , Alvarez, D. A. , Mahler, B. J. , Nowell, L. , Sandstrom, M. , & Moran, P. (2017). Complex mixtures of pesticides in Midwest U.S. streams indicated by POCIS time‐integrating samplers. Environmental Pollution, 220, 431–440. 10.1016/j.envpol.2016.09.085 [DOI] [PubMed] [Google Scholar]
- Villeneuve, D. L. , Coady, K. , Escher, B. I. , Mihaich, E. , Murphy, C. A. , Schlekat, T. , & Garcia‐Reyero, N. (2019). High‐throughput screening and environmental risk assessment: State of the science and emerging applications: High‐throughput screening and environmental risk assessment. Environmental Toxicology and Chemistry, 38(1), 12–26. 10.1002/etc.4315 [DOI] [PMC free article] [PubMed] [Google Scholar]
- Wang, D. , Singhasemanon, N. , & Goh, K. S. (2017). A review of diazinon use, contamination in surface waters, and regulatory actions in California across water years 1992–2014. Environmental Monitoring and Assessment, 189(7), 310. 10.1007/s10661-017-6026-z [DOI] [PubMed] [Google Scholar]
- Wang, L. , Lyons, J. , & Kanehl, P. (2003). Impacts of urban land cover on trout streams in Wisconsin and Minnesota. Transactions of the American Fisheries Society, 132(5), 825–839. 10.1577/T02-099 [DOI] [Google Scholar]
- Wang, X. (2001). Integrating water‐quality management and land‐use planning in a watershed context. Journal of Environmental Management, 61(1), 25–36. 10.1006/jema.2000.0395 [DOI] [PubMed] [Google Scholar]
- Weaver, L. , Gunnerson, C. G. , Breidenbach, A. W. , & Lichtenberg, J. J. (1965). Chlorinated hydrocarbon pesticides in major U.S. river basins. Public Health Reports (Washington, D.C.: 1896), 80, 481–493. [PMC free article] [PubMed] [Google Scholar]
- Webb, D. T. , Zhi, H. , Kolpin, D. W. , Klaper, R. D. , Iwanowicz, L. R. , & LeFevre, G. H. (2021). Emerging investigator series: Municipal wastewater as a year‐round point source of neonicotinoid insecticides that persist in an effluent‐dominated stream. Environmental Science: Processes & Impacts, 23(5), 678–688. 10.1039/D1EM00065A [DOI] [PMC free article] [PubMed] [Google Scholar]
- Wieben, C. M. (2020). Estimated annual agricultural pesticide use for counties of the conterminous United States, 2013‐17 (Ver. 2.0, May 2020) . [Data set]. US Geological Survey. 10.5066/P9F2SRYH [DOI]
- Wittmer, I. K. , Scheidegger, R. , Bader, H.‐P. , Singer, H. , & Stamm, C. (2011). Loss rates of urban biocides can exceed those of agricultural pesticides. Science of the Total Environment, 409(5), 920–932. 10.1016/j.scitotenv.2010.11.031 [DOI] [PubMed] [Google Scholar]
- Woodcock, B. A. , Heard, M. S. , Jitlal, M. S. , Rundlöf, M. , Bullock, J. M. , Shore, R. F. , & Pywell, R. F. (2016). Replication, effect sizes and identifying the biological impacts of pesticides on bees under field conditions. Journal of Applied Ecology, 53(5), 1358–1362. 10.1111/1365-2664.12676 [DOI] [Google Scholar]
- Yamamuro, M. , Komuro, T. , Kamiya, H. , Kato, T. , Hasegawa, H. , & Kameda, Y. (2019). Neonicotinoids disrupt aquatic food webs and decrease fishery yields. Science, 366(6465), 620–623. 10.1126/science.aax3442 [DOI] [PubMed] [Google Scholar]
Associated Data
This section collects any data citations, data availability statements, or supplementary materials included in this article.
Supplementary Materials
This article includes online‐only Supporting Information.
Supplementary information.
Supplementary information.
Data Availability Statement
All data used in this manuscript are publicly available. The reported pesticide concentrations and stream discharges can be access from the US Geological Survey's National Water Information System. Pesticide benchmarks are from the US Environmental Protection Agency's Aquatic Life Benchmarks and ToxCast databases. Data used in the present study are also published in the Supporting Information.