

Abstract
Social context matters for health, healthcare processes/quality and patient outcomes. The social status and circumstances we are born into, grow up in and live under, are called social determinants of health; they drive our health, and how we access and experience care; they are the fundamental causes of disease outcomes. Such circumstances are influenced heavily by our location through neighborhood context, which relates to support networks. Geography can influence proximity to resources and is an important dimension of social determinants of health, which also encompass race/ethnicity, language, health literacy, gender identity, social capital, wealth and income. Beginning with an explanation of social determinants, we explore the use of Geospatial Analysis methods and geocoding, including the importance of collaborating with geography experts, the pitfalls of geocoding, and how geographic analysis can help us to understand patient populations within the context of Social Determinants of Health. We then explain mechanisms and methods of geospatial analysis with two examples: (1) Bayesian hierarchical regression with crossed random effects and (2) discontinuity regression i.e., change point analysis. We leveraged the local University of Utah and Yale cohorts of the Multicenter Perioperative Outcomes Group (MPOG.org), a perioperative electronic health registry; we enriched the Utah cohort with US-census tract level social determinants of health after geocoding patient addresses and extracting social determinants of health from the National Neighborhood Database (NaNDA). We explain how to investigate the impact of US-census tract level community deprivation indices and racial/ethnic composition on (1) individual clinicians’ administration of risk-adjusted perioperative antiemetic prophylaxis, (2) patients’ decisions to defer cataract surgery at the cusp of Medicare eligibility and finally (3) methods to further characterize patient populations at risk through publicly available datasets in the context of public transit access. Our examples are not rigorous analyses, and our preliminary inferences should not be taken at face value, but rather seen as illustration of geospatial analysis processes and methods. Our worked examples show the potential utility of geospatial analysis, and in particular the power of geocoding patient addresses to extract US-census level social determinants of health from publicly available databases to enrich electronic health registries for healthcare disparity research and targeted health system level countermeasures.
Introduction
King Cholera and the first geospatial analysis by an Anesthesiologist
King Cholera had wreaked havoc on the health of Londoners for generations, but the outbreak on August 31, 1854 was extreme even by a society accustomed to mass death. Within 3 days, 127 people had died, and within a week, a majority of the population had fled the area. John Snow, considered a pioneer of anesthesia for administering Chloroform to Queen Victoria during the birth of Prince Leopold in 1853, was skeptical of the dominant miasma (airborne) theory of disease spread for Cholera(1). With the help of what would later become known as a Voronoi Diagram,(2) Snow was able to visualize geospatial proximity, namely that patients who had consumed water from the Broad Street pump eventually contracted Cholera, while those who consumed water from different sources did not contract the disease. Presented with this map to show clusters of disease, the local authorities disabled the pump.
We leave it to historians to dispute whether or not the famous map of the outbreak was created until after the outbreak(3). Regardless, the reasoning and approach to the epidemic employed by Snow became foundational work for epidemiology and geospatial analysis. Snow linked employment with certain companies to worsening of disease transmission, and by identifying geographic clusters of mortality, linked the Cholera outbreak to a polluted water source(4), an approach similar to the focus of this manuscript. The cross-disciplinary expertise, required for geospatial analysis, common in the days before medical specialization and enabled by the relative paucity of development in various fields compared with today, can be reborn with the advent of Electronic Health Records (EHR) systems that make the tools of medical geography accessible to a wide variety of healthcare researchers and clinical subspecialties. As the story of John Snow demonstrates, the combination of Geospatial Analysis (GA) and specialty based medical knowledge (e.g., Anesthesiology and Surgery), can serve as a method to derive insights into socio-economic and environmental drivers of perioperative care and may lead to the design of appropriate interventions to ameliorate disparities in outcomes.
Social context as key driver of health and health care disparities
The focus of this manuscript is how context, location, and geography impact health and healthcare processes(5). Social determinants of health are the fundamental causes of disease, where primary causes manifest eventually as medical conditions. The central social determinants of health mediate the disease pathway all along; actionable mechanisms of disparity invite targeted countermeasures, once they are clearly identified and exposed.
For example, food deserts, the absence of parks, and racial stress all contribute to obesity, a risk factor for obstructive sleep apnea. Night shifts with insufficient rest may lead to a car accident; language barriers and poor health literacy may hinder the provision of regional anesthesia; excessive opioid administration may trigger a respiratory arrest.
In a second example, poor vision secondary to a cataract could be corrected with cataract surgery, but lack of social capital and health insurance prevent a surgical intervention. The poor vision compounds the social isolation of the patient, further enhancing cognitive decline and frailty. When a fall eventually leads to a hip fracture and hospital admission, the underlying fundamental causes of disease were poverty, lack of health insurance, social isolation, but the admission diagnosis code will be an unfortunate accident.
In table 1, a fictitious rural patient tells a harrowing story illustrating how geography, socioeconomic status, and ethnicity impact healthcare access and care, with the social determinants of health tabulated as key drivers of healthcare processes and outcomes, with potential remedial action targeting concrete mechanisms. Our fictitious narrative of the tremendous hardships faced by rural, poor, underserved and minoritized populations is corroborated by quantitative and qualitative studies.(6–8) An example of how social determinants of health impacts disease outcomes is in the treatment of melanoma—the skin cancer with the highest mortality in the US. In fact, the largest Black-White disparities in cancer survival is in melanoma—an absolute survival difference of 22%. (9)Retrospective database analysis have shown that older patients, non-white patients and those on Medicare/Medicaid are less likely to be offered a sentinel lymph node biopsy (SLNB) procedure as part of their surgical management.(10, 11) The SLNB is the most important predictor of prognosis for patients with melanoma and facilitates decision about adjuvant treatment as well as intensity of surveillance and therefore omitting it as part of treatment for patients in whom it is indicated is a great disservice. Patients who live in rural communities present with late-stage melanoma compared to their urban counterparts, face significant economic, financial and emotional hardships as care for complex cancers are usually hundreds of miles away from their work and local network of friends.(6, 12, 13) The social and geographic circumstances we are born into, drive perioperative outcomes. Parental income and school district predicts scholastic achievement better than the teacher quality and is a better predictor of longevity than a person’s genetic code. Local pollution may trigger obstructive pulmonary disease(14). Occupational hazards can trigger acute and cause chronic conditions, contingent also on local mitigation strategies and safety precautions taken, which in turn depend on legal and social context. The recent US Supreme Court decision on Roe v Wade, with accompanying in state-level policy responses to the legality of abortion services, underlines the importance of legal and social context for health services offered and the circumstances under which care is offered or denied. Redlining, “cherry picking” and other racist and xenophobic policies illustrate that race and class both matter for access to quality care, and that context impacts the care we receive and the resulting outcomes.(15–18) In summary, social circumstances are fundamental causes of some diseases(19). Social circumstances are distal causes of disease in contrast to the more proximal causes traditionally the focus of medical research and teaching. For example, myocardial infarct may be due to atherosclerosis, in turn the result of uncontrolled diabetes mellitus, hypertension, and hyperlipidemia, as the proximal causes. Social determinants of health (SDOH) -- the conditions we are born into, learn and live under, work and live in, and age in—are the distal and upstream drivers (through poverty, health literacy, insurance status, income, race/ethnicity) of the proximal causes (Diabetes, Obesity, Hypertension)(19) SDOH explains why some children have worse postsurgical outcomes after controlling for comorbidities(20). It also explains why some persons face barriers to access needed chronic pain services(21), the particular need of geriatric communities,(22) or why some Black children receive less pain medication for acute appendicitis(23). SDOH facilitates postoperative recovery for some patients but fail to rescue others(24), who fall between the cracks of social networks and medical care.
Table 1: A Fictitious Narrative Illustrating Mechanisms of Cancer Disparities.
This fictitious narrative illustrates mechanism how social determinants of health (SDOH) can lead to disparities in rural cancer care, and what countermeasure might target such mechanism, [with SDOH in brackets in the text]: (6–8)
| Social determinant of health | Mechanism | Countermeasure |
|---|---|---|
| Lack of transportation, high cost of travel, centralized care | reduced access to quality tertiary care | satellite clinics, public transport, decentralized healthcare |
| Health literacy, social capital, | delayed recognition of signs and symptoms | health curriculum, routine primary care physician visits |
| Trust in healthcare system, culturally congruent care | compliance with primary prevention and best practices | Community nurses, health system confidence building |
| Poor working conditions, inflexible work hours | unable to attend to health and care needs | social policy and workers unions. family and sick leave of absence |
| Poverty, lack of insurance, high healthcare cost | healthcare affordability | universal health insurance, living wages, social justice |
| Unsafe working conditions | occupational exposure | occupational safety |
| Environmental hazards | airborne exposure | environmental policy |
“Traveling back and forth for my cancer treatment is very challenging. [Lack of transportation, high cost of travel, centralized care] My name is Talamo. I live with my wife and two kids and work in one of the mines in Utah, [Unsafe working conditions, Environmental hazards] while my wife looks after the kids.
Five years ago, I started having trouble breathing, and I didn’t think much of it until the dizziness began and the headaches began. [Health literacy] I needed to see a doctor, but I don’t get paid if I don’t work. [Inflexible work hours] My wife convinced me to go to a local clinic 40-minute drive away, [Centralized care] but it’s always hard taking off work and even worse getting there. [High cost of travel] Our area has no bus routes, and my car has been faulty for over a week now. [Lack of transportation], Thankfully, my buddy agreed to drive me to the clinic and back since he was off work. [High cost of travel]
Three weeks was the earliest appointment time. [Social capital] While there, the doctor took my blood for tests and asked me several questions but couldn’t tell me what was wrong, or at least I did not understand what she was saying. [Health literacy] She spent very little time with me, no wonder she could not figure it out. [Culturally congruent care] I was given pills for the headache and told to get plenty of rest and drink lots of water. My grandmother died after she was seen in the same clinic. I decided not to take the pills. [Trust in healthcare system] The next day, I returned to work; I had no choice. [Inflexible work hours] But the headaches became more frequent and the dizziness almost unbearable. I could go to the ER an hour and a half away, but I can’t afford the bill. [Poverty] I have insurance, but I can’t afford the copay. [Lack of insurance, high healthcare cost] My wife’s grandfather works as a traditional healer in our small town. I saw him and he had a very long talk with me. He advised some life changes and a special tea, which made me feel somewhat better. [Culturally congruent care]
Eventually, I went back to the same clinic six months later, and the doctor did a chest x-ray. He found a lump in my lungs but could not explain it precisely. This all did not make sense. [Health literacy] I was told to see a specialist a four hours’ drive from me, [Centralized care] but I don’t know what to do. [Lack of transportation, high cost of travel] I have a wife and kids to take care of. Time passed. My headache has worsened; some days, I could barely get out of bed, and now I can barely see from my right eye. [Health literacy] I woke up one morning coughing hard, struggling to breathe, and later found myself in an emergency room two hours away from our home [Centralized care] and a buddy of mine beside me. I had fainted. The doctor ran some tests and a CT scan of my chest. He also said a lump is growing on my chest, making it hard for me to breathe. He was also concerned about my other symptoms and thought this could be cancer that had spread to my brain, causing headaches, dizziness, and now a loss of vision in my right eye. I wept the entire night.
Dimensions of social determinants of health
We propose to conceptualize social determinants of health (SDOH) in three dimensions, pertaining to (1) the identity (REAL for Race, Ethnicity, Affinity and Language),(25, 26) (2) the social standing (SES) and (3) circumstances related to location and geography (GEO)(17). Race and class both matter for healthcare outcomes, and so does geography(27). This article focuses on the third dimension, geography and location, but we need to consider interactions between REAL, SES and GEO. The different dimension of social determinants of health (REAL, SES, GEO) can conspire insidiously to compound disparities in access to health, healthcare processes and outcomes: For example, poverty (SES) compounds barriers to access care in rural areas due to transportation cost.(28, 29) Provider racism (REAL) against a Black parturient may be accentuated by community health beliefs and health illiteracy (SES).(30) Both examples also illustrate how SDOH at the individual person level (Black race, or Poverty) may interact with family or community level SDOH (community health beliefs or absence of health services in rural areas)(31).
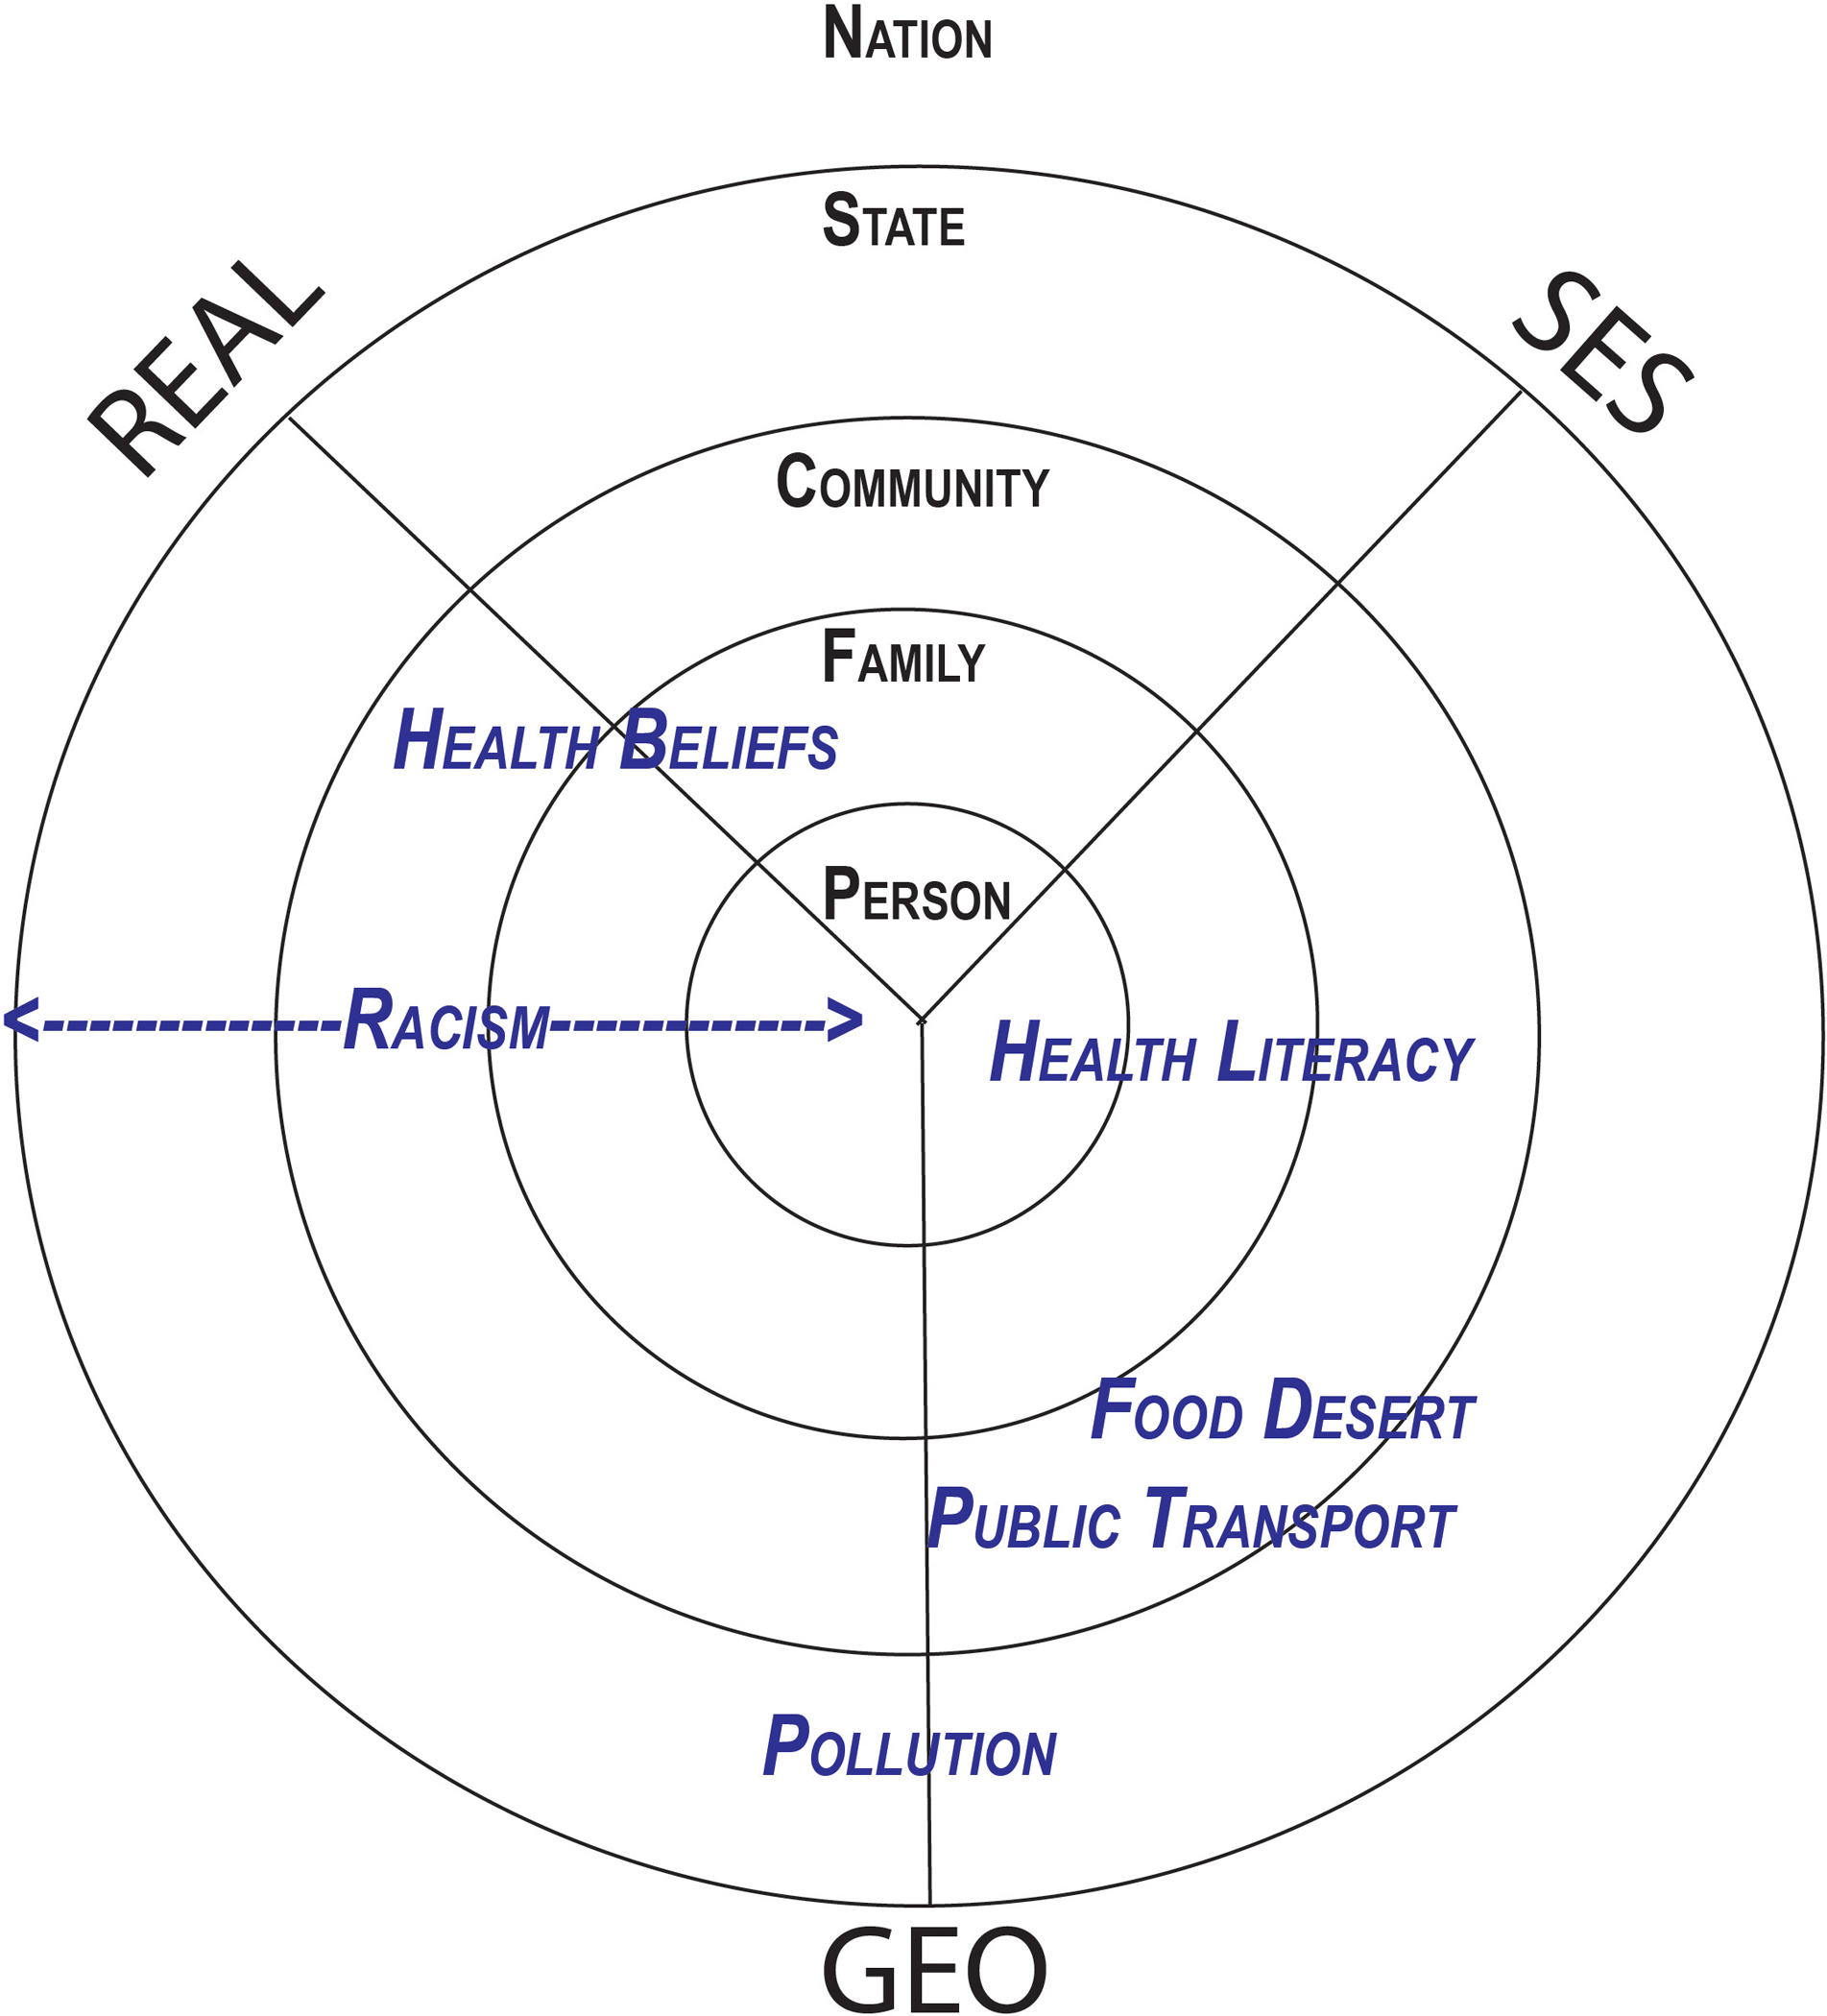
This conceptualization can be rendered in a polar diagram with three axis, REAL, SES, and GEO (Figure 2); REAL stands for Race, Ethnicity, Affinity and Language, characteristics pertaining to identity; SES refers to socio-economic characteristics like wealth, social or legal status, scholastic achievement, income; finally, geospatial pertains to geographic and location characteristics, for example the home, the neighborhood, the built environment, and other location characteristics. The individual is in center of the polar diagram. However, characteristics of an individual’s family, neighborhood, community, county, workplace, the state or nation they live in influence their health, access to care, healthcare processes and outcomes. These levels are depicted in progressively more peripheral perimeters from the individual. Social determinants of health can be organized according to their axis and their proximity to the individual. For example, a person’s ethnicity is in the center of the polar diagram of social determinants of health on the REAL axis, and through xenophobia or racisms at the hand of clinicians can lead to barriers to optimal care. A food desert would be a characteristic of the built social environment of the neighborhood GEO axis and a bit further out on the polar diagram(17).
Figure 2:
Polar dimensions of social determinants of health
We organize social determinants of health (SDOH) in this figure by spatial level and in three axis. SDOH concern (1) identity: REAL (Race, Ethnicity, Affinity and Language), (2) socioeconomic status: SES (income, social capital, health literacy, etc.), and (2) the geographic domain: GEO (geographic factors, e.g., food desert, availability of public transport, spatial accessibility of medical services). SDOH can act at different spatial levels, pertaining to the individual, their family, community, neighborhood, county, state, and nation. Individual mechanisms can be placed in a polar diagram to illustrate intersectionality and interaction between mechanisms leading to perioperative process and outcome disparities. Pollution is an example for a geographic SDOH acting at the state or community level. The impact of health literacy (SES factor) may span the personal, family and community level. Racism (REAL factor) may act at different spatial scales by different mechanisms: interpersonal racism drives disparities at the person-level, e.g., when a clinician neglects a Black patient; structural racism may act at the state or community level, e.g., through apartheid. Food desert or poor Public Transport are SDOH somewhere between the GEO and SES axis, acting more at the community than the personal level.
The impact geospatial factors on perioperative access and process disparities
Perioperative healthcare disparities can concern access to care, perioperative care processes or subsequent postoperative outcomes. Each approach (focus on access vs. process vs. outcome), has advantages and disadvantages. Below, we pick two examples of perioperative process disparities to illustrate the power of geospatial analysis to explore actionable mechanism with a view to suggesting potential remedial action. The impact of US-census tract level social determinants of health on equitable antiemetic prophylaxis is the focus of the first case study,(32) and the impact of state level policy on access to cataract surgery is illustrated in the second case study. Social determinants of health impact the trajectory of cataract patients. The development of cataracts is driven by exposure to sun and professional exposure. Health literacy, social capital and connections facilitate the recognition of visual problems and a timely diagnosis, but these can be hindered by language barriers. Insurance status will drive access to ophthalmology services and the scheduling of cataract surgery. Lack of transport, social support, and poorly controlled comorbidities dues to lack of primary care can interfere with successful completion of cataract surgery and recovery.
The goal is to understand processes leading to disparities with the same granular detail as any cancer pathophysiology. Such granular understanding of cause and effect, mechanism and pathways leading to perioperative disparity, would allow to target and test concrete countermeasures in a framework of continuous quality improvement as already practiced by other specialties(33, 34). The added value of anesthesiologists as perioperative physicians would come from improving health equity through original investigations of mechanism of perioperative disparity embedded in continuous quality improvement efforts.
Geospatial Analysis & the Boundaries of Geography
We begin by explaining Geospatial Analysis (GA) as defined by the Environmental Systems Research Institute, Inc. (ESRI): “The process of examining the locations, attributes, and relationships of features in spatial data through overlay and other analytical techniques in order to address a question or gain useful knowledge. Spatial analysis extracts or creates new information from spatial data(35). GA has been used in a variety of different fields, from urban planning to business development to social sciences and public health. What makes GA distinct from standard statistics is the use of spatial information within a relational database, where statistical analyses are dependent on the use of information that corresponds to a location in space, most usually corresponding to a precise latitude and longitude on planet Earth, and or to the relation of areas in space, notably polygons that represent specific areas such as a Census Tract. This point cannot be emphasized enough to the non-Geography audience. The use of any type of data with a “where” component requires special care and approaches to understand them properly and use them precisely in data analysis and interpretation. This is explained with reference to the case of the water crisis in Flint, Michigan, below.
Geocoding and the perils of the Zip Code: The Water Crisis of Flint, Michigan
Geocoding is a tool used extensively by Geospatial Information Systems (GIS) practitioners and is defined as the transformation of a textual address field into a latitude and longitude within a geographic information system (36) that is a location on the earth’s surface. Geocoding can appear relatively straightforward, but it is important to emphasize that shortcuts in the process and a lack of understanding of GIS themselves can lead to classification bias.
Typically, a GIS will use an address locator database to facilitate matching of textual addresses to known places on the earth’s surface. This gives varying levels of accuracy, which within the GIS are well described and tagged in the results of the geocoding. The use of Business Analyst extension from ESRI ArcGIS is one such toolset (37). The first attempt by the GIS is to match the address exactly based on street number, which then if that fails, it attempts to locate the address within a range of street numbers. If that is also not a match, most systems will then default to matching based on the street itself and attempt to find a median location in the street to which it can tag the address. Attempts are also made by the GIS to correct for common spelling errors, which are then given corresponding accuracy scores. Finally, if no matches are found through the above processes, a match based on Zip Code is attempted, with a location being assigned in the Zip Code centroid. Further attempts can also be made at the municipality level, though those are usually of limited utility depending on the intended application of the data. Special attention should be paid to choosing the right geographic projection for the dataset, especially when concerning largely spread datasets (e.g., multiple states/countries). Additionally, matching to Zip Code (postal code) alone can lead to numerous problematic results. This is seen in one popular method of zip-code matching, which is called crosswalk Zip Code matching. This is a process by which a Zip Code from an address file is matched to a “Cross-walk” index file that has associations of Zip Codes with US Census Tracts. This process is problematic for several reasons, which are detailed further below. In summary, the greatest shortcoming is that Zip Codes can often occur across the boundaries of census tracts leading to misclassification bias in the results.
Zip Codes have become mainstream within the popular health science media for describing the influence of geography on health of populations. The oft-cited catchphrase that “Zip Code is more important than genetic code”(38) has seen a steady rise an adoption, and this has had the unfortunate side effect of leading many researchers without geography training to utilize Zip Codes as a unit of analysis for geocoding of patient datasets. It is the opinion of the authors that this method should only be used as a last resort; we will explain several examples of when this has become problematic.
What are Zip Codes?
Within the USA, Zip Codes are designations of walking paths for delivery of mail created by the US Postal Service in the 1960s (39). During this time in the US, discrimination by geography was commonplace and often codified, leading to phenomenon such as redlining(40) where minorities were denied access to housing in predominately white neighborhoods, among other practices during the age of Jim Crow. The result is an inherent set of bias in the designation of Zip Codes and in the creation of their often-changing boundaries. Instead, Zip Code Tabulation Areas (ZCTAs) are utilized by many geographers to approximate the boundaries of Zip Codes. The issue with ZCTAs is that they also change periodically, as do Zip Codes with changes in populations and new housing developments, and so they can be an unreliable source of boundaries when comparing populations before and after a boundary change(41).
The issues with Zip Codes stand in contrast to the design of US Census geographic units. Census Bureau designed their analysis units (Census Block, Census Tract, etc.) with geography in mind from the start and with a basis in the characteristics of the populations in the defined area. Contrast this with Zip Codes which are based on the convenience of mail sorting and delivery. In addition, the Census Bureau has standard processes to evaluate census tracts and other geographies on a regular basis, and utilized a well-grounded, transparent and scientific process (42). Census geographies are also much more amenable to associations based on location. That is, because they are designed to have “like within like”, if one is to geocode an address and it is found within a specific Census Tract, associating population characteristics from Census to individual characteristics for the purposes of a population health study (I.e., associating social determinants data with an individual address) is statistically more valid than using Zip Codes. This incongruity is illustrated in Figure 3 below:
Figure 3:
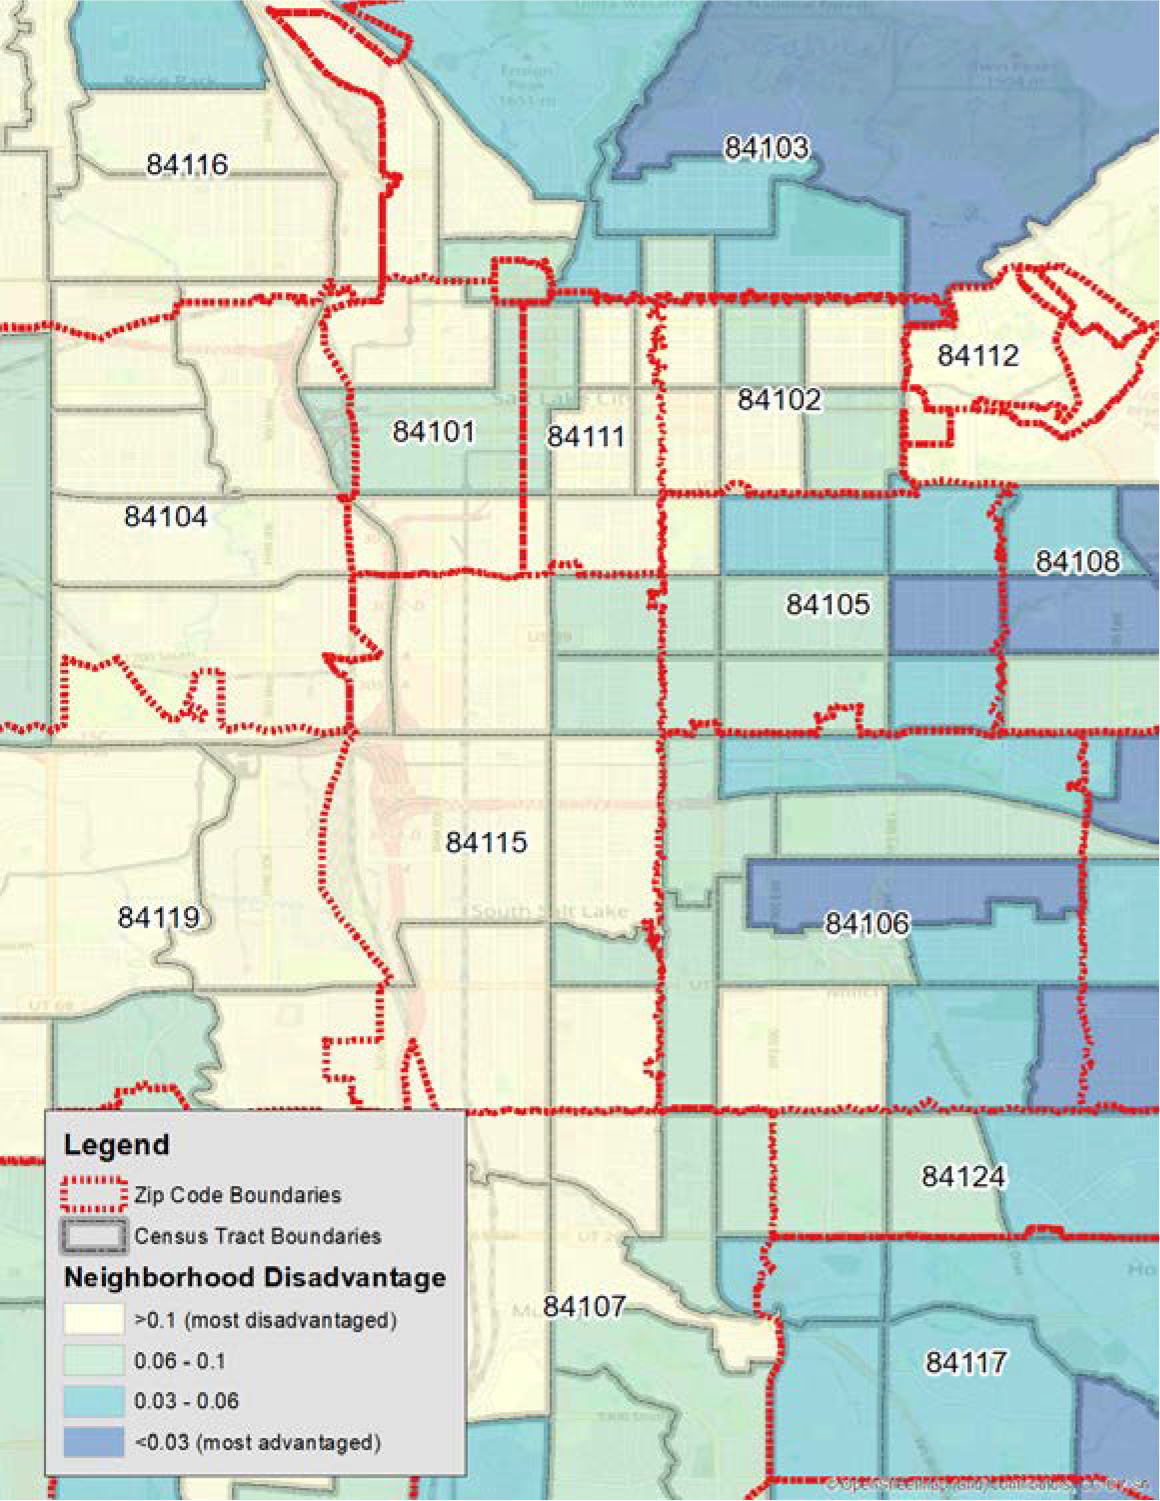
Comparison of Zip Code and Census tract boundaries
This figure overlays Zip Code Tabulation Area (ZCTA) boundaries on top of Census Tract boundaries. Underlying this is Neighborhood Socioeconomic Disadvantage (NSD) which is detailed later in the text, showing red as most disadvantaged and blue as least disadvantaged. Note the different boundaries, as the ZCTA aggregates and, had that been used as the geography boundary, would have obscured heterogeneity that is evident in the Census Tracts. At the top of the figure, Zip Code 84103 is an example of this, with areas of high social disadvantage mixed together with areas of very low (blue) disadvantage within the same Zip Code.
Bronx, a borough of New York City is home to the wealthiest and poorest who live only a few blocks apart. Often, Zip Codes can include both wealthy and disadvantaged neighborhoods within the same ZIP Code Tabulation Areas (ZCTAs), while the US Census will attempt to prevent this type of grouping from occurring. The result of using ZCTA is a further potential for bias. The issue of Zip Codes is most painfully and obviously illustrated by the example of Flint, Michigan. Around 2015 Flint, Michigan began having water quality issues with its municipal tap water. Local physicians began noting elevated blood lead levels among area children, and reported this to the Michigan Department of Health and Human Services (43). The state examined the data and initially declared that there was no statistical association between the new service of Flint River water supply. There was a flaw in the data, however, as the state utilized area Zip Codes to examine the association of blood lead levels. Independent researchers recognized this and published their own study demonstrating that there was in fact an association(44). The independent research team recognized that the state had utilized Zip Codes, and upon examining a map of Flint and its water system the research team understood that the city water system was conterminous with the city boundaries. However, the Zip Codes crossed the City of Flint boundaries and included nearby towns. When the state examined blood lead levels of children by Zip Code, they included approximately 1/3 of addresses that were outside the boundaries of the Flint water system. This resulted in a massive misclassification bias within their dataset, and lead them to concluding, erroneously, that there was no statistically significant elevation in blood lead levels. Fortunately, persistent community and medical community action, in collaboration with skilled geographers, were able to demonstrate that the new water system was poisoning the children in the community(43).
The erosion of trust in the city and state officials has led residents to maintain a persistent level of suspicion with regards to anything said by local government officials(45), undermining the crucial trust in public health authorities, similar to other trauma experienced by minority communities, e.g., the U.S Public Health Services (USPHS) Syphilis Study at Tuskegee.
Zip Codes can have their role in geospatial analysis, and they are sometimes the only information available to health research teams. However, as the above examples illustrate, they must be utilized with caution and a recognition of their limitations.
Leveraging geospatial social determinants of health to improve perioperative health equity
Continuous quality improvement framework
Geospatial social determinants of health can be leveraged to inform public health policy, to improve equitable clinical practice processes for populations at risk, and for health systems science and healthcare disparity research. Obviously, in the framework of continuous quality improvement, these aforementioned activities are integrated in a process of collecting, analyzing & using data to improve the quality of health services for marginalized populations and ensure more equitable outcomes through process improvement for specific populations at risk, on an ongoing basis(46).
Integration of social determinants of health and clinical data
First, we detail how geospatial social determinants of health can be integrated into electronic health systems and perioperative health registries to leverage the neighborhood level information for health equity research and for equitable clinical care(47). Second, we illustrate with the two example use cases the power, promise, and pitfalls of geospatial analysis for perioperative health systems science(48).
Overview of geocoding of social determinants of health
Geocoding social determinants of health from patient addresses follows this process: Starting from the patient home address at the time of service, we first perform geocoding in order to affix the textual address with a place on Earth corresponding to a specific latitude and longitude. This is then utilized in a GIS software package to match the latitude and longitude to a specific census geographic boundary(42). In terms of the National Neighborhood Data Archive (49), the boundary of choice is the US-Census Tract. The NaNDA database has a variety of socio-economic (and geographic, such as park access) datasets, all coded at the US-Census Tract and ZCTA level. Matching takes place by the GIS examining each the boundaries of each census tract and determining which tract (polygon, in geographic speak) the geocode falls within. This is how the matching of NaNDA (or any geographic information) takes places within the GIS. As NaNDA data is encoded in Census Tracts (as well as ZCTA), any NaNDA dataset can be matched to specific geocoded addresses. This data is then exported from the GIS as a flat file, associating the NaNDA data with each individual patient record and allowing for further statistical analysis. Likewise, data can remain in the GIS for further geostatistical analysis. Recall also, that any set of data that is geographic in nature, or has been coded into a GIS, can be associated with an individual geocode. Once this is complete, one can perform a geospatial analysis to test hypotheses about social circumstances as key drivers leading to disparity in care access, perioperative care processes, and/or health outcomes.
Perils & Pitfalls of Geocoding
The above process describes a brief overview of geocoding; however, caution is warranted when beginning the process and a few items deserve special attention to avoid misclassification errors and other sources of bias.
Large scale EHR databases the ground-truth data of patient addresses, however there are several considerations to be aware of when utilizing EHR data. At the outset, the current address in a downloaded database may be different than the address at the date of service. Thus, one should examine records of patients for changes in addresses over time, and carefully consider those that have updates to their addresses in the perioperative period. Another concern should be to identify those patients with housing stress, such as homelessness or temporary shelters, and to either examine those cases on an individual basis or remove from the dataset. Removing these patients from the dataset could result in serious bias in populations that care for a large number of housing distressed populations and medical geography teams in these situations should assess how to approach these population subsets and whether geocoding and GA is appropriate for their population. Typically, in our experience, these patients make up much less than 5% of total patients, but they may be of special interest for disparity research.
During the process of geocoding, addresses are cleaned and extracted from the EHR and utilized in an address matching process that relies on large-scale address databases, such as those found in the Business Analyst suite from ESRI(37). The use of an address matching database is essential to the geocoding process as it allows the text address from the EHR to be matched to a text address in the address database which has been encoded to a GIS, thus allowing for the text address from the EHR to be given a latitude and longitude. Various address databases are available for free and for charge, with one popular database being the Google Maps geocoder(50). The main consideration when choosing a geocoder should be patient privacy and federal regulations such as HIPAA. That is because some geocoders, including Google, utilize queries over the internet to perform the address matching process. This results in unsecured data being sent over the internet and a potential HIPAA violation with identifiable data. To address this, we recommend the use of local on machine geocoders, one of which is the ESRI Business Analyst suite.
Address accuracy and typos should also be of concern during geocoding. Typically, GIS software will attempt to match as close as possible during the process and take into account typical and atypical spellings as well as common typos. This is handled typically through a backend address standardization process. Another set of pitfalls emerges when the accuracy of individual geocodes varies according to the information that is standardized. In the first attempt at geocoding, the GIS will attempt to match exact addresses including street numbers. If the street number match fails (e.g., street number does not exist), then the geocoder will attempt to match based on block. That is, if 581 Main Street does not exist, but 580 and 582 do exist, the geocoder will place the address between the two known points. If that is not possible, the geocoder then attempts to place the address on the street that is in the address field, usually the median of the entire street length. Then, if that is not possible, larger geographies are utilized, such as the Zip Code and finally the city and then finally the state level, or if warranted, at the Nation level. It should be noted for these larger geographies, GIS systems will provide a score of accuracy and annotation as to at which level of geography matching has taken place. As described above, matching at the Zip Code level can be problematic and result in misclassification bias. In our geocoded cohort, we noted that greater than 91% of addresses were found to be matched at the street address level, with less than 5% matched at the Zip Code or greater geographic level. These results are typical of geocoding efforts, and once obtained decisions can be made about whether to include Zip Code or greater geography matches in sensitivity analyses.
Integrating geospatial data with qualified clinical registries
For our first case study, we need to integrate data from the National Neighborhood Data Archive (NaNDA) with our local Utah and Yale Multicenter Perioperative Outcomes Group (MPOG) databases; both data repositories are described below. All of our geocoding works and subsequent analyses using the geocoded data have to be reviewed and either approved or declared exempt by IRBs of the Universities of Utah (IRB 00052930; IRB 00154334, IRB 00142167) and Yale, respectively.
NaNDA, the National Neighborhood Data Archive
National Neighborhood Data Archive (NaNDA) contains social determinants of health at the US-census tract level, such as information on the economic, demographic, social, and the built environment. Data in NaNDA is available in multiple spatial scales, including the aforementioned Census Tract, ZCTA as well as county. NaNDA covers geographies across the US, and has various data regarding healthcare, housing, public transit and more. The data goes back to the year 2000, with a special emphasis on American Community Survey(51) Census data to fill in years between decennial census surveys. Assembled by the University of Michigan Institute for Social Research for the purposes of enabling researchers to easily utilize a wide variety of social and environmental datasets, NaNDA is free to use.
Of special interest to this analysis may be the Neighborhood Socioeconomic Disadvantage (NSD) from the NaNDA Socioeconomic Status and Demographic Characteristics by Census Tract dataset.(52) The full dataset contains a variety of variables from the US Census American Community Survey (ACS), with indicators including race, ethnicity, age, income level, employment, poverty and home ownership.(52) These variables were taken from ACS 2008–2012 and 2013–2017, and utilized the 2010 TIGER/Line shapefiles for census tracts. (42) The creation of the NSD included an analysis to derive a set of factors capturing a broad set of neighborhood characteristics that would be representative of social distress across a wide variety of geographies in the United States. NSD combines poverty, unemployment, female-headed families, public assistance households, and proportion of African Americans. In our example analysis, we may use the subset that excludes African Americans due to their low prevalence in our Utah study area. It should also be noted that the secondary NSD index is encouraged to be used in models where Race/Ethnicity is already a covariate.
MPOG, the multicenter perioperative outcomes group registry
The Multicenter Perioperative Outcomes Group (MPOG) is a perioperative electronic health registry holding now over 19 million records from over 60 participating community hospitals and academic medical centers across the United States, but also including data from a medical center in the Netherlands(53, 54). MPOG holds very detailed perioperative clinical data, comprising preexisting disease, surgical diagnosis, intraoperative records, including minute by minute vital signs, postoperative data and to a lesser extent follow-up and long-term outcomes. MPOG does contain demographic data, including patient race/ethnicity, insurance status, but generally social determinants of health in MPOG are sparse and mostly at the level of the individual patient, not the community or built environment the patient originates from, or is exposed to. The Multicenter Perioperative Outcomes Group (MPOG) has a well-established quality improvement arm called ASPIRE(55, 56). ASPIRE could be leveraged also to address perioperative process equity.
Geospatial analyses of perioperative access and process disparities
The data and geospatial statistical modelling for our two projects used as case examples are sketched below, with the explicit caveat that for educational purposes our approaches are deliberately simplified and crude and hence possibly biased. As explicated in Figure 4, geocoding of our entire Utah MPOG cohort dating from 2015 to present achieved an inclusion rate exceeding 91% of all patients in the local Utah MPOG database (for highly matched rate that exceeds level of granularity of the Zip Code). Inferences in our illustrative case study are not valid and discussed only to illustrate the methodological approach of this worked educational example.
Figure 4:
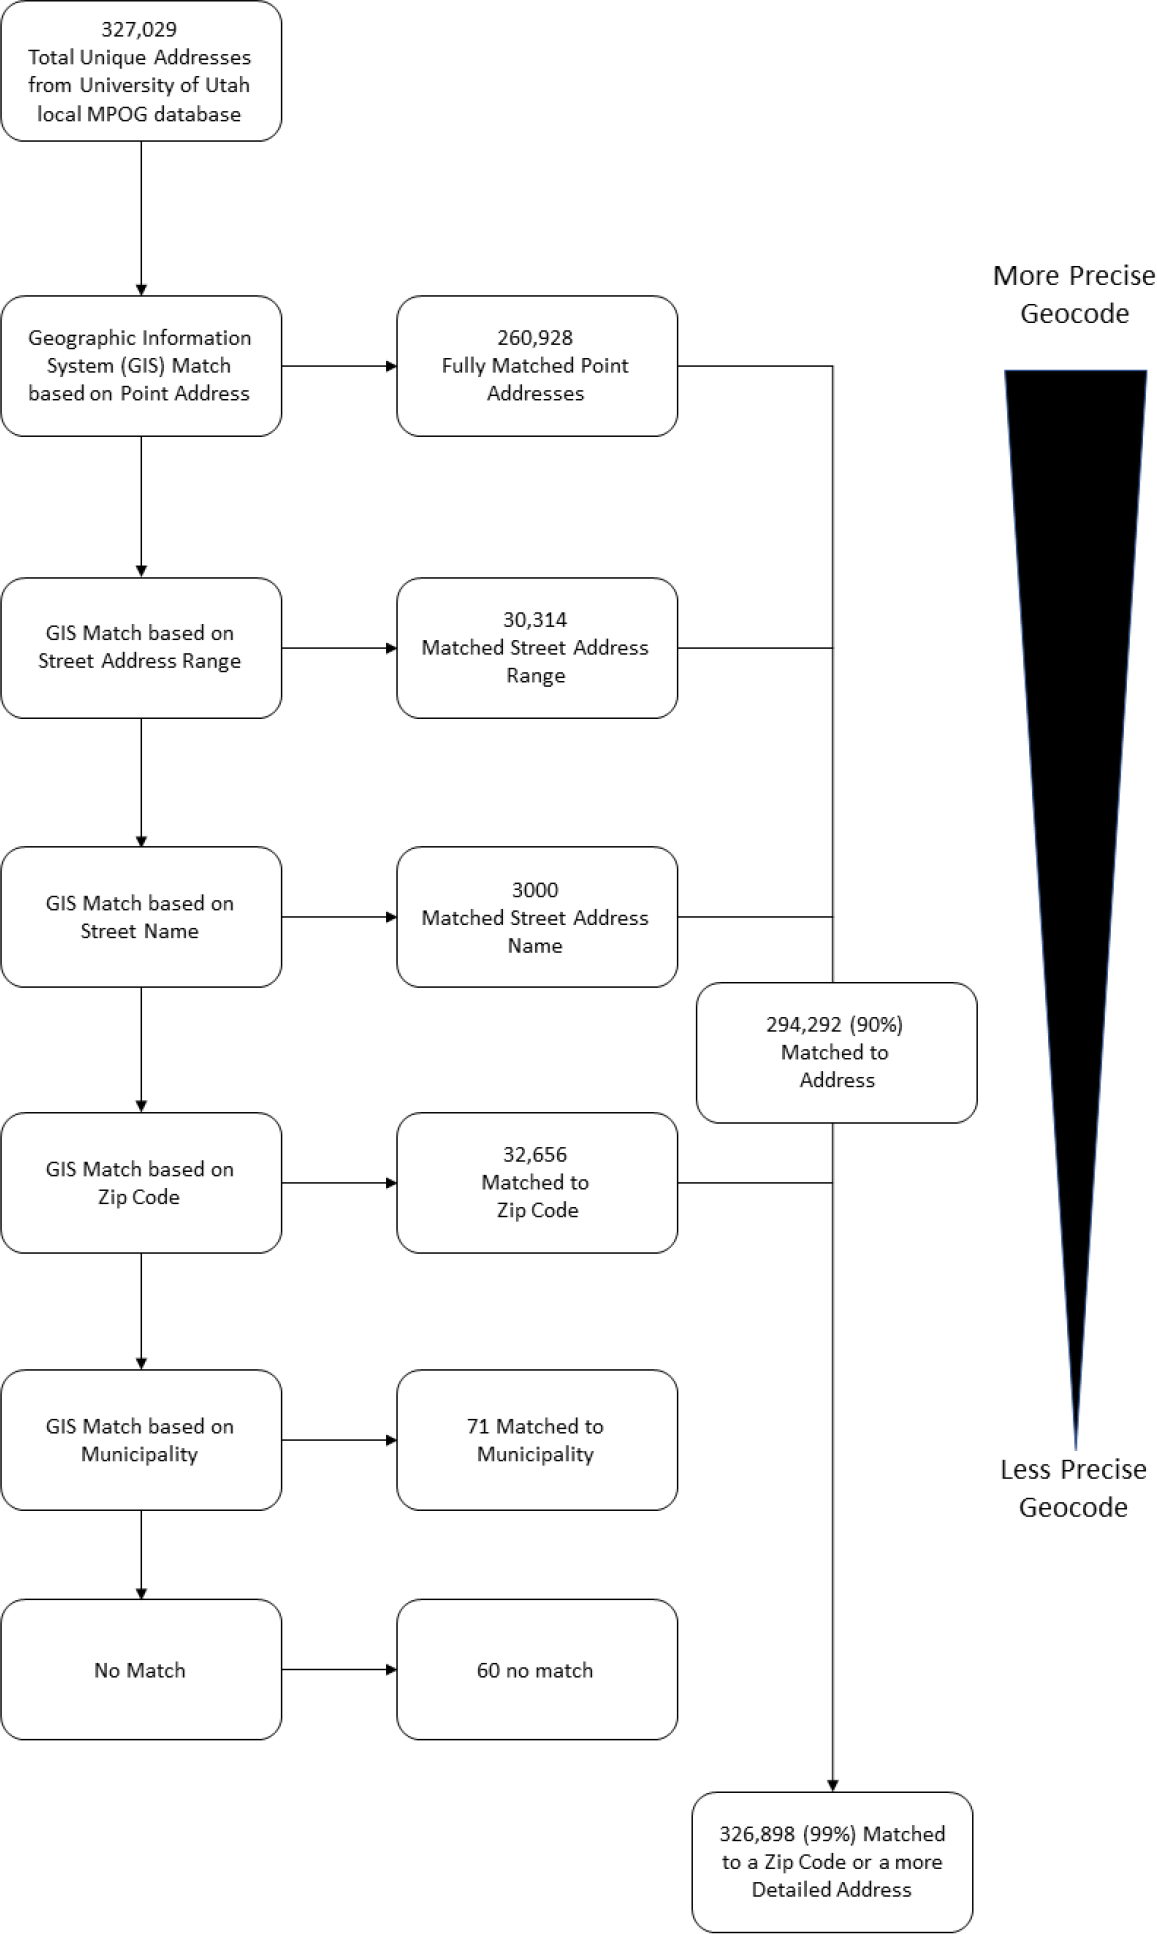
Overview of geocoding workflow with example data from the University of Utah local MPOG database
Data taken from University of Utah cohort detailing number of matches by level of geography. The data is taken from the local MPOG database at the University of Utah. As noted, approximately 90% of matches were at the street address level, meaning the geographic information system(GIS) was able to take a text address from the database and find the same address in the geospatial database with a corresponding latitude and longitude. Additionally, 9.9% were matches based on Zip Code alone, meaning they were matched to the center of the Zip Code in the GIS which is considered less accurate than based on a street address. A small proportion, less than 1%, were unable to be matched.
Case Study I: Antiemetic prophylaxis to measure individual clinician equitable performance
Visual concept of risk responsiveness
We previously proposed to measure the risk-responsive administration of interventions for an individual clinician or team as a scatter plot, where each individual patient case is represented as a dot in a jittered scatter plot of cases for a defined period of time.(17).
The unit of analysis is hence the case, (not the patient, who might have repeated care episodes under the same care team.) We expect to see the dots to align along a regression line with low-risk cases in the left lower corner representing cases receiving fewer interventions; high performing risk-responsive clinicians will administer more interventions to high-risk cases, the dots in the top right-hand corner. The slope of the regression curve is a measure of quality or risk responsiveness(17). In principle, this approach could be applied to any healthcare process, where the number of interventions is tailored to the individual patient risk, such as increasing numbers of measures of prevention to reduce the incidence of postoperative respiratory arrest in patients with obstructive sleep apnea.
Equitable performance contingent on social determinants of health
For the purpose of perioperative disparity research, we apply the concept to risk adjusted antiemetic prophylaxis as a measure of anesthesia quality for an individual anesthesiologist;(17) specifically, by differentiating (coloring) the clinical cases based on (e.g., self-identified race or neighborhood disadvantage index as examples of individual vs. census tract-level) social determinants of health, we refine the concept as a measure of equitable performance(17). The regression line measure risk responsiveness may be steeper in one population than another, with US-census tract level social determinants of health (e.g., NaNDA neighborhood disadvantage index) differentiating who gets “better” or “worse” care, defined in this context as better risk-responsiveness(17).
Statistical model formulation
Going forward we formulate a formal statistical model illustrating the various levels relevant in modelling actual care in our hierarchically structure healthcare system. Our explanatory predictor(s) of interest, (also termed the independent variable) maybe sequentially examined social determinants of health (e.g., individual patient race/ethnicity and/or US census tract level ‘neighborhood disadvantage’ extracted from NaNDA as described above). Our outcome or dependent variable may be a count, the number of antiemetic interventions, which can be modelled better as an ordinal outcome. We may leverage the count of prophylactic pharmacologic antiemetic agents often administered perioperatively to reduce the risk of postoperative nausea and vomiting (PONV), as defined in the PONV05 MPOG/ASPIRE (57)metric to reduce PONV. Risk factors for PONV, as defined in the PONV05 MPOG/ASPIRE metric, is the model covariate to adjust for individual patient risk; they are often measured as a composite 7-level (smoking history, age, gender, history of PONV/motion sickness, opioid use) integer factor and could be included in our models as a monotonic ordinal predictor in the brms package(58). The model may be implemented statistically in R/Rstudio(59). Our analysis should consider the hierarchical systems in healthcare by including random effects for individual clinicians and crossed random effects for US census tract level social determinants of health derived from NaNDA. We recommend the utilization of Bayesian priors to optimize model performance and to test the sensitivity of model for priors and model specifications.
An individual clinician’s antiemetic prophylaxis practice pattern
Clinician-level data on PONV risk, and the corresponding number of interventions, can be leveraged to gauge risk responsiveness and equitable performance for an individual clinician(17). For example, Anesthesiologist # 79, a representative faculty clinician at the University of Utah, administered anesthesia for 149 unique anesthesia cases in the year 2021. The patients PONV risk score for this clinician ranged from 1 to 6, with a median risk score of 4. Patients received a minimum of zero antiemetic interventions, a maximum of 4, with a median of one intervention. This clinician is responsive to individual patient PONV risk factors, administering more antiemetics for more risk factors.
Disparity in antiemetic prophylaxis at the individual clinician level
Further analysis of clinician-level data reveals that Anesthesiologist # 79 is responsive to individual patient PONV risk factors in the cohort of patients originating from affluent US-census tracts, as defined by the top quantile of neighborhood disadvantage geocoded from NaNDA based on the patient address at the time of service, administering more antiemetics for more risk factors. However, in the cohort of patients living in a US-census tract with a higher NaNDA neighborhood disadvantage index, this clinician was less responsive to risk, still increasing the number of interventions in response to individual patient PONV risk factors, but less so compared to this clinician’s responsiveness in patients from more affluent neighborhoods. This disparate performance is a stark demonstration of process disparity at the individual clinician level driven by social determinants of health at the US-census tract level, illustrating the power of geospatial analysis to pinpoint process disparities at the individual clinician level. Our example is congruent with prior data demonstrating consistent subpar administration of antiemetic prophylaxis in minority and marginalized populations after adjusting for PONV risk factors in the cohorts of several US perioperative registries. A hierarchical Bayesian monotonic model, as described above, could examine risk responsiveness across anesthesiologists and investigate if census tract-level SDOH (e.g., neighborhood socioeconomic disadvantage) predict risk adjusted anti-emetic prophylaxis at an individual institution or a data registry.
Potential mechanism explaining disparity in antiemetic prophylaxis.
We hypothesized previously which key drivers might explain process disparities in perioperative antiemetic prophylaxis(17). In a nutshell, if risk factors are not consistently elicited in all patients, treatment decisions may be based instead on biased assumptions about risks of individuals contingent on appearance (e.g., “This patient looks like a smoker”). Clinicians might omit more expensive antiemetics in patients without insurance coverage to reduce the medical bill. Regardless of the mechanism, the result is unfair undertreatment of populations at risk. On the other hand, such granular investigations could help to identify precise actionable mechanisms.
Case study II: Geospatial investigation of disparities in cataract surgery access
State-level policy may predict access to cataract surgery at the cusp of Medicare eligibility
We may hypothesize that state, community-, and individual-level social determinants of health could drive access to cataract surgery, from cataract development, to diagnosis, to decision to operate, to scheduling and successful surgery. We could examine if at age 65, the cusp of eligibility for Medicare, the number of cataract cases suddenly increases abruptly, driven by geospatial factors like state-level participation in Medicaid expansion. The hypotheses might be that patients delay cataract surgery until they reach Medicare eligibility at age 65 if they (a) live in a state that did not participate in the Medicaid expansion program and (b) are poorer.
Prior to age 65, approximately 12% of Americans are insured through Medicare, and within months of turning age 65, that proportion grows to almost 80%, decreasing the number of uninsured Americans(60, 61). One in ten Americans becomes newly covered by health insurance following their 65th birthday(61). Prior research demonstrated discontinuities in utilization of deferable healthcare services like orthopedic or cataract surgery, which patients may delay until their Medicare eligibility, contingent on their race, income and where they live.(60–62) We could seek to leverage this natural experiment, in which some states participated in the Medicaid state-level expansion as allowed under the Affordable Care Act (ACA), while others did not. Medicaid state-level expansion would be expected to reduce the Medicare discontinuity in those states which participated. Conversely, the discontinuity at age 65 should be more accentuated in states that failed to vote for Medicaid expansion under the ACA.
The effect of Medicaid state-level expansion may be further augmented or attenuated by social determinants of health, further supporting the inference that Medicaid state-level expansion impacts access to cataract surgery in marginalized populations.
Regression discontinuity: a quasi-experimental approach to geospatial causal inference
Below we explicate the underlying methodological approach, a quasi-experimental regression discontinuity approach, as a methodological design that allows robust statistical inference when group allocation is by a threshold, for example CD4 cell count for ART therapy initiation in HIV patients, or in our case patient age(63, 64).
The principal idea is that just above or below the threshold (a) cases are very similar due to random variability, (b) the relationship between the threshold and the outcome is continuous. In technical jargon, the treatment assignment is ignorable, in other words group allocation is independent of the outcome of interest, just as in randomized controlled trial. This assumption is strengthened if there is some imprecision, (and therefore randomness in group allocation) in measuring the threshold, as in the case of the CD4 count(63, 64). Unlike for many assumptions in causal inference, a balance check can be performed to demonstrate that population characteristics are similar for the group just below and above the threshold.
Regression discontinuity analysis holds promise especially in geospatial approaches in health systems science as geographically distributed environmental hazards such as pollution(65), or local government regulations, e.g., different eligibility for programs contingent on birth date(66) in different geographically defined jurisdictions, (as in our case Medicaid expansion vs non-expansion states), can all be leveraged as thresholds for exposure allocation(64).
For regression discontinuity, the continuity assumption of the assignment variable must be met to refute concerns about manipulation of the assignment variable at the threshold, (which would result in a bump at the threshold in a histogram); in our case study, it is obvious that age requirements for Medicare eligibility cannot not be manipulated. Consistency and positivity are two additional regression discontinuity assumptions.
We could use the patient age for each cohort as the running variable, and the cusp of eligibility for Medicare, (age 65) as the discontinuity threshold. The social determinants of health at different levels, (e.g., State-level differences with regards to insurance coverage between Medicaid expansion vs. non-expansion states, US-census tract-level NaNDA neighborhood disadvantage, or individual patient-level Black race) can be regarded as introducing exogenous circumstances, (i.e., discontinuities) in the number of events (cataract cases) per age groups of patients. This “design” constitutes a natural experiment allowing the comparison of barriers to access contingent on social determinants of health between patients with cataract presenting before and after our threshold (65 years of age, the cusp of Medicare eligibility(67). The quasi-random exposure to different social policy implies that assignment to different levels of insurance coverage is “as good as random” for patients close to either side of the Medicare eligibility (our threshold)(63, 64, 67). We can test with the underlying assumptions of the regression discontinuity design with the data available(63, 64).
To visually explore the data, we could perform a very simple discontinuity regression analyses with one or multiple change points and hierarchical linear segments using Bayesian inference in the statistical programming environment R/Rstudio with the program package mcp (68) (69).
State-level disparity in access to cataract surgery
State level and census tract level social determinants of health are variables explaining disparities in access to cataract surgery, as a sudden increase in cases at the age of 65 is evident in only those states that did not participate in Medicaid expansion and this discontinuity is accentuated in socioeconomically disadvantaged populations. This illustration is only meant to demonstrate the power of geospatial analysis of state-level policy factors, not to draw actual inferences. The Utah change point model easily detects a change point at age 65, the cusp of Medicare eligibility, while the Yale (Connecticut) change point model does not. While the State of Utah did not participate in Medicare expansion, Connecticut did. We might infer that better access to insurance in Connecticut due to Medicare expansion led fewer patients to defer cataract surgery, hence we would not detect a discontinuity in the number of cases per age group in Connecticut. In contrast, in the absence of Medicare expansion in Utah, more patients in Utah may have to delay their elective cataract surgery for financial reasons until they reach age 65, when they become Medicare eligible.
Neighborhood disadvantage driving disparity in cataract surgery access
This is an example of geospatial analysis at multiple levels, the state and the US-census tract; at the state level, we investigated the possible impact of differences in public policy (Medicaid expansion in Connecticut, but not in Utah) on access to cataract surgery. This analysis could be further refined by considering a more granular level for geospatial analysis, leveraging US-census tract-level social determinants of health, e.g., the NaNDA composite neighborhood disadvantage. If socioeconomic pressure leads patients to defer necessary surgery, such effects may be accentuated in economically and otherwise disadvantaged populations.
Limitations of geospatial discontinuity regression
We caution that the seemingly compelling story told by the cataract surgery example may be confounded by concurrent but separate mechanism occurring at the age threshold of 65 years. One mechanism driven by reaching the age of 65 is enrollment into Medicare, but another may be retirement. Retirement may trigger life changes that undermine the assumptions of regression discontinuity analysis. As an example, retirement may lead to movement in and out of the cohort under investigation, as retirees move to Florida. Retirees may have more time to attend medical care, overcoming barriers due to inflexible work hours. Also, presumed state level mechanisms, (e.g., Connecticut’s participation in Medicaid expansion) may occur alongside other state-level public policy mechanisms with similar or opposite effects, confounding the causal link in unknown directions which could lead to faulty inferences. Likewise, while census tracts are designed to encompass socially more homogenous populations than Zip Codes, misclassification still occurs, with affluent patients moving into poor neighborhoods, for example during periods of gentrification. This illustrates the ecological fallacy, making inferences about individual member of a group, based on average group characteristics.
Case Study III: Transit access as Social Determinant of Health
Our final example demonstrates the simple power of combining publicly available geographic datasets to examine patient populations at risk. Lack of access to frequent, reliable public transit and mobility, such as owning a vehicle, has been associated with deleterious health outcomes (70–72). This lack of access to mobility places patients at risk of missing surgeries, missing follow up appointments, and inability to access needed medications in a timely manner. On top of this, lack of access to reliable transit can place patients at high risk of tardiness at places of employment, difficulties in accessing and obtaining childcare, and a disproportionate burden of private vehicle ownership and its associated costs on those least able to afford them(73).
Therefore, understanding patient access to transit is important to further elucidate which communities in your patient population are at even greater risk of adverse outcomes in the perioperative period. The NaNDA database does in fact contain information about public transit access in its Public Transit Stops by Census Tract (also available by ZCTA) dataset(74). This dataset contains information recorded in 2016–2018 from the April 2019 NTM Stops GIS dataset within the National Transit Map Data Catalog(75). The data contains the number of transit stops by specified geographic area, in this case Census Tract and ZCTA. While useful, utilizing this dataset would lead to significant shortcomings in any analysis of transit access. First, the transit data pre-dates the COVID-19 pandemic, which has seen dramatic cuts in public transit across the United States. Second, the data contains information only on transit stops, not on frequency or mode of transit. This means that hourly stops in a rural Census Tract may be seen as equivalent to a more urban area with more frequent service. Third, by providing no information about direction of travel or routes, it is difficult to understand travel times. For instance, many cities have gaps in coverage that can result in extended travel times to travel across municipalities and require time consuming transfers at hub stations. While a helpful steppingstone to understanding the impact of transit on health, the NaNDA dataset is inadequate for more detailed analysis.
Interaction of neighborhood disadvantage with access to public transit
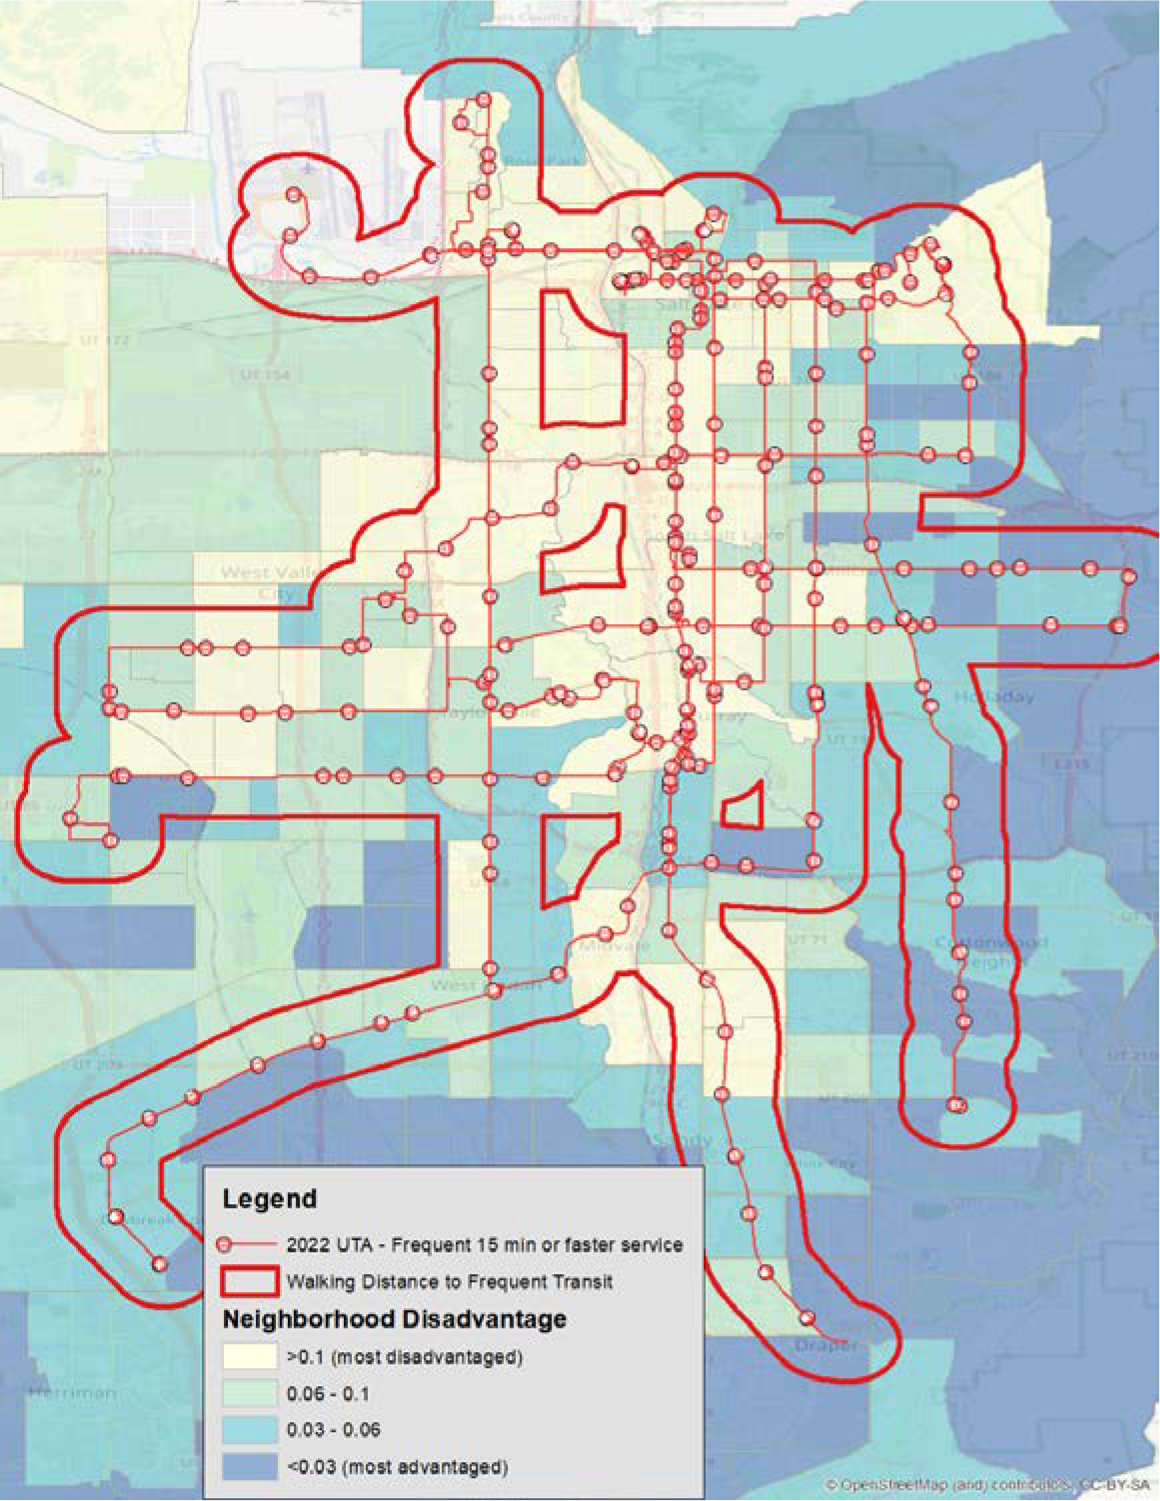
To better understand transits interaction with health, it is necessary to become familiar with the local data available at your state or municipality with regards to public transit. This is another point of collaboration to discuss when working with health geographers. For our example, we were able to obtain data on both route and frequency from the Utah Geospatial Resource Center(76). From this, we were able to select the routes which had 15 minute or greater frequency, which is the commonly accepted legal definition of frequent transit(77). We then applied a geographic buffer to the routes, representative of acceptable walking distance to a frequent transit stop. In this instance, we utilized a 1000-meter buffer which would represent an approximately 15-minute walking time. We then overlaid the resulting buffer data on the NaNDA neighborhood socioeconomic disadvantage (NSD) in order to examine which patient populations and geographies were at greater risk of adverse outcomes resulting from both their neighborhood characteristics and their access to transit. Doing so provides us with more information, and information that could be acted upon in ways such as making available free rides and pickup service, such as those offered by Circulation Health and others,(78) as well as serve as a discussion point for interactions with transit agencies on ways to improve health equity. The results of this analysis are presented in Figure 5.
Figure 5:
Neighborhood disadvantage and access to public transport
The hatched area represents a less than 15-minute walking distance to frequent transit lines, which is overlayed on the NSD score. Notably, the use of transit frequency is better able to elucidate neighborhood stress and obstacles to care compared with a raw count of transit stops available. Gaps in coverage can be seen on the western side of Salt Lake County as well as central areas bordering highways.
As we can see from the above map, there are several communities that are of greater risk in terms of their NSD scores and have this risk compounded by their lack of access to frequent transit. This simple example demonstrates how a cross-disciplinary collaboration with Geography, and the use of outside geographic data that is typically not included in healthcare research and analysis, can lead to improved understanding of at-risk patient populations.
Conclusion
We hope to have illustrated how the integration of social determinants of health with granular clinical data, how in-depth understanding of perioperative processes and geospatial analysis can lead to thought-provoking and actionable insights into perioperative disparities. Analyzing and interpreting geographic data requires expertise and careful consideration, as the misclassification in Flint, Michigan and our own examples (cataract surgery discontinuity, public transit access) demonstrate. Consultation with geographers early in the process and an understanding of local geographies and processes is imperative. As our cataract surgery regression discontinuity analysis illustrates, concurrent parallel processes can confound the geospatial analysis, e.g., the inflow and outflow from the cohort under investigation, triggered by a concurrent process (e.g., retirement).
As the field of Anesthesiology and perioperative medicine begins to explore the influence of social determinants of health on perioperative access, process, and outcomes, we as clinicians and researchers should investigate the upstream and downstream social processes and drivers of health which can significantly influence perioperative health: these social determinants of health are fundamental causes of disease, but currently not coded/recorded in most electronic health system. However, we can geocode context at the individual, neighborhood, city, and state level to enrich our EHR to identify mechanisms leading to perioperative disparities with a view to devise and test and implement effective countermeasures. At the dawn of our field, John Snow leveraged geography to pinpoint an easy solution for a dreadful disease; nearly two centuries later, we can use the insights of geography to drive our understanding of how the social and built environments impact the process and outcomes of perioperative medicine.
Figure 1:
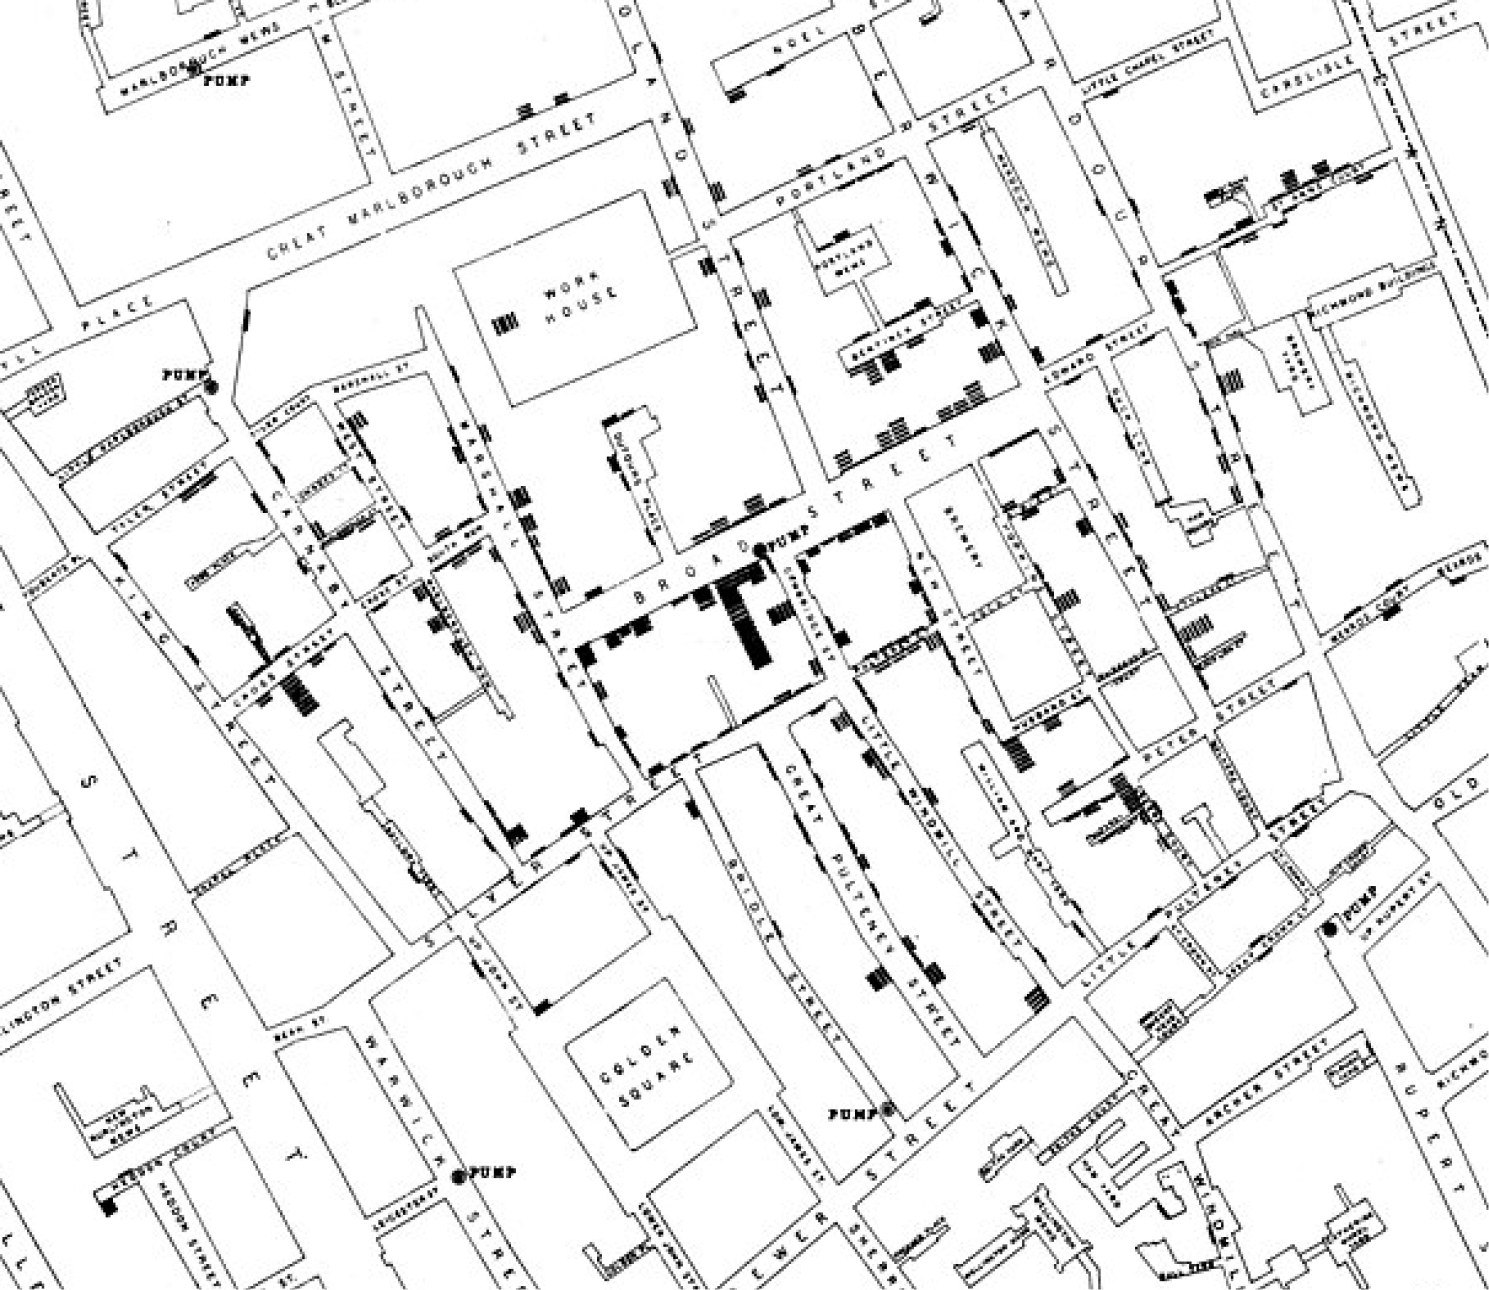
John Snow Map on mode of communication of cholera
This figure is taken from the map of the book “On the Mode of Communication of Cholera” by John Snow, published in 1854 C.F. Cheffins, Lith, Southampton. Use is in public domain. This is the first example in the literature of a dot map used to display density of cases in a geographic context and is a foundational map of medical geography and epidemiology.
Acknowledgments:
Dr. Schonberger is supported in part by a research grant from the US National institutes of Health (NIA R01AG059607). The viewpoints expressed in the manuscript are those of the authors and do not necessarily reflect the views of the NIA, NIH, or United States government.
Footnotes
Conflict of interests
Dr. Schonberger reports owning stock in Johnson & Johnson unrelated to the present work. Dr. Schonberger reports that his organization receives funding from Merck, Inc. for a study in which he is co-investigator unrelated to the present work. Dr. Andreae is part of a study funded by Merck unrelated to the present work. No other author has any conflicts to declare.
References
- 1.Holzman RS. John Snow: Anesthesiologist, Epidemiologist, Scientist, and Hero. Anesth Analg. 2021;133(6):1642–50. doi: 10.1213/ANE.0000000000005586. [DOI] [PubMed] [Google Scholar]
- 2.Gavrilova ML. Generalized Voronoi diagram : a geometry-based approach to computational intelligence. Berlin; London: Springer; 2008. xxi, 312 p. p. [Google Scholar]
- 3.McLeod KS. Our sense of Snow: the myth of John Snow in medical geography. Soc Sci Med. 2000;50(7–8):923–35. doi: 10.1016/s0277-9536(99)00345-7. [DOI] [PubMed] [Google Scholar]
- 4.Walford NS. Demographic and social context of deaths during the 1854 cholera outbreak in Soho, London: a reappraisal of Dr John Snow’s investigation. Health Place. 2020;65:102402. Epub 20200818. doi: 10.1016/j.healthplace.2020.102402. [DOI] [PMC free article] [PubMed] [Google Scholar]
- 5.Miller CE, Vasan RS. The southern rural health and mortality penalty: A review of regional health inequities in the United States. Soc Sci Med. 2021;268:113443. Epub 20201023. doi: 10.1016/j.socscimed.2020.113443. [DOI] [PMC free article] [PubMed] [Google Scholar]
- 6.Shah P, Shao Y, Geller AC, Polsky D. Late-Stage Melanoma in New York State: Associations with Socioeconomic Factors and Healthcare Access at the County Level. The Journal of investigative dermatology. 2021;141(7):1699–706.e7. Epub 20210128. doi: 10.1016/j.jid.2020.12.027. [DOI] [PubMed] [Google Scholar]
- 7.McGrath P. ‘You never leave work when you live on a cattle property’: Special problems for rural property owners who have to relocate for specialist treatment. Aust J Rural Health. 2015;23(5):286–90. Epub 20150506. doi: 10.1111/ajr.12191. [DOI] [PubMed] [Google Scholar]
- 8.Ugalde A, Blaschke S, Boltong A, Schofield P, Aranda S, Phipps-Nelson J, et al. Understanding rural caregivers’ experiences of cancer care when accessing metropolitan cancer services: a qualitative study. BMJ open. 2019;9(7):e028315. Epub 20190711. doi: 10.1136/bmjopen-2018-028315. [DOI] [PMC free article] [PubMed] [Google Scholar]
- 9.Siegel RL, Miller KD, Fuchs HE, Jemal A. Cancer Statistics, 2021. CA: a cancer journal for clinicians. 2021;71(1):7–33. Epub 2021/01/13. doi: 10.3322/caac.21654. [DOI] [PubMed] [Google Scholar]
- 10.Bilimoria KY, Balch CM, Wayne JD, Chang DC, Palis BE, Dy SM, et al. Health care system and socioeconomic factors associated with variance in use of sentinel lymph node biopsy for melanoma in the United States. Journal of clinical oncology : official journal of the American Society of Clinical Oncology. 2009;27(11):1857–63. Epub 20090309. doi: 10.1200/jco.2008.18.7567. [DOI] [PubMed] [Google Scholar]
- 11.Shah DR, Yang AD, Maverakis E, Martinez SR. Assessing rural-urban disparities in the use of sentinel lymph node biopsy for melanoma. The Journal of surgical research. 2013;184(2):1157–60. Epub 20130606. doi: 10.1016/j.jss.2013.04.091. [DOI] [PubMed] [Google Scholar]
- 12.Zafar FS, Abid R, Ginader T, Powers JG. Rural health disparities in melanoma staging and prognostic outcomes in Iowa. Journal of the American Academy of Dermatology. 2021;84(6):1727–30. Epub 20200827. doi: 10.1016/j.jaad.2020.08.092. [DOI] [PubMed] [Google Scholar]
- 13.Yang JJ, Maloney NJ, Cheng K, Bach DQ. Financial burden in US patients with melanoma from 1997 to 2015: Racial disparities, trends, and predictors of high expenditures. Journal of the American Academy of Dermatology. 2021;84(3):819–21. Epub 20200717. doi: 10.1016/j.jaad.2020.07.051. [DOI] [PubMed] [Google Scholar]
- 14.Brauer M How much, how long, what, and where: air pollution exposure assessment for epidemiologic studies of respiratory disease. Proc Am Thorac Soc. 2010;7(2):111–5. doi: 10.1513/pats.200908-093RM. [DOI] [PubMed] [Google Scholar]
- 15.Cram P, Pham HH, Bayman L, Vaughan-Sarrazin MS. Insurance status of patients admitted to specialty cardiac and competing general hospitals: are accusations of cherry picking justified? Med Care. 2008;46(5):467–75. doi: 10.1097/MLR.0b013e31816c43d9. [DOI] [PubMed] [Google Scholar]
- 16.Desai AA, Bolus R, Nissenson A, Chertow GM, Bolus S, Solomon MD, et al. Is there “cherry picking” in the ESRD Program? Perceptions from a Dialysis Provider Survey. Clin J Am Soc Nephrol. 2009;4(4):772–7. Epub 20090401. doi: 10.2215/CJN.05661108. [DOI] [PMC free article] [PubMed] [Google Scholar]
- 17.Andreae MH, Maman SR, Behnam AJ. An Electronic Medical Record-Derived Individualized Performance Metric to Measure Risk-Adjusted Adherence with Perioperative Prophylactic Bundles for Health Care Disparity Research and Implementation Science. Appl Clin Inform. 2020;11(3):497–514. Epub 20200729. doi: 10.1055/s-0040-1714692. [DOI] [PMC free article] [PubMed] [Google Scholar]
- 18.Rubin R How Value-Based Medicare Payments Exacerbate Health Care Disparities. JAMA. 2018;319(10):968–70. doi: 10.1001/jama.2018.0240. [DOI] [PubMed] [Google Scholar]
- 19.Link BG. Social Conditions As Fundamental Causes of Disease Journal of Health and Social Behavior. 1995:80–94. doi: 10.2307/2626958 [DOI] [PubMed] [Google Scholar]
- 20.Chen C, Mpody C, Sivak E, Tobias JD, Nafiu OO. Racial disparities in postoperative morbidity and mortality among high-risk pediatric surgical patients. J Clin Anesth. 2022;81:110905. Epub 20220610. doi: 10.1016/j.jclinane.2022.110905. [DOI] [PubMed] [Google Scholar]
- 21.Andreae MH, Nair S, Gabry JS, Goodrich B, Hall C, Shaparin N. A pragmatic trial to improve adherence with scheduled appointments in an inner-city pain clinic by human phone calls in the patient’s preferred language. J Clin Anesth. 2017;42:77–83. Epub 20170823. doi: 10.1016/j.jclinane.2017.08.014. [DOI] [PMC free article] [PubMed] [Google Scholar]
- 22.Schonberger RB, Dai F, Michel G, Vaughn MT, Burg MM, Mathis M, et al. Association of propofol induction dose and severe pre-incision hypotension among surgical patients over age 65. J Clin Anesth. 2022;80:110846. Epub 20220427. doi: 10.1016/j.jclinane.2022.110846. [DOI] [PMC free article] [PubMed] [Google Scholar]
- 23.Goyal MK, Kuppermann N, Cleary SD, Teach SJ, Chamberlain JM. Racial Disparities in Pain Management of Children With Appendicitis in Emergency Departments. JAMA Pediatr. 2015;169(11):996–1002. doi: 10.1001/jamapediatrics.2015.1915. [DOI] [PMC free article] [PubMed] [Google Scholar]
- 24.Williamson CG, Sanaiha Y, Tran Z, Hadaya J, Verma A, Pan C, et al. Disparities in cardiac arrest and failure to rescue after major elective noncardiac operations. Surgery. 2022;171(5):1358–64. Epub 20220131. doi: 10.1016/j.surg.2021.09.001. [DOI] [PubMed] [Google Scholar]
- 25.Perez-Stable EJ, Jean-Francois B, Aklin CF. Leveraging Advances in Technology to Promote Health Equity. Med Care. 2019;57 Suppl 6 Suppl 2:S101–S3. doi: 10.1097/MLR.0000000000001112. [DOI] [PubMed] [Google Scholar]
- 26.Cruz TM, Smith SA. Health Equity Beyond Data: Health Care Worker Perceptions of Race, Ethnicity, and Language Data Collection in Electronic Health Records. Med Care. 2021;59(5):379–85. doi: 10.1097/MLR.0000000000001507. [DOI] [PubMed] [Google Scholar]
- 27.Kawachi I, Daniels N, Robinson DE. Health disparities by race and class: why both matter. Health Aff (Millwood). 2005;24(2):343–52. doi: 10.1377/hlthaff.24.2.343. [DOI] [PubMed] [Google Scholar]
- 28.Mobley LR, Root E, Anselin L, Lozano-Gracia N, Koschinsky J. Spatial analysis of elderly access to primary care services. Int J Health Geogr. 2006;5:19. Epub 20060515. doi: 10.1186/1476-072X-5-19. [DOI] [PMC free article] [PubMed] [Google Scholar]
- 29.Asare EA, Andreae MH, Stewart JHt. Bridging the Disparity Gap in Surgical Oncology Access: Does Telehealth Hold a Key? Ann Surg Oncol. 2022. Epub 20220719. doi: 10.1245/s10434-022-12262-0. [DOI] [PMC free article] [PubMed] [Google Scholar]
- 30.Toyobo O, Guglielminotti J, Andreae DA, Andreae MH. Health equity research in obstetric anesthesia. Curr Opin Anaesthesiol. 2022;35(3):306–16. doi: 10.1097/ACO.0000000000001135. [DOI] [PMC free article] [PubMed] [Google Scholar]
- 31.Okoro ON, Hillman LA, Cernasev A. Intersectional invisibility experiences of low-income African-American women in healthcare encounters. Ethn Health. 2022;27(6):1290–309. Epub 20210318. doi: 10.1080/13557858.2021.1899138. [DOI] [PubMed] [Google Scholar]
- 32.Andreae MH, Gabry JS, Goodrich B, White RS, Hall C. Antiemetic Prophylaxis as a Marker of Health Care Disparities in the National Anesthesia Clinical Outcomes Registry. Anesth Analg. 2018;126(2):588–99. doi: 10.1213/ANE.0000000000002582. [DOI] [PMC free article] [PubMed] [Google Scholar]
- 33.Richardson LD, Babcock Irvin C, Tamayo-Sarver JH. Racial and ethnic disparities in the clinical practice of emergency medicine. Acad Emerg Med. 2003;10(11):1184–8. doi: 10.1111/j.1553-2712.2003.tb00601.x. [DOI] [PubMed] [Google Scholar]
- 34.Sequist TD, Adams A, Zhang F, Ross-Degnan D, Ayanian JZ. Effect of quality improvement on racial disparities in diabetes care. Arch Intern Med. 2006;166(6):675–81. doi: 10.1001/archinte.166.6.675. [DOI] [PubMed] [Google Scholar]
- 35.Library H-TM. Library Guides: Geographic Information Systems Library Guide: Spatial Analysis and Geoprocessing.
- 36.What is geocoding?—ArcMap | Documentation.
- 37.Scott D Research Guides: GIS (Geographic Information Systems): ArcGIS Business Analyst.
- 38.Ritchie D Our zip code may be more important than our genetic code: social determinants of health, law and policy. R I Med J (2013). 2013;96(7):14. Epub 20130701. [PubMed] [Google Scholar]
- 39.Terrell E. Research Guides: This Month in Business History: ZIP Code Introduced. [Google Scholar]
- 40.What Is Redlining? - The New York Times. [Google Scholar]
- 41.Bureau USC. DATA GEM: What is a ZCTA? Making Sense of Census Geography. Censusgov. [Google Scholar]
- 42.Bureau USC. TIGER/Line Shapefiles and TIGER/Line Files Technical Documentation. Censusgov. [Google Scholar]
- 43.How ZIP codes nearly masked the lead problem in Flint.
- 44.Hanna-Attisha M, LaChance J, Sadler RC, Champney Schnepp A. Elevated Blood Lead Levels in Children Associated With the Flint Drinking Water Crisis: A Spatial Analysis of Risk and Public Health Response. Am J Public Health. 2016;106(2):283–90. Epub 20151221. doi: 10.2105/AJPH.2015.303003. [DOI] [PMC free article] [PubMed] [Google Scholar]
- 45.IJNR Snapshots: The human and environmental costs of emergency management in Detroit and Flint | Great Lakes Now. [Google Scholar]
- 46.Kilbourne AM, Switzer G, Hyman K, Crowley-Matoka M, Fine MJ. Advancing health disparities research within the health care system: a conceptual framework. Am J Public Health. 2006;96(12):2113–21. Epub 20061031. doi: 10.2105/AJPH.2005.077628. [DOI] [PMC free article] [PubMed] [Google Scholar]
- 47.Bazemore AW, Cottrell EK, Gold R, Hughes LS, Phillips RL, Angier H, et al. “Community vital signs”: incorporating geocoded social determinants into electronic records to promote patient and population health. J Am Med Inform Assoc. 2016;23(2):407–12. Epub 20150713. doi: 10.1093/jamia/ocv088. [DOI] [PubMed] [Google Scholar]
- 48.Nhavoto JA, Gronlund A. Mobile technologies and geographic information systems to improve health care systems: a literature review. JMIR Mhealth Uhealth. 2014;2(2):e21. Epub 20140508. doi: 10.2196/mhealth.3216. [DOI] [PMC free article] [PubMed] [Google Scholar]
- 49.About NaNDA | Nanda (National Neighborhood Data Archive).
- 50.Overview | Geocoding API | Google Developers.
- 51.Bureau USC. American Community Survey (ACS). Censusgov. [Google Scholar]
- 52.Robert Melendez UoMIfSR, Philippa Clarke UoMIfSR, Anam Khan UoMIfSR, Iris Gomez-Lopez UoMIfSR, Mao Li UoMIfSR, Megan Chenoweth UoMIfSR. National Neighborhood Data Archive (NaNDA): Socioeconomic Status and Demographic Characteristics of Census Tracts, United States, 2008–2017. 2020. doi: 10.3886/E119451V2. [DOI] [Google Scholar]
- 53.Colquhoun DA, Shanks AM, Kapeles SR, Shah N, Saager L, Vaughn MT, et al. Considerations for Integration of Perioperative Electronic Health Records Across Institutions for Research and Quality Improvement: The Approach Taken by the Multicenter Perioperative Outcomes Group. Anesth Analg. 2020;130(5):1133–46. doi: 10.1213/ANE.0000000000004489. [DOI] [PMC free article] [PubMed] [Google Scholar]
- 54.Kheterpal S Clinical research using an information system: the multicenter perioperative outcomes group. Anesthesiol Clin. 2011;29(3):377–88. doi: 10.1016/j.anclin.2011.06.002. [DOI] [PubMed] [Google Scholar]
- 55.McCormick PJ, Yeoh C, Vicario-Feliciano RM, Ervin K, Tan KS, Yang G, et al. Improved Compliance With Anesthesia Quality Measures After Implementation of Automated Monthly Feedback. J Oncol Pract. 2019;15(6):e583–e92. Epub 20190520. doi: 10.1200/JOP.18.00521. [DOI] [PMC free article] [PubMed] [Google Scholar]
- 56.McCormick PJ, Yeoh CB, Hannum M, Tan KS, Vicario-Feliciano RM, Mehta M, et al. Institution of Monthly Anesthesia Quality Reports Does Not Reduce Postoperative Complications despite Improved Metric Compliance. J Med Syst. 2020;44(11):189. Epub 20200922. doi: 10.1007/s10916-020-01659-7. [DOI] [PMC free article] [PubMed] [Google Scholar]
- 57.Group MPO. MPOG Measure PONV-05. Ann Arbor, MI: 2022. [Google Scholar]
- 58.Burkner PC, Charpentier E. Modelling monotonic effects of ordinal predictors in Bayesian regression models. Br J Math Stat Psychol. 2020;73(3):420–51. Epub 20200113. doi: 10.1111/bmsp.12195. [DOI] [PubMed] [Google Scholar]
- 59.RStudio | Open source & professional software for data science teams - RStudio.
- 60.Card D, Dobkin C, Maestas N. The Impact of Nearly Universal Insurance Coverage on Health Care Utilization: Evidence from Medicare. Am Econ Rev. 2008;98(5):2242–58. doi: 10.1257/aer.98.5.2242. [DOI] [PMC free article] [PubMed] [Google Scholar]
- 61.Card D, Dobkin C, Maestas N. Does Medicare Save Lives? Q J Econ. 2009;124(2):597–636. doi: 10.1162/qjec.2009.124.2.597. [DOI] [PMC free article] [PubMed] [Google Scholar]
- 62.McWilliams JM, Meara E, Zaslavsky AM, Ayanian JZ. Use of health services by previously uninsured Medicare beneficiaries. N Engl J Med. 2007;357(2):143–53. doi: 10.1056/NEJMsa067712. [DOI] [PubMed] [Google Scholar]
- 63.Oldenburg CE, Moscoe E, Barnighausen T. Regression Discontinuity for Causal Effect Estimation in Epidemiology. Curr Epidemiol Rep. 2016;3:233–41. Epub 20160805. doi: 10.1007/s40471-016-0080-x. [DOI] [PMC free article] [PubMed] [Google Scholar]
- 64.Bor J, Moscoe E, Mutevedzi P, Newell ML, Barnighausen T. Regression discontinuity designs in epidemiology: causal inference without randomized trials. Epidemiology. 2014;25(5):729–37. doi: 10.1097/EDE.0000000000000138. [DOI] [PMC free article] [PubMed] [Google Scholar]
- 65.Chen Y, Ebenstein A, Greenstone M, Li H. Evidence on the impact of sustained exposure to air pollution on life expectancy from China’s Huai River policy. Proc Natl Acad Sci U S A. 2013;110(32):12936–41. Epub 20130708. doi: 10.1073/pnas.1300018110. [DOI] [PMC free article] [PubMed] [Google Scholar]
- 66.Bor J, editor Cash transfers and teen pregnancy in South Africa: evidence from a natural experiment. . Northeast Universities Development Consortium Conference; 2013; Cambridge, MA: Harvard University. [Google Scholar]
- 67.Buitrago G, Moreno-Serra R. Conflict violence reduction and pregnancy outcomes: A regression discontinuity design in Colombia. PLoS Med. 2021;18(7):e1003684. Epub 20210706. doi: 10.1371/journal.pmed.1003684. [DOI] [PMC free article] [PubMed] [Google Scholar]
- 68.Regression with Multiple Change Points.
- 69.Aiken ARA, Starling JE, Gomperts R, Scott JG, Aiken CE. Demand for self-managed online telemedicine abortion in eight European countries during the COVID-19 pandemic: a regression discontinuity analysis. BMJ Sex Reprod Health. 2021;47(4):238–45. Epub 20210111. doi: 10.1136/bmjsrh-2020-200880. [DOI] [PMC free article] [PubMed] [Google Scholar]
- 70.McLafferty SL. GIS and health care. Annu Rev Public Health. 2003;24:25–42. Epub 20021023. doi: 10.1146/annurev.publhealth.24.012902.141012. [DOI] [PubMed] [Google Scholar]
- 71.James P, Ito K, Buonocore JJ, Levy JI, Arcaya MC. A Health Impact Assessment of Proposed Public Transportation Service Cuts and Fare Increases in Boston, Massachusetts (U.S.A.). International Journal of Environmental Research and Public Health. 2014;11(8):8010–24. doi: 10.3390/ijerph110808010. [DOI] [PMC free article] [PubMed] [Google Scholar]
- 72.Public Transportation In The US: A Driver Of Health And Equity | Health Affairs.
- 73.Syed ST, Gerber BS, Sharp LK. Traveling towards disease: transportation barriers to health care access. J Community Health. 2013;38(5):976–93. doi: 10.1007/s10900-013-9681-1. [DOI] [PMC free article] [PubMed] [Google Scholar]
- 74.Philippa Clarke UoMIfSR Robert Melendez UoMIfSR. National Neighborhood Data Archive (NaNDA): Public Transit Stops by Census Tract, United States, 2016–2018. 2019. doi: 10.3886/E111109V1. [DOI] [Google Scholar]
- 75.National Transit Map | Bureau of Transportation Statistics. [Google Scholar]
- 76.Utah Mapping Portal. Utah GIS Portal.
- 77.Frequent Service Definition. Law Insider.
- 78.14 Trailblazing Medical Appointment Transportation Services — Etactics.