Abstract
Molecular entities with doublet or triplet ground states find increasing interest as potential molecular quantum bits (qubits). Complexes with higher multiplicity might even function as qudits and serve to encode further quantum bits. Vanadium(II) ions in octahedral ligand fields with quartet ground states and small zero‐field splittings qualify as qubits with optical read out thanks to potentially luminescent spin‐flip states. We identified two V2+ complexes [V(ddpd)2]2+ with the strong field ligand N,N’‐dimethyl‐N,N’‐dipyridine‐2‐yl‐pyridine‐2,6‐diamine (ddpd) in two isomeric forms (cis‐fac and mer) as suitable candidates. The energy gaps between the two lowest Kramers doublets amount to 0.2 and 0.5 cm−1 allowing pulsed EPR experiments at conventional Q‐band frequencies (35 GHz). Both isomers possess spin‐lattice relaxation times T 1 of around 300 μs and a phase memory time T M of around 1 μs at 5 K. Furthermore, the mer isomer displays slow magnetic relaxation in an applied field of 400 mT. While the vanadium(III) complexes [V(ddpd)2]3+ are emissive in the near‐IR‐II region, the [V(ddpd)2]2+ complexes are non‐luminescent due to metal‐to‐ligand charge transfer admixture to the spin‐flip states.
Keywords: electron paramagnetic resonance, excited state order, magnetic relaxation, spin-flip, vanadium
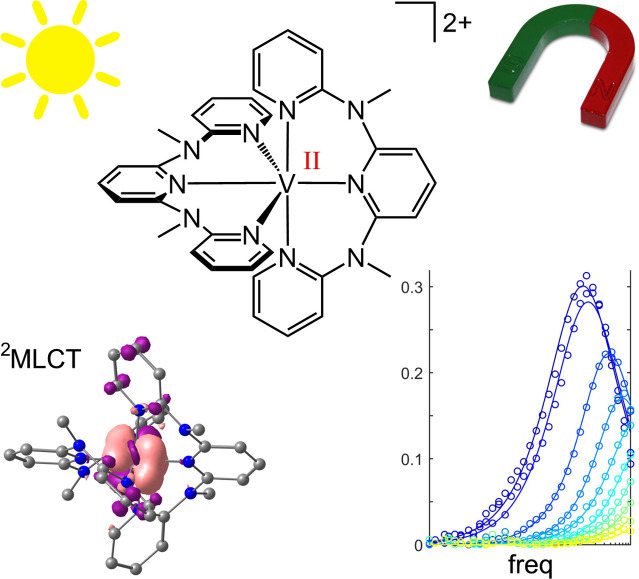
Towards qubits with optical read‐out: Metal‐to‐ligand charge transfer (4MLCT) states account for the color of the vanadium(II) complex isomers cis‐fac‐ and mer‐[V(ddpd)2]2+ in spite of the electron‐rich pyridines. 2MLCT states mix with the lowest spin‐flip states, contracting the V−N bonds in the excited state and preventing ruby‐like spin‐flip emission. Both isomers possess spin‐lattice relaxation times of around 300 μs and a phase memory time of around 1 μs at 5 K.The mer isomer shows slow magnetic relaxation in an external magnetic field. These results pave the way for qubits with optical read‐out based on vanadium(II) complexes.
Introduction
Molecular quantum bits (qubits) based on S= systems such as copper(II) [1] or vanadium(IV)[ 2 , 3 , 4 ] possess long coherence times, while qubits based on non‐spin‐ ions, for example europium(III), vanadium(III) in trigonal bipyramidal ligand fields, chromium(IV) in tetrahedral ligand fields or nickel(II) in pseudo octahedral ligand fields, [5] are rare. The advantage of high‐spin ions over two‐level (S=1/2) ions is that several qubits can be encoded into one complex, or the enlarged Hilbert space provided by the additional levels of such so‐called qudits can be used, for example, for quantum error correction. [6] A second advantage of high‐spin complexes, is that their spin quantum state may be addressed optically, through optically detected magnetic resonance techniques, as widely employed for S=1 nitrogen‐vacancy defects in diamond. [7] In fact, optical readout of molecular qubits has been recently achieved. [8] A thoroughly studied ion with S=3/2 is chromium(III). Chromium(III) complexes (quartet ground state, S=3/2) with suitable ligand fields have been developed into highly versatile materials for photonic and photocatalytic applications, including sensing,[ 9 , 10 , 11 ] upconversion,[ 12 , 13 ] circularly polarized luminescence[ 14 , 15 ] and photo(redox) catalysis.[ 16 , 17 , 18 , 19 ] The magnetic ground state S=3/2 of the highly luminescent molecular ruby [Cr(ddpd)2]3+ with the spin‐flip [20] emission band peaking at 778 nm [21] shows a long coherence time of 8.4(1) μs (ddpd=N,N’‐dimethyl‐N,N’‐dipyridine‐2‐yl‐pyridine‐2,6‐diamine). [22] Yet, optical read‐out[ 8 , 23 ] or manipulation was unsuccessful, warranting the further search for optically addressable molecular qubits. [22]
Isoelectronic vanadium(II) ions in an octahedral environment such as MgO:V2+ display their spin‐flip emission band (2Eg→4A2g; O h notation) at around 869 nm.[ 24 , 25 ] However, all reported molecular vanadium(II) complexes are non‐luminescent.[ 26 , 27 , 28 , 29 , 30 , 31 , 32 , 33 ] Damrauer, Shores and Rappé thoroughly investigated the excited states of the classical 2,2’‐bipyridine and phenanthroline vanadium(II) complexes [V(bpy)3]2+ and [V(phen)3]2+[26–31] and concluded that the lowest excited states are distorted mixed 2MLCT/2MC states rather than pure metal‐centered (MC) spin‐flip (2Eg derived) states, nested with the ground state (MLCT=metal‐to‐ligand charge transfer). [32] Addition of electron withdrawing substituents to the N‐donor ligands increases the 2MC/2MLCT mixing, so that this mixed doublet state can even become the ground state instead of the 4A2 state. [33]
Consequently, to prevent strong mixing and to gain access to a pure spin‐flip excited state as in MgO:V2+ without 2MLCT admixture, the electron accepting properties of the ligands should be diminished. Concomitantly, the ligands must exert a large ligand field splitting in order to place the 2Eg/2T1g levels as lowest excited states below the 4T2g ligand field excited states (O h notation). Ideally, the ligand field should be so strong that the next higher doublet levels 2T2g become degenerate with the 4T2g levels, which would accelerate the intersystem crossing process to the doublet manifold.[ 20 , 34 ] Such an energy scheme is accomplished in the molecular ruby [Cr(ddpd)2]3+ with the strong field ligand ddpd. [20] The ddpd ligand was even capable to induce detectable spin‐flip luminescence in liquid solution in d2 vanadium(III) complexes. [35] Building on this concept, this study aims to investigate the generality of this strategy, by investigating the excited state ordering and the magnetic properties of d3‐[V(ddpd)2]2+ complexes isoelectronic to the molecular ruby d3‐[Cr(ddpd)2]3+ and featuring a strong field polypyridine ligand with electron‐donating substituents, i. e., less pronounced π accepting properties than for example typical 2,2’‐bipyridine or 2,2’:6’,2’’‐terpyridine ligands. As the flexible ddpd ligand allows for meridional and cis‐facial diastereomers,[ 36 , 37 , 38 ] we will also address the influence of the stereochemistry on electronically excited states and ground state magnetic behavior of vanadium(II) complexes in this study.
Results and Discussion
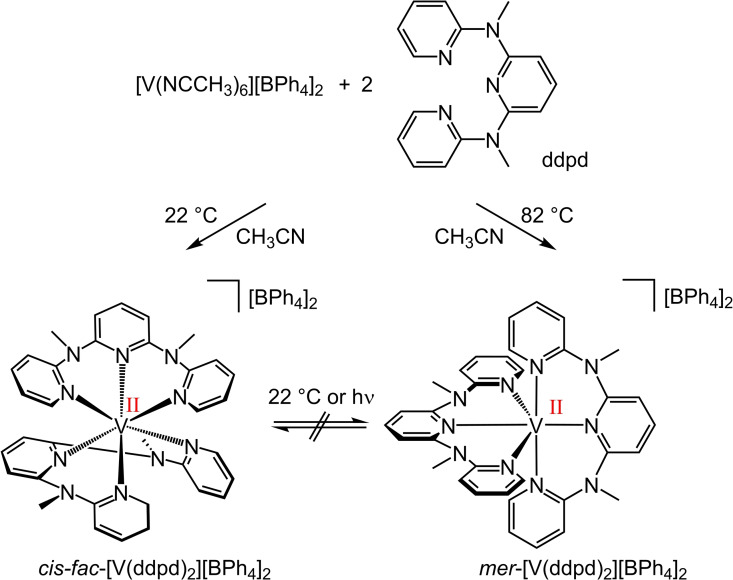
The cis‐fac‐ and mer‐vanadium(II) complex isomers cis‐fac‐[V(ddpd)2]2+ and mer‐[V(ddpd)2]2+ were obtained from [V(NCCH3)6][BPh4]2 and ddpd as the kinetic and thermodynamic products at room temperature and in boiling CH3CN, respectively (Scheme 1; Supporting Information). Both salts were characterized by IR spectroscopy, mass spectrometry and elemental analyses (Supporting Information, Figures S1–S4). Although these analytical data do not allow assigning the stereochemistry, we note slight differences in the IR fingerprint region that allow distinguishing the isomers (Supporting Information, Figure S2).
Scheme 1.
Temperature‐controlled synthesis of cis‐fac‐[V(ddpd)2][BPh4]2 and mer‐[V(ddpd)2][BPh4]2.
Once formed, they do not interconvert at room temperature, as expected for substitutionally kinetically inert pseudo‐octahedral complexes with d3 electron configurations. [39] The respective diastereomeric d2 vanadium(III) complexes cis‐fac‐[V(ddpd)2]3+ and mer‐[V(ddpd)2]3+ had been isolated before.[ 35 , 38 ]
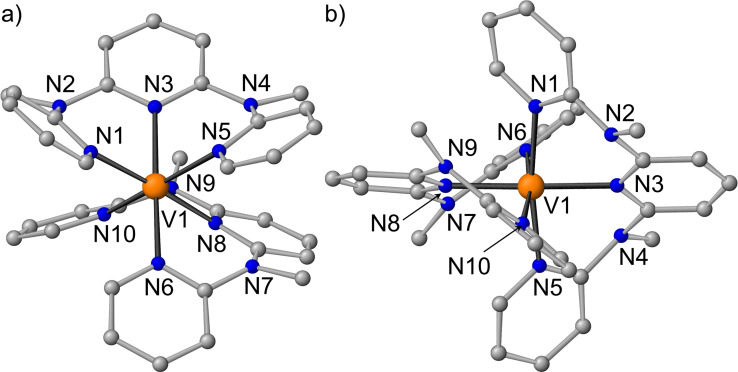
Single crystals of cis‐fac‐[V(ddpd)2]2+ and mer‐[V(ddpd)2]2+ suitable for X‐ray diffraction (XRD) analyses were obtained from CH3CN solutions of the [PF6]− and [BPh4] − salts, respectively (Figure 1; Supporting Information, Tables S1 and S2). The experimentally obtained metrics of the dications agree well with those obtained from Density Functional Theory (DFT) calculations including solvent modelling, relativistic effects and dispersion correction (CPCM‐(acetonitrile)‐RIJCOSX‐UB3LYP‐D3BJ‐ZORA/def2‐TZVPP; Supporting Information, Tables S1–S4).
Figure 1.
Molecular structures of the cations of a) cis‐fac‐[V(ddpd)2][PF6]2 and b) mer‐[V(ddpd)2][BPh4]2 determined by XRD. Counter ions and hydrogen atoms are omitted for clarity.
Calculations of ground and excited state properties with respect to the pure ligand field excited states for both complex cations cis‐fac‐[V(ddpd)2]2+ and mer‐[V(ddpd)2]2+ were performed at the ground state geometry using the complete‐active‐space self‐consistent field method including spin–orbit coupling (SOC‐CASSCF)[ 40 , 41 ] for calculation of the zero‐field splitting D and E in conjunction with strongly contracted N‐electron valence perturbation theory to second order (SC‐NEVPT2)[ 42 , 43 ] in order to recover missing dynamic electron correlation (Supporting Information, Tables S5 and S6, Figures S5 and S6).
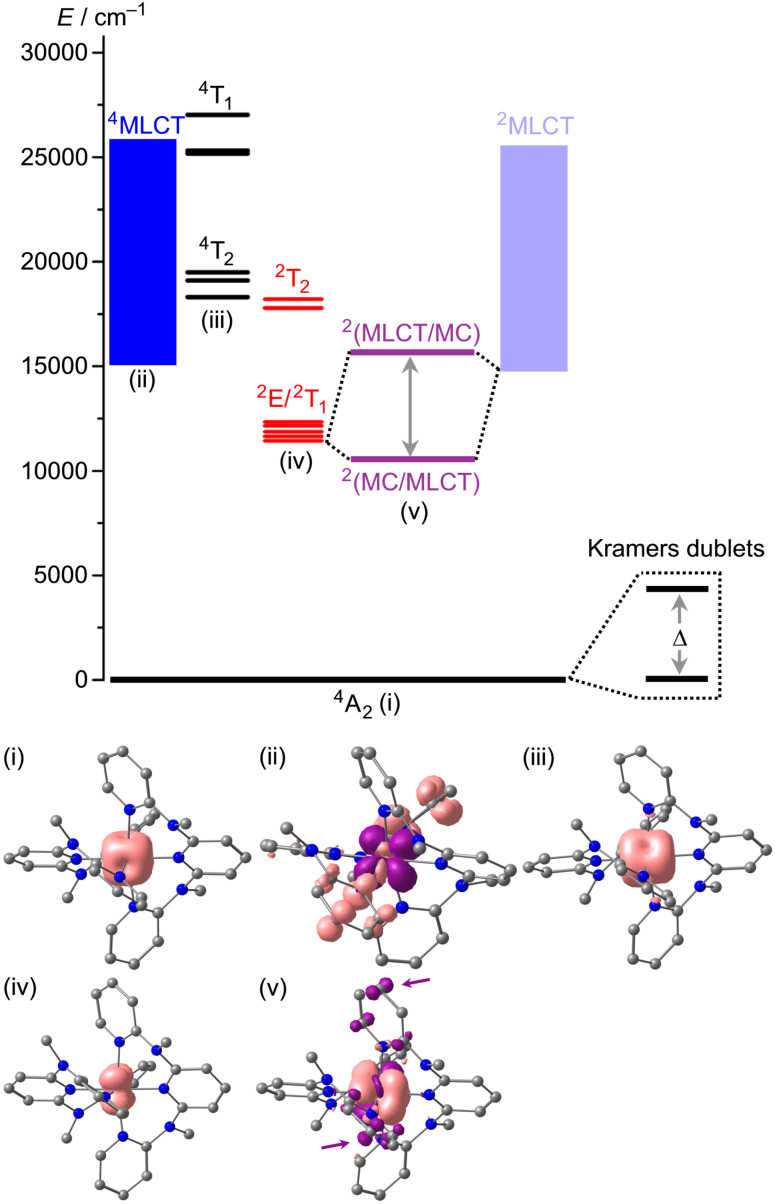
As is evident from the calculations, the pure 2Eg/2T1g‐derived spin‐flip states lie well below the 4T2g and 4T1g levels (Figure 2 for mer‐[V(ddpd)2]2+; Supporting Information, Figure S7 for cis‐fac‐[V(ddpd)2]2+). In fact, the 4T2g levels are nearly degenerate with the next higher set of doublet levels (2T2g, Figure 2). According to the calculations, spin‐flip luminescence would be expected around 851 and 872 nm from the lowest diabatic doublet level (2Eg) of cis‐fac‐[V(ddpd)2]2+ and mer‐[V(ddpd)2]2+, respectively (Supporting Information, Figures S5 and S6. This is in the expected range when compared to the MgO:V2+ emission (869 nm)[ 24 , 25 ] and the 2G free ion term of vanadium(II) (1.49 eV, 828 nm). [44] However, neither complex displays emission after irradiation with 400 or 450 nm at room temperature and at 77 K in solution or in the solid state. The photoluminescence quantum yield must therefore be below 10−4% (detection limit).
Figure 2.
Proposed energy level diagram of mer‐[V(ddpd)2]2+ with the pure metal‐centred states (black and red) obtained from the CASSCF‐NEVPT2 calculation (TZVPP basis), the 4MLCT states (large number of states indicated by blue squares) estimated from the experimental absorption spectrum and the time‐dependent (TD)‐DFT calculation and the 2MLCT states (pale blue) set to the 4MLCT energies. The mixing between 2Eg and 2MLCT states (purple) is set to an arbitrary value. (i) Spin density of the 4A2 ground state from the CASSCF‐NEVPT2 calculation. (ii) Difference electron density of the lowest 4MLCT state obtained from the TD‐DFT calculation (isosurface value of 0.003 a.u.; purple=electron depletion; orange=electron density gain). (iii) Spin density of the lowest 4T2g derived state from the CASSCF‐NEVPT2 calculation. (iv) Spin density of the lowest 2Eg derived state from the CASSCF‐NEVPT2 calculation. (v) Spin density of the optimized lowest doublet state (2MC/2LMCT) from a DFT geometry optimization calculation with the ligand contributions highlighted by arrows.
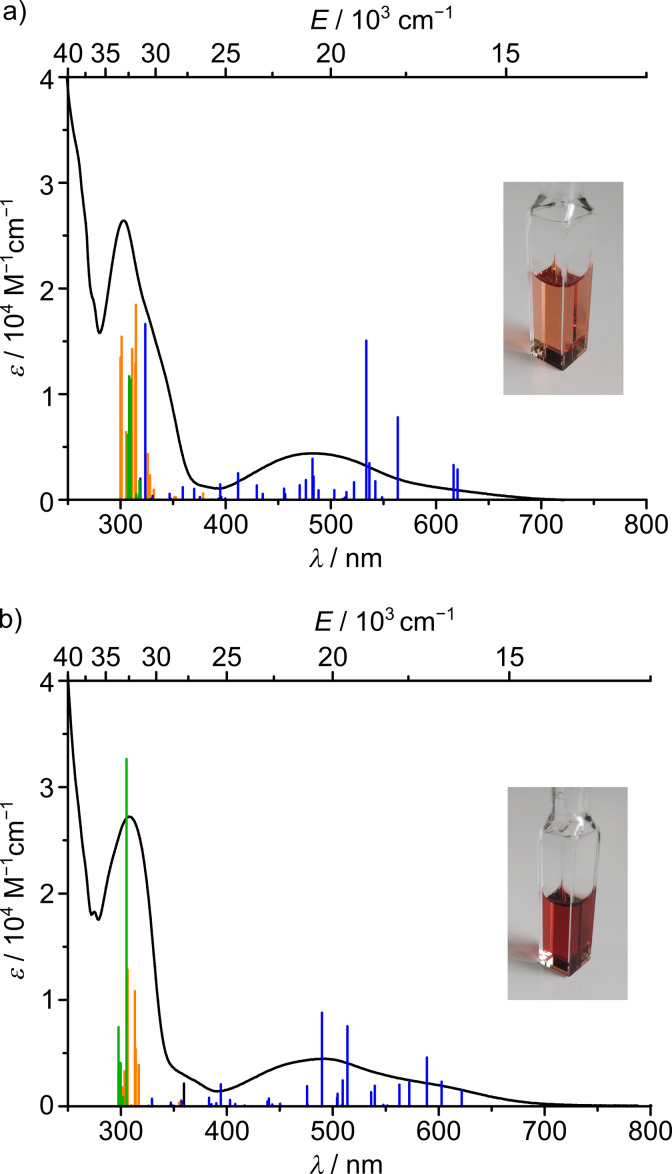
Prolonged irradiation with 300 nm light, where the complexes absorb more strongly (Figure 3; strongly allowed LC and LLCT transitions), leads to a fluorescence band at 395 nm that increases with irradiation time (Supporting Information, Figure S8). Excitation spectra suggest that this band arises from traces of the fluorescent (protonated) ligand ddpd (Supporting Information, Figure S9), [38] which is obviously photoliberated from the complexes under these conditions. Photoisomerization of the complexes (cis‐fac→mer or mer→cis‐fac) is not observed as seen from the unchanged shape of the absorption bands of the irradiated cis‐fac or mer complex isomers (Supporting Information, Figure S10).
Figure 3.
UV/Vis absorption spectra of a) cis‐fac‐[V(ddpd)2][BPh4]2 and b) mer‐[V(ddpd)2][BPh4]2 in CH3CN and TD‐DFT transitions calculated for the respective dications with the colour code indicating the character of the transition according to charge transfer analyses (blue: 4MLCT; orange: 4LC; dark green 4LLCT; black: 4MC; MLCT=metal‐to‐ligand charge transfer; LC=ligand‐centred; LLCT=ligand‐to‐ligand charge transfer; MC=metal‐centred). The insets show photographs of CH3CN solutions of the respective complexes.
The absorption spectra of the orange‐red complexes in acetonitrile hint at possible reasons for the lacking spin‐flip emission (Figure 3). Intense absorption bands from approximately 400–650 nm (λ max(cis‐fac‐[V(ddpd)2]2+)=486 nm; λ max(mer‐[V(ddpd)2]2+)=490 nm) arise from low‐energy 4MLCT transitions according to TD‐DFT calculations (cis‐fac‐[V(ddpd)2]2+: 387–620 nm; mer‐[V(ddpd)2]2+: 362–622 nm; Supporting Information, Tables S7–S10, Figures S11 and S12). In reasonable agreement, electrochemical data (Supporting Information, Figure S13) estimate the HOMO‐LUMO gap as 2.0 eV (610 nm) and 2.1 eV (591 nm), respectively. With the oxidation assigned to the vanadium(II/III) couple and the reduction to a ligand‐centered redox process, [38] this fits to the MLCT assignment of the absorption spectral data. Chemical oxidation of cis‐fac‐[V(ddpd)2]2+ and mer‐[V(ddpd)2]2+ with Ag[BF4] yields the corresponding vanadium(III) complexes.[ 35 , 38 ] Re‐reduction with cobaltocene fully or partially recovers the vanadium(II) absorption spectra of the cis‐fac and mer isomers, respectively (Supporting Information, Figures S14 and S15).
mer‐[V(ddpd)2]3+ formed by oxidation of mer‐[V(ddpd)2]2+ with Ag[BF4] shows spin‐flip luminescence (1E/1T2→3T1) around 1100 nm in butyronitrile at 78 K as reported previously (Supporting Information, Figure S16). [35] Under these conditions, cis‐fac‐[V(ddpd)2]3+ prepared from oxidation of cis‐fac‐[V(ddpd)2]2+ with Ag[BF4] is NIR‐II luminescent as well (Supporting Information, Figure S16). cis‐fac‐[V(ddpd)2]3+ displays a structured emission band between 1150 and 1250 nm from 1Eg/1T2g states to the split 3T1g ground state (O h notation). Shape and energy of this emission band differs from the emission band of mer‐[V(ddpd)2]3+, while the shape rather resembles the emission pattern of Cs2NaYCl6:V3+ and VCl3(ddpd).[ 45 , 46 ]
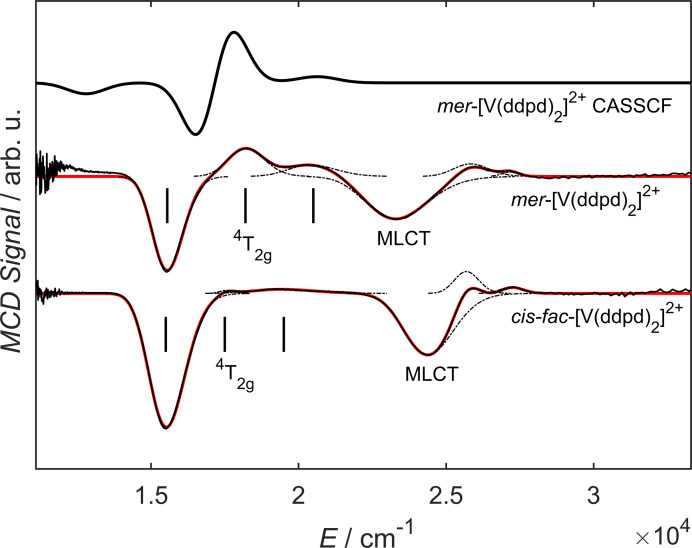
Magnetic circular dichroism (MCD) spectroscopy was employed to extract more fine structure of the broad absorption band of the vanadium(II) complexes (Figure 4; Supporting Information, Figures S17 and S18). The MCD spectra were deconvoluted as sums of Gaussian peaks giving six components (cis‐fac‐[V(ddpd)2]2+: 27250, 25710, 24380, 19420, 17570, 15520 cm−1; mer‐[V(ddpd)2]2+: 27170, 25840, 23280, 20420, 18210, 15550 cm−1). The three components at lower energies (15520, 17570, 19420 cm−1 and 15550, 18210, 20420 cm−1 for the cis‐fac and the mer isomer, respectively) are assigned to the three components of the 4T2g (O h notation) excited state (Figure 4). The prominent signals at 24380 (cis‐fac isomer) and at 23280 cm−1 (mer isomer) are assigned to 4MLCT transitions. The MCD spectrum pertaining to the 4T2g derived states is well reproduced with a CASSCF‐NEVPT2 calculation with an active space of CAS(7,7) and with a def2‐SVP basis set. A red shift of the calculated transitions is observed, when the basis set size is increased to def2‐TZVP (Supporting Information, Figure S18). With the three components of the 4T2g (O h) state identified, it is possible to use ligand field theory to link the observed transitions to the ground state zero‐field splitting (ZFS) parameters, which can later be useful for the evaluation of further experiments. For this, the components of the tensor have to be calculated. The tensor describes the residual orbital angular momentum of the ground state due to coupling of excited states and it is linked to the ZFS parameters via and , with the spin orbit coupling (SOC) constant λ. [47] For the higher symmetric mer‐[V(ddpd)2]2+ complex the derivation is analogue to mer‐[Cr(ddpd)2]3+, since both possess D 2 symmetry. This has been carried out before. [22] With the 4T2g energies obtained from MCD for mer‐[V(ddpd)2]2+ and a SOC constant of 168 cm−1, [48] ZFS parameters of D=1.39 cm−1 and E=0.34 cm−1 are found. cis‐fac‐[V(ddpd)2]2+ features with C 2 a lower symmetry than mer‐[V(ddpd)2]2+, hence the derivation of the tensor has to be carried out in this point group (see Supporting Information). The ZFS parameters obtained for cis‐fac‐[V(ddpd)2]2+ this way are D=0.38 cm−1 and E=0.10 cm−1.
Figure 4.
MCD spectra of 1 mM solutions (butyronitrile/propionitrile 1 : 1) of cis‐fac‐[V(ddpd)2][BPh4]2 at 5 K/7 T (bottom) and of mer‐[V(ddpd)2][BPh4]2 at 5 K/5 T (middle), as well as the corresponding spectrum for mer‐[V(ddpd)2]2+ obtained from CASSCF (SVP basis) calculations (top). Measurements are shown as black solid lines, spectral components as black dashed lines and their sum as red solid lines.
The strongly allowed low‐energy component at ca. 644 nm (Figure 3) is assigned to the transition to the lowest energy 4MLCT state at the ground state geometry (Figure 2 for mer‐[V(ddpd)2]2+; Supporting Information, Figure S7 for cis‐fac‐[V(ddpd)2]2+). The lowest (diabatic) 2MLCT states might be at similar energies to the corresponding 4MLCT states. These energies are relatively close to the calculated energies of the diabatic spin‐flip states (Figure 2). Consequently, mixing of the diabatic spin‐flip and 2MLCT states is possible (Figure 2). [32] Although the absorption maxima of cis‐fac‐[V(ddpd)2]2+ and mer‐[V(ddpd)2]2+ are shifted to the blue as compared to [V(bpy)3]2+ and [V(phen)3]2+ (λ max=650 nm) due to the electron‐rich ddpd ligand,[ 26 , 27 , 28 , 29 , 30 , 31 , 32 ] this seems not yet sufficient to fully prevent mixing of 2Eg/2T1g and 2MLCT states. Indeed, DFT calculations of the geometry optimized lowest doublet states of cis‐fac‐[V(ddpd)2]2+ and mer‐[V(ddpd)2]2+ confirm an admixture of charge transfer character in this optimized lowest doublet excited state (Figure 2(v) for mer‐[V(ddpd)2]2+; Supporting Information, Figure S7(v) for cis‐fac‐[V(ddpd)2]2+; Tables S11 and S12): The Mulliken spin density at vanadium exceeds one (cis‐fac‐[V(ddpd)2]2+: 1.25 mer‐[V(ddpd)2]2+: 1.11), the spin distribution differs from that of the hypothetical pure 2Eg spin‐flip state obtained from the CASSCF‐NEVPT2 calculations (Figure 2(iv)) and β spin density is found at the terminal pyridine rings of the ddpd ligands. In addition, the V−N bonds contract in the doublet states as expected for an MLCT admixture (cis‐fac‐[V(ddpd)2]2+: Δd av=0.016 Å; mer‐[V(ddpd)2]2+: Δd av=0.019 Å), while a pure spin‐flip state should be nested. Although the MLCT character of the lowest energy doublet states of [V(ddpd)2]2+ appears much less distinct than in [V(bpy)3]2+ and [V(phen)3]2+[32] due to the higher energies of the π* orbitals of the pyridines of ddpd and thus the higher energies of the diabatic 2MLCT states, the geometric distortion in the true adiabatic doublet state seems to be sufficient to facilitate non‐radiative decay. Clearly, the π‐accepting nature of the ligands needs to be further decreased to enable spin‐flip luminescence in vanadium(II) complexes.
The potential suitability of a complex as molecular qubit is determined by its electronic structure as well as its spin dynamics. Concerning the former, the microstates of an S=3/2 ion are split into two Kramers doublets in the absence of a magnetic field, which correspond to m S=±3/2 and ±1/2, respectively, in the absence of rhombic zero‐field splitting [E=0 in Equation (1)]. To be able to use the inter‐Kramers‐doublet transitions for quantum operations, the energy gap should not be larger than the microwave frequency of the spectrometer employed, putting an upper limit on the value of D. The sign of D is less important. Secondly, in case the intradoublet transition of the m S=±3/2 doublet is to be used, this transition is formally EPR‐forbidden. The presence of a small rhombic ZFS partially allows this transition and this may therefore be favorable.
As a starting point for the investigation of the electronic structure of the complexes, we carried out magnetic susceptibility measurements. Both vanadium(II) complexes possess nearly temperature‐independent χT values of 1.857 cm3 K mol−1 and 1.863 cm3 K mol−1 for cis‐fac and mer‐[V(ddpd)2]2+, respectively. Both values are consistent with three unpaired electrons with a g value slightly smaller than 2 (for g=2, this is 1.875 cm3 K mol−1) (Figure 2(i); Supporting Information, Figures S19–S22). From 8 K downwards, χT decreases slightly which we attribute to a small ZFS, where a fit yielded a D value [Equation (1)] of D=0.4 cm−1 for cis‐fac‐[V(ddpd)2]2+. For mer‐[V(ddpd)2]2+ such a decrease is not observed, indicating an even smaller ZFS than in the cis‐fac case.
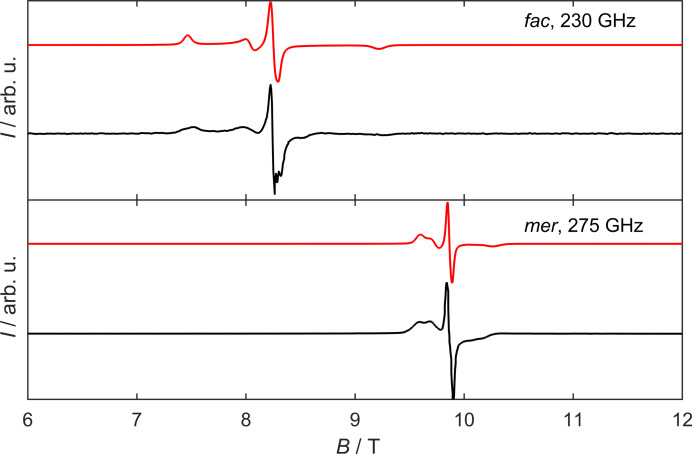
To obtain deeper insight into the ZFS spin Hamiltonian parameters D and E [Equation (1)], high‐field electron paramagnetic resonance (HFEPR) spectroscopy at frequencies of up to 375 GHz was carried out for both isomers (Figure 5 for mer‐[V(ddpd)2]2+; Supporting Information, Figure S23 for cis‐fac‐[V(ddpd)2]2+).
| (1) |
Figure 5.
Measured HFEPR spectra of cis‐fac‐[V(ddpd)2][BPh4]2 and mer‐[V(ddpd)2][BPh4]2 at 5 K at the frequencies as indicated (black) together with simulations based on the spin Hamiltonian parameters given in the text (red).
The HFEPR spectra consist of three resonance lines, where the central one is assigned to the m s=− to m s=+ transition (high‐field limit notation). The spectra were simulated using the spin Hamiltonian from Equation (1) with D=+ 0.47(2) cm−1, E=0.09(1) cm−1 (E/D=0.19), g 1=1.99(1), g 2=1.99(1) and g 3=2.00(1) for cis‐fac‐[V(ddpd)2]2+ and D=+0.20(5) cm−1, E=0.02(1) cm−1 (E/D=0.08), g 1=1.986(1), g 2=1.993(2) and g 3=1.996(2) for mer‐[V(ddpd)2]2+, respectively. The D value of the meridional isomer is nearly identical to that found for mer‐[Cr(ddpd)2]3+. [22] The zero‐field energy gap Δ between the two Kramers doublets given by is Δ=0.50 cm−1 and 0.20 cm−1 for the cis‐fac and mer isomers, respectively (Figure 2), for mer‐[V(ddpd)2]2+, this is roughly half of that of mer‐[Cr(ddpd)2]3+ (Δ=0.41 cm−1). [22]
In order to determine the sign of D, temperature dependent HFEPR spectra were carried out in the range from 5 K to 20 K. For both isomers, the temperature dependent HFEPR spectra can be well simulated with the parameters obtained from the frequency dependence, in particular with a positive sign of the D value. In contrast to this, simulations with a negative sign of D show a completely different temperature behavior from the one found experimentally (Supporting Information, Figures S24 and S26).
Since the 51V isotope (natural abundance 99.15 %) possesses a nuclear spin of I=7/2, hyperfine splitting of the resonance lines can be expected in the spectra. No such splitting was observed in the HFEPR spectra, [49] which we attribute to the line width exceeding the hyperfine splitting strength. To probe possible hyperfine interactions, EPR experiments were carried out at X‐band frequency (9.45 GHz) in frozen solution (butyronitrile/propionitrile 1 : 1) at 7 K. In the case of mer‐[V(ddpd)2]2+, hyperfine shoulders are found on a broad resonance line centered at 340 mT (Supporting Information, Figure S27). These shoulders are separated by 7 mT, which is equivalent to a hyperfine splitting A of 6.5×10⁻³ cm−1. For cis‐fac‐[V(ddpd)2]2+, no such shoulders are observed, but signals are broadened due to hyperfine interactions (Supporting Information, Figure S27). Both spectra can be well simulated with A=6.5(6)×10−3 cm−1, assuming g iso=1.94(1) and ZFS parameters of D=0.30(2) cm−1 and E/D=0.3 in the cis‐fac case and g iso=1.989(5), D=0.12(2) cm−1 and E/D=0.08 in the mer case, which is in good agreement with the values found by HFEPR spectroscopy. For these simulations, the Hamiltonian in Equation (1) was expanded by the conventional hyperfine interaction term .
While CASSCF(12,7) (TZVPP basis) calculations predict small negative values for D irrespective of the NEVPT2 correction, a CASSCF(7,7) (SVP basis) calculation on mer‐[V(ddpd)2]2+ delivers a small positive D value in agreement with the experimentally determined data (see Supporting Information for details). Hence, the sign of the D values of vanadium(II) complexes appears difficult to predict on this level of theory, while the signs of the ZFS parameters of the isoelectronic chromium(III) complex [Cr(ddpd)2]3+ lacking low‐energy charge transfer states were correctly predicted by CASSCF calculations. [22]
To assess their suitability as molecular qubits, we investigated the spin dynamics of the complexes by means of pulsed Q‐band EPR spectroscopy and AC susceptometry. In this regard, the electron coherence time is of particular interest, since it is a benchmark criterion for qubit candidates. While the majority of vanadium‐based qubits feature the metal ion in its more stable oxidation state VIV with a spin S=1/2 ground state, the [V(ddpd)2]2+ complexes presented here possess a ground state of S=3/2. Such high spin qubits provide further states that can be used as additional qubits. The nuclear spin of 51V of I=7/2 leads to additional hyperfine states rendering an even higher number of encoded qubits in one molecule conceivable.
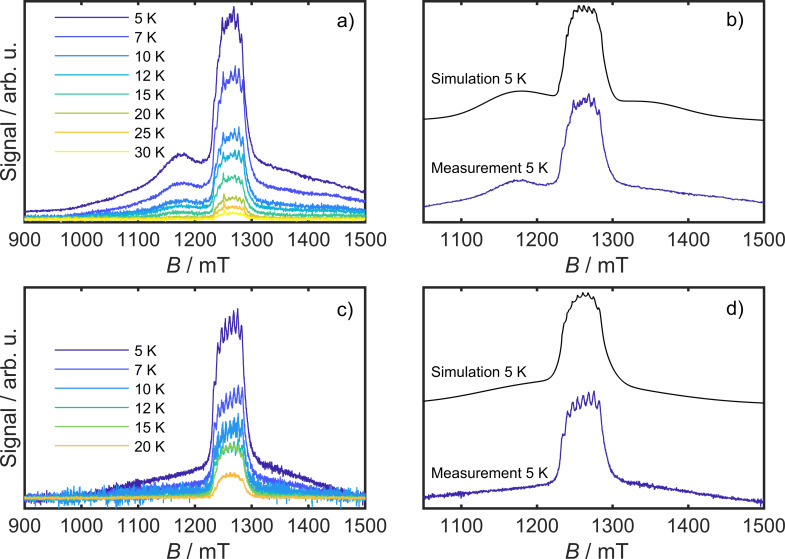
Pulsed Q‐band EPR spectra were recorded of both isomers in a 3 mM frozen solutions of butyronitrile/propionitrile 1 : 1 at 35 GHz in a temperature range from 5 K up to 30 K (Figure 6). Echo detected spectra of both species feature a prominent central signal at around g=2, that displays distinct hyperfine peaks due to coupling of the S=3/2 electron spin to the I=7/2 VII center. This signal is due to the transition in the m S=±1/2 ground state Kramers doublet. The central line is accompanied by broad signals, which is due to the zero field split transition from the lower lying m S=±1/2 manifold to the higher lying m S=±3/2 states. In the case of cis‐fac‐[V(ddpd)2]2+ this broad signal is more distinct due to its higher D value. In both cases, the ZFS signals are broadened by a large D‐strain. Simulations are in good agreement with the measured spectra, when smaller D values than those found by means of static spectroscopy are assumed (D=0.11(3) cm−1 and A=6.0×10⁻³ cm−1 for the cis‐fac and D=0.10(3) cm−1 and A=6.4×10⁻³ cm−1 for the mer isomer). The phase memory time T m was determined by means of the Hahn‐Echo sequence for both isomers in the same temperature range as the echo detected spectra. The echo decay curves show a modulation in all cases. These oscillations are due to a change of the nuclear spin while the electron spin echo experiment is recorded and are known as electron spin echo envelop modulation (ESEEM). The frequency of this ESEEM can be extracted when the subtraction of the experiment and the exponential decay, that is used to describe the decay of the echo intensity [Equation (2)], is Fourier transformed.
| (2) |
Figure 6.
a) Temperature dependent electron spin echo detected (ESE) spectrum of cis‐fac‐[V(ddpd)2][BPh4]2 at 35 GHz (3 mM in propionitrile/butyronitrile), b) Corresponding simulation at 5 K, based on the parameters given in the text. c) ESE spectrum of mer‐[V(ddpd)2][BPh4]2 (3 mM in propionitrile/butyronitrile) at the temperatures indicated. d) Corresponding simulation at 5 K based on the parameters given in the text.
From the Fourier transform, three main frequencies can be extracted for both isomers at 2.1, 5.3 and 10 MHz (Supporting Information, Figures S32 and S33). The frequency pattern is quite similar to that found previously for mer‐[Cr(ddpd)2]3+. In the CrIII case, the ESEEM was attributed to double quantum transitions of the neighboring 14N nuclei.
To probe the coherence times of the various magnetic states that are spectroscopically accessible, Hahn echo decays were recorded for both isomers at the highest intensity of the spectrum, in both cases at around g=2 (1266 mT and 1275 mT for the cis‐fac and mer isomer, respectively), and in the flanks of the spectrum (1175 mT and 1100 mT, respectively). The decays were fitted by means of equation (2) and revealed phase memory times for both isomers of 1 μs at 5 K at the position of the central spectral signal at 1266 and 1275 mT, respectively. When the coherence times are measured in the flanks of the spectra (1172 mT and 1100 mT), a much faster relaxation of 0.79 μs and 0.41 μs (cis‐fac and mer isomer, respectively) is observed (Supporting Information, Figures S29 and S31). This is due to the fact, that at that magnetic field, transitions involving the m S=±3/2 Kramers doublet are excited.
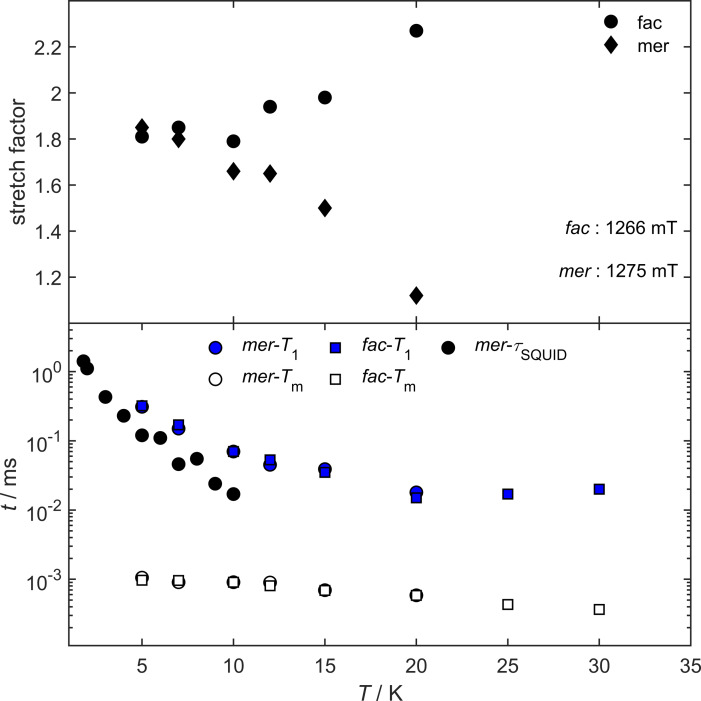
With increasing temperatures up to 12 K, the phase memory times remain essentially constant in both cases Figure 7, but start to drop at higher temperatures down to 0.4 μs at 30 K for cis‐fac‐[V(ddpd)2][BPh4]2 and down to 0.6 μs in the case of mer‐[V(ddpd)2][BPh4]2. While the phase memory times are almost equivalent for both isomers, the stretch factor k behaves completely different in both cases. The stretch factor provides unique information about the main relaxation process. While for 1<k<1.5 the physical motion of the nuclei is predominant, it is for 2<k<2.5, that nuclear spin diffusion is the dominating process. [22] Up to 7 K, the stretch factors of the cis‐fac and the mer isomer are almost the same at 1.80±5, hinting towards a mixed relaxation process. However, the temperature dependence of the stretch factors of both isomers is completely different. While for cis‐fac‐[V(ddpd)2]2+ the stretch factor increases to 2.27 with increasing temperatures, it decreases in the case of mer‐[V(ddpd)2]2+ down to 1.12 at 20 K. A decrease of stretch factors with growing temperatures was found before in the case of mer‐[Cr(ddpd)2]3+, indicating a limitation of the coherence time by the physical motion of nuclei with increasing temperatures for the mer isomers of [M(ddpd)2] n+ complexes. The increase of k with growing temperatures for cis‐fac‐[V(ddpd)2]2+ hints towards nuclear spin diffusion limitation of coherence times. A possible explanation for this can be the more rigid ligand system of the cis‐fac orientation of the two ddpd ligands, leading to a reduction in the physical motion of the surrounding nuclei quenching this relaxation pathway.
Figure 7.
Bottom: T 1 (blue filled symbols) and T M (non‐colored symbols) of cis‐fac‐[V(ddpd)2][BPh4]2 (squares) and mer‐[V(ddpd)2][BPh4]2 (circles), measured at 1266 mT and 1275 mT, respectively. As black circles relaxation times, obtained by AC susceptometry for mer‐[V(ddpd)2][BPh4]2. Top: Stretch factors of the corresponding fits of the echo‐decay curves based on Equation (2).
The spin lattice relaxation time, which is the upper limit for the phase coherence time, was determined by means of the inversion‐recovery sequence at the same temperatures as the phase coherence time. It was found to be at around 300 μs at 5 K for both isomers. Upon heating, it is decreasing to around 40 μs at 12 K. Interestingly with even higher temperature, the spin‐lattice relaxation time stays largely constant up to 30 K.
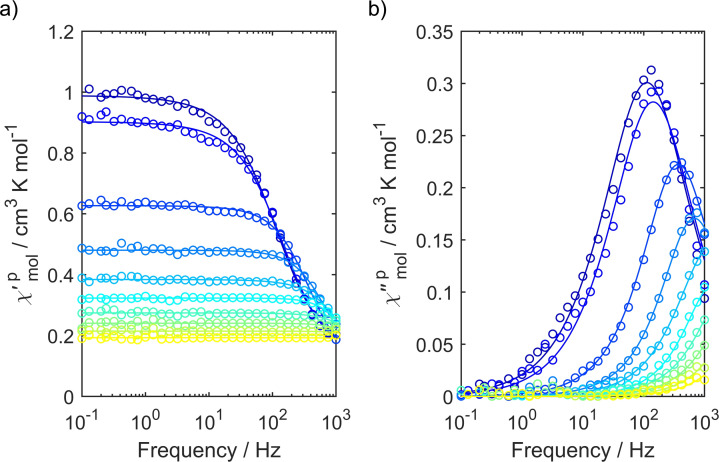
To investigate the magnetization dynamics of both samples even further and also in a non‐diluted matrix, AC susceptometry was carried out on pressed pellets of both isomers. While cis‐fac‐[V(ddpd)2][BPh4]2 does not show any slow relaxation of the magnetization in zero field or with an applied external field, mer‐[V(ddpd)2][BPh4]2 features an out‐of‐phase signal below 15 K at an applied external magnetic field of 400 mT (Figure 8). The relaxation times found by means of AC susceptometry are slightly shorter than those found by pulsed EPR spectroscopy. This is due to the fact, that in the EPR measurements, frozen solution samples are used, while for AC susceptometry, a pressed powder pellet is used, leading to different relaxation times.
Figure 8.
a) In‐phase and b) out‐of‐phase component of the AC susceptibility of mer‐[V(ddpd)2][BPh4]2 from 1.8 K to 10 K at an applied external magnetic field of 400 mT. Measured values are shown as open circles, while simultaneous fits of the in‐phase and out‐of‐phase component to the standard modified Debye function are shown as solid lines.
mer‐[V(ddpd)2]2+ appears to be the first vanadium(II) complex showing slow magnetization.[ 50 , 51 ] With the d3 electron configuration in an octahedral field, the electronic situation of vanadium(II) is analogous to that of a high‐spin d7 cobalt(II) ion in a tetrahedral field which has been shown to enable large ZFS and relaxation energy barriers. [52]
Conclusion
Two novel vanadium(II) complexes with the electron‐rich tridentate polypyridine ligand N,N’‐dimethyl‐N,N’‐dipyridine‐2‐yl‐pyridine‐2,6‐diamine (ddpd) differing only in the ligand coordination mode (cis‐facial vs. meridional) were isolated as the kinetic and thermodynamic products, respectively. These isomers cis‐fac‐[V(ddpd)2][BPh4]2 and mer‐[V(ddpd)2][BPh4]2 are stable with respect to isomerization at room temperature and under light irradiation in solution, while prolonged irradiation with UV−B light leads to ligand dissociation. No ruby‐like spin‐flip luminescence is detected for either complex. However, one‐electron oxidation delivers the corresponding NIR‐II luminescent vanadium(III) complexes. The lacking spin‐flip luminescence of the vanadium(II) complexes arises from mixing of the spin‐flip states with low‐energy 2MLCT states leading to distortion and efficient non‐radiative decay of the excited states. Clearly, even the electron‐rich ddpd ligand possesses π* orbitals with too low energy providing the low‐energy MLCT states. Future ligand design aims to eliminate the low‐energy MLCT states, while providing a strong enough ligand field for vanadium(II).
Zero‐field splitting splits the 4A2g ground states of the d3 vanadium(II) ion into two Kramers doublets with energy gaps of ca. 0.5 and 0.2 cm−1 for the cis‐fac and mer isomer, respectively, enabling pulsed EPR measurements. While cis‐fac‐[V(ddpd)2][BPh4]2 does not show slow magnetic relaxation at an applied field below 15 K, mer‐[V(ddpd)2][BPh4]2 features an out‐of‐phase signal. This isomer possesses a spin‐lattice relaxation time T 1=308 μs and a phase memory time T M=1.1 μs at 5 K according to pulsed EPR measurements, recommending vanadium(II) complexes as potential molecular quantum bits.
Consequently, the present study lays the foundations for developing vanadium(II) complexes with tuned spin‐flip excited states lacking MLCT admixture and tuned magnetic relaxation as candidates for optically addressable molecular qubits.
Experimental Section
Details of the syntheses, spectroscopic, computational and simulation data are collected in the Supporting Information.
Deposition Number(s) 2177572 (for mer‐[V(ddpd)2][BPh4]2), 2177573 (for cis‐fac‐[V(ddpd)2][PF6]2) contain(s) the supplementary crystallographic data for this paper. These data are provided free of charge by the joint Cambridge Crystallographic Data Centre and Fachinformationszentrum Karlsruhe Access Structures service.
Conflict of interest
The authors declare no conflict of interest.
1.
Supporting information
As a service to our authors and readers, this journal provides supporting information supplied by the authors. Such materials are peer reviewed and may be re‐organized for online delivery, but are not copy‐edited or typeset. Technical support issues arising from supporting information (other than missing files) should be addressed to the authors.
Supporting Information
Supporting Information
Supporting Information
Acknowledgments
This work has been financially supported by the Deutsche Forschungsgemeinschaft (DFG) under grant INST 247/1018‐1 (K. H.) and the Priority Program SPP 2102 “Light‐controlled reactivity of metal complexes” HE2778/15‐1, as well as by DFG grant SL104/10‐1 and the Landesgraduiertenförderung of the State of Baden‐Württemberg. Parts of this research were conducted using the supercomputer MOGON and advisory services offered by Johannes Gutenberg University Mainz (http://www.hpc.uni‐mainz.de) and the supercomputer Elwetritsch and advisory services offered by the TU Kaiserslautern (https://elwe.rhrk.uni‐kl.de), which are members of the AHRP and the Gauss Alliance e.V. We thank Dr. Dieter Schollmeyer for collecting the XRD data and Dimitri Zorn for assistance with some absorption spectroscopic experiments. Open Access funding enabled and organized by Projekt DEAL.
Dorn M., Hunger D., Förster C., Naumann R., van Slageren J., Heinze K., Chem. Eur. J. 2023, 29, e202202898.
Contributor Information
Prof. Dr. Joris van Slageren, Email: slageren@ipc.uni-stuttgart.de.
Prof. Dr. Katja Heinze, Email: katja.heinze@uni-mainz.de.
Data Availability Statement
The data that support the findings of this study are available in the Supporting material of this article.
References
- 1.
- 1a. Bader K., Dengler D., Lenz S., Endeward B., Jiang S.-D., Neugebauer P., van Slageren J., Nat. Commun. 2014, 5, 5304; [DOI] [PubMed] [Google Scholar]
- 1b. Lenz S., Bader K., Bamberger H., van Slageren J., Chem. Commun. 2017, 53, 4477–4480. [DOI] [PubMed] [Google Scholar]
- 2. Atzori M., Morra E., Tesi L., Albino A., Chiesa M., Sorace L., Sessoli R., J. Am. Chem. Soc. 2016, 138, 11234–11244. [DOI] [PubMed] [Google Scholar]
- 3. Yu C.-J., Graham M. J., Zadrozny J. M., Niklas J., Krzyaniak M. D., Wasielewski M. R., Poluektov O. G., Freedman D. E., J. Am. Chem. Soc. 2016, 138, 14678–14685. [DOI] [PubMed] [Google Scholar]
- 4. Zadrozny J. M., Niklas J., Poluektov O. G., Freedman D. E., ACS Cent. Sci. 2015, 1, 488–492. [DOI] [PMC free article] [PubMed] [Google Scholar]
- 5.
- 5a. Kumar K. S., Serrano D., Nonat A. M., Heinrich B., Karmazin L., Charbonnière L. J., Goldner P., Ruben M., Nat. Commun. 2021, 12, 2152; [DOI] [PMC free article] [PubMed] [Google Scholar]
- 5b. Serrano D., Kuppusamy S. K., Heinrich B., Fuhr O., Hunger D., Ruben M., Goldner P., Nature 2022, 603, 241–248; [DOI] [PubMed] [Google Scholar]
- 5c. Fataftah M. S., Bayliss S. L., Laorenza D. W., Wang X., Phelan B. T., Wilson C. B., Mintun P. J., Kovos B. D., Wasielewski M. R., Han S., Sherwin M. S., Awschalom D. D., Freedman D. E., J. Am. Chem. Soc. 2020, 142, 20400–20408; [DOI] [PubMed] [Google Scholar]
- 5d. Bayliss S. L., Laorenza D. W., Mintun P. J., Kovos B. D., Freedman D. E., Awschalom D. D., Science 2020, 370, 1309–1312; [DOI] [PubMed] [Google Scholar]
- 5e. Wojnar M. K., Laorenza D. W., Schaller R. D., Freedman D. E., J. Am. Chem. Soc. 2020, 142, 14826–14830. [DOI] [PubMed] [Google Scholar]
- 6. Biard H., Moreno-Pineda E., Ruben M., Bonet E., Wernsdorfer W., Balestro F., Nat. Commun. 2021, 12, 4443. [DOI] [PMC free article] [PubMed] [Google Scholar]
- 7. Schirhagl R., Chang K., Loretz M., Degen C. L., Ann. Rev. Phys. Chem. 2014, 65, 83–105. [DOI] [PubMed] [Google Scholar]
- 8. Serrano D., Kuppusamy S. K., Heinrich B., Fuhr O., Hunger D., Ruben M., Goldner P., Nature 2022, 603, 241–246. [DOI] [PubMed] [Google Scholar]
- 9. Otto S., Scholz N., Behnke T., Resch-Genger U., Heinze K., Chem. Eur. J. 2017, 23, 12131–12135. [DOI] [PubMed] [Google Scholar]
- 10. Otto S., Harris J., Heinze K., Reber C., Angew. Chem. 2018, 130, 11236–11240; [DOI] [PubMed] [Google Scholar]; Angew. Chem. Int. Ed. 2018, 57, 11069–11073. [DOI] [PubMed] [Google Scholar]
- 11. Wang C., Otto S., Dorn M., Heinze K., Resch-Genger U., Anal. Chem. 2019, 91, 2337–2344. [DOI] [PubMed] [Google Scholar]
- 12. Kalmbach J., Wang C., You Y., Förster C., Schubert H., Heinze K., Resch-Genger U., Seitz M., Angew. Chem. 2020, 132, 18966–18970; [DOI] [PMC free article] [PubMed] [Google Scholar]; Angew. Chem. Int. Ed. 2020, 59, 18804–18808. [DOI] [PMC free article] [PubMed] [Google Scholar]
- 13. Wang C., Reichenauer F., Kitzmann W. R., Kerzig C., Heinze K., Resch-Genger U., Angew. Chem. 2022, 134, e202202238; [DOI] [PMC free article] [PubMed] [Google Scholar]; Angew. Chem. Int. Ed. 2022, 61, e202202238. [DOI] [PMC free article] [PubMed] [Google Scholar]
- 14. Dee C., Zinna F., Kitzmann W. R., Pescitelli G., Heinze K., Di Bari L., Seitz M., Chem. Commun. 2019, 55, 13078–13081. [DOI] [PubMed] [Google Scholar]
- 15. Jiménez J.-R., Doistau B., Cruz C. M., Besnard C., Cuerva J. M., Campaña A. G., Piguet C., J. Am. Chem. Soc. 2019, 141, 13244–13252. [DOI] [PubMed] [Google Scholar]
- 16. Stevenson S. M., Shores M. P., Ferreira E. M., Angew. Chem. Int. Ed. 2015, 54, 6506–6510. [DOI] [PubMed] [Google Scholar]
- 17. Otto S., Nauth A. M., Ermilov E., Scholz N., Friedrich A., Resch-Genger U., Lochbrunner S., Opatz T., Heinze K., ChemPhotoChem 2017, 1, 344–349. [Google Scholar]
- 18. Sittel S., Naumann R., Heinze K., Front. Chem. 2022, 10, 887439. [DOI] [PMC free article] [PubMed] [Google Scholar]
- 19. Bürgin T. H., Glaser F., Wenger O. S., J. Am. Chem. Soc. 2022, 144, 14181–14194. [DOI] [PMC free article] [PubMed] [Google Scholar]
- 20.
- 20a. Kitzmann W. R., Moll J., Heinze K., Photochem. Photobiol. Sci. 2022, 21, 1309–1331. [DOI] [PubMed] [Google Scholar]
- 21.
- 21a. Otto S., Grabolle M., Förster C., Kreitner C., Resch-Genger U., Heinze K., Angew. Chem. 2015, 127, 11735–11739; [DOI] [PubMed] [Google Scholar]; Angew. Chem. Int. Ed. 2015, 54, 11572–11576; [DOI] [PubMed] [Google Scholar]
- 21b. Kitzmann W. R., Ramanan C., Naumann R., Heinze K., Dalton Trans. 2022, 51, 6519–6525. [DOI] [PubMed] [Google Scholar]
- 22. Lenz S., Bamberger H., Hallmen P. P., Thiebes Y., Otto S., Heinze K., van Slageren J., Phys. Chem. Chem. Phys. 2019, 21, 6976–6983. [DOI] [PubMed] [Google Scholar]
- 23. Bayliss S. L., Laorenza D. W., Mintun P. J., Kovos B. D., Freedman D. E., Awschalom D. D., Science 2020, 370, 1309–1312. [DOI] [PubMed] [Google Scholar]
- 24. Viliani G., Pilla O., Montagna M., Boyrivent A., Phys. Rev. B 1981, 23, 18–27. [Google Scholar]
- 25. Sturge M. D., Phys. Rev. 1963, 130, 639–646. [Google Scholar]
- 26. König E., Herzog S., J. Inorg. Nucl. Chem. 1970, 32, 601–611. [Google Scholar]
- 27. Fujita I., Yazaki T., Torii Y., Kobayashi H., Bull. Chem. Soc. Jpn. 1972, 45, 2156–2161. [Google Scholar]
- 28. Bowman A. C., Sproules S., Wieghardt K., Inorg. Chem. 2012, 51, 3707–3717. [DOI] [PubMed] [Google Scholar]
- 29. Shah S. S., Maverick A. W., Inorg. Chem. 1986, 25, 1867–1871. [Google Scholar]
- 30. Maverick A. W., Shah S. S., Kirmaier C., Holten D., Inorg. Chem. 1987, 26, 774–776. [Google Scholar]
- 31. Shah S. S., Maverick A. W., Inorg. Chem. 1987, 26, 1559–1562. [Google Scholar]
- 32.
- 32a. Dill R. D., Portillo R. I., Shepard S. G., Shores M. P., Rappé A. K., Damrauer N. H., Inorg. Chem. 2020, 59, 14706–14715; [DOI] [PubMed] [Google Scholar]
- 32b. Joyce J. P., Portillo R. I., Nite C. M., Nite J. M., Nguyen M. P., Rappé A. K., Shores M. P., Inorg. Chem. 2021, 60, 12823–12834. [DOI] [PubMed] [Google Scholar]
- 33. Joyce J. P., Portillo R. I., Rappé A. K., Shores M. P., Inorg. Chem. 2022, 61, 6376–6391. [DOI] [PubMed] [Google Scholar]
- 34. Penfold T. J., Gindensperger E., Daniel C., Marian C. M., Chem. Rev. 2018, 118, 6975–7025. [DOI] [PubMed] [Google Scholar]
- 35. Dorn M., Kalmbach J., Boden P., Päpcke A., Gómez S., Förster C., Kuczelinis F., Carrella L. M., Büldt L., Bings N., Rentschler E., Lochbrunner S., González L., Gerhards M., Seitz M., Heinze K., J. Am. Chem. Soc. 2020, 142, 7947–7955. [DOI] [PubMed] [Google Scholar]
- 36. Förster C., Mack K., Carrella L. M., Ksenofontov V., Rentschler E., Heinze K., Polyhedron 2013, 52, 576–581. [Google Scholar]
- 37. Förster C., Gorelik T. E., Kolb U., Ksenofontov V., Heinze K., Eur. J. Inorg. Chem. 2015, 920–924. [Google Scholar]
- 38. Förster C., Dorn M., Reuter T., Otto S., Guellue D., Reich T., Carrella L., Rentschler E., Heinze K., Inorganics 2018, 6, 86. [Google Scholar]
- 39. Helm L., Merbach A. E., Chem. Rev. 2005, 105, 1923–1960. [DOI] [PubMed] [Google Scholar]
- 40. Roos B. O., Taylor R. P., Siegbahn P. E. M., Chem. Phys. 1980, 48, 157–173. [Google Scholar]
- 41. Siegbahn P. E. M., Almlöf J., Heiberg A., Roos B. O., J. Chem. Phys. 1981, 74, 2384–2396. [Google Scholar]
- 42. Angeli C., Cimiraglia R., Evangelisti S., Leininger T., Malrieu J.-P., J. Chem. Phys. 2001, 114, 10252–10264. [Google Scholar]
- 43. Angeli C., Cimiraglia R., Theor. Chim. Acta. 2002, 107, 313–317. [Google Scholar]
- 44.NIST ASD Team. A. Kramida, Y. Ralchenko, J. Reader, NIST Atomic Spectra Database, version 5.9; National Institute of Standards and Technology: Gaithersburg, MD, 2021; 10.18434/T4 W30F. Available: https://physics.nist.gov/asd (September 13, 2022).
- 45. Reber C., Güdel H. U., J. Luminesc. 1988, 42, 1–13. [Google Scholar]
- 46. Dorn M., Kalmbach J., Boden P., Kruse A., Dab C., Reber C., Niedner-Schatteburg G., Lochbrunner S., Gerhards M., Seitz M., Heinze K., Chem. Sci. 2021, 12, 10780–10790. [DOI] [PMC free article] [PubMed] [Google Scholar]
- 47. Boça R., Coord. Chem. Rev. 2004, 248, 757–815. [Google Scholar]
- 48. Francisco E., Pueyo L., Phys. Rev. B 1988, 37, 5278–5288. [DOI] [PubMed] [Google Scholar]
- 49. Krzystek J., Ozarowski A., Telser J., Coord. Chem. Rev. 2006, 250, 2308–2324. [Google Scholar]
- 50. Craig G. A., Murrie M., Chem. Soc. Rev. 2015, 44, 2135–2147. [DOI] [PubMed] [Google Scholar]
- 51. Perlepe P. S., Maniaki D., Pilichos E., Katsoulakou E., Perlepes S. P., Inorganics 2020, 8, 39. [Google Scholar]
- 52. Rechkemmer Y., Breitgoff F., van der Meer M., Atanasov M., Hakl M., Orlita M., Neugebauer P., Neese F., Sarkar B., van Slageren J., Nat. Commun. 2016, 7, 10467. [DOI] [PMC free article] [PubMed] [Google Scholar]
Associated Data
This section collects any data citations, data availability statements, or supplementary materials included in this article.
Supplementary Materials
As a service to our authors and readers, this journal provides supporting information supplied by the authors. Such materials are peer reviewed and may be re‐organized for online delivery, but are not copy‐edited or typeset. Technical support issues arising from supporting information (other than missing files) should be addressed to the authors.
Supporting Information
Supporting Information
Supporting Information
Data Availability Statement
The data that support the findings of this study are available in the Supporting material of this article.


