Abstract
The combination of physical properties sensitive to molecular chirality in a single system allows the observation of fascinating phenomena such as magneto‐chiral dichroism (MChD) and circularly polarized luminescence (CPL) having potential applications for optical data readout and display technology. Homochiral monodimensional coordination polymers of YbIII were designed from a 2,15‐bis‐ethynyl‐hexahelicenic scaffold decorated with two terminal 4‐pyridyl units. Thanks to the coordination of the chiral organic chromophore to Yb(hfac)3 units (hfac−=1,1,1,5,5,5‐hexafluoroacetylaconate), efficient NIR‐CPL activity is observed. Moreover, the specific crystal field around the YbIII induces a strong magnetic anisotropy which leads to a single‐molecule magnet (SMM) behaviour and a remarkable room temperature MChD. The MChD‐structural correlation is supported by computational investigations.
Keywords: Circularly Polarized Luminescence, Helicene, Magnetochiral Effect, Single-Molecule Magnet, Ytterbium
Enantiopure 1D YbIII coordination polymers involving helicene‐based ligands were designed. Their physical investigations revealed an unprecedented combination of field‐induced Single‐Molecule Magnet behavior, Near‐Infrared Circularly Polarized Luminescence and room temperature Magneto‐Chiral Dichroism (MChD). The magnetic anisotropy was determined as the preponderant criterion for the observation of a strong MChD.
Introduction
The coordination chemistry toolbox consisting of combining sophisticated chiral π‐conjugated ligands with lanthanide ions constitutes a very fruitful strategy for generating chiral monomeric and polymeric systems. In such systems, a precise chiral topology and multifunctionality can be designed and achieved from the synergy of the chiral ligand properties and the specific optical and magnetic features of the lanthanide ion.[ 1 , 2 , 3 ] Furthermore, this strategy unravels fascinating cross effects originating from the combination of chirality with optical, conducting or magnetic properties, such as ferroelectricity, chiral single‐molecule magnet (SMM) behavior, [4] magneto‐chiral dichroism (MChD),[ 5 , 6 , 7 , 8 ] magnetoelectric effects, [9] X‐ray natural circular dichroism (XNCD), [10] circularly polarized luminescence (CPL), [11] chirality‐induced spin selectivity, [12] nonlinear optical activity, [13] chiral sensing[ 14 , 15 ] or asymmetric catalysis.[ 16 , 17 , 18 , 19 , 20 ] There is thus a strong interest in combining the inherent characteristics of lanthanides, especially strong magnetic anisotropy and finely structured emission, with chiral features within the same architecture. In this context, chiral LnIII‐based complexes have been used as highly efficient CPL emitters for applications in biological sensing, anti‐counterfeiting devices, organic light‐emitting diodes.[ 11 , 21 , 22 , 23 , 24 , 25 ] In addition, a 1D organization can have a great influence on the magnetic anisotropy of the system and thus on the resulting macroscopic magnetic properties.[ 26 , 27 ]
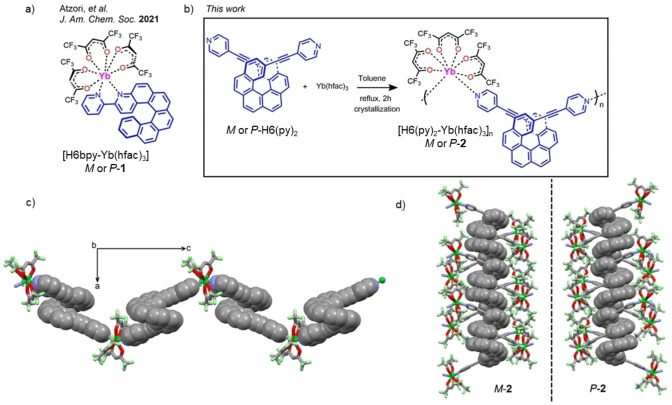
Among chiral molecular building blocks, helicenes have recently raised great attention. They are inherently chiral molecular architectures generated from ortho‐fused (hetero)aromatic rings with extended π‐conjugation, displaying, very strong chiroptical activity.[ 28 , 29 , 30 , 31 , 32 ] When decorated with coordinating units, they can react with a variety of metal ions and give access to a very rich diversity of coordination‐driven chiral architectures (chiral complexes with controlled topology and enhanced chiroptics, helicates, coordination polymers, supramolecular cages, etc).[ 33 , 34 ] Through this strategy, fascinating chirality‐related properties can be obtained, such as redox‐triggered chiroptical switching, chiral sensing, or CP emission. However, generating helicene‐based metal‐organic 1D polymeric architectures remains challenging and very few examples are described in the literature. [35] Recently, we have shown that 3‐(2‐pyridyl)‐4‐aza[6]‐helicene (H6bpy) bearing a 2,2′‐bipyridine coordinating unit can accommodate a lanthanide ion and combine the inherent properties of the helicenic ligand with those of the lanthanide to create unprecedented chiral SMMs (1) (Figure 1a),[ 36 , 37 , 38 , 39 ] efficient singlet oxygen sensitizers, [40] and strong MChD response in the NIR range of the electromagnetic spectrum.[ 41 , 42 , 43 ] Despite their pertinent chiroptical properties, chiral emissive YbIII complexes are still scarce.[ 18 , 19 , 44 , 45 , 46 , 47 , 48 , 49 ] Herein, we describe the synthesis of the first homochiral monodimensional coordination polymer (1D‐CP), namely M‐ and P‐[H6(py)2Yb(hfac)3]n 2 and its structural features. Lanthanide emission of such enantiopure polymeric complexes can be sensitized via triplet‐Ln energy transfer, as the helicene triplet level lies at low energy and can therefore transfer energy to the YbIII center. Transitions between the ground 2F7/2 and the excited 2F5/2 spectroscopic terms are notably magnetic dipole allowed enabling strong chiroptical properties.[ 50 , 51 ] In addition, the photophysical performances turn out to be highly sensitive to the ytterbium environment. The combination of its chiral SMM behavior, its strong MChD response up to room temperature and its near‐infrared (NIR) CPL activity in solid state is thoroughly detailed and further interpreted using ab initio calculations. The emissive properties (luminescence and CPL) of the previously published mononuclear compound [H6bpy‐Yb(hfac)3] [41] were also investigated for comparison with those of 2.
Figure 1.
a) Molecular structure of [H6bpy‐Yb(hfac)3] (1), b) chemical reaction for the formation of [H6(Py)2Yb(hfac)3] n (2), c) X‐ray structure of M‐2 along the c axis with H6(Py)2 ligand and Yb(hfac)3 moieties respectively drawn in capped sticks and spacefill representations, and d) supramolecular arrangement of the two enantiomers along the a axis.
Results and Discussion
Among the lanthanide ions, YbIII was chosen because it gives access either to discrete or polymeric chiral complexes with high magnetic anisotropy, SMM behavior, MChD, or CPL activity,[ 18 , 19 , 27 , 46 , 47 , 52 , 53 , 54 , 55 , 56 , 57 , 58 , 59 , 60 , 61 , 62 , 63 ] but also to bioimaging and biosensing materials thanks to remarkably reduced tissue absorption and limited scattering in the NIR spectral range.[ 64 , 65 , 66 ] Enantiopure M‐ and P‐carbo[6]helicene decorated in positions 2,15 with 4‐pyridyl‐ethynyl units appeared suitable for preparing coordination polymers.[ 67 , 68 ] Indeed, refluxing M‐ and P‐H6(Py)2 with 1 equivalent of ytterbium(III)‐tris‐hexafluoro‐acetylacetonate precursor for 2 hours in toluene gave the 2,15‐bis‐(4‐pyridyl)‐ethynyl‐carbo[6]helicene‐ytterbium‐tris‐hexafluoro‐acetylacetonate polymer, M‐ and P‐2 (Figure 1b). Layering n‐hexane into the mother solution gave single crystals with good yields (68 % and 72 %, respectively), suitable for X‐ray diffraction investigation.
Enantiopure compounds P‐ and M‐2 crystallize in the non‐centrosymmetric orthorhombic P212121 space group (Table S1), [69] with the asymmetric unit being constructed from one (M or P)‐H6(Py)2 moiety along with one Yb(hfac)3 unit plus two toluene interstitial solvent molecules for P‐2. ORTEP views of the asymmetric units for both enantiomers are depicted in Figures S1 and S2. They display a chiral coordination polymer in which the YbIII ion is surrounded by eight coordinating atoms, six oxygen from three hfac− anions and two nitrogens from the pyridine moieties. The chiral helicene ligands combined with the Yb(hfac)3 inorganic units through the pyridine groups thus form a robust two‐sided chelated polymeric structure (Figure 1c). As determined by the SHAPE program, in both M and P enantiomers the coordination sphere of the YbIII possesses a slightly distorted D2d symmetry (Tables S2 and S3), the distortion being weakened compared to the one observed in 1.
The Yb−Ohfac and Yb−N distances were found to be in the 2.249(6)–2.348(7) Å and 2.473(7)–2.513(7) Å ranges, respectively. The helicity (dihedral angle between the two terminal rings) of the H6(Py)2 units was found to be 49.61°, which is very similar to a recently reported helicenic structure displaying ethynyl moieties and slightly different from the pure carbo[6]helicene molecule. [69] The shortest intra‐chain Yb−Yb distance is 20.089 Å while the shortest inter‐chain Yb−Yb distance is 9.323 Å. In addition, the crystal packing reveals π‐π* stacking between helicene moieties (Figure S3), as well as homochiral columns formed by the enantiopure H6(Py)2 ligands (Figure 1d). Overall, this system constitutes the first example of helicene‐based lanthanide 1D‐polymeric complex.
The magnetic properties were investigated by SQUID measurements performed on 2 using immobilized crunched single crystals in a Teflon pellet and following the temperature dependence of the molar magnetic susceptibility times the temperature (χMT, see Figure S11). At room temperature, the experimental value (2.24 cm3 K mol−1) is very close to the expected one for isolated Yb3+ ions (2.57 cm3 K mol−1 for ground state multiplet 2F7/2 with g J=8/7). [70] χMT decreases monotonically as the temperature decreases down to 1.37 cm3 K mol−1 at 2 K, following the depopulation of crystal field sublevels. The field dependence of the magnetization measured at 2 K reaches the value of 1.73 Nβ under a magnetic field of 50 kOe, which is far from the expected saturated values of 4.0 Nβ for isolated YbIII ions in the absence of magnetic anisotropy (Inset of Figure S11). The calculated wavefunction energies and g tensors for the ground term 2F7/2 are reported in Tables S7 and S9, with a ground state dominated by the |±m J>=|±7/2> Kramers doublet (KD). The temperature dependence of the magnetic susceptibility and the magnetic field dependence of the magnetization obtained from the ab initio calculated energy levels are in fair agreement with the experimental ones (Figure S11).
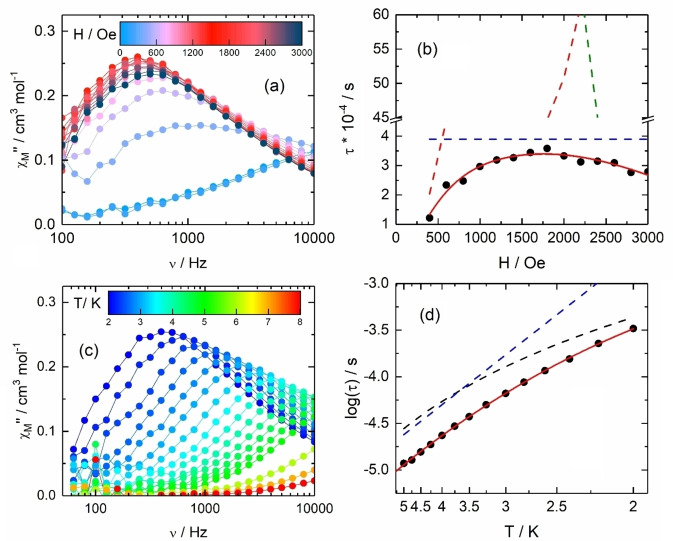
Measurements of the magnetic susceptibility in alternating fields were also performed to probe the SMM behaviour of complex 2. In the investigated frequency range (60–10000 Hz), there is a clear signature of a slowing down of the magnetic moment in zero field (χ M′′≠0). A complete blocking of the magnetization at low temperature is most probably hampered by fast relaxation due to Quantum Tunnelling of Magnetization (QTM, Figure 2a).[ 71 , 72 ] The maximum of the χM′′ curves shifts to lower frequency under an external DC field (Figure 2a), thus confirming the presence of slow magnetic relaxation and field‐induced SMM behaviour. The optimum field for which the relaxation is the slowest with the maximum amplitude of the out‐of‐phase component is 1600 Oe. The AC data at 2 K (Figure S12) have been analysed in the frame of the Debye model (see Supporting Information, Table S4). The best fit of the field dependence of the relaxation time at 2 K (Figure 2b) was obtained using Eq. S1 described in Supporting Information (best‐fit parameters: B1=9.6(8)×106 s−1, B2=1.2(1)×10−2 Oe−2, A=1.3(1)×10−11 s−1 K−1 Oe−4 and k(T)=2.6(2)×103 s−1). Overall, the relaxation process in field is dominated by QTM (for B<500 Oe) and thermally activated mechanisms (Orbach+Raman) (for B>500 Oe). In a 1600 Oe applied field, the extended Debye model was used in the temperature range 2–8 K (Figures 2c, S13 and Table S5) and a combination of Orbach (τ 0=1.24(6)×10−7 s and ΔE=14.8(0.9) K) and Raman (C=288,4(66) s−1 K−n and n=3.16(0.33)) processes are able to reproduce the temperature dependence of the relaxation process (Figure 2d) in agreement with the field dependence described in Figure 2b. The normalized Cole‐Cole plots [73] (Figure S14) show that 95 % of the sample is involved in the relaxation process under an applied magnetic field of 1600 Oe with an almost single relaxation time (distribution α ranges from 0.002 to 0.19 between 5 and 2 K (Table S5)). Interestingly, 2 behaves as a better SMM than 1, [41] since 1 reveals no slow magnetic relaxation up to 10 kHz at 2 K. Calculated transition magnetic moment elements are in slight favor of the mononuclear complex M‐1 (Figure S20) but one could remind that hyperfine interactions [74] and spin‐phonon couplings[ 75 , 76 ] are not considered in the current calculations. The main difference between 1 and 2 is found in the nature of the ground KD, which is constructed of an admixture of |±m J> states (68 %|±7/2>, 13 %|±1/2>, 12 %|±3/2> and 7 %|±5/2>) for 2 whereas, for 1 the ground state reveals a different and more mixed composition (63 %|±5/2>, 16 %|±7/2>, 14 %|±1/2> and 7 %|±3/2>) (Table S9) that directly affects the magnetization dynamics as well as the magneto‐chiral optical properties (see below).
Figure 2.
(a) Field dependence of the χM′′ for M‐2 at 2 K in the 0–3000 Oe magnetic field range. b) Magnetic field dependence of the relaxation time (τ) (black dots) with the best fit (full red line) obtained with equation S1. The dashed red, blue and green lines represent the QTM, Raman+Orbach and Direct processes contributions, respectively. c) Frequency dependence of χM′′ for M‐2 in the 2–8 K temperature range under an applied magnetic field of 1600 Oe. d) Thermal dependence of log(τ) for M‐2 (black dots) in the 2–5 K temperature range under an applied magnetic field of 1600 Oe with the best fit (full red line) obtained with equation S1 (see text for parameter values). Raman and Orbach contributions are drawn in dashed black and blue lines respectively.
The absorption of the enantiopure helicene‐lanthanide polymers P‐ and M‐2 were investigated in the UV/Visible range, in toluene solutions (≈10−5 M) (see Supporting Information for details, Figures S4 and S5) and in solid state (diluted KBr pellets, Figures S6 and S7). The UV/Vis absorption spectrum of 2 in solution shows a similar shape as for the starting ligand but with overall higher intensity. In KBr, four main absorption bands centered at 245, 300, 380 and 420 nm are found, corresponding to the π‐π* excitations of the hfac− and helicene ligands.
The corresponding natural circular dichroism (NCD) spectra in solution and in solid state are quite different, with the four NCD bands corresponding to the absorption ones in solution (toluene, 10−5 M), and only one positive ECD‐active band located at 380 nm (positive for P‐2, with an absorption dissymmetry factor g abs of 7.10−4 at 298 K, Figure S7) which is typical for helicenes in this domain. No NCD contribution was observed below 350 nm, which is certainly due to the scattering of KBr that depolarizes the light and erases the CD measurement. Scattering intensity being inversely proportional to the fourth power of the wavelength, the shorter the wavelength, the more the chiroptical property will be affected.
To gain insight into the YbIII f‐f electronic transitions, absorption and luminescence spectra were recorded in the near infra‐red region. The luminescence spectra are recorded for 1 and 2 in the solid state, under excitation at 365 nm (27 397 cm−1) corresponding to the absorption of the helicene part which then sensitizes the YbIII luminescence. Recall here that YbIII contains only two multiplet manifolds: the ground 2F7/2 state and the excited 2F5/2 one. Due to crystal field, these two states split into MJ KD that are distributed in the two manifolds and labeled from 0 to 3 in the ground state and from 0′ to 2′ in the excited state, from the lowest to the highest energy as can be seen in Figure S8. NIR absorption spectra (920–1000 nm range, transmission mode) were obtained by unpolarized light irradiation of enantiopure single crystals of P‐2 and M‐2 along the c crystallographic axis as a function of the temperature.
The absorption measurements were delicate due to the micrometric size of the single crystals which explains the low signal to noise ratio of the measured spectra. Nevertheless, we succeeded to record absorption spectra from ambient down to 4 K (Figure 3). At room temperature, the absorption spectrum shows two main contributions, a sharp absorption band at λ=975 nm and a broader and less intense band at λ=938 nm. By lowering the temperature, the spectrum becomes more structured, clearly evidencing at 4 K, three main contributions at λ=975, 965 and 935 nm (Figure 3). The contribution at λ=975 nm is the sharpest and does not show any fine structure, being characterized by a well‐defined maximum and a gaussian shape. This transition gains intensity by temperature lowering. The relatively broad contribution at λ=965 nm, is much less intense and not visible at room temperature while characterized by a fine‐substructure. Finally, the contribution at λ=938 nm, that shows a low intensity at room temperature, gains intensity by temperature lowering, and becomes the most intense of the series. It is also characterized by a fine‐structure with a shoulder around 932 nm. Overall, these observations are in very good agreement with what was recently observed for 1 and are ascribed to the electronic transitions of YbIII, from the ground state of the fundamental level 2F7/2 to the three MJ KD of the excited one 2F5/2, 0′←0, 1′←0 and 2′←0 for instance (Figure S8). The remaining additional contributions might be induced by vibronic coupling as proposed for 1. [40] The differences in energy between 1′←0 and 2′←0 transitions is 304 cm−1, while it is 117 cm−1 between the 0′←0 and 1′←0 transitions. These values are in agreement with those obtained by SA‐CAS(13,7)PT2/RASSI‐SO calculations (315 cm−1, 115 cm−1, Table S7), which allowed determination of the composition and energy of the respective KD (see Computational section in Supporting Information).
Figure 3.
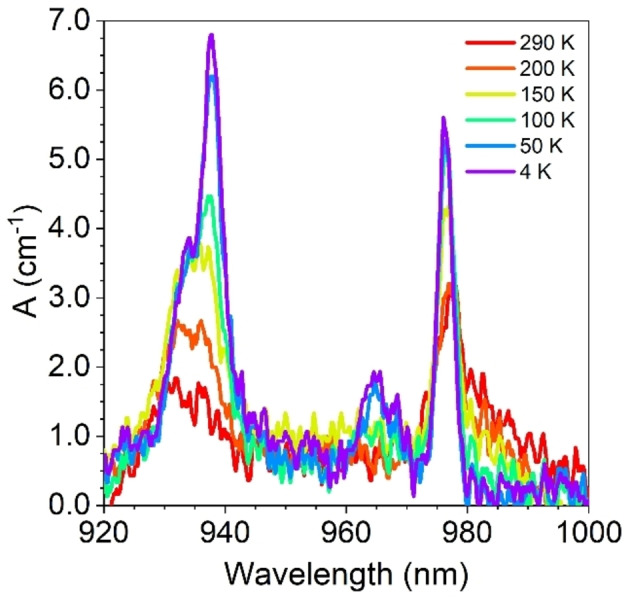
Temperature variation (selected temperature, see legend) of the absorption spectrum (920–1000 nm) for a single crystal of (P)‐2 measured with the unpolarized light wavevector propagating along the c crystallographic axis.
By comparing the absorption (Figure 3) and luminescence spectra (Figure 4b) obtained at 4 K and at 77 K respectively, we can assign the common electronic transition at about 975 nm to the 0′⇆0, 0‐phonon line (defined as the energy separation between the lowest MJ KD of each manifold) of YbIII in helicene‐lanthanide polymers P and M‐2 (Figure S8). The three other main expected contributions due to the 2F5/2→2F7/2 transition are observed at 1002 nm, 1018 nm and 1031 nm, corresponding to 0′→1, 0′→2 and 0′→3, respectively (Figure S8). Additional emission bands are possibly due to hot bands and vibronic contributions as already observed in YbIII coordination complexes. [77] Indeed at 77 K, based on a Boltzmann distribution, the population of the excited state 1′ is 10 % of 0′ and 2′ is negligible. The emission from excited level 1′ to the four levels of the 2F7/2 multiplet is reported on Figure S8a. The four main transitions are separated by 266 cm−1, 423 cm−1 and 547 cm−1, in reasonable agreement with the values obtained from ab initio calculations (Table S7). For comparison, we also recorded the luminescence of 1 at 77 K. The obtained spectra are presented in Figure 4a and show different features than for 2. The intense band at 978 nm can be reasonably attributed to the 0‐phonon line while the other bands at 995 nm, 1025 nm and 1032 nm are attributed to the 0′→1, 0′→2 and 0′→3 transitions with energy differences of 175 cm−1, 469 cm−1 and 535 cm−1. Here again, additional bands are due to both hot band and vibronic coupling. While the total crystal field splitting is similar for both compounds (535 cm−1 for 1, 547 cm−1 for 2) as a consequence of the same N2O6 coordination environment for the YbIII ions, the difference in the relative energies of the transitions are induced by the more distorted D2d symmetry observed in the polymer as suggested by the crystal structure. Note that for both 1 and 2, the P and M enantiomers display identical luminescence spectra at low and ambient temperatures. NIR‐luminescence (Figure S9) and CPL (Figure 4) measurements were performed for 1 and 2 in the solid state at room temperature, under 365 nm excitation. The helical ligands revealed efficient both in harnessing the lanthanide for NIR emission and in providing a strong‐enough chiral environment around the YbIII for the observation of chiroptical activity. Weak but reliable mirror‐imaged CPL spectra were observed for P and M‐2 (Figure 4b), with corresponding emission dissymmetry factor (g lum) of around +0.007 for the M enantiomer at 978 nm (10 225 cm−1) (Figure S10). Two CPL‐active bands are found in M‐1, one negative located at 977 nm (10 235 cm−1) with a g lum value of −0.13 and one positive band at 1004 nm (9960 cm−1) about 6 times lower in glum intensity (g lum of +0.02) (Figure S10). Thanks to the stronger dissymmetric environment around the lanthanide ion in 1, the mononuclear species P and M‐ 1 exhibit a stronger CPL response (Figure 4a). [41] Indeed, the absolute value of the g lum factor is 16 times higher in M‐ 1 (0.13) than in M‐ 2 (+0.008) at the same wavelength. Overall, the g lum values observed in these studies are within the range of those reported in the literature, which vary from low (10−3) [19] to large absolute values (0.38) [49] and highlight the influence of the chemical environment of the Yb center. 4 to 12 bands could be expected at room temperature depending on the population of the three 2F5/2 KDs.
Figure 4.
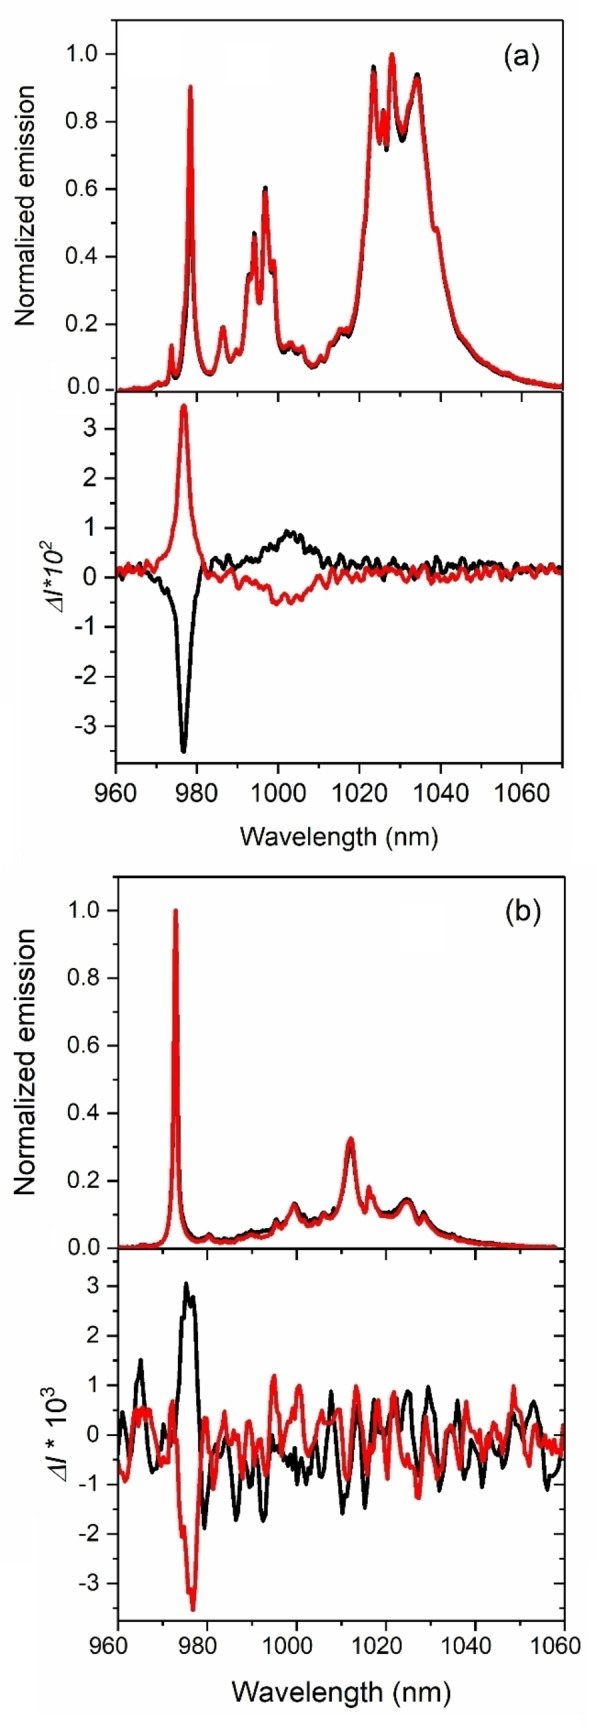
Total luminescence (at 77 K) (top) and CPL (at 298 K) (bottom) spectra, under 365 nm excitation of 1 (a) and 2 (b) in solid state. The scales luminescence and CPL are normalized to the maximum of emission. Spectra for P and M enantiomers are shown in red and black, respectively.
The simulated CPL spectrum of M‐2 is presented in Figure S19 and its evolution with temperature is presented in Figure 5a based on Boltzmann population of the 2F5/2 multiplet, while the absolute contributions from the various emissive KDs are given on Figure 5b. [78] Interestingly, the transitions from 1′ and 2′ KDs should disappear on lowering temperature. The contribution to the overall spectrum at 298 K (red in Figure 5a) is 59 % from 0′, 34 % from 1′ and 7 % from 2′ (respectively blue, green and magenta in Figure 5b). A similar analysis was done for M‐1 (Figure S21).
Figure 5.
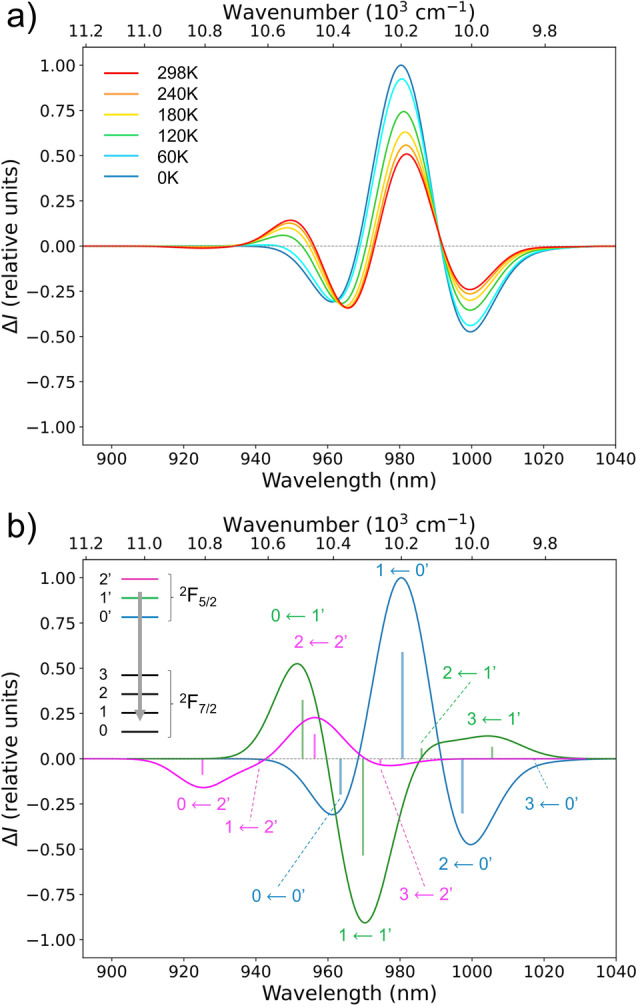
Simulated CPL spectra at SA‐CAS(13,7)PT2/RASSI‐SO level of M‐2 as a function of the temperature (a) and with different absolute contributions from the emissive term 2F5/2 (b). Calculated rotatory strengths indicated as “stick” spectra.
Thereby, as revealed in Figure S22, any relevant difference in the shape of the spectra appears between 2 and 1, while rotatory strengths computed for 1 are 1.3 times higher than for 2 on average at 298 K (Table S10) in line with the weaker intensity observed experimentally for 2. As expected for the model employed for 2, the CPL band simulated at 960 nm corresponding to the transition 0←0′ conserves the same sign as the one calculated for 1. This result clearly suggests that supramolecular organization subtly affects CPL signals that could not be simulated at this stage with molecular models.
MChD measurements were performed in the temperature range T=4–290 K with an alternating (Ω=0.04 Hz) magnetic field B=±1.0 T applied along the light wavevector k on the same oriented crystals used for the collection of the absorption spectra (see above). Figure 6a shows the temperature dependence of the MChD spectra for both enantiomers.
Figure 6.
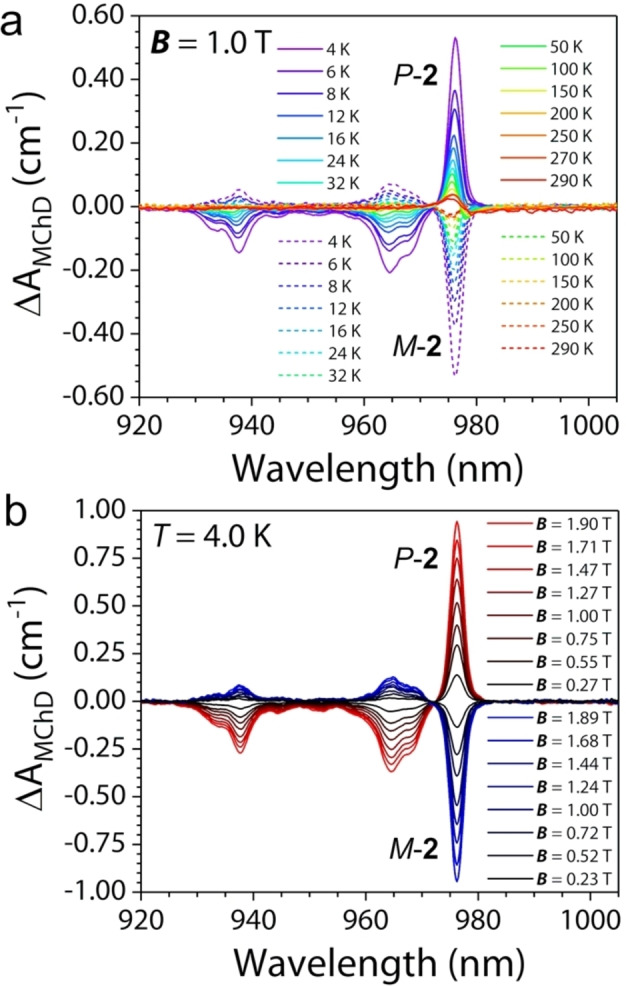
(a) Temperature variation of MChD spectra (920–1005 nm) of P‐2 and M‐2 recorded on an oriented single crystal under an applied magnetic field B =±1.0 T and (b) magnetic field variation of MChD spectra of P‐2 and M‐2 at T=4 K (b).
Three main MChD signals are observed for each enantiomer; an intense sharp signal at λ=976 nm, and two fine‐structured signals of lower intensity at λ=935 nm and λ=965 nm. These signals are clearly associated to the *2F5/2←2F7/2 electronic transition of the YbIII ion split by the crystal field in three components. The contribution at λ=976 nm, which is not affected by vibronic coupling, provides mirror‐imaged signals for opposite enantiomers, while those at λ=935 nm and λ=965 nm do not have exactly the same intensity once normalized for the sample thickness. This can be associated to a different lattice‐strain in the two samples, as the single crystals of 2 are particularly thin and fragile. Indeed, such a behaviour emerges for the two components that are affected by vibronic coupling.
The intensity of the MChD signals (ΔA MChD) at 976 nm associated to the 0′←0 is remarkably high, reaching ca. 0.50 cm−1 at 1 T. It compares well to magnetization data recorded on a polycrystalline sample of 2 in the entire investigated temperature range for B=1.0 T (Figure S15) and in the 0.0–1.90 T range at T=4.0 K (Figure S16). The magnetic field dependence at 4.0 K of the MChD signals is depicted in Figure 6b. The relative MChD with respect to the overall absorption is evaluated by calculating gMChD for this transition (see Supporting Information and Figure S17). It is worth 0.19 T−1, which is one of the highest values reported to date and the highest for lanthanide complexes. As a comparison, the gMChD value for 1 was 0.12 T−1, which indicates that a gain of a factor ca. 1.5 is associated to the different coordination environment and/or magnetic anisotropy of the lanthanide ion in the two compounds.
The high ΔA MChD values allowed us to investigate the temperature dependence of the MChD spectrum for both enantiomers up to room temperature (Figure 6a). MChD spectra at room temperature are extremely rare in the literature, and this represents the first full temperature (4–290 K) study. Such temperature dependence studies are particularly important because it allows to clearly follow the shape evolution of the MChD signals, as for paramagnetic systems, a drastic change in the shape is expected. As in Magnetic Circular Dichroism spectroscopy,[ 79 , 80 ] at low temperature, the C term, associated to a variation of the population of the ground state level, defines the shape of the signal (absorption‐like). As the temperature increases and reaches ca. 150 K, the temperature independent A term, associated to the lifting of the degeneracy of ground and excited state levels due to the magnetic field (Zeeman splitting), became well visible and defines the experimentally observed shape (derivative type) (Figure 7).
Figure 7.
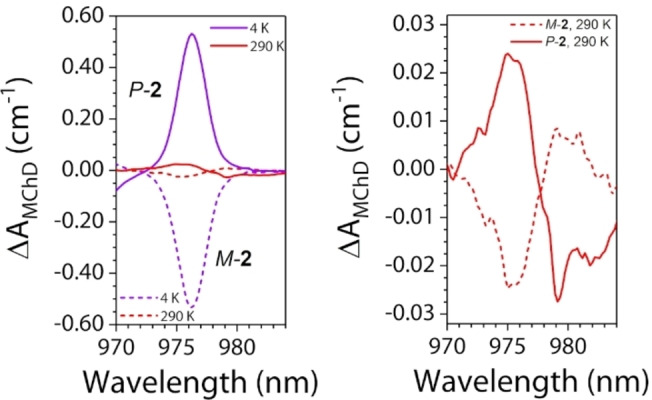
Comparison between MChD spectra recorded at 4 K and 290 K for both enantiomers (left) and zoom of the MChD spectra at 290 K, evidencing the derivative‐type shape (right).
Overall, the experimental data herein reported confirm that the magnetic dipole allowed 2F5/2←2F7/2 electronic transition of YbIII, together with the inherent high spin‐orbit coupling of the lanthanide ion, is a strong MChD‐active transition, allowing the observation of gMChD anisotropy factors as high as ca. 20 % of the absorption observed at zero field. To increase the portion of the absorption affected by the applied magnetic field, one can in principle increase the chirality at the metal center but it might not be the most efficient strategy with respect to act on the magnetic anisotropy of the magnetic ground state through the coordinating ligands. [81] Indeed, the structural data suggest that the chiral environment is weaker for 2 with respect to 1 whereas theoretical calculations and magnetic measurements show that the magnetic anisotropy of the ground state is higher in 2 than in 1. This is clearly shown by the calculated composition of the ground state wavefunction that is dominated by a |±7/2> component in 2 instead of a |±5/2> component in 1. These theoretical results thus clearly illustrate the influence of the chirality of the lanthanide environment and its magnetic anisotropy on the MChD properties.
Conclusion
In conclusion, unprecedented enantiopure 1D coordination polymers of YbIII involving helicene‐based ligand were designed and characterized. The combination of the chirality and efficient sensitization of the YbIII luminescence allowed the observation of NIR‐CPL signal and contribution from the supramolecular organization. The combination of chirality and magnetism allowed the observation of a strong MChD response. The latter was observed up to room temperature thanks to the specific crystal field which induced a strong magnetic anisotropy for the YbIII center. A comparison with the homochiral mononuclear systems highlighted that the magnetic anisotropy is the preponderant criterion for the observation of strong MChD compared to chirality in LnIII complexes. Such conclusion opens new routes to the design of high performance MChD SMMs and to their use as potential candidates for optical readout of magnetic data with either polarized or unpolarized light.
Conflict of interest
The authors declare no conflict of interest.
1.
Supporting information
As a service to our authors and readers, this journal provides supporting information supplied by the authors. Such materials are peer reviewed and may be re‐organized for online delivery, but are not copy‐edited or typeset. Technical support issues arising from supporting information (other than missing files) should be addressed to the authors.
Supporting Information
Supporting Information
Acknowledgments
The French National Research Agency (ANR) and the European Research Council (ERC) are acknowledged for financial support through SMMCPL (ANR‐19‐CE29‐0012‐02), MONAFER (ANR‐18‐CE09‐0032) and MACHINACO (ANR‐19‐CE09‐0018) and the European Union's Horizon 2020 research and innovation program (ERC‐CoG MULTIPROSMM, Grant Agreement No. 725 184). MG and BLG thank the French GENCI/IDRIS‐CINES centers for high‐performance computing resources. JC thanks Dr. Ludovic Favereau for fruitful discussions.
Dhbaibi K., Grasser M., Douib H., Dorcet V., Cador O., Vanthuyne N., Riobé F., Maury O., Guy S., Bensalah-Ledoux A., Baguenard B., Rikken G. L. J. A., Train C., Le Guennic B., Atzori M., Pointillart F., Crassous J., Angew. Chem. Int. Ed. 2023, 62, e202215558; Angew. Chem. 2023, 135, e202215558.
A previous version of this manuscript has been deposited on a preprint server (https://doi.org/10.26434/chemrxiv‐2022‐7k032).
Contributor Information
Dr. Boris Le Guennic, Email: boris.leguennic@univ-rennes1.fr.
Dr. Matteo Atzori, Email: matteo.atzori@lncmi.cnrs.fr.
Dr. Fabrice Pointillart, Email: fabrice.pointillart@univ-rennes1.fr.
Dr. Jeanne Crassous, Email: jeanne.crassous@univ-rennes1.fr.
Data Availability Statement
The data that support the findings of this study are available in the supplementary material of this article.
References
- 1. Aspinall H. C., Chem. Rev. 2002, 102, 1807–1850. [DOI] [PubMed] [Google Scholar]
- 2. Tay H. M., Kyratzis N., Thoonen S., Boer S. A., Turner D. R., Hua C., Coord. Chem. Rev. 2021, 435, 213763–213821. [Google Scholar]
- 3. Gorai T., Schmitt W., Gunnlaugsson T., Dalton Trans. 2021, 50, 770–784. [DOI] [PubMed] [Google Scholar]
- 4. Train C., Gruselle M., Verdaguer M., Chem. Soc. Rev. 2011, 40, 3297–3312. [DOI] [PubMed] [Google Scholar]
- 5. Rikken G. L. J. A., Raupach E., Nature 1997, 390, 493–494. [Google Scholar]
- 6. Atzori M., Rikken G. L. J. A., Train C., Chem. Eur. J. 2020, 26, 9784–9791. [DOI] [PubMed] [Google Scholar]
- 7. Atzori M., Train C., Hillard E. A., Avarvari N., Rikken G. L. J. A., Chirality 2021, 33, 844–857. [DOI] [PubMed] [Google Scholar]
- 8. Taniguchi K., Nishio M., Kishiue S., Huang P.-J., Kimura S., Miyasaka H., Phys. Rev. Mater. 2019, 3, 045202–045209. [Google Scholar]
- 9. Long J., Ivanov M. S., Khomchenko V. A., Mamontova E., Thibaud J.-M., Rouquette J., Beaudhuin M., Granier D., Ferreira R. A. S., Carlos L. D., Donnadieu B., Henriques M. S. C., Paixão J. A., Guari Y., Larionova J., Science 2020, 367, 671–676. [DOI] [PubMed] [Google Scholar]
- 10. Mihalcea I., Perfetti M., Pineider F., Tesi L., Mereacre V., Wilhelm F., Rogalev A., Anson C. E., Powell A. K., Sessoli R., Inorg. Chem. 2016, 55, 10068–10074. [DOI] [PubMed] [Google Scholar]
- 11. Doistau B., Jiménez J.-R., Piguet C., Front. Chem. 2020, 8, 555–582. [DOI] [PMC free article] [PubMed] [Google Scholar]
- 12. San Sebastian E., Cepeda J., Huizi-Rayo U., Terenzi A., Finkelstein-Shapiro D., Padro D., Santos J. I., Matxain J. M., Ugalde J. M., Mujica V., J. Am. Chem. Soc. 2020, 142, 17989–17996. [DOI] [PubMed] [Google Scholar]
- 13. Ohkoshi S.-i., Takano S., Imoto K., Yoshikiyo M., Namai A., Tokoro H., Nat. Photonics 2014, 8, 65–71. [Google Scholar]
- 14. Tsukube H., Shinoda S., Tamiaki H., Coord. Chem. Rev. 2002, 226, 227–234. [Google Scholar]
- 15. Staszak K., Wieszczycka K., Marturano V., Tylkowski B., Coord. Chem. Rev. 2019, 397, 76–90. [Google Scholar]
- 16. Inanaga J., Furuno H., Hayano T., Chem. Rev. 2002, 102, 2211–2226. [DOI] [PubMed] [Google Scholar]
- 17. El Rez B., Liu J., Béreau V., Duhayon C., Horino Y., Suzuki T., Coolen L., Sutter J.-P., Inorg. Chem. Front. 2020, 7, 4527–4534. [Google Scholar]
- 18. Gendron F., Di Pietro S., Abad Galán L., Riobé F., Placide V., Guy L., Zinna F., Di Bari L., Bensalah-Ledoux A., Guyot Y., Pilet G., Pointillart F., Baguenard B., Guy S., Cador O., Maury O., Le Guennic B., Inorg. Chem. Front. 2021, 8, 914–926. [Google Scholar]
- 19. Lefeuvre B., Mattei C. A., Gonzalez J. F., Gendron F., Dorcet V., Riobé F., Lalli C., Le Guennic B., Cador O., Maury O., Guy S., Bensalah-Ledoux A., Baguenard B., Pointillart F., Chem. Eur. J. 2021, 27, 7362–7366. [DOI] [PubMed] [Google Scholar]
- 20. Zhou Y., Li H., Zhu T., Gao T., Yan P. A., J. Am. Chem. Soc. 2019, 141, 19634–19643. [DOI] [PubMed] [Google Scholar]
- 21. Riehl J. P., Richardson F. S., Chem. Rev. 1986, 86, 1–16. [Google Scholar]
- 22. Muller G., Dalton Trans. 2009, 9692–9707. [DOI] [PMC free article] [PubMed] [Google Scholar]
- 23. Carr R., Evans N. H., Parker D., Chem. Soc. Rev. 2012, 41, 7673–7686. [DOI] [PubMed] [Google Scholar]
- 24. Zinna F., Di Bari L., Chirality 2015, 27, 1–13. [DOI] [PubMed] [Google Scholar]
- 25. MacKenzie L. E., Pal R., Nat. Rev. Chem. 2021, 5, 109–124. [DOI] [PubMed] [Google Scholar]
- 26. Sessoli R., Boulon M.-E., Caneschi A., Mannini M., Poggini L., Wilhelm F., Rogalev A., Nat. Phys. 2015, 11, 69–74. [DOI] [PMC free article] [PubMed] [Google Scholar]
- 27. Clérac R., Miyasaka H., Yamashita M., Coulon C., J. Am. Chem. Soc. 2002, 124, 12837–12844. [DOI] [PubMed] [Google Scholar]
- 28. Chen C.-F., Shen Y., in Helicene Chemistry: From Synthesis to Applications; Springer, Berlin, Heidelberg, 2017. [Google Scholar]
- 29. Shen Y., Chen C.-F., Chem. Rev. 2012, 112, 1463–1535. [DOI] [PubMed] [Google Scholar]
- 30. Gingras M., Félix G., Peresutti R., Chem. Soc. Rev. 2013, 42, 1007–1050. [DOI] [PubMed] [Google Scholar]
- 31. Dhbaibi K., Favereau L., Crassous J., Chem. Rev. 2019, 119, 8846–8953. [DOI] [PubMed] [Google Scholar]
- 32. Crassous J., Stará I. G., Starý I., Helicenes - Synthesis, Properties and Applications, Wiley, Hoboken, 2022. [Google Scholar]
- 33. Gauthier E. S., Rodríguez R., Crassous J., Angew. Chem. Int. Ed. 2020, 59, 22840–22856; [DOI] [PubMed] [Google Scholar]; Angew. Chem. 2020, 132, 23036–23052. [Google Scholar]
- 34. Dai Y., Katz T. J., Nichols D. A., Angew. Chem. Int. Ed. Engl. 1996, 35, 2109–2111; [Google Scholar]; Angew. Chem. 1996, 108, 2230–2232. [Google Scholar]
- 35. Katz T. J., Sudhakar A., Teasley M. F., Gilbert A. M., Geiger W. E., Robben M. P., Wuensch M., Ward M. D., J. Am. Chem. Soc. 1993, 115, 3182–3198. [Google Scholar]
- 36. Ou-Yang J. K., Saleh N., Fernandez Garcia G., Norel L., Pointillart F., Guizouarn T., Cador O., Totti F., Ouahab L., Crassous J., Le Guennic B., Chem. Commun. 2016, 52, 14474–14477. [DOI] [PubMed] [Google Scholar]
- 37. Fernandez-Garcia G., Flores Gonzalez J., Ou-Yang J.-K., Saleh N., Pointillart F., Cador O., Guizouarn T., Totti F., Ouahab L., Crassous J., Le Guennic B., Magnetochemistry 2017, 3, 2–14. [Google Scholar]
- 38. Flores Gonzalez J., Montigaud V., Saleh N., Cador O., Crassous J., Le Guennic B., Pointillart F., Magnetochemistry 2018, 4, 39–50. [Google Scholar]
- 39. Pointillart F., Ou-Yang J.-K., Fernandez Garcia G., Montigaud V., Flores Gonzalez J., Marchal R., Favereau L., Totti F., Crassous J., Cador O., Ouahab L., Le Guennic B., Inorg. Chem. 2019, 58, 52–56. [DOI] [PMC free article] [PubMed] [Google Scholar]
- 40. Galland M., Riobé F., Ouyang J., Saleh N., Pointillart F., Dorcet V., Le Guennic B., Cador O., Crassous J., Andraud C., Monnereau C., Maury O., Eur. J. Inorg. Chem. 2019, 118–125. [Google Scholar]
- 41. Atzori M., Dhbaibi K., Douib H., Grasser M., Dorcet V., Breslavetz I., Paillot K., Cador O., Rikken G. L. J. A., Le Guennic B., Crassous J., Pointillart F., Train C., J. Am. Chem. Soc. 2021, 143, 2671–2675. [DOI] [PubMed] [Google Scholar]
- 42. Abhervé A., Mastropasqua Talamo M., Vanthuyne N., Zinna F., Di Bari L., Grasser M., Le Guennic B., Avarvari N., Eur. J. Inorg. Chem. 2022, e202200010. [Google Scholar]
- 43. Handzlik G., Rzepka K., Pinkowicz D., Magnetochemistry 2021, 7, 138–151. [Google Scholar]
- 44. Willis O. G., Zinna F., Pescitelli G., Micheletti C., Di Bari L., Dalton Trans. 2022, 51, 518–523. [DOI] [PubMed] [Google Scholar]
- 45. Zinna F., Arrico L., Di Bari L., Chem. Commun. 2019, 55, 6607–6609. [DOI] [PubMed] [Google Scholar]
- 46. Maupin C. L., Parker D., Williams J. A. G., Riehl J. P., J. Am. Chem. Soc. 1998, 120, 10563–10564. [Google Scholar]
- 47. Maupin C. L., Dickins R. S., Govenlock L. G., Mathieu C. E., Parker D., Williams J. A. G., Riehl J. P., J. Phys. Chem. A 2000, 104, 6709–6717. [Google Scholar]
- 48. Dickins R. S., Howard J. A. K., Maupin C. L., Moloney J. M., Parker D., Riehl J. P., Siligardi G., Williams J. A. G., Chem. Eur. J. 1999, 5, 1095–1105. [Google Scholar]
- 49. Górecki M., Carpita L., Arrico L., Zinna F., Di Bari L., Dalton Trans. 2018, 47, 7166–7177. [DOI] [PubMed] [Google Scholar]
- 50. Richardson F. S., Inorg. Chem. 1980, 19, 2806–2812. [Google Scholar]
- 51. Di Bari L., Pintacuda G., Salvadori P., J. Am. Chem. Soc. 2000, 122, 5557–5562. [Google Scholar]
- 52. Mukthar N. F. M., Schley N. D., Ung G., J. Am. Chem. Soc. 2022, 144, 6148–6153. [DOI] [PubMed] [Google Scholar]
- 53. Amoza M., Gómez-Coca S., Ruiz E., Phys. Chem. Chem. Phys. 2021, 23, 1976–1983. [DOI] [PubMed] [Google Scholar]
- 54. Gavrikov A. V., Efimov N. N., Ilyukhin A. B., Dobrokhotova Z. V., Novotortsev V. M., Dalton Trans. 2018, 47, 6199–6209. [DOI] [PubMed] [Google Scholar]
- 55. Liu T.-Q., Yan P.-F., Luan F., Li Y.-X., Sun J.-W., Chen C., Yang F., Chen H., Zou X.-Y., Li G.-M., Inorg. Chem. 2015, 54, 221–228. [DOI] [PubMed] [Google Scholar]
- 56. Mandal L., Biswas S., Cosquer G., Shen Y., Yamashita M., Dalton Trans. 2018, 47, 17493–17499. [DOI] [PubMed] [Google Scholar]
- 57. Petrosyants S. P., Babeshkin K. A., Gavrikov A. V., Ilyukhin A. B., Belova E. V., Efimov N. N., Dalton Trans. 2019, 48, 12644–12655. [DOI] [PubMed] [Google Scholar]
- 58. Chen W.-B., Zhong L., Zhong Y.-J., Zhang Y.-Q., Gao S., Dong W., Inorg. Chem. Front. 2020, 7, 3136–3145. [Google Scholar]
- 59. Guégan F., Jung J., Le Guennic B., Riobé F., Maury O., Gillon B., Jacquot J.-F., Guyot Y., Morell C., Luneau D., Inorg. Chem. Front. 2019, 6, 3152–3157. [Google Scholar]
- 60. Fan K., Bao S.-S., Huo R., Huang X.-D., Liu Y.-J., Yu Z.-W., Kurmoo M., Zheng L.-M., Inorg. Chem. Front. 2020, 7, 4580–4592. [Google Scholar]
- 61. Pointillart F., Le Guennic B., Golhen S., Cador O., Maury O., Ouahab L., Chem. Commun. 2013, 49, 615–617. [DOI] [PubMed] [Google Scholar]
- 62. Pointillart F., Cador O., Le Guennic B., Ouahab L., Coord. Chem. Rev. 2017, 346, 150–175. [Google Scholar]
- 63. Pointillart F., Le Guennic B., Cauchy T., Golhen S., Cador O., Maury O., Ouahab L., Inorg. Chem. 2013, 52, 5978–5990. [DOI] [PubMed] [Google Scholar]
- 64. Ning Y., Zhu M., Zhang J.-L., Coord. Chem. Rev. 2019, 399, 213028–213057. [Google Scholar]
- 65. Ning Y., Chen S., Chen H., Wang J.-X., He S., Liu Y.-W., Cheng Z., Zhang J.-L., Inorg. Chem. Front. 2019, 6, 1962–1967. [Google Scholar]
- 66. D′Aléo A., Bourdolle A., Brustlein S., Fauquier T., Grichine A., Duperray A., Baldeck P. L., Andraud C., Brasselet S., Maury O., Angew. Chem. Int. Ed. 2012, 51, 6622–6625; [DOI] [PubMed] [Google Scholar]; Angew. Chem. 2012, 124, 6726–6729. [Google Scholar]
- 67. Schulte T. R., Holstein J. J., Clever G. H., Angew. Chem. Int. Ed. 2019, 58, 5562–5566; [DOI] [PMC free article] [PubMed] [Google Scholar]; Angew. Chem. 2019, 131, 5618–5622. [Google Scholar]
- 68. Dhbaibi K., Abella L., Meunier-Della-Gatta S., Roisnel T., Vanthuyne N., Jamoussi B., Pieters G., Racine B., Quesnel E., Autschbach J., Crassous J., Favereau L., Chem. Sci. 2021, 12, 5522–5533. [DOI] [PMC free article] [PubMed] [Google Scholar]
- 69.Deposition numbers 2175844 (for P-2) and 2175845 (for M-2) contain the supplementary crystallographic data for this paper. These data are provided free of charge by the joint Cambridge Crystallographic Data Centre and Fachinformationszentrum Karlsruhe Access Structures service.
- 70. Kahn O., Molecular Magnetism VCH, Weinhem, 1993. [Google Scholar]
- 71. Jeletic M., Lin P.-H., Le Roy J. J., Korobkov I., Gorelsky S. I., Murugesu M., J. Am. Chem. Soc. 2011, 133, 19286–19289. [DOI] [PubMed] [Google Scholar]
- 72. Habib F., Lin P.-H., Long J., Korobkov I., Wernsdorfer W., Murugesu M., J. Am. Chem. Soc. 2011, 133, 8830–8833. [DOI] [PubMed] [Google Scholar]
- 73. Cole K. S., Cole R. H., J. Chem. Phys. 1941, 9, 341–351. [Google Scholar]
- 74. Flores Gonzalez J., Douib H., Le Guennic B., Pointillart F., Cador O., Inorg. Chem. 2021, 60, 540–544. [DOI] [PubMed] [Google Scholar]
- 75. Escalera-Moreno L., Suaud N., Gaita-Ariño A., Coronado E., J. Phys. Chem. Lett. 2017, 8, 1695–1700. [DOI] [PubMed] [Google Scholar]
- 76. Kragskow J. G. C., Marbey J., Buch C. D., Nehrkorn J., Ozerov M., Piligkos S., Hill S., Chilton N. F., Nat. Commun. 2022, 13, 825–834. [DOI] [PMC free article] [PubMed] [Google Scholar]
- 77. Pedersen K. S., Dreiser J., Weihe H., Sibille R., Johannesen H. V., Sørensen M. A., Nielsen B. E., Sigrist M., Mutka H., Rols S., Bendix J., Piligkos S., Inorg. Chem. 2015, 54, 7600–7606. [DOI] [PubMed] [Google Scholar]
- 78. Gendron F., B. Moore II , Cador O., Pointillart F., Autschbach J., Le Guennic B., J. Chem. Theory Comput. 2019, 15, 4140–4155. [DOI] [PubMed] [Google Scholar]
- 79. Mason W. R., A Practical Guide to Magnetic Circular Dichroism Spectroscopy, Wiley-Interscience, 2006. [Google Scholar]
- 80. Stephens P., J. Chem. Phys. 1970, 52, 3489–3516. [Google Scholar]
- 81. Wang X., Wang S.-Q., Chen J.-N., Jia J.-H., Wang C., Paillot K., Breslavetz I., Long L.-S., Zheng L., Rikken G. L. J. A., Train C., Kong X.-J., Atzori M., J. Am. Chem. Soc. 2022, 144, 8837–8847. [DOI] [PubMed] [Google Scholar]
Associated Data
This section collects any data citations, data availability statements, or supplementary materials included in this article.
Supplementary Materials
As a service to our authors and readers, this journal provides supporting information supplied by the authors. Such materials are peer reviewed and may be re‐organized for online delivery, but are not copy‐edited or typeset. Technical support issues arising from supporting information (other than missing files) should be addressed to the authors.
Supporting Information
Supporting Information
Data Availability Statement
The data that support the findings of this study are available in the supplementary material of this article.


