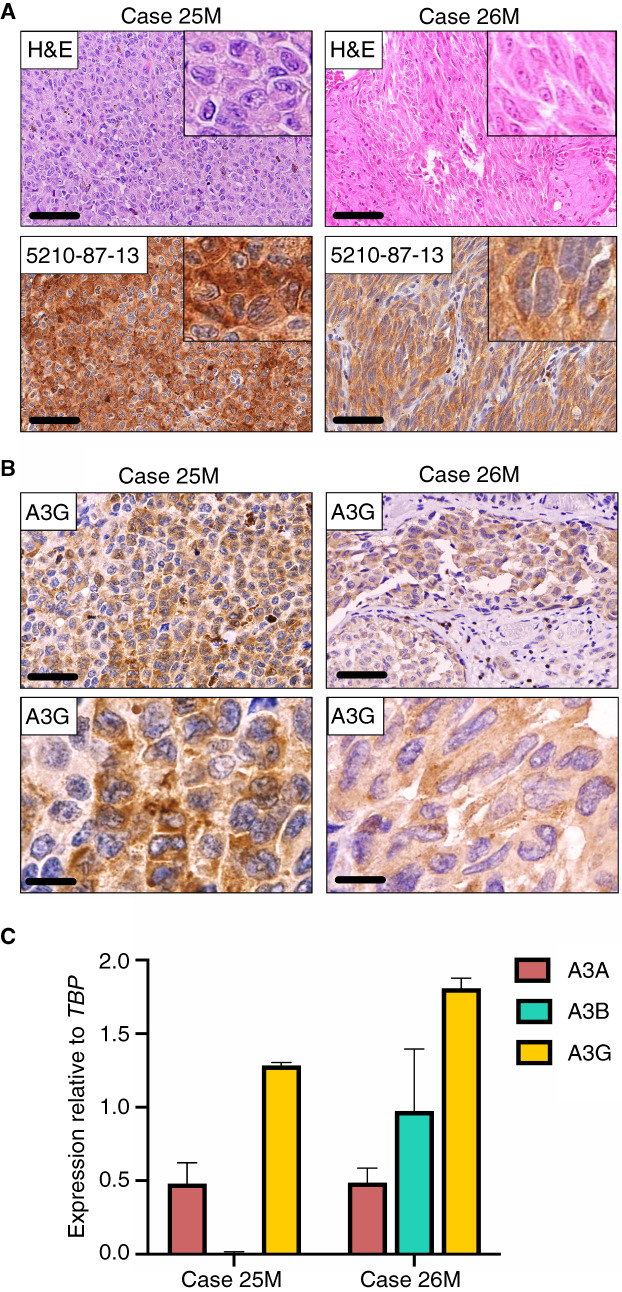
Figure 3.

Endogenous A3G expression in primary sinonasal MMs. (A) H&E‐stained and corresponding 5210‐87‐13 immunohistochemical photomicrographs of the two cases with pronounced cytoplasmic positivity. Scale bars are 60 μm and inset images are magnified 8‐fold. (B) Staining with a commercial A3G specific mAb corroborates the presence of cytoplasmic A3G in these two sinonasal MMs. Scale bars are 60 and 20 μm, respectively. (C) Quantitative RT‐PCR investigating mRNA levels of A3A, A3B, and A3G expression in these two cases. Experiments were performed in triplicate. The mean and SEM of at least three independent experiments is shown. [Color figure can be viewed at wileyonlinelibrary.com] [Color figure can be viewed at wileyonlinelibrary.com]
