

Abstract
Extracellular adenosine has been shown to play a key role in maintaining bone health and could potentially be used to treat bone loss. However, systemic administration of exogenous adenosine to treat bone disorders remains a challenge due to the ubiquitous presence of adenosine receptors in different organs and the short half-life of adenosine in circulation. Towards this, we have developed a bone-targeting nanocarrier and determined its potential for systemic administration of adenosine. The nanocarrier, synthesized via emulsion suspension photopolymerization, is comprised of hyaluronic acid (HA) copolymerized with phenylboronic acid (PBA), a moiety that can form reversible bonds with adenosine. The bone binding affinity of the nanocarrier was achieved by alendronate (Aln) conjugation. Nanocarriers functionalized with the alendronate (Aln-NC) showed a 45% higher accumulation in the mice vertebrae in vivo compared to those lacking alendronate molecules (NCs). Systemic administration of adenosine via bone-targeting nanocarriers (Aln-NC) showed attenuated bone loss in ovariectomized (OVX) mice. Furthermore, bone tissue of mice treated with adenosine-loaded Aln-NC displayed trabecular bone characteristics comparable to healthy controls as shown by microcomputed tomography, histochemical staining, bone labeling, and mechanical strength. Overall, our results demonstrate the use of a bone-targeting nanocarrier towards systemic administration of adenosine and its application in treating bone degenerative diseases such as osteoporosis.
Keywords: Adenosine, osteogenesis, nanocarrier, drug delivery, osteoporosis
1. Introduction
Osteoporosis, characterized by excessive bone loss, is a systemic disease affecting millions of people worldwide, particularly the elderly and post-menopausal women [1]. Patients with osteoporosis suffer from substantial loss in bone mass resulting in increased risk of bone fracture [1]. It is estimated that almost 200 million people suffer from osteoporosis and approximately 9 million bone fractures every year are reported to be associated with osteoporosis [2]. Currently available common drug therapies, such as bisphosphonate-based drugs, primarily slow down disease progression by delaying bone resorption [3, 4]. While slowing down bone resorption offers some solutions, therapeutic strategies involving anabolic agents to increase bone formation are much needed. A few anabolic therapeutics with minimal use, such as teriparatide [PTH (1-34)], abaloparatide [PTHrP (1-34)], and romosozumab are currently clinically available for high-risk patients [5–9].
The role of adenosine, a naturally occurring nucleoside, and its receptors in bone health and diseases are very well established [10–14]. Activation of A2A and A2B adenosine receptors has been shown to promote osteoblastogenesis and inhibit osteoclastogenesis [14, 15]. Recently, we showed decreased levels of extracellular adenosine in estrogen deficiency-mediated osteoporotic bone loss in OVX mice [14]. Together these studies suggest that augmentation of local extracellular adenosine could be a viable treatment for degenerative bone diseases [14, 16–19]. While harnessing adenosine signaling could be a potential therapeutic strategy to treat osteoporotic bone loss, systemic administration of adenosine as a treatment for osteoporosis is highly challenging due to the ubiquitous presence of adenosine receptors in the body and its short half-life (<10 s) in circulation [20, 21].
Towards this, we have examined the potential of using a bone-targeting nanocarrier for the systemic delivery of adenosine. The nanocarrier is composed of hyaluronic acid (HA) copolymerized with phenylboronic acid (PBA), a chemical moiety that can form a reversible boronate-adenosine complex, allowing loading and release of adenosine molecules [22, 23]. The bone binding affinity of the nanocarrier is achieved via the introduction of alendronate (Aln), a second generation bisphosphonate [24–27]. This study evaluated the efficacy of adenosine-loaded bone targeting nanocarriers to attenuate bone loss during estrogen deficiency-mediated osteoporosis in OVX mice.
2. Experimental Section
2.1. Materials.
Hyaluronic acid (molecular weight 40 kDa, HA40K-5) was purchased from Lifecore Biomedical (Chaska, MN). Methacrylic anhydride (276685), N-hydroxysuccinimide (NHS, 130672), sodium hydroxide (795429), adenosine (A4036), hexamethylenediamine (H11696) and mineral oil (M5904) were obtained from Millipore Sigma (St. Louis, MO). 1-Ethyl-3-(3-dimethylaminopropyl) carbodiimide hydrochloride (EDC, D1601) and 3-acrylamido phenylboronic acid (3-APBA) (A3199) were obtained from TCI Chemicals (Portland, OR). Alendronate (J61397) was purchased from Alfa Aesar (Tewksbury, MA). Cyanine 7.0 amine (550C0) was purchased from Lumiprobe (Hunt Valley, MD). Fluorescein isothiocyanate (FITC, Isomer I, 119250010) was purchased from Acros Organics (Waltham, MA). Dialysis bags (Molecular weight cut off, MWCO was 2.0 and 3.5 kDa) were obtained from Spectrum, New Brunswick, NJ. ABIL EM90 surfactant (420095-L-151) was obtained Universal Preserv-A Chem, Somerset, NJ. Hexane, acetone, ethanol, and dimethyl sulfoxide (DMSO) were purchased from Millipore-Sigma; the solvents were of ACS or spectroscopic grade. Genesys 10S UV-VIS spectrometer was used to record the UV-visible (UV-vis) spectra. Fourier-transform infrared (FTIR) spectra were recorded on Thermo Electron Nicolet 8700 FTIR spectrometer. Nuclear magnetic resonance (NMR) spectra were recorded in FFSC 400 MHz Agilent/Varian Inova spectrometer. FEI Tecnai G2 20 TWIN electron microscope was used to generate the transmission electron microscopy (TEM) images.
2.2. Synthesis of hyaluronic acid methacrylate (HA-MA).
Photopolymerizable methacrylate group was introduced into HA via esterification of the hydroxyl group upon reacting HA with methacrylic anhydride. Briefly, HA (600 mg) was dissolved in deionized (DI) water. Methacrylic anhydride (4.4 mL) was added to the HA solution and the pH of the reaction mixture was adjusted to 8-8.5 by adding 5 N NaOH. The reaction was continued for about 24 hrs at 4 °C. Excess of ice-cold ethanol-acetone mixture (1:1) was added to precipitate the product. The precipitate was filtered, washed several times with ice-cold ethanol-acetone mixture. Next, the polymer was dissolved in DI water and dialyzed for 4 days (using 3.5 kDa membrane) against DI water. The solution was freeze dried to obtain the methacrylated HA. The polymer was characterized by using a combination of FTIR and 1HNMR spectroscopy. FTIR spectra of the modified HA showed the presence of peaks corresponding to ester C=O and methacrylate C=C stretching frequencies at 1720 cm−1 and 1610 cm−1 respectively, confirming successful methacrylation. The degree of methacrylation, determined via 1HNMR spectroscopy, was found to be 30±2% per dimeric repeating unit.
2.3. Synthesis of alendronate-conjugated HA-MA (HA-MA-Aln).
HA-MA was modified with the bone targeting agent alendronate (Aln) via amide coupling reaction between the carboxylic acid group of HA-MA and the amine group of Aln. Briefly, HA-MA (400 mg) was dissolved in MES buffer of pH 5.5 to yield a concentration of 10 mg/mL. EDC (175 mg) and NHS (105 mg) were gradually added to HA-MA solution at 15 min intervals. After 30 min, Aln (74.2 mg) was added to the reaction mixture. The reaction was continued for about 12 h at room temperature. The mixture was then dialyzed by using a 3.5 kDa membrane against DI water for 4 days and the resulting purified solution was lyophilized to obtain alendronate conjugated HA-MA (HA-MA-Aln). The polymer was characterized by using FTIR and 1HNMR spectroscopy. The degree of Aln conjugation, determined via 1HNMR spectroscopy, was found to be ~15±1% with respect to the dimeric repeating unit of HA.
2.4. Synthesis of Cy7 dye conjugated HA-MA or HA-MA-Aln (HA-MA-Cy7 or HA-MA-Aln-Cy7).
To prepare the fluorescently labelled polymers, HA-MA or HA-MA-Aln were conjugated with a fluorescent dye, Cyanine 7 amine (Cy7), via amide coupling reaction between the free carboxylic acid groups of HA-MA or HA-MA-Aln and the amine group of Cy7. Briefly, HA-MA or HA-MA-Aln (100 mg) was dissolved in a mixture of 1:1 DI water: DMSO to create a concentration of 5 mg/mL. EDC (69 mg) and NHS (41.4 mg) were added to the polymer solution at 15 min intervals. After 30 min, Cy7 (5-6 mg), dissolved in 5 mL DMSO was added to the reaction mixture, and the reaction was continued for about 48 h at room temperature. The mixture was dialyzed (3.5 kDa membrane) against 1: 0.1 mixture of DI water: DMSO for 1 day followed by DI water for 4-5 days. The solution was lyophilized to obtain the dye-conjugated polymer. The polymer was characterized via a combination a UV-visible, FTIR and 1HNMR spectroscopy. The successful conjugation of the dye to the polymer backbone was confirmed by UV-visible spectroscopy as the spectra showed typical Cy7 absorption at ~750 nm. The dye content was determined via 1HNMR spectroscopy and was found to be ~3-4% (with respect to the dimeric repeating unit of HA) as indicated by the presence of aromatic protons (at 7.1-7.3 ppm) from Cy7.
2.5. Nanocarrier synthesis and purification.
The nanocarrier was prepared via inverse emulsion photopolymerization. Briefly, HA-MA (50 mg), HA-MA-Aln (55 mg), HA-MA-Cy7 (52.5 mg), or HA-MA-Aln-Cy7 (57.5 mg) or HA-MA-Aln-FITC (57.5 mg) were dissolved in DI water (550 μL). 3-Acrylamido phenylboronic acid (3-APBA) (95.5 mg) was dissolved in ethanol (400 μL). Both the solutions were then mixed together. Subsequently, 50 μL of the photoinitiator LAP (2% w/v in DI water) was added to the polymer-PBA mixture. The final solution was emulsified in a continuous phase consisting of mineral oil (10 mL) containing 10% w/v ABIL EM 90 surfactant through ultrasonication (probe sonicator, 15-18 kW output) for 90 sec at 4 °C. The nanodroplets were crosslinked via UV irradiation for 10 min under constant stirring at 300 rpm. To remove the continuous phase, the emulsion was diluted (1:10) with a chilled mixture of 1:1 acetone: hexane. The nanocarriers were pelleted down by centrifugation (10000 rpm, 10 min) and the supernatant was discarded. The pellet was washed multiple times with the 1:1 acetone: hexane mixture. Next, the nanocarriers were dispersed in 1:1 water: ethanol mixture, dialyzed against water, freeze dried and stored at −20 °C until use. The fluorophore-tagged nanocarriers were prepared by using the dye conjugated polymers (HA-MA-Cy7 or HA-MA-Aln-Cy7 or HA-MA-Aln-FITC) following the same protocol. The nanocarriers contained approximately 1.8-2.2 nmol of Cy7 and 1.6-1.7 nmol of FITC per milligram of the carrier as determined by the UV-visible absorption spectroscopy. A standard calibration curve for Cy7 or FITC at ~750 nm or 520 nm vs concentration (1.00-31.25 μg/mL) was prepared and used to determine the dye content in the polymers.
2.6. Characterization of the nanocarriers.
The nanocarriers were characterized via a combination of UV-Visible, FTIR, 1HNMR spectroscopy and transmission electron microscopy (TEM). A fixed amount of the freeze-dried nanocarrier was suspended in 1:1 water-ethanol mixture. Absorbance was measured by using a UV-visible spectrophotometer (200-800 nm). A standard calibration curve for 3-APBA at ~255 nm vs concentration (7.8-125 μg/mL) was made and used to determine the PBA content in the nanocarriers. Freeze-dried nanocarriers (5-10 mg) were suspended in 600 μL D2O followed by the addition of 10-20 μL of 5N NaOH in D2O, and 1HNMR spectra were recorded by using a 500 MHz Varian spectrometer. The Cy7 content in the nanocarriers was determined via UV-visible spectroscopy using a standard calibration curve for Cy7 at ~750 nm vs concentration (1.00-31.25 μg/mL). To image the nanocarriers by transmission electron microscopy (TEM), 1-2 mg of the freeze-dried nanocarriers was suspended into 1:5 water-ethanol mixture. Nanocarrier suspension (2 μL) was then cast onto the 300 mesh holy carbon grid, dried overnight at 50-60 °C, and imaged by using the Tecnai 200 kV electron microscope at an operating voltage of 80 kV. The particle size was estimated by using Image J software. A minimum of three images taken at three different places of the TEM grid were analyzed. The average hydrodynamic diameter of the nanocarriers was further characterized by dynamic light scattering (DLS, Wyatt Technology DynaPro PlateReader). The nanocarriers were suspended in phosphate buffer (pH of 7.4) or α-MEM containing 10% FBS at a concentration of 100 μg/mL and sonicated. For each sample, 40 μL of the nanocarrier suspension was transferred to a black costar 96-well plate with clear bottom for measurements. The measurements were done at 25 °C and each individual acquisition being the average intensity of ten different measurements. The surface charge of the nanocarriers was determined by measuring the zeta potential of the particles using a Zetasizer Nano Zs (Malvern Instrument, UK). The nanocarriers were dispersed in ultrapure deionized water at a concentration of 25 μg/mL and filtered with a 0.45 μm syringe filter. For each sample, 1 mL of the filtered solution was transferred into a cuvette and the zeta potential was measured as an average of 100 runs and each measurement was repeated 4 times using a folded capillary zeta cell 1070. Smoluchowski equation was used to calculate the zeta potential. The stability of the Aln-NC was assessed by weight loss measurements and hydrodynamic diameter changes following 21 days of incubation in phosphate buffer (pH 7.4) and α-MEM containing 10% FBS. To this, ~10 mg of Aln-NC was suspended in various media to achieve a concentration of 2 mg/mL. The suspensions were incubated at 37 °C using an orbital shaker at 200 rpm. After 21 days, the nanocarrier suspension was dialyzed using 3.4 kDa membrane against water. The suspensions were freeze dried and the dry weight of the nanocarriers was recorded. Growth media without nanocarrier was similarly dialyzed, freeze dried and the weight was recorded. The weight loss was estimated by subtracting the final weight from the initial weight. The stability of the nanocarriers was also determined by examining the changes in the hydrodynamic diameter of the carriers. The nanocarrier suspensions after the incubation were diluted in the respective medium and the particle size was measured using the DLS as described above.
2.7. Adenosine loading and release.
The freeze-dried nanocarriers were soaked overnight in 7 mg/mL adenosine solution in PBS at pH ~8.5. The nanocarriers were then concentrated either via centrifugation at 25000 rcf for 20 min or by using amicon centrifugation filter unit with MWCO of 100 kDa at 5700 rcf, 30 min, washed with water, and freeze-dried. The amount of loaded adenosine was determined by suspending the nanocarriers in acetate buffer of pH 4.5 at 10 mg/mL. The suspension (1 mL) was then transferred into a dialysis bag of MWCO 2 kDa. The bags were sealed and transferred into 15-mL falcon tubes each containing 9 mL acetate buffer. After 24 h of incubation at 37 °C, absorbance of the acetate buffer was recorded via UV-vis absorption spectrophotometer. A standard calibration curve of adenosine (3.9-125 μg/mL) in acetate buffer was prepared and used to estimate the adenosine concentration. In order to determine the release kinetics, the adenosine-loaded nanocarriers were suspended in 10% FBS containing alpha-MEM media or phosphate buffer of pH 6.0, 6.8 and 7.4 to yield a concentration of ~5 mg/mL. Approximately 1 mL of the suspension was transferred into a dialysis bag with a MWCO of 2 kDa. The bag was placed in a 15 mL falcon tube containing 9 mL of media supplemented with 10% FBS/phosphate buffer of pH 6.0, 6.8 and 7.4, and incubated at 37 °C. At predetermined time intervals, 2 mL of the media was removed from the falcon tube and supplemented with 2 mL fresh media. The adenosine content in the media was measured by using UV-visible spectrophotometer at 260 nm wavelength. A standard calibration curve of adenosine (3.9-125 μg/mL) was prepared in alpha-MEM medium or in the phosphate buffer (pH 6.0, 6.8 and 7.4), and was used to estimate the adenosine content.
2.8. Isolation of cells and in vivo studies
All animal studies were performed with the approval of Institutional Animal Care and Use Committee (IACUC) (A195-17-08) at Duke University and in accordance with the guidelines of the National Institutes of Health (NIH). Three-month-old female C57BL/6J mice (Jackson Laboratory, Bar Harbor, ME) were used for cell isolation.
2.9. MSC isolation and culture.
Mouse mesenchymal stromal cells (mMSCs) were isolated as previously described with modifications [28]. Briefly, the femur, tibia, and vertebra of mice were harvested, crushed with pestle and mortar in harvest buffer [2%v/v fetal bovine serum (FBS) in phosphate-buffered solution (PBS)] to release BM tissue, filtered through a 40-μm cell strainer, and centrifuged at 200 g. Cells were seeded at 1 million cells/cm2 in growth media (GM) containing α-minimum essential medium (α-MEM), fetal bovine serum (FBS) (10%, v/v), penicillin/streptomycin (10000 U/mL; 1%, v/v) in humidified incubator (37°C, 5% CO2). Media were replaced after 3 days and further cultured for 6 days before passage. For the first passage, cells were detached with a cell scraper, and sub-cultured. All experiments were performed after 1 passage.
2.10. Mononuclear cell (MNC) isolation and culture.
Specifically, the cells were supplemented with adenosine (60 μg/mL) in growth media with change of media every day. MNCs were isolated as previously described [14]. Briefly, the femur, tibia, humerus, radius, ulna, and vertebra were harvested and crushed with pestle and mortar in harvest buffer [FBS (2% v/v) in PBS] to release BM tissue. BM was passed through a 70-μm cell strainer and centrifuged at 200 g for 5 min. Cells were resuspended in harvest buffer, gently layered onto Ficoll-Paque PLUS (GE Healthcare, Marlborough, MA) at 1:1 ratio, and centrifuged without rotor acceleration and deceleration at 200 g for 15 min. The opaque middle layer with cells was collected and centrifuged at 200 g for 5 min. MNCs were seeded in macrophage induction media containing growth media, prostaglandin E2 (PGE2; 10−7 M; Santa Cruz Biotechnology, Dallas, TX), and Macrophage-Colony Stimulating Factor M-CSF (10 ng/mL; PeproTech, Rocky Hill, NJ) at 100000 cells/cm2. For osteoclast differentiation, macrophages cultured for 3 days were further induced in osteoclast induction media containing growth media, PGE2 (10−7 M), M-CSF (10 ng/mL), and RANKL (10 ng/mL; PeproTech).
2.11. Cellular uptake of nanocarriers.
Primary MSCs were pre-differentiated to osteoblasts for 14 days and primary MNCs were pre-differentiated into macrophages and osteoclasts for 6 days and 10 days, respectively. Adenosine-loaded FITC-labeled nanocarriers (NC and Aln-NC) solutions were suspended in growth medium (MEM with 10% v/v FBS) at 200 μg/mL, 600 μg/mL and 1 mg/mL. The nano-suspensions (500 μL) were then added to cells and incubated in a humidified incubator at 5% CO2 atmosphere and 37 °C. After 24 h of incubation, the cells were rinsed with PBS, fixed with 4% paraformaldehyde (PFA) for 15 min, incubated with mounting solution containing DAPI (ThermoFisher P36971; ThermoFisher Scientific, Waltham, MA), and sealed with coverslip. Images were acquired using a Keyence BZ-X700 microscope. Each condition was performed in triplicate.
2.12. Live dead assay.
Primary MSCs were pre-differentiated to osteoblasts for 14 days and primary MNCs were pre-differentiated into macrophages and osteoclasts for 6 days and 10 days respectively in chamber slides. Adenosine-loaded nanocarrier (NC and Aln-NC) solutions were suspended in growth medium (MEM with 10% v/v FBS) at 200 μg/mL, 600 μg/mL and 1 mg/mL. The nano-suspensions (500 μL) were then added to each chamber and chamber slides were incubated in a humidified incubator at 5% CO2 atmosphere and 37 °C. After 72 h of incubation, the cells were rinsed with PBS, a mixture of calcein AM (1 μM; ThermoFisher C3100MP) and propidium iodide (1.5 μM; ThermoFisher P3566) dissolved in growth media was then added to the chamber slides. The slides were incubated in a humidified incubator at 5% CO2 atmosphere for about 15 min. The media containing the dyes were then removed and fresh growth media without any dyes were added to the chambers. Images were then acquired using a Keyence BZ-X700 microscope. Each condition was performed in triplicate.
2.13. In vitro differentiation of MSCs.
To determine whether adenosine released from the nanocarriers can support osteogenic differentiation similar to medium supplemented with free adenosine, mouse bone marrow derived MSCs were cultured in medium supplemented with adenosine released from the Aln-NCs. The nanocarriers (adenosine loaded Aln-NC) were suspended in α-MEM medium at a concentration of 15 mg/mL. One mL of the suspension was transferred into a dialysis bag (MW cut off 12-14 kDa) and placed in a 15 mL sterile falcon tube containing 9 mL of α-MEM. The media within the falcon tube (i.e., outside the dialysis bag) were collected every 2 days and mixed with 2X culture medium at a 1:1 ratio. The culture medium was prepared by supplementing growth medium with 2 mM monobasic sodium phosphate and 2 mM dibasic sodium phosphate; the phosphate was used to promote in vitro mineralization upon differentiation. A similar experiment was also performed with Aln-NCs devoid of adenosine. The cells were seeded into a 24 well plate and cultured for 14 days either in culture medium, culture medium supplemented with medium from Aln-NC loaded with or without adenosine, culture medium supplemented with free adenosine (60 μg/mL), or osteogenic medium (OM). Osteogenic medium (OM) was prepared by supplementing GM with 10 mM β-glycerophosphate, 50 μM ascorbic acid-2-phosphate, and 100 nM dexamethasone. The media was changed at every 2 days interval. After 14 days of culture, the cells were analyzed for osteogenic differentiation by reverse transcriptase quantitative polymerase chain reaction (RT-qPCR) and mineralization by alizarin red S staining. For RT-qPCR, total RNA was extracted with TRIzol (Thermo Fisher Scientific), phase-separated with chloroform, and precipitated using isopropanol. One microgram of RNA was reverse-transcribed using iScript cDNA Synthesis Kit (Bio-Rad), according to the manufacturer’s instructions [29]. Semi-quantitative PCR was performed with iTaq Universal SYBR green reagent (Bio-Rad) with initial denaturation at 95°C for 30 s for one cycle, and 95°C for 5 s and 60°C for 30 s for 40 cycles on a polymerase chain reaction (PCR) cycler (Bio-Rad). The mouse primer sequences are: OSX (forward, TGCCTGACTCCTTGGGACC; reverse, TAGTGAGCTTCTTCCTCAAGCA), OPN (forward, AAACCAGCCAAGGTAAGCCT; reverse, TCAGTCACTTTCACCGGGAG), and 18S ribosomal RNA (forward, ACCAGAGCGAAAGCATTTGCCA; reverse, ATCGCCAGTCGGCATCGTTTAT). The expression level of each target gene was normalized to the housekeeping gene (18s) and expressed as 2−ΔΔCt values. The expression levels were normalized to the control (culture medium) and presented as fold change. Alizarin red S staining and quantification were performed as previously described with slight modifications [30]. Briefly, cells were fixed using 4% PFA for 10 min at room temp, rinsed with distilled water, and stained with 2% alizarin red S solution of pH 4.2 (Sigma-Aldrich) for 15 min at room temp. The stained wells were rinsed vigorously with distilled water and imaged. To quantify the extent of mineralization, 250 μL of 0.5 M HCl was added to each well for 10 min at room temp with gentle shaking. The solution was transferred to a centrifuge tube, heated at 85 °C for 10 min., and centrifuged at 15000 g for 15 min. ~;150 μL of the supernatant was transferred to a 96-well plate and the absorbance was measured at 405 nm with a spectrophotometer.
2.14. In vitro bone binding affinity.
The ability of the nanocarriers to bind to bone tissue was assessed in vitro by using bone (femur) chips collected from 8-12 weeks old female C57BL/6J mice (Jackson Laboratory). The bone marrow from the femur was flushed out and the bone was cut into small pieces of ~3-4 mm. A fixed amount of the Cy7-conjugated nanocarriers was suspended in α-MEM media containing 10% FBS to yield a concentration of 1 mg/mL. The bone chips were incubated with the nanocarrier at 37 °C under constant shaking at 150 rpm for about 2 h. The chips were removed and washed with PBS to remove the unbound nanocarriers. The fluorescence intensity was recorded using an in vivo imaging system (IVIS Kinetics) with 750 nm excitation wavelength and 780 nm emission wavelength. The normalized radiant efficiency was divided by the surface area of the bone chip, and the results were expressed as radiant efficiency/mm2.
2.15. In vivo biodistribution.
Athymic nude mice (NU(NCr)-Foxn1nu, 8 weeks old) from Charles River Laboratory were used for the experiment. The mice were divided into two groups (n = 5 for each group). The dye containing nanocarriers with or without bone targeting alendronate was suspended in saline. 100 μL of the suspension, which approximates to a dye concentration of ~2.1 nM, was injected intravenously (i.v.) via the tail vein with a single dose. At designated times after i.v. injection, mice were anesthetized using isoflurane inhalation and whole-body images were acquired using an in vivo imaging system (IVIS). Some of the animals were euthanized at 72 h post injection and major organs/tissues such as vertebra, femur, tibia, heart, lungs, liver, spleen, kidneys, brain, and muscle were harvested. The wet weight of organs was recorded and imaged using IVIS. Fluorescence intensity after background-subtraction was normalized to organ weight and the amount of fluorophore conjugated nanocarriers present in each organ was estimated from the fluorescence intensity. Data analysis was carried out by using Living Image software, and the results were expressed as radiant efficiency/g of the organs. To examine the distribution of the nanocarriers within the bone tissue, lumbar vertebrae (L4 segment) and the femur (proximal) were excised, cleaned of excess soft tissues, and placed in 4% PFA overnight at 4 °C. Following overnight fixation, undecalcified tissues were incubated in 30% sucrose, then embedded in cryomatrix (ThermoFisher) and cryosections (10 μm) were prepared using CryoJane tape transfer system using a Leica cryotome. Sections were stained with Hoechst 33342 for nuclei. Fluorescence images were then taken with a Zeiss Axio Observer Z1 microscope. Representative images of sections showing both cortical and trabecular regions in the vertebral column and proximal femur for both nanocarriers with and without Aln were taken. To detect Cy7, the sections were imaged using a 710/75 band pass excitation filter and 810/90 nm band pass emission filter and are shown in pseudo red color. Hoechst 33342 were imaged at 365 nm excitation wavelength and 445/50 nm band pass emission filter. Cy7 signals were quantified using ImageJ from 3 biological replicates. The extent of Cy 7 signals on bone surface was expressed as percent area positive which is the ratio of area positive to the total area of the bone surface measured. To quantify the Cy7 signals in the bone marrow, a binary image was created from the red channel and set at a threshold of 58. Any signal detected above the threshold was used to calculate the percent of area with positive signals over the total area.
2.16. In vivo administration of nanocarrier.
Ovariectomized (OVX) female C57BL/6J mice (12 weeks old; Jackson Laboratory) were used. Animal grouping and treatment included: mice with no OVX surgery, i.e., healthy mice (control, CTL), mice with OVX surgery (O), OVX mice treated with Aln-NC without adenosine (OH), OVX mice treated with adenosine containing Aln-NC (OHA). Administration of nanocarriers by tail vein injection was started 4 weeks after OVX surgery, and the treatment was continued twice a week for 8 weeks. Mice were treated with ~90 mg/kg body weight of Aln-NC and ~120 mg/kg body weight adenosine containing Aln-NC. The adenosine dosage was ~30 mg/kg body weight of mice.
2.17. Bone labeling.
Animals were administered with calcein (Millipore-Sigma) at a concentration of 10 mg/kg body weight at 14 days prior to sacrifice and alizarin-3-methyliminodiacetic acid (30 mg/kg body weight; Millipore-Sigma) 9 days post-administration of calcein. Collected femur were fixed in 4% PFA at 4 °C for 1 d and stored in 70% ethanol. The undecalcified samples were incubated in 30% sucrose for 24 h, embedded in cryomatrix, cryo-sectioned with CryoJane Tape transfer, and imaged for bone labeling. Bone formation rate (BFR) and mineral apposition rate (MAR) were calculated from parameters measured from images using ImageJ software. BFR = MAR × (MS/BS). MAR = (irL.Wi)/time interval; distance between the double fluorescent labels (interlabel width, irL.Wi), divided by the time interval. Mineralizing surface (MS/BS) = 100*(dL.Pm+ (0.5×sL.Pm))/B.Pm; perimeter of double labeled bone (dL.Pm) plus perimeter of one half of the singly labeled bone (0.5×sL.Pm) as a fraction (%) of the total bone perimeter (B.Pm).
2.18. Microcomputed tomography.
Vertebrae (L3-L5) and femur were collected, fixed in 4% paraformaldehyde (PFA) at 4 °C for 1 day, and rinsed thoroughly with PBS. The fixed samples were placed in 50-mL centrifuge tubes with styrofoam spacers and loaded into a microcomputed tomography (μ-CT) scanner (vivaCT 80, Scanco Medical, Wayne, PA). The samples were scanned at 55 keV at a pixel resolution of 10.4 μm. The reconstruction of the images was performed using μ-CT Evaluation Program V6.6 (Scanco Medical), followed by generation of radiographs and 3D models using μ-CT Ray V4.0 (Scanco Medical). Bone mineral density of the tissue was quantified and presented as a percentage of bone volume (BV) per total volume (TV) (%BV/TV) using the phantom as a reference based on 100 contiguous slices. Trabecular number (Tb.N), trabecular spacing (Tb. Sp), connectivity density (Conn. D), trabecular thickness (Tb. Th) were quantified by CTAn software.
2.19. Mechanical measurement.
Tibiae were used to measure the mechanical properties. After removing the soft tissues, tibia samples were wrapped in wet tissue and frozen at −20 °C. Sixteen hours prior to the measurement, the samples were placed at 4°C, and then in room temperature an hour before the measurement. Four-point bending mode of Electroforce 3220 (TA Instruments, New Castle, DE) instrument with 225 N load cell was used for the test. Samples were aligned on the fixtures, and the load was applied perpendicular to the principal axis of the tibia. The span length of the bottom support was 9.2 mm while the top span length was 2.8 mm. The bending test was performed in displacement control mode at a loading rate of 0.025 mm/sec. Load-displacement data were recorded at a data acquisition rate of 10Hz. Displacement was tared at the first data point at which the load equaled or exceeded 1N. Maximum load is the highest load (N) before the sample fractures. Bending stiffness (N/mm) was calculated as the slope of load vs. displacement between 30-70% of maximum load to failure in the linear region.
2.20. Histological staining.
Vertebral samples were fixed with 4% PFA at 4°C for 1 day and decalcified using 10% ethylenediaminetetracetic acid (EDTA, pH 7.3) for 2 weeks at 4 °C. The samples were gradually dehydrated using increasing concentrations of ethanol and incubated in Citrisolv (Decon Laboratories, King of Prussia, PA) until equilibrium was reached. Following dehydration, samples were immersed in a mixture of 50 % (v/v) Citrisolv and 50% (w/w) paraffin (General Data Healthcare, Cinicinnati, OH) for 30 min. at 70°C. The samples were embedded in paraffin and 7-μM thick sections were generated by using a rotary microtome (Leica RM2255; Leica Microsystems, Buffalo Grove, IL). Before staining, the sections were deparaffinized using CitriSolv and subsequently rehydrated with decreasing concentration of ethanol until the samples were equilibrated with DI water. Tartrate-resistant acid phosphatase (TRAP) staining was performed by incubating rehydrated sections in an acetate buffer (0.2 M) containing sodium L-tartrate dibasic dihydrate (50 mM) at pH 5 for 20 min at room temp followed by incubating with naphthol AS-MX phosphate disodium salt (Millipore-Sigma, N5000-1G; 0.5 mg/mL) and Fast Red TR Salt 1,5-naphthalenedisulfonate (Millipore-Sigma, F6760-5G; 1.1 mg/mL) dissolved in the same buffer for 1.5 h at 37°C in dark. Sections were mounted using permount mounting medium (ThermoFisher) and imaged using a Keyence BZ-X700 microscope.
2.21. Statistical Analyses.
All numerical values are expressed as means ± standard deviation. Data was subjected to either one-way analysis of variance (ANOVA) with post hoc Tukey-Kramer test for multiple comparisons or two-tailed Student’s t-test. P-Value of less than 0.05 was considered statistically significant and indicated with an asterisk. All statistical analyses were performed with GraphPad Prism 8.1.1.
3. Results
3.1. Synthesis and characterization of nanocarriers.
HA was chemically modified to introduce photopolymerizable methacrylate (MA) and bone-targeting Aln groups (Scheme S1, Supporting Information). Fourier-transform infrared (FTIR) spectroscopy and proton nuclear magnetic resonance (1HNMR) spectroscopy were used to characterize the modified HA (Figure S1–S3, Supporting Information). As estimated from the NMR spectra, ~30±2% degrees of methacrylation and ~15±1% degrees of Aln conjugation per dimeric repeating unit of HA were achieved. The modified-HAs (HA-MA or HA-MA-Aln) were then copolymerized with 3-(acrylamido)phenylboronic acid (3-APBA) via emulsion suspension polymerization to synthesize the nanocarriers (Fig. 1a–d) [31, 32]. The details about the synthesis and characterization of the modified-HA polymers (HA-MA and HA-MA-Aln) are provided in the experimental section and Supporting Information (Scheme S1 and Figure S1–S3, SI Text).
Fig. 1.
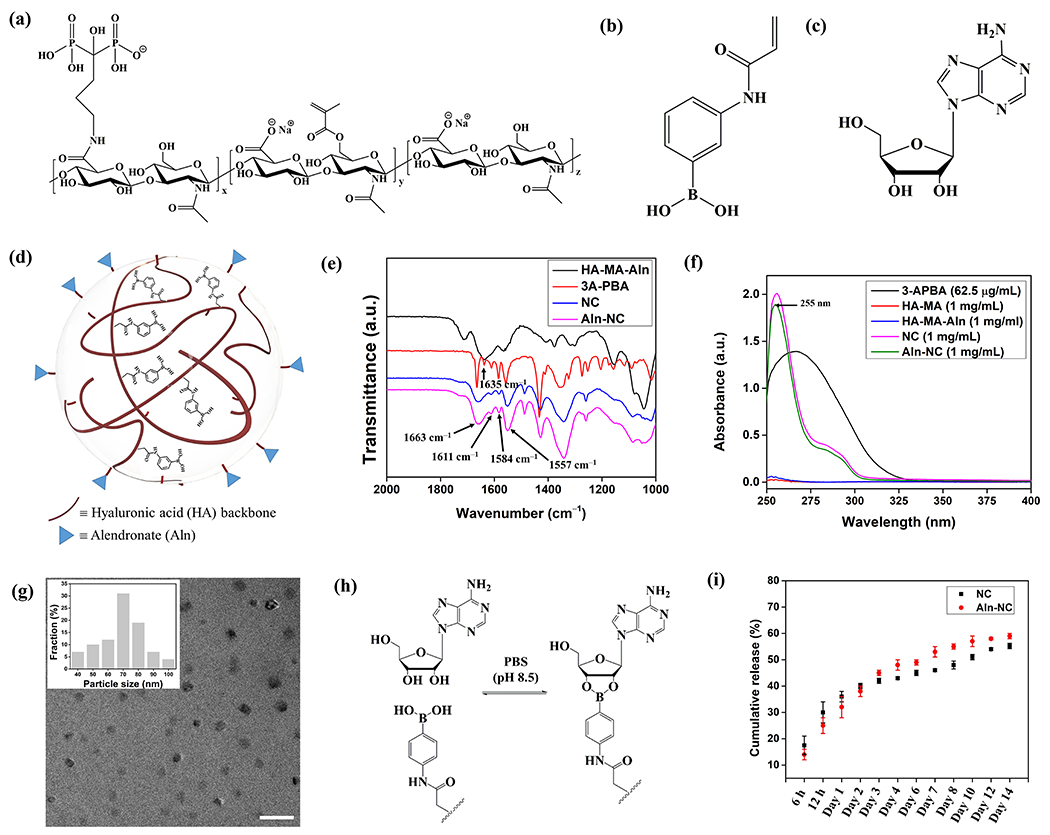
Synthesis, characterization, and adenosine loading/release profile of the nanocarriers. (a) Structure of the nanocarrier precursor polymer HA-MA-Aln. Chemical structure of (b) 3-APBA and (c) adenosine. (d) Schematic representation of alendronate conjugated nanocarrier (Aln-NC). (e) FTIR spectra of the NC and Aln-NC. (f) UV-visible absorbance spectra of the NC and Aln-NC. (g) Transmission electron microscope (TEM) images of the nanocarriers; size distribution profile of the nanocarriers is shown in the inset. Scale bar 200 nm. (h) Reaction scheme showing the reversible adenosine binding with PBA. (i) Cumulative release kinetics of adenosine from the nanocarriers in media containing 10% FBS.
Two types of nanocarriers (nanocarriers with and without Aln; hereafter named as Aln-NC and NC, respectively) were synthesized for their ability to load adenosine and target bone tissue. The nanocarriers were characterized via a combination of FTIR spectroscopy, 1HNMR spectroscopy, ultraviolet-visible (UV-vis) absorption spectroscopy and transmission electron microscopy (TEM). FTIR spectra of the nanocarriers showed absorptions at 1558-1610 cm−1 and 1352 cm−1 which are characteristics of C=C stretching frequencies of the benzene ring and O–B–O bending of PBA, respectively, indicating successful incorporation of PBA moieties into the nanocarriers (Fig. 1e). The 1HNMR spectra of the nanocarriers exhibited diminished methacrylate peaks (at 5.5-6.1 ppm) and displayed new peaks corresponding to aromatic protons (at 7.1-7.3 ppm), further confirming the conjugation of PBA to the modified-HA (Figure S4, Supporting Information). In addition, the peaks at 1.6-1.9 ppm corresponding to methylene protons of Aln confirmed the presence of Aln groups in the Aln-NC (Figure S4, Supporting Information). The extent of PBA incorporation in the nanocarriers, determined from the UV-vis spectra, was found to be ~90±2% (with respect to the amount of 3-APBA used for copolymerization with the modified HA) (Fig. 1f). Nanocarriers labelled with fluorescent dyes such as cyanine 7 (Cy7) or fluorescein isothiocyanate (FITC) were also synthesized and characterized (Scheme S2 and Figures S1, S5–S9, SI Text). TEM images of the Aln-NC nanocarriers showed spherical particles with diameters between 50 and 100 nm (Fig. 1g). The average hydrodynamic diameter of the nanocarriers in phosphate buffer, determined via DLS, was found to be 100±30 nm and 150±29 nm for NC and Aln-NC, respectively. The hydrodynamic diameter of NC and Aln-NC changed to 265±52 nm and 309±86 nm, respectively, in media containing 10% FBS mostly due to the presence of serum proteins (Figure S10a, Supporting Information) [33, 34]. The surface charge of the nanocarriers, determined via zetasizer, revealed a net negative charge of −24.5±0.6 mV for NC and −26.2±1.8 mV for Aln-NC owing to the presence of negatively charged hyaluronic acid and phosphate moiety of alendronate in the nanocarriers (Figure S10d, Supporting Information). The stability of the nanocarrier (Aln-NC) was studied by examining their weight loss in phosphate buffer (pH 7.4) or α-MEM supplemented with 10% fetal bovine serum (FBS) at 21 days post-incubation, which showed no significant weight loss (Figure S10b, Supporting Information). The stability of the Aln-NC in both buffer and media was further confirmed by determining the average hydrodynamic diameter of the nanocarrier using DLS, which showed a slight increase in particle size (199±39 nm in phosphate buffer and 365±131 nm media respectively) (Figure S10c, Supporting Information).
3.2. Adenosine loading, release, and bioactivity.
The adenosine molecules were loaded by incubating the nanocarriers in excess adenosine solution in PBS (pH ~8.5) for about 12 h (Fig. 1h). The nanocarriers had a loading efficiency (the amount of PBA moieties involved in adenosine binding) of ~56% for Aln-NC and ~54% for NC with a loading capacity (weight percentage of adenosine in the nanocarrier) of ~31±1% for both the nanocarriers. Time-dependent analyses (2-24 h) showed that increasing the incubation time beyond 12 h did not have a significant effect on adenosine loading (Table S1, Supporting Information). The release profile of loaded adenosine (ADO) from the nanocarriers (both Aln-NC and NC) was examined in alpha-MEM medium containing 10% FBS. Following the initial rapid release, a slow release of the ADO was observed until day 12. The ADO release was found to be almost plateaued thereafter (Fig. 1i). The presence of the Aln functional group had no significant effect on the adenosine release (Fig. 1i). Approximately 55-59% encapsulated ADO was shown to be released from both Aln-NC and NC by 14 days (Fig. 1i). The release kinetics were further examined with ADO-loaded Aln-NC at different pHs by using phosphate buffers of pHs 6.0, 6.8, and 7.4. Though the release profile was similar in all conditions, a slightly higher adenosine release was observed in slightly acidic pH (6.0 or 6.8) compared to pH 7.4 (Figure S11, Supporting Information). The bioactivity of adenosine released from the nanocarriers was examined for its ability to promote osteogenic differentiation of mMSCs, which showed an upregulation of osterix and osteopontin similar to those exposed to medium supplemented with free adenosine and osteogenic medium (Figure S12a,b, Supporting Information). Concomitant with the gene expression pattern, mMSCs cultured in medium supplemented with adenosine released from the Aln-NC showed significant mineralization at 14 days of culture (Figure S12c, Supporting Information). Quantification of the mineral content corroborated the observations (Figure S12d, Supporting Information).
3.3. In vitro cellular uptake of nanocarriers and cell viability.
Interaction of the nanocarriers with the cells was determined by exposing adenosine-loaded nanocarriers labelled with fluorescein isothiocyanate (FITC) to different cell populations in vitro–osteoblasts derived from primary mMSCs, or macrophages and osteoclasts derived from primary MNCs. The extent of nanocarrier uptake by the cells was found to be dependent on the cell type and the amount of nanocarriers present in culture (Figure S13–S15, Supporting Information). Among the cell types used, macrophages showed the highest uptake of both the nanocarriers (Aln-NC and NC). The NCs, especially at higher concentrations, exhibited aggregation in medium containing serum and modification of NCs with Aln groups attenuated the aggregation significantly (Figure S13–S15, Supporting Information). Live/dead analyses of the cells following their exposure to both NC and Aln-NC for 3 days showed minimal cell death at all concentrations tested (200 μg/mL, 600 μg/mL and 1 mg/mL) (Figure S16–S17, Supporting Information).
3.4. Bone targeting efficacy and biodistribution of nanocarriers.
The ability of the nanocarriers to bind to bone tissue in vitro and in vivo was examined by using the Cy7-conjugated nanocarriers. The in vitro bone binding ability was assessed by incubating mouse bone chips with Cy7-conjugated and adenosine-loaded NC and Aln-NC for 2 h. The fluorescence intensity measurement showed significantly higher binding in bone chips incubated with Aln-NC compared to NC (Fig. 2a). In vivo distribution of the nanocarriers was examined by tracking the Cy7-labeled NCs and Aln-NCs by imaging with in vivo imaging system (IVIS) following tail vein injection into nude mice. IVIS imaging showed fluorescence signal distributed throughout the body for both the nanocarriers (Fig. 2b and Figure S18, Supporting Information). Time-dependent imaging of the dorsal view showed the presence of Aln-NC in the vertebrae 6 h post-injection (Figure S18, Supporting Information). No such significant localization of nanocarrier to the vertebrae was noticed for the NCs without Aln moieties at 6 h post-injection. A continuing increase in signal for Aln-NC was observed in the vertebrae up to 72 h post-injection (Fig. 2b and Figure S18, Supporting Information). The Aln-NC signal was found to decrease by day 4 and minimal-to-no signal was observed at day 14 (Figure S19, Supporting Information). The images of the ventral view showed optical signal from internal organs such as the liver and was observed for both the NCs and Aln-NCs, similar to prior studies [35]. The ventral view images also showed that Aln conjugation of the nanocarrier decreases its accumulation in the liver (Fig. 2b and Figure S18, Supporting Information).
Fig. 2.
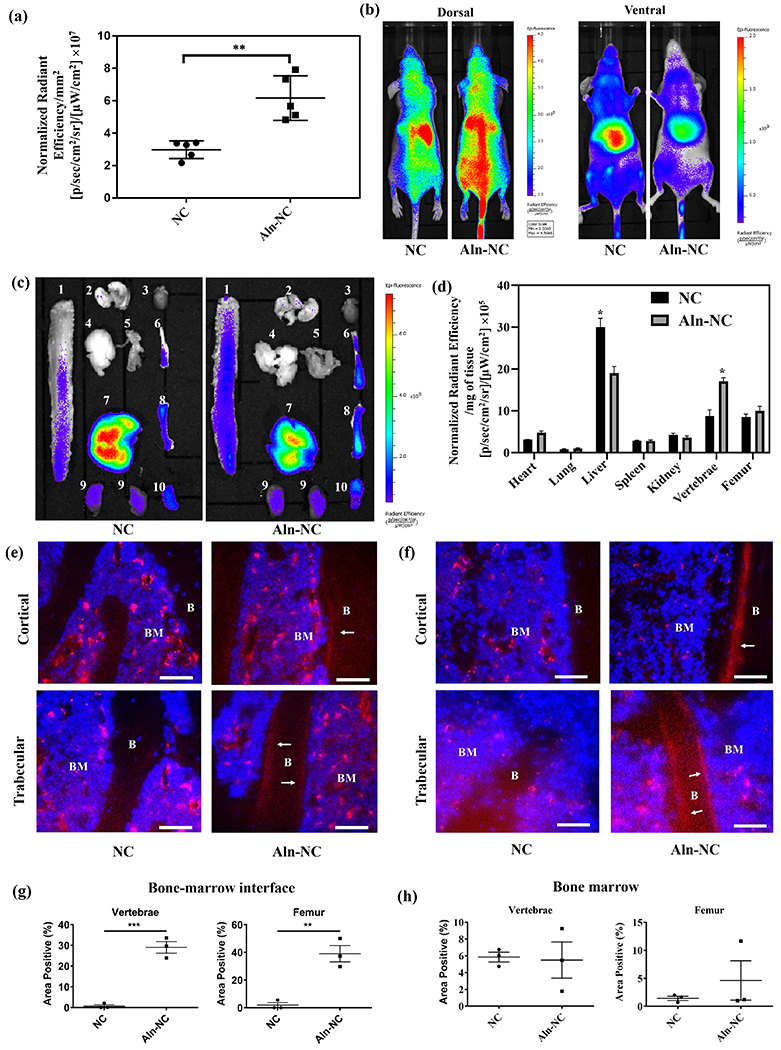
Biodistribution of the nanocarriers. (a) Binding affinity of alendronate-functionalized and adenosine-conjugated nanocarrier (Aln-NC) and non-functionalized NC (NC) to femur bone chips: radiant efficiency was expressed by unit surface area of the bone chips (b-h) Characterization of the host at 72 h after systemic administration of the nanocarriers in nude mice through tail vein injection; (b) In vivo fluorescence of NC and Aln-NC from the dorsal and ventral view; (c) Fluorescence image of the organs for NC and Aln-NC: 1- vertebrae, 2- lungs, 3- heart, 4- brain, 5- muscle, 6- tibia, 7- liver, 8- femur, 9- kidney, 10- spleen; (d) Radiant efficiency in organs ex vivo represented per gram of the tissue. Cryosections of (e) L4 vertebral segment and (f) proximal femoral bone tissue shown after treatment with either Cy7-conjugated NC or Aln-NC; ‘BM’ indicates bone marrow and ‘B’ indicates bone; Scale bar for 50 μm. White arrows indicate Cy7-conjugated Aln-NC bound to bone. (g and h) Quantification of the nanocarrier signal at the bone-to-marrow interface and bone marrow of vertebrae and femur, respectively. The fluorescence intensity was quantified by using ImageJ software and expressed as % area positive at the bone-to-marrow interface and in bone marrow. *p<0.05, **p<0.01.
The distribution of the nanocarriers within various organs was further evaluated by imaging the liver, kidney, spleen, heart, lungs, vertebrae, femur, tibia, brain, pancreas, muscle, and skin following organ harvest at 72 h post-injection. Fluorescence imaging suggested accumulation of both the nanocarriers within these organs (Fig. 2c and Figure S20, Supporting Information). Between the Aln-NC and NC groups, Aln-NC showed significantly higher (~45%) accumulation within the vertebrae (Fig. 2d). However, no significant difference was observed between the nanocarriers in their localization within the femur (Fig. 2d and Figure S20, Supporting Information). Concomitant with the increase in the vertebrae, alendronate conjugation decreased nanocarrier accumulation within the liver (by ~37%) and kidney (by ~11%) compared to those lacking Aln groups (Fig. 2d).
The localization and distribution of the nanocarriers within the bone tissue was further examined by visualizing 10-μm tissue sections of lumbar vertebrae and proximal femur, which showed key differences (Fig. 2e,f). Both NC and Aln-NC were found throughout the bone marrow. However, vertebral and femoral sections showed localization of the Aln-NC at the marrow-to-bone interface, as well as within the bone marrow. In contrast, the NCs lacked such a localization and were present only in the bone marrow (Fig. 2e,f). Quantification of the images showed significantly higher fluorescence for Aln-NC compared to NC at the bone-marrow interface for both the vertebrae and femur (Figure 2g). However, no significant differences in the signal was observed between Aln-NC and NC within the bone marrow (Figure 2h).
3.5. Adenosine-loaded bone-targeting nanocarriers prevent bone loss in ovariectomized mice.
In view of the bone-targeting ability of Aln-NC and the ability of adenosine to promote osteoblastogenesis and inhibit osteoclastogenesis, we used a mouse model of ovariectomy (OVX)-induced bone loss to evaluate the potential of using adenosine-loaded nanocarriers to treat bone degeneration. Four different groups— control healthy group (CTL), OVX without any treatment (O), OVX treated with Aln-NC (OH), and OVX treated with Aln-NC containing adenosine (OHA), were studied. Four weeks following OVX surgery, the nanocarriers were administered through tail vain twice a week, and bone tissues were characterized after 8 weeks of treatment. Care was taken to ensure that the mice received similar amounts (mg/kg of the body) of nanocarrier and Aln for OH and OHA groups. The dose of adenosine for the OHA group was ~30 mg/kg of body weight. Micro-computed tomography (μ-CT) was used to quantify the trabecular bone in the vertebrae (Fig. 3a). Quantification of the μ-CT images showed a significant reduction in bone mineral density (BMD), bone volume ratio (BV/TV), trabecular number (Tb.N), trabecular thickness (Tb.Th), and connectivity density (Conn.D) with more trabecular spacing (Tb.Sp) for the OVX group (O) compared to the healthy group (CTL) (Fig. 3b–g). OVX mice treated with Aln-NC containing adenosine (OHA) showed significantly higher BMD, BV/TV, Tb.N, Tb.Th, Conn.D, and less Tb. Sp compared to the OVX treated with Aln-NC (OH) (Fig. 3b–g). Furthermore, these trabecular bone parameters (BMD, BV/TV, Tb.N, Tb. Sp, Tb.Th, and Conn.D) were found to be similar to that of the healthy control (Fig. 3b–g). In contrast, OVX mice treated with Aln-NC (OH) showed trabecular bone morphology (BMD, BV/TV, Tb.N, Tb. Sp, Tb.Th, and Conn. D) similar to that of the OVX mice (O) (Fig. 3b–g). Similar trends were observed for the distal femur (Fig. 4). Specifically, the adenosine-treated group showed higher BMD, BV/TV, Conn.D, Tb.N, Tb.Th, and lower Tb.Sp compared to the OVX and Aln-NC groups (Fig. 4b–g). Histochemical staining for TRAP was used to detect the changes in osteoclast activity in the lumbar vertebrae and distal femur. Cohorts treated with Aln-NC containing adenosine (OHA), showed lower levels of TRAP activity compared to the OVX (O) group and Aln-NC-treated group (OH) (Fig. 3i and Fig. 4i for vertebrae and femur, respectively).
Fig. 3.
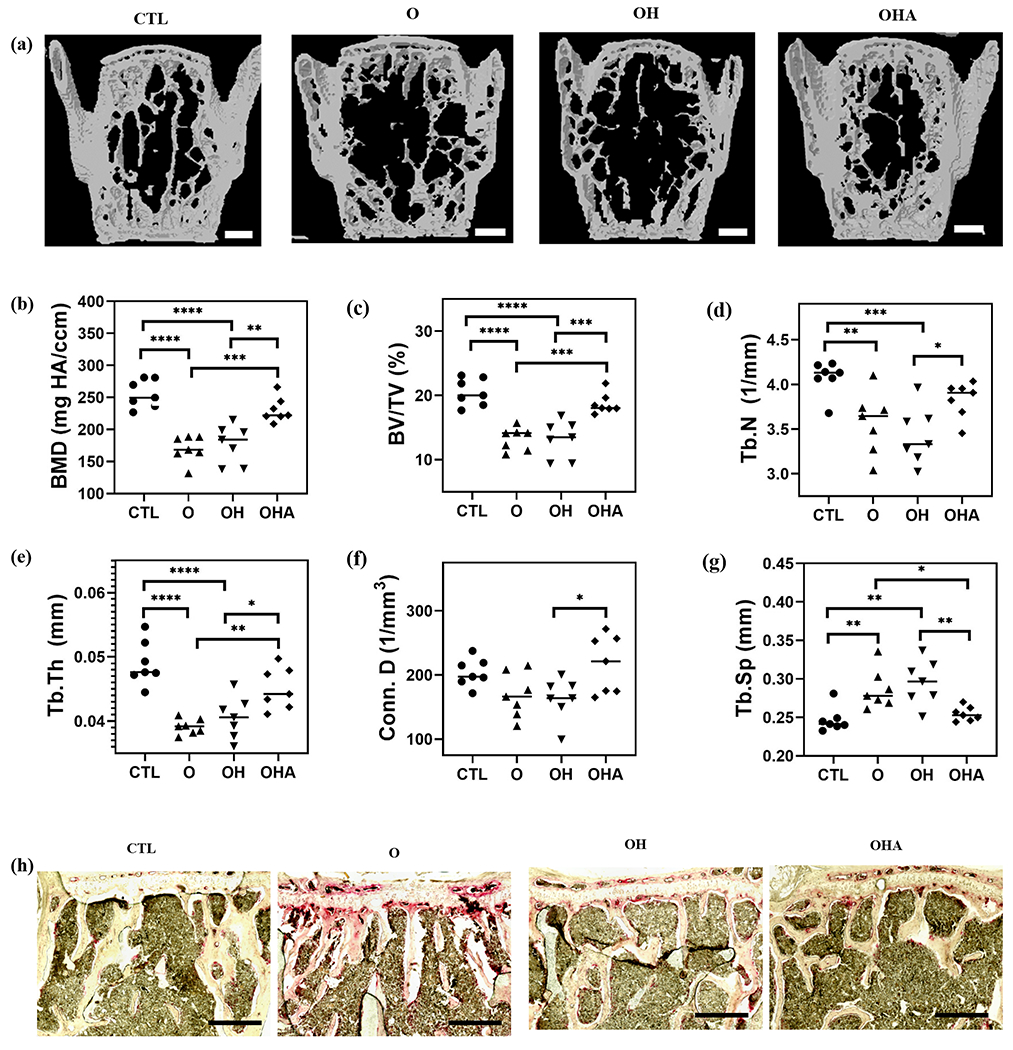
Adenosine-encapsulated nanocarriers attenuate vertebral bone loss in ovariectomized mice. Administration of Aln-NC containing adenosine (OHA) and Aln-NC without adenosine (OH) in OVX mice for 8 weeks. Groups were compared to healthy control with no surgery and no treatment (CTL) and OVX mice with no treatment (O). (a) Reconstructed μ-CT images of vertebrae (Scale bars: 500 μm). Quantification of μ-CT images: (b) bone mineral density (BMD); (c) bone volume (BV/TV); (d) trabecular number (Tb.N); (e) trabecular thickness (Tb. Th); (f) connectivity density (Conn. D); (g) trabecular spacing (Tb. Sp). (h) Tartrate-resistant acid phosphatase (TRAP; red) staining of the vertebrae (scale bars: 50 μm). *p<0.05, **p<0.01, ***p<0.001.
Fig. 4.
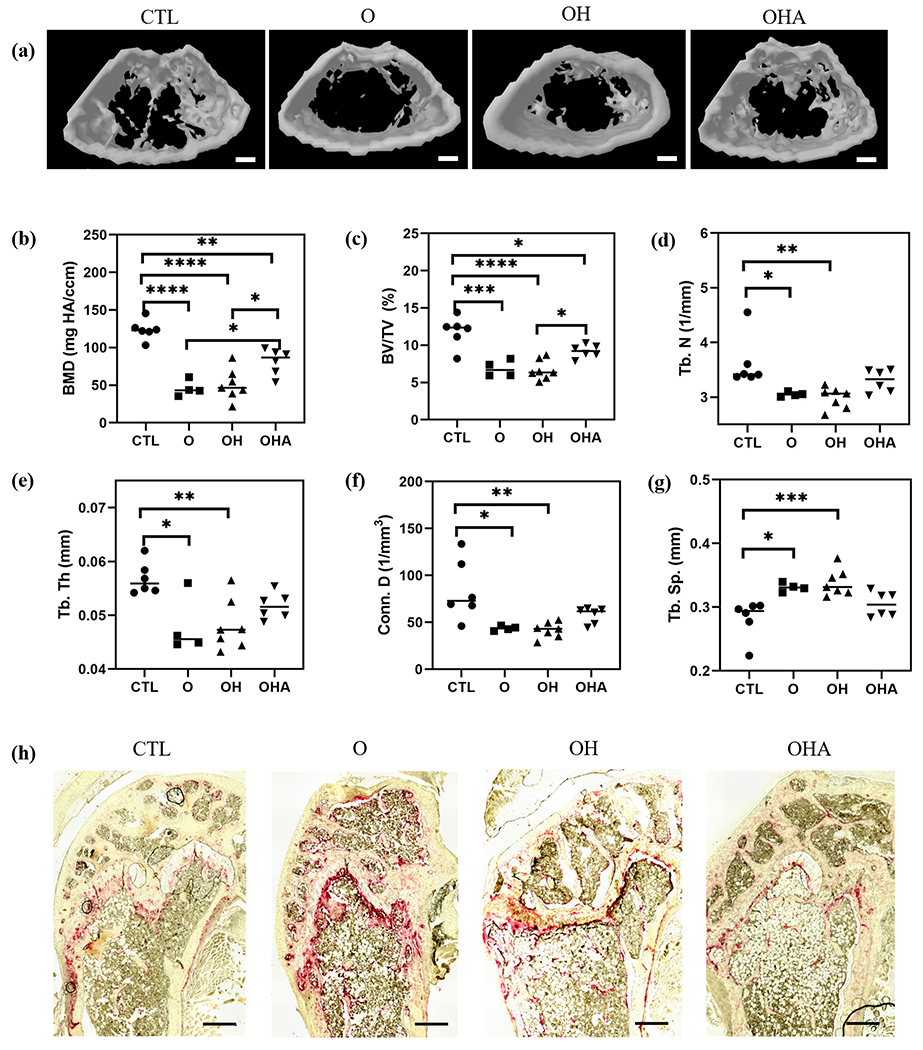
Adenosine-encapsulated nanocarriers attenuate femoral bone loss in OVX mice. Administration of Aln-NC containing adenosine (OHA) and Aln-NC without adenosine (OH) in OVX mice for 8 weeks. (a) Reconstructed microcomputed tomography (μCT) images of distal femur (Scale bar: 500 μm). Quantification of μCT images: (b) bone mineral density (BMD); (c) bone volume (BV/TV); (d) trabecular number (Tb.N); (e) trabecular spacing (Tb. Sp); (f) connectivity density (Conn. D) (g) trabecular thickness (Tb. Th). (h) Tartrate-resistant acid phosphatase (TRAP; red) staining of the distal femur (Scale bars: 50 μm). *p<0.05, **p<0.01, ***p<0.001.
New bone formation was assessed by double fluorescence labeling of mineral deposition with calcein, a green fluorescent dye, and alizarin, a red fluorescent dye, which were systemically administered over a 9-day interval (Fig. 5a). Unlike healthy cohorts and cohorts treated with adenosine, no detectable separation between the dyes was observed for the OVX (O) group and those treated with Aln-NC without adenosine (OH) (Fig. 5a). Histomorphometric analyses were used to quantify various parameters relevant to bone tissue formation such as bone formation rate (BFR, μm3/μm2/day) and mineral appositional rate (MAR; μm/day) (Fig. 5b,c). The BFR and MAR of OVX mice treated with Aln-NC containing adenosine (OHA) was significantly higher compared to those treated with Aln-NC without adenosine (OH) (Fig. 5b,c). Also, no significant difference in BFR and MAR was observed between the adenosine-treated group (OHA) and the healthy controls (CTL) (Fig. 5b,c). These findings were further corroborated through mechanical measurements of the bone tissue. Specifically, tibiae of mice treated with Aln-NC containing adenosine (OHA) showed improved maximum load and stiffness compared to OVX mice without any treatment (O) and mice treated with Aln-NC without adenosine (OH) (Fig. 6a,b).
Fig. 5.
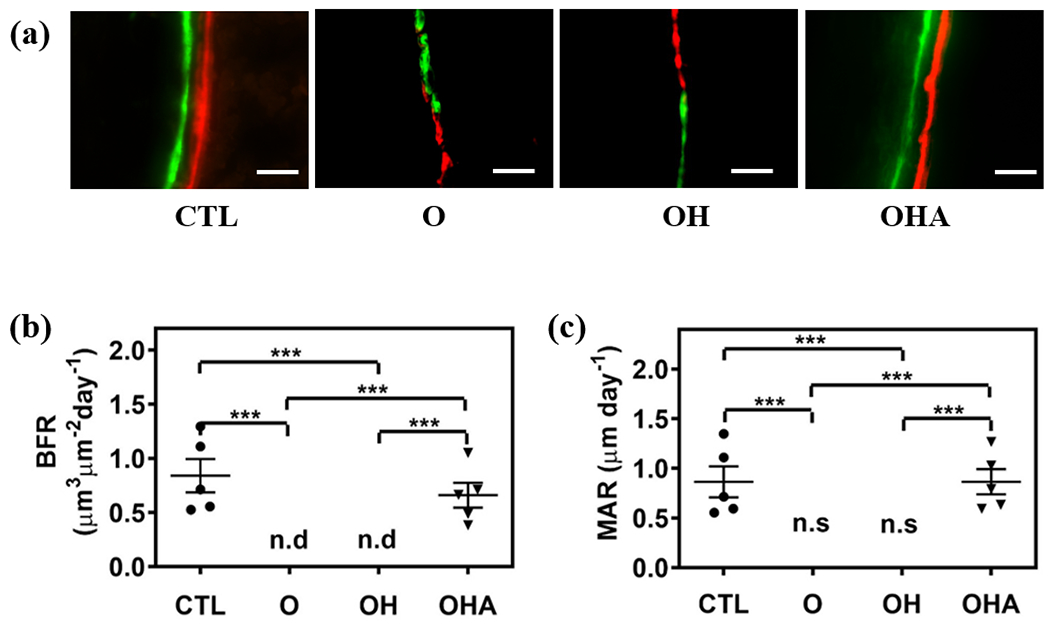
Adenosine-encapsulated nanocarrier promotes bone formation in ovariectomized mice. Administration of Aln-NC containing adenosine (OHA) and carrier Aln-NC alone (OH) for 8 weeks in OVX mice. Groups are compared to healthy control (CTL) and ovariectomized animals (O). (a) Double fluorescence bone labeling by calcein (green) and alizarin complexone of femur (red; Scale bars: 200 μm). (b) Quantification of bone formation rate (BFR/BS) from bone labeling images. n.d: non-detectable. (c) Quantification of mineral apposition rate (MAR) from bone labeling images. n.s: no separation. *p<0.05, **p<0.01, ***p<0.001.
Fig. 6.
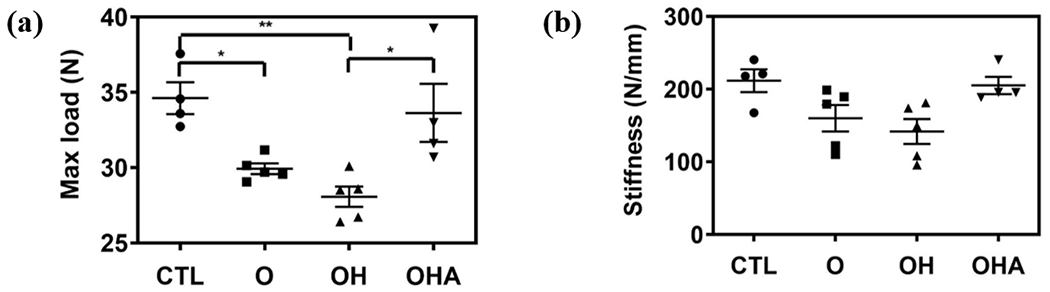
Mechanical measurements of tibiae following 8 weeks of treatment (a) maximum load and (b) stiffness *p<0.05, **p<0.01. CTL: healthy control with no surgery and no treatment. O: ovariectomized animals with no treatment. OH: ovariectomized animals treated with Aln-NC. OHA: ovariectomized animals treated with Aln-NC containing adenosine.
4. Discussion
This study examines the therapeutic efficacy of adenosine to treat bone loss by developing a bone targeting nanocarrier for systemic administration of adenosine while mitigating its short half-life and off-target effects. Targeted delivery of therapeutics to tissues using nanocarriers has been shown to improve the bioavailability of the drugs while minimizing their off-target effects [36–39]. In addition, nanocarriers with their large surface area-to-volume ratio offer high drug-loading capacity, improved drug stability, and are promising drug delivery systems [40–44]. In fact, encapsulation of adenosine within nanocarriers, such as liposomes, has been used to increase the longevity of adenosine in systemic administration [45, 46]. While the use of exogenous adenosine to treat ischemic injuries has been actively explored, the systemic delivery of adenosine to treat skeletal disorders such as osteoporosis has not been explored.
Herein, a hyaluronic acid nanocarrier system modified with functional groups to assist adenosine loading (via PBA molecules) and bone tissue binding (via Aln molecules) was used for systemic delivery of adenosine. In a prior study, we have used the ability of PBA molecules to bind reversibly to cis-diol groups of adenosine to promote its sequesteration in vivo [23]. Harnessing the ability of Aln molecules to bind to bone apatite is an effective approach to target biomolecules to bone tissue [47, 48]. The high content of hydroxyapatite in the bone tissue provides a unique target for bone binding. Bisphosphonate molecules such as Aln, structural analogs to the endogenous pyrophosphate, are known to chelate the calcium ions in the hydroxyapatite of bone extracellular matrix [47, 48]. As evident from the in vitro studies, functionalization of the nanocarriers with Aln improved their bone binding ability. Aln functionalization did not have any significant effect on adenosine loading into or release from the nanocarrier. Moreover, Aln functionalization prevented aggregation of the nanocarriers in medium containing serum, which could increase dispersion stability and increase biocompatibility [49, 50].
Biodistribution of the nanocarriers, by IVIS imaging, showed that both non-functionalized and Aln-functionalized nanocarriers accumulated in the bone tissue (vertebrae, femur, tibia). While the nanocarriers were found in multiple organs, such as liver, kidney and spleen, functionalization of nanocarriers with the Aln group significantly improved its ability to accumulate within the bone tissue. The presence of the nanocarriers at the bone-to-marrow interface was only observed for Aln-NC, further suggesting that the Aln groups play an important role in controlling the localization of the nanocarriers. This finding could also explain why vertebrae had more accumulation of Aln-NC than non-targeted NC, but no such differences were observed in the case of the femur. Due to their cancellous nature, vertebrae have greater bone surface area which facilitates binding of the Aln-NC to the bone surface. Lack of a significant difference in the signal between Aln-NC and NC in femur could be attributed to the relatively large volume of femoral marrow along with its low surface area of the bone-to-marrow interface [35].
The systemic administration of adenosine by using Aln-NC significantly improved bone mineral density (BMD), bone volume, and other trabecular bone parameters, such as connectivity density and trabecular spacing, compared to the untreated OVX group and those treated with Aln-NC devoid of adenosine. Together, these results suggest that the observed beneficial effect of the systemic administration of the nanocarrier is solely due to adenosine. Despite the therapeutic use of Aln drugs for osteoporosis, its presence in the nanocarriers did not contribute to prevention of bone loss. This could be due to the low amount of Aln present in the Aln-NCs, which only provides 2.4-2.8 mg Aln/kg of mice; the therapeutic regimen involving Aln drugs commonly uses a dose of ~35 mg/kg of mice [51, 52].
Osteoporotic bone loss is characterized by compromised osteoblast activity and excessive osteoclast activity. We and others have shown that exogenous adenosine promotes osteoblastogenesis while decreasing osteoclastogenesis [14–17]. Previously, we also showed that exogenous adenosine-mediated osteoblastogeneis and osteoclastogenesis involves A2BR signaling [14]. The dual ability of adenosine molecule to promote osteoblastogenesis and inhibit osteoclastogenesis explains why adenosine treatment of OVX mice resulted in significantly improved bone mass, trabecular features, and mechanical properties comparable to the healthy control. Limitations to this study, such as non-targeted accumulation of the nanocarriers in other organs and tissues, could be addressed in the future. For example, substantial accumulation of the nanocarriers was observed in organs such as the liver; although, no obvious damage to these organs or to the well-being of the animals was observed after two months of administration. Particle size and shape are parameters that can affect the pharmacokinetics and targeting ability of the nanocarriers that should be considered in the future design [53–55].
5. Conclusion
In summary, a bone targeting nanocarrier was developed for systemic administration of adenosine. The nanocarrier, composed of hyaluronic acid encoded with phenylboronic acid, was synthesized via emulsion suspension polymerization. The loading and release of adenosine was achieved by harnessing the ability of boronate molecules to form dynamic boronate ester with cis-diol molecules such as adenosine. The ability of alendronate groups to bind to hydroxyapatite was used to promote its localization within the bone tissue. Systemic administration of alendronate-functionalized, adenosine-loaded nanocarriers effectively prevented bone loss in osteoporotic mice. Furthermore, adenosine treatment via the bone targeting nanocarrier promoted new bone formation and improved bone mechanical strength. Together, the results suggest that systemic administration of exogenous adenosine via a bone targeting nanocarrier could be a potential therapeutic strategy to treat osteoporosis and promote bone health.
Supplementary Material
Acknowledgements
The authors acknowledge the financial support from National Institute of Arthritis and Musculoskeletal and Skin Diseases of the National Institutes of Health under Award Number NIH R01 AR071552. The authors would like to thank Gavin Gonzales for assistance with dynamic light scattering and zeta potential measurements. The authors would also like to thank Anna Gilpin for her constructive comments on the manuscript.
Footnotes
CRediT author statement
Jiaul Hoque: Conceptualization, Methodology, Investigation, Formal analysis, Writing-original draft, Visualization. Yu-Ru V. Shih: Conceptualization, Methodology, Investigation, Formal analysis, Visualization. Yuze Zeng: Methodology, Formal analysis. Hunter Newman: Methodology, Formal analysis. Nivedita Sanganj: Methodology, Formal analysis. Neha Arjunji: Methodology. Shyni Varghese: Conceptualization, Methodology, Investigation, Formal analysis, Writing, Supervision, Project administration, Funding acquisition.
Declaration of competing interest
The authors declare no financial conflicts of interest.
Supporting Information
Supporting Information is available to this article.
Data availability
All data associated with this study are present in the paper or the Supplementary Data. The raw data required to reproduce these findings will be available upon request.
References
- [1].Eastell R, O’Neill TW, Hofbauer LC, Langdahl B, Reid IR, Gold DT, Cummings SR, Postmenopausal osteoporosis, Nat Rev Dis Primers 2 (2016) 16069. [DOI] [PubMed] [Google Scholar]
- [2].Sozen T, Ozisik L, Basaran NC, An overview and management of osteoporosis, Eur J Rheumatol 4(1) (2017) 46–56. [DOI] [PMC free article] [PubMed] [Google Scholar]
- [3].Khosla S, Bilezikian JP, Dempster DW, Lewiecki EM, Miller PD, Neer RM, Recker RR, Shane E, Shoback D, Potts JT, Benefits and risks of bisphosphonate therapy for osteoporosis, J Clin Endocrinol Metab 97(7) (2012) 2272–82. [DOI] [PubMed] [Google Scholar]
- [4].Villa JC, Gianakos A, Lane JM, Bisphosphonate Treatment in Osteoporosis: Optimal Duration of Therapy and the Incorporation of a Drug Holiday, HSS J 12(1) (2016) 66–73. [DOI] [PMC free article] [PubMed] [Google Scholar]
- [5].Haas AV, LeBoff MS, Osteoanabolic Agents for Osteoporosis, J Endocr Soc 2(8) (2018) 922–932. [DOI] [PMC free article] [PubMed] [Google Scholar]
- [6].Cosman F, The evolving role of anabolic therapy in the treatment of osteoporosis, Curr Opin Rheumatol 31(4) (2019) 376–380. [DOI] [PubMed] [Google Scholar]
- [7].Solling ASK, Harslof T, Langdahl B, The clinical potential of romosozumab for the prevention of fractures in postmenopausal women with osteoporosis, Ther Adv Musculoskelet Dis 10(5-6) (2018) 105–115. [DOI] [PMC free article] [PubMed] [Google Scholar]
- [8].Lindsay R, Krege JH, Marin F, Jin L, Stepan JJ, Teriparatide for osteoporosis: importance of the full course, Osteoporos Int 27(8) (2016) 2395–410. [DOI] [PMC free article] [PubMed] [Google Scholar]
- [9].Merlotti D, Falchetti A, Chiodini I, Gennari L, Efficacy and safety of abaloparatide for the treatment of post-menopausal osteoporosis, Expert Opin Pharmacother 20(7) (2019) 805–811. [DOI] [PubMed] [Google Scholar]
- [10].Carroll SH, Wigner NA, Kulkarni N, Johnston-Cox H, Gerstenfeld LC, Ravid K, A2B adenosine receptor promotes mesenchymal stem cell differentiation to osteoblasts and bone formation in vivo, The Journal of biological chemistry 287(19) (2012) 15718–27. [DOI] [PMC free article] [PubMed] [Google Scholar]
- [11].Kara FM, Doty SB, Boskey A, Goldring S, Zaidi M, Fredholm BB, Cronstein BN, Adenosine A(1) receptors regulate bone resorption in mice: adenosine A(1) receptor blockade or deletion increases bone density and prevents ovariectomy-induced bone loss in adenosine A(1) receptor-knockout mice, Arthritis Rheum 62(2) (2010) 534–41. [DOI] [PMC free article] [PubMed] [Google Scholar]
- [12].Katebi M, Soleimani M, Cronstein BN, Adenosine A2A receptors play an active role in mouse bone marrow-derived mesenchymal stem cell development, J Leukoc Biol 85(3) (2009) 438–44. [DOI] [PMC free article] [PubMed] [Google Scholar]
- [13].Gharibi B, Abraham AA, Ham J, Evans BA, Adenosine receptor subtype expression and activation influence the differentiation of mesenchymal stem cells to osteoblasts and adipocytes, J Bone Miner Res 26(9) (2011) 2112–24. [DOI] [PubMed] [Google Scholar]
- [14].Shih YV, Liu M, Kwon SK, Iida M, Gong Y, Sangaj N, Varghese S, Dysregulation of ectonucleotidase-mediated extracellular adenosine during postmenopausal bone loss, Sci Adv 5(8) (2019)eaax1387. [DOI] [PMC free article] [PubMed] [Google Scholar]
- [15].Mediero A, Cronstein BN, Adenosine and bone metabolism, Trends Endocrinol Metab 24(6) (2013) 290–300. [DOI] [PMC free article] [PubMed] [Google Scholar]
- [16].Kang H, Shih YR, Nakasaki M, Kabra H, Varghese S, Small molecule-driven direct conversion of human pluripotent stem cells into functional osteoblasts, Sci Adv 2(8) (2016) e1600691. [DOI] [PMC free article] [PubMed] [Google Scholar]
- [17].Mediero A, Kara FM, Wilder T, Cronstein BN, Adenosine A(2A) receptor ligation inhibits osteoclast formation, Am J Pathol 180(2) (2012) 775–86. [DOI] [PMC free article] [PubMed] [Google Scholar]
- [18].Mediero A, Wilder T, Reddy VS, Cheng Q, Tovar N, Coelho PG, Witek L, Whatling C, Cronstein BN, Ticagrelor regulates osteoblast and osteoclast function and promotes bone formation in vivo via an adenosine-dependent mechanism, FASEB journal : official publication of the Federation of American Societies for Experimental Biology 30(11) (2016) 3887–3900. [DOI] [PMC free article] [PubMed] [Google Scholar]
- [19].Kang H, Shih YR, Varghese S, Biomineralized matrices dominate soluble cues to direct osteogenic differentiation of human mesenchymal stem cells through adenosine signaling, Biomacromolecules 16(3) (2015) 1050–61. [DOI] [PMC free article] [PubMed] [Google Scholar]
- [20].Moser GH, Schrader J, Deussen A, Turnover of adenosine in plasma of human and dog blood, Am J Physiol 256(4 Pt 1) (1989) C799–806. [DOI] [PubMed] [Google Scholar]
- [21].Jacobson KA, Gao ZG, Adenosine receptors as therapeutic targets, Nature Reviews Drug Discovery 5(3) (2006) 247–264. [DOI] [PMC free article] [PubMed] [Google Scholar]
- [22].Ryu JH, Lee GJ, Shih YV, Kim TI, Varghese S, Phenylboronic acid-polymers for biomedical applications, Curr Med Chem (2018). [DOI] [PubMed] [Google Scholar]
- [23].Zeng Y, Shih YV, Baht GS, Varghese S, In Vivo Sequestration of Innate Small Molecules to Promote Bone Healing, Adv Mater (2019) e1906022. [DOI] [PMC free article] [PubMed] [Google Scholar]
- [24].Mukherjee S, Song Y, Oldfield E, NMR investigations of the static and dynamic structures of bisphosphonates on human bone: a molecular model, Journal of the American Chemical Society 130(4) (2008) 1264–73. [DOI] [PubMed] [Google Scholar]
- [25].Lawson MA, Xia Z, Barnett BL, Triffitt JT, Phipps RJ, Dunford JE, Locklin RM, Ebetino FH, Russell RG, Differences between bisphosphonates in binding affinities for hydroxyapatite, J Biomed Mater Res B Appl Biomater 92(1) (2010) 149–55. [DOI] [PubMed] [Google Scholar]
- [26].Cole LE, Vargo-Gogola T, Roeder RK, Targeted delivery to bone and mineral deposits using bisphosphonate ligands, Advanced drug delivery reviews 99 (2016) 12–27. [DOI] [PubMed] [Google Scholar]
- [27].Lavrador P, Gaspar VM, Mano JF, Stimuli-responsive nanocarriers for delivery of bone therapeutics - Barriers and progresses, Journal of Controlled Release 273 (2018) 51–67. [DOI] [PMC free article] [PubMed] [Google Scholar]
- [28].Huang R, Zong X, Nadesan P, Huebner JL, Kraus VB, White JP, White PJ, Baht GS, Lowering circulating apolipoprotein E levels improves aged bone fracture healing, JCI Insight 4(18) (2019). [DOI] [PMC free article] [PubMed] [Google Scholar]
- [29].Varghese S, Hwang NS, Ferran A, Hillel A, Theprungsirikul P, Canver AC, Zhang ZJ, Gearhart J, Elisseeff J, Engineering Musculoskeletal Tissues with Human Embryonic Germ Cell Derivatives, Stem Cells 28(4) (2010) 765–774. [DOI] [PubMed] [Google Scholar]
- [30].Gregory CA, Grady Gunn W, Peister A, Prockop DJ, An Alizarin red-based assay of mineralization by adherent cells in culture: comparison with cetylpyridinium chloride extraction, Analytical Biochemistry 329(1) (2004) 77–84. [DOI] [PubMed] [Google Scholar]
- [31].Burdick JA, Chung C, Jia X, Randolph MA, Langer R, Controlled degradation and mechanical behavior of photopolymerized hyaluronic acid networks, Biomacromolecules 6(1) (2005) 386–91. [DOI] [PMC free article] [PubMed] [Google Scholar]
- [32].Raemdonck K, Naeye B, Buyens K, Vandenbroucke RE, Hogset A, Demeester J, De Smedt SC, Biodegradable Dextran Nanogels for RNA Interference: Focusing on Endosomal Escape and Intracellular siRNA Delivery, Adv Funct Mater 19(9) (2009) 1406–1415. [Google Scholar]
- [33].Drescher D, Orts-Gil G, Laube G, Natte K, Veh RW, Osterle W, Kneipp J, Toxicity of amorphous silica nanoparticles on eukaryotic cell model is determined by particle agglomeration and serum protein adsorption effects, Anal Bioanal Chem 400(5) (2011) 1367–1373. [DOI] [PubMed] [Google Scholar]
- [34].Swami A, Reagan MR, Basto P, Mishima Y, Kamaly N, Glavey S, Zhang SF, Moschetta M, Seevaratnam D, Zhang Y, Liu JH, Memarzadeh M, Wu J, Manier S, Shi JJ, Bertrand N, Lu ZN, Nagano K, Baron R, Sacco A, Roccaro AM, Farokhzad OC, Ghobrial IM, Engineered nanomedicine for myeloma and bone microenvironment targeting, P Natl Acad Sci USA 111(28) (2014) 10287–10292. [DOI] [PMC free article] [PubMed] [Google Scholar]
- [35].Heller DA, Levi Y, Pelet JM, Doloff JC, Wallas J, Pratt GW, Jiang S, Sahay G, Schroeder A, Schroeder JE, Chyan Y, Zurenko C, Querbes W, Manzano M, Kohane DS, Langer R, Anderson DG, Modular ‘Click-in-Emulsion’ Bone-Targeted Nanogels, Advanced Materials 25(10) (2013) 1449–1454. [DOI] [PMC free article] [PubMed] [Google Scholar]
- [36].Rosenblum D, Joshi N, Tao W, Karp JM, Peer D, Progress and challenges towards targeted delivery of cancer therapeutics, Nat Commun 9(1) (2018) 1410. [DOI] [PMC free article] [PubMed] [Google Scholar]
- [37].Jarvinen TA, Ruoslahti E, Target-seeking antifibrotic compound enhances wound healing and suppresses scar formation in mice, Proc Natl Acad Sci U S A 107(50) (2010) 21671–6. [DOI] [PMC free article] [PubMed] [Google Scholar]
- [38].Hu CM, Fang RH, Wang KC, Luk BT, Thamphiwatana S, Dehaini D, Nguyen P, Angsantikul P, Wen CH, Kroll AV, Carpenter C, Ramesh M, Qu V, Patel SH, Zhu J, Shi W, Hofman FM, Chen TC, Gao W, Zhang K, Chien S, Zhang L, Nanoparticle biointerfacing by platelet membrane cloaking, Nature 526(7571) (2015) 118–21. [DOI] [PMC free article] [PubMed] [Google Scholar]
- [39].Vanderburgh J, Hill JL, Gupta MK, Kwakwa KA, Wang SK, Moyer K, Bedingfield SK, Merkel AR, d’Arcy R, Guelcher SA, Rhoades JA, Duvall CL, Tuning Ligand Density To Optimize Pharmacokinetics of Targeted Nanoparticles for Dual Protection against Tumor-Induced Bone Destruction, ACS Nano 14(1) (2020) 311–327. [DOI] [PMC free article] [PubMed] [Google Scholar]
- [40].Zhang S, Gangal G, Uludag H, ‘Magic bullets’ for bone diseases: progress in rational design of bone-seeking medicinal agents, Chem Soc Rev 36(3) (2007) 507–31. [DOI] [PubMed] [Google Scholar]
- [41].Rotman SG, Grijpma DW, Richards RG, Moriarty TF, Eglin D, Guillaume O, Drug delivery systems functionalized with bone mineral seeking agents for bone targeted therapeutics, Journal of controlled release : official journal of the Controlled Release Society 269 (2018) 88–99. [DOI] [PubMed] [Google Scholar]
- [42].Zeng Y, Hoque J, Varghese S, Biomaterial-assisted local and systemic delivery of bioactive agents for bone repair, Acta Biomater (2019). [DOI] [PMC free article] [PubMed] [Google Scholar]
- [43].Sun Y, Ye X, Cai M, Liu X, Xiao J, Zhang C, Wang Y, Yang L, Liu J, Li S, Kang C, Zhang B, Zhang Q, Wang Z, Hong A, Wang X, Osteoblast-Targeting-Peptide Modified Nanoparticle for siRNA/microRNA Delivery, ACS Nano 10(6) (2016) 5759–68. [DOI] [PubMed] [Google Scholar]
- [44].Yang YS, Xie J, Wang D, Kim JM, Tai PWL, Gravallese E, Gao G, Shim JH, Bone-targeting AAV-mediated silencing of Schnurri-3 prevents bone loss in osteoporosis, Nat Commun 10(1) (2019) 2958. [DOI] [PMC free article] [PubMed] [Google Scholar]
- [45].Takahama H, Minamino T, Asanuma H, Fujita M, Asai T, Wakeno M, Sasaki H, Kikuchi H, Hashimoto K, Oku N, Asakura M, Kim J, Takashima S, Komamura K, Sugimachi M, Mochizuki N, Kitakaze M, Prolonged targeting of ischemic/reperfused myocardium by liposomal adenosine augments cardioprotection in rats, J Am Coll Cardiol 53(8) (2009) 709–17. [DOI] [PubMed] [Google Scholar]
- [46].Gaudin A, Yemisci M, Eroglu H, Lepetre-Mouelhi S, Turkoglu OF, Donmez-Demir B, Caban S, Sargon MF, Garcia-Argote S, Pieters G, Loreau O, Rousseau B, Tagit O, Hildebrandt N, Le Dantec Y, Mougin J, Valetti S, Chacun H, Nicolas V, Desmaele D, Andrieux K, Capan Y, Dalkara T, Couvreur P, Squalenoyl adenosine nanoparticles provide neuroprotection after stroke and spinal cord injury, Nat Nanotechnol 9(12) (2014) 1054–1062. [DOI] [PMC free article] [PubMed] [Google Scholar]
- [47].Cheng H, Chawla A, Yang Y, Li Y, Zhang J, Jang HL, Khademhosseini A, Development of nanomaterials for bone-targeted drug delivery, Drug Discov Today 22(9) (2017) 1336–1350. [DOI] [PMC free article] [PubMed] [Google Scholar]
- [48].Yin Q, Tang L, Cai K, Tong R, Sternberg R, Yang X, Dobrucki LW, Borst LB, Kamstock D, Song Z, Helferich WG, Cheng J, Fan TM, Pamidronate functionalized nanoconjugates for targeted therapy of focal skeletal malignant osteolysis, Proc Natl Acad Sci U S A 113(32) (2016) E4601–9. [DOI] [PMC free article] [PubMed] [Google Scholar]
- [49].Cenni E, Granchi D, Avnet S, Fotia C, Salerno M, Micieli D, Sarpietro MG, Pignatello R, Castelli F, Baldini N, Biocompatibility of poly(D,L-lactide-co-glycolide) nanoparticles conjugated with alendronate, Biomaterials 29(10) (2008) 1400–11. [DOI] [PubMed] [Google Scholar]
- [50].Nguyen TD, Pitchaimani A, Aryal S, Engineered Nanomedicine with Alendronic Acid Corona Improves Targeting to Osteosarcoma, Sci Rep 6 (2016) 36707. [DOI] [PMC free article] [PubMed] [Google Scholar]
- [51].Corral DA, Amling M, Priemel M, Loyer E, Fuchs S, Ducy P, Baron R, Karsenty G, Dissociation between bone resorption and bone formation in osteopenic transgenic mice, P Natl Acad Sci USA 95(23) (1998) 13835–13840. [DOI] [PMC free article] [PubMed] [Google Scholar]
- [52].Chen SY, Yu HT, Kao JP, Yang CC, Chiang SS, Mishchuk DO, Mau JL, Slupsky CM, An NMR Metabolomic Study on the Effect of Alendronate in Ovariectomized Mice, Plos One 9(9) (2014). [DOI] [PMC free article] [PubMed] [Google Scholar]
- [53].Alexis F, Pridgen E, Molnar LK, Farokhzad OC, Factors affecting the clearance and biodistribution of polymeric nanoparticles, Mol Pharm 5(4) (2008) 505–15. [DOI] [PMC free article] [PubMed] [Google Scholar]
- [54].Geng Y, Dalhaimer P, Cai S, Tsai R, Tewari M, Minko T, Discher DE, Shape effects of filaments versus spherical particles in flow and drug delivery, Nat Nanotechnol 2(4) (2007) 249–55. [DOI] [PMC free article] [PubMed] [Google Scholar]
- [55].Merkel TJ, Jones SW, Herlihy KP, Kersey FR, Shields AR, Napier M, Luft JC, Wu HL, Zamboni WC, Wang AZ, Bear JE, DeSimone JM, Using mechanobiological mimicry of red blood cells to extend circulation times of hydrogel microparticles, P Natl Acad Sci USA 108(2) (2011) 586–591. [DOI] [PMC free article] [PubMed] [Google Scholar]
Associated Data
This section collects any data citations, data availability statements, or supplementary materials included in this article.
Supplementary Materials
Data Availability Statement
All data associated with this study are present in the paper or the Supplementary Data. The raw data required to reproduce these findings will be available upon request.