Abstract.
Purpose
Lung transplantation is the standard treatment for end-stage lung diseases. A crucial factor affecting its success is size matching between the donor’s lungs and the recipient’s thorax. Computed tomography (CT) scans can accurately determine recipient’s lung size, but donor’s lung size is often unknown due to the absence of medical images. We aim to predict donor’s right/left/total lung volume, thoracic cavity, and heart volume from only subject demographics to improve the accuracy of size matching.
Approach
A cohort of 4610 subjects with chest CT scans and basic demographics (i.e., age, gender, race, smoking status, smoking history, weight, and height) was used in this study. The right and left lungs, thoracic cavity, and heart depicted on chest CT scans were automatically segmented using U-Net, and their volumes were computed. Eight machine learning models [i.e., random forest, multivariate linear regression, support vector machine, extreme gradient boosting (XGBoost), multilayer perceptron (MLP), decision tree, -nearest neighbors, and Bayesian regression) were developed and used to predict the volume measures from subject demographics. The 10-fold cross-validation method was used to evaluate the performances of the prediction models. -squared (), mean absolute error (MAE), and mean absolute percentage error (MAPE) were used as performance metrics.
Results
The MLP model demonstrated the best performance for predicting the thoracic cavity volume (: 0.628, MAE: 0.736 L, MAPE: 10.9%), right lung volume (: 0.501, MAE: 0.383 L, MAPE: 13.9%), and left lung volume (: 0.507, MAE: 0.365 L, MAPE: 15.2%), and the XGBoost model demonstrated the best performance for predicting the total lung volume (: 0.514, MAE: 0.728 L, MAPE: 14.0%) and heart volume (: 0.430, MAE: 0.075 L, MAPE: 13.9%).
Conclusions
Our results demonstrate the feasibility of predicting lung, heart, and thoracic cavity volumes from subject demographics with superior performance compared with available studies in predicting lung volumes.
Keywords: subject demographics, lung transplant, machine learning, prediction modeling
1. Introduction
Lung transplant is the standard treatment for patients with end-stage lung disease. There has been a steady increase in lung transplants and improved post-transplant survival over the past two decades. In 2020, 2597 lung transplants were performed in the United States, and 2696 candidates were added to the lung transplant waiting list.1 These numbers decreased slightly compared with 2019 due to the COVID-19 pandemic.2 One-year, 3-year, and 5-year post-transplant survival all improved from 2019 to 2020.1 More than 30% of the patients survive more than 10 years after lung transplant.
Despite the advances in lung transplant, survival after lung transplant is the lowest of all solid organ transplants.1 Most importantly, donor lungs are a scarce resource. The universal shortage of donor lungs has created a long waiting list for lung transplant candidates. The mortality rate of patients on the waiting list for lung transplants is reported to be between 10% and 20%.3–6 Organ allocation should consider both patient equity and medical efficacy to maximize the utilization of this scarce resource. In other words, lung transplant outcome should be emphasized to maximize the benefits of lung transplant. The International Society for Heart and Lung Transplantation (ISHLT) has developed transplant recipient selection guidelines.7–9 The candidate selection criteria are primarily based on the risk of death if lung transplantation is not performed and the likelihood of 5-year survival after lung transplantation. Although the current allocation rules may optimize the medical efficacy of lung transplantation, one important consideration is to identify transplant candidates who will benefit the most from lung transplant in terms of survival to improve organ allocation.
The size match of the donor and recipient lungs is a critical consideration for determining and matching donor lungs to a potential recipient. In practice, the size of a recipient lung can be ascertained from a volumetric computed tomography (CT) scan. In contrast, the size and condition of the donor’s lung are limited, and in many situations, only demographic information is available. The unavailability of medical imaging (e.g., CT scans) related to the donor often makes it difficult to accurately obtain the size of the donor lungs and thus makes lung size matching a challenging task. Published studies primarily rely on predicted total lung capacity (pTLC) to estimate the size of the donor lungs based on demographics (e.g., age, gender, height, and weight)10–14 and reported that the accuracy of pTLC was limited. As a result, a few studies attempted to estimate the lung volume of a donor based on demographics using their chest CT scans as the “ground truth” to train a machine learning model.10–14 However, factors that affect matching of donor and recipient lungs are not limited to lung volume. The characteristics of the thoracic cavity and heart are also important and may potentially affect lung size match. To our knowledge, no models have been developed to predict the size of the thoracic cavity or heart to facilitate lung size match in lung transplantation.
We developed and validated eight machine learning models to predict right lung volume (pRLV), left lung volume (pLLV), total lung volume (pTLV), thoracic cavity volume (pTCV), and heart volume (pHV) based on only basic subject demographics, including age, gender, race, weight, and height. Our study included a large cohort () to develop and test the models. The ultimate objective is to improve lung transplant donor and recipient matching by integrating more information into the matching criteria.
2. Methods and Materials
2.1. Datasets
A cohort consisting of 4610 subjects with chest CT scans was identified from the Pittsburgh Lung Screening Study (PLuSS) cohort15 and the Specialized Centers of Clinically Oriented Research in COPD (SCCOR).16 Subjects’ age, gender (male, female), race (white, African American, other), weight, height, smoking history (pack years), and smoking status (current, former) were included in the dataset (Table 1). To facilitate the development of automated algorithms for segmenting key chest anatomical structures (i.e., thoracic cavity, heart, right lung, and left lung), 100 cases were randomly selected from the cohort. An observer (AA, a primary care physician) manually outlined the lungs, heart, and thoracic cavity on the CT images of the 100 subjects. All the CT examinations in the two cohorts were de-identified and re-identified with a unique study ID. This study was approved by the University of Pittsburgh Institutional Review Board (IRB) (IRB # STUDY21020128).
Table 1.
Subjects’ demographics.
| All subjects () | Male () | Female () | |
|---|---|---|---|
| Age, mean (range) | 60(40 to 70) | 60 (44 to 70) | 60 (40 to 70) |
| Race, (%) | — | — | — |
| White | 4354(94.4) | 2266(95.3) | 2088(93.5) |
| African American | 245(5.3) | 109(4.6) | 136(6.1) |
| Others | 11(0.2) | 3(0.1) | 8(0.4) |
| Height (cm), mean (SD) | 169.08 ± 9.52 | 175.7 ± 6.55 | 162.03 ± 0.55 |
| Weight (kg), mean (SD) | 82.09 ± 18.10 | 89.94 ± 11.79 | 73.72 ± 8.85 |
2.2. Algorithm Overview
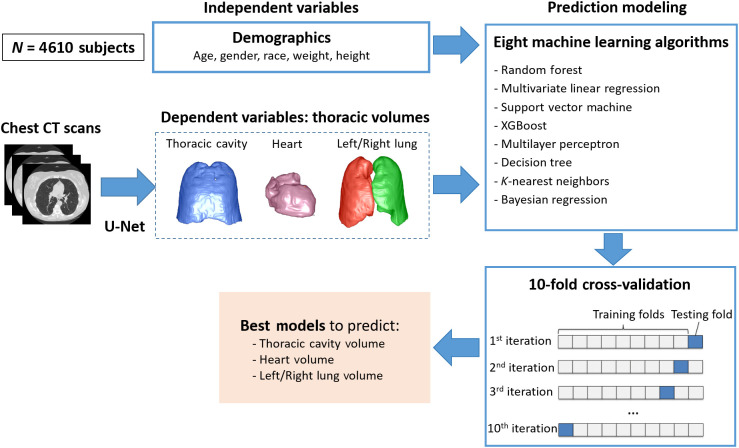
First, the classical U-Net models were trained to automatically segment the left lung, right lung, heart, and thoracic cavity (Fig. 1). Second, the thoracic structures were automatically segmented from the CT images using the trained U-Net models, and their volumes were computed based on the segmentation as the ground truth (or dependent variables) for the regression modeling. Third, eight machine learning algorithms were implemented to predict the lung, heart, and thoracic cavity volumes based on the subject demographics. The volumes of the structures obtained from the chest CT scans were used as the ground truth for training the machine learning models. Finally, the performance of the prediction models was validated using the 10-fold cross-validation method. The models with the best performance were finalized.
Fig. 1.
Algorithm overview. The U-Net-based model was used to generate the ground truth (i.e., dependent variables) for prediction modeling.
2.3. Segmentation of Key Chest Anatomical Structures
Convolutional neural network (CNN) has demonstrated great success in a variety of medical imaging tasks. Among the available CNN models, U-Net17 is one of the most common ones used for image segmentation and was used in this study. The classical U-Net model was trained to segment the key chest anatomical structures involved in this study by following the image patch-based method.18 The CT scans were first reconstructed to form an isotropic annotation mask with a resolution of . Next, all the CT scans were split into three sets, namely training set, internal validation set, and independent test set at a ratio of 8:1:1, respectively. Next, paired image patches with a uniform dimension of were randomly sampled from both the reconstructed CT scans and the annotation masks, which were fed into the U-Net model. The batch size, initial learning rate, and decay rate were set to 4, 0.0001, and 0.5, respectively.18 The Dice coefficient was used as the loss function, Adam as the optimizer, and Softmax as the activation function. If the loss did not improve for 10 continuous epochs, the training procedure was terminated.
2.4. Regression Modeling
Several regression methods have been developed to predict numeric measures based on the tasks and data. Eight commonly used supervised machine learning methods were evaluated to identify the optimal approach. The methods are available in an open-source data analysis library: Scikit-learn. The approaches evaluated include: (1) decision tree, (2) random forest,19 (3) multivariant linear regression (MLR), (4) support vector machine (SVM),20 (5) extreme gradient boosting (XGBoost),21 (6) multilayer perception (MLP), (7) -nearest neighbors (KNN),22 and (8) Bayesian regression. These methods can be used for both classification and regression problems. As a preprocessing step, a -score normalization was performed before the prediction modeling. For the SVM-based modeling, a linear kernel was used in our implementation. For the decision tree modeling, the maximum depth of the tree was set to 5. For both random forest and XGBoost modeling, 250 trees were used, and the maximum depth of the tree was set to 6. For the MLP modeling, the sigmoid function was used as the activation function and L-BFGS as the optimizer. For the KNN modeling, 40 neighbors were used.
2.5. Performance Validation
The performance of the U-Net segmentation models was evaluated first using the 10-fold cross-validation method. The manual segmentations dataset () was randomly split into 10-folds. Eightfolds were used for training, onefold was used for internal validation, and onefold was used for an independent test. Training was repeated 10 times to ensure that all the cases in the cohort were involved in the independent test. The performance of the segmentation model was evaluated using the Dice coefficient. Next, the Pearson coefficients were computed to assess the correlation between subject demographics and the volumes of the key chest anatomical structures. A -value of was considered statistically significant. Only the variables significantly associated with the anatomical volumes were used as predictors in the regression modeling. Finally, the 10-fold cross-validation method was used again to validate the performances of the regression models. Unlike the evaluation of the U-Net models, there was no internal validation set. The cohort () was randomly split into tenfolds. Ninefolds were used for training the regression models, and the remaining onefold was used for the independent test. The average -squared (), mean absolute error (MAE), and mean absolute percentage error (MAPE) were used as the performance metrics. The categorical variables gender, race, and smoking status were classified as male/female, white/African American/other, and current/former, respectively. IBM SPSS v28 was used for the statistical analyses.
3. Results
3.1. Image Segmentation Performance
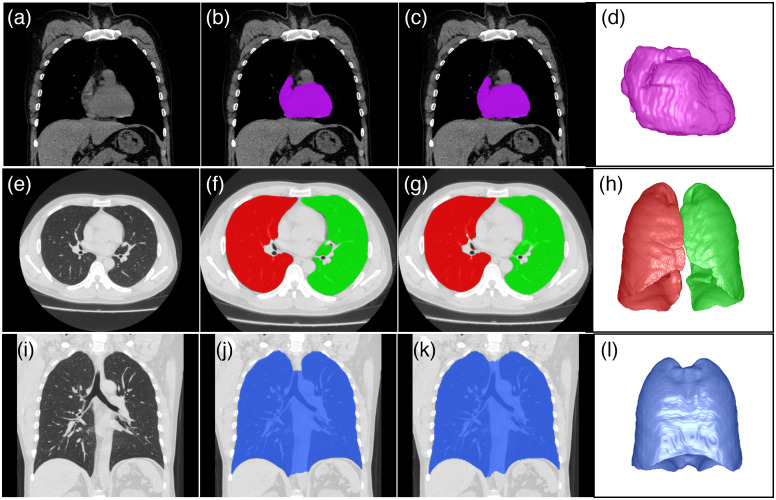
The U-Net segmentation models using the 10-fold cross-validation approach reliably segmented the right lung, left lung, heart, and thoracic cavity on chest CT scans (Fig. 2). The Dice coefficients for segmenting the right lung, left lung, heart, and thoracic cavity were , , , and , respectively. The volumes of the right lung (RLV), left lung (LLV), total lung (TLV), heart (HV), and thoracic cavity (TCV) were computed using the U-Net segmentation models based on the chest CT scans (Table 2). The measures in the male subjects were consistently higher than those in the female subjects. Their average LLV, RLV, TLV, HV, and TCV were , , , , and , respectively.
Fig. 2.
Examples demonstrating the performance of the U-Net segmentation models in segmenting the heart, lungs, and thoracic cavity. (a), (e), and (i) Original CT images, (b), (f), and (j) manual annotation; (c), (g), and (k) model segmentation results; (d), (h), and (l) 3D visualization of the automated segmentation results.
Table 2.
CT volumes of right lung, left lung, heart, and thoracic cavity.
| All subjects () | Male () | Female () | |
|---|---|---|---|
| LLV (l), mean (SD) | 2.552 ± 0.668 | 2.952 ± 0.388 | 2.127 ± 0.400 |
| RLV (l), mean (SD) | 2.900 ± 0.691 | 3.308 ± 0.375 | 2.466 ± 0.574 |
| TLV (l), mean (SD) | 5.452 ± 1.340 | 6.260 ± 0.762 | 4.592 ± 0.973 |
| HV (l), mean (SD) | 0.543 ± 0.131 | 0.608 ± 0.103 | 0.474 ± 0.128 |
| TCV (l), mean (SD) | 6.925 ± 1.539 | 7.981 ± 0.456 | 5.799 ± 1.545 |
LLV, left lung volume; RLV, right lung volume; TLV, total lung volume; HV, heart volume; TCV, thoracic cavity volume
3.2. Correlation between Subject Demographics and the Volumes of Key Chest Anatomical Structures
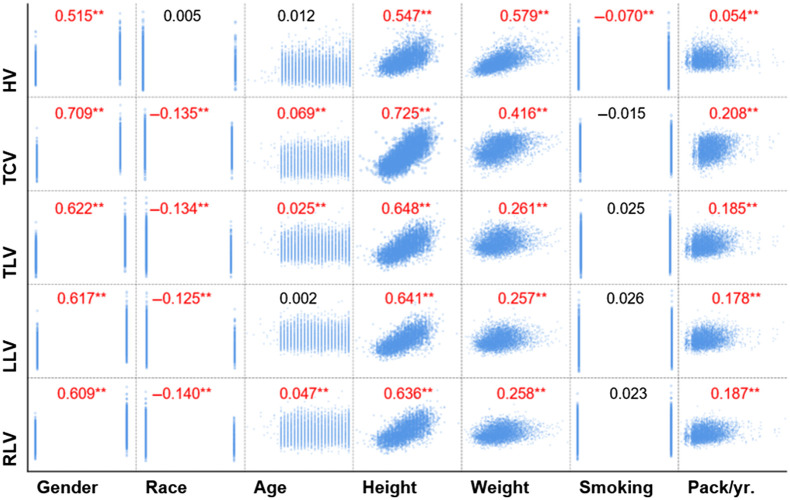
Most (28/35) of the subject demographics were significantly associated with the RLV, LLV, TLV, HV, and TCV, except the smoking status (Fig. 3). Gender, height, and weight had significant, positive correlations with all five anatomical volumes. Age had a significant positive correlation with RLV, TLV, and TCV. Although white people had significantly larger lung and thoracic cavity volumes compared with other races, their relationship is weak as suggested by the correlation coefficients. There was no association between smoking status and the anatomical volumes. However, interestingly, smoking history (pack years) was significantly associated with the anatomical volumes.
Fig. 3.
Pairwise Pearson correlations between subject demographics and the LLV, RLV, TLV, HV, and TCV. (, **).
3.3. Prediction Accuracy of the Regression Models
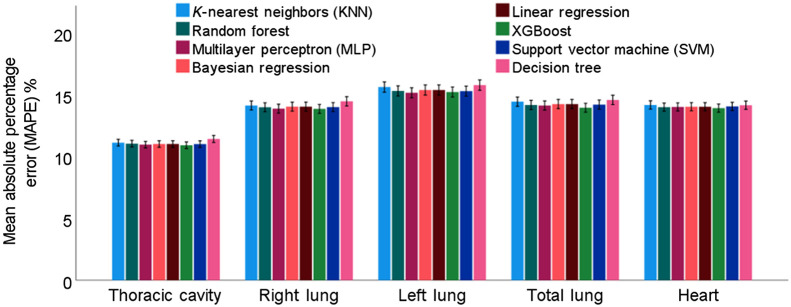
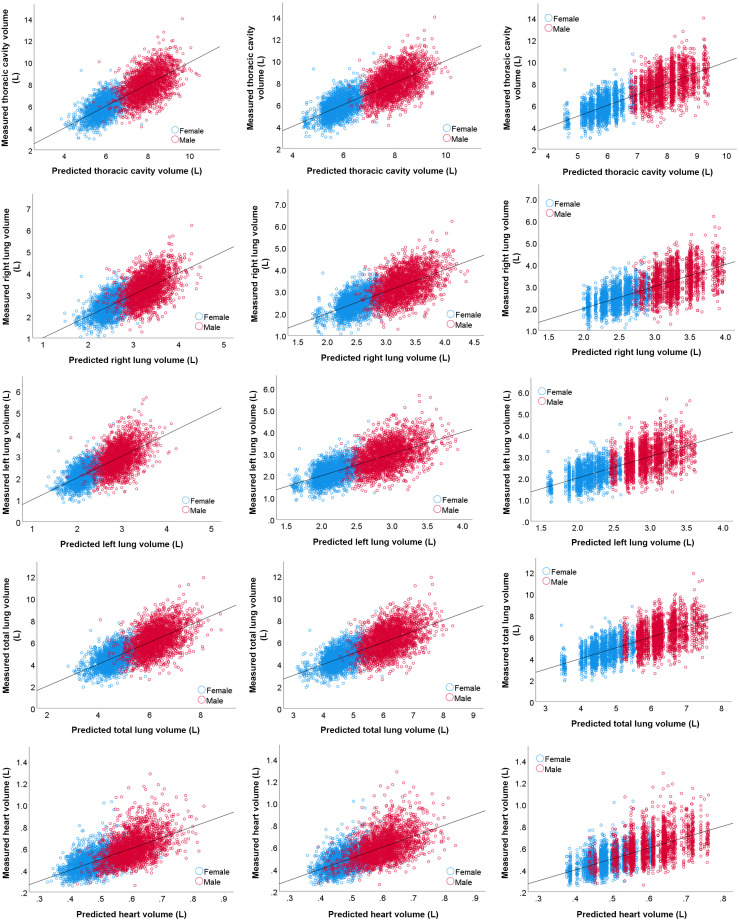
When developing the regression models, only basic subject demographic information was used, including age, gender, race, weight, and height. The smoking status was excluded since it was not significantly associated with the thoracic volumes (Fig. 3). In addition, although smoking history (i.e., pack/year) was significantly associated with the thoracic volumes, it was excluded from the prediction modeling because such information may not always be available in practice. MLP and XGBoost demonstrated the best overall prediction performances (Table 3 and Fig. 4), but the difference in performance was not statistically different (). Specifically, MLP showed a slightly higher performance in predicting TCV, RLV, and LLV, whereas XGBoost showed a slightly higher performance in predicting TLV and HV. In contrast, the decision tree demonstrated the worst performance. All machine learning methods achieved an MAE of 0.7 to 0.8 L in predicting TCV and TLV, an MAE of 0.4 L in predicting RLV and LLV, and an MAE of 0.1 L in predicting HV, an MAPE of in predicting TCV, and an MAPE of 14% to 15% in predicting RLV, LLV, TLV, and HV. The correlation between the anatomical volumes based on automated segmentation and predicted volumes based on demographics was strong for all models (Table 3 and Fig. 5).
Table 3.
Performance of eight machine learning algorithms in predicting the anatomical volumes of key anatomical structures.
| MLP | Random forest | MLR | SVM | XGBoost | Decision tree | KNN | Bayesian regression | ||
|---|---|---|---|---|---|---|---|---|---|
| TCV | 0.628 | 0.618 | 0.624 | 0.618 | 0.622 | 0.591 | 0.605 | 0.624 | |
| MAE (L) | 0.7 ± 0.6 | 0.7 ± 0.6 | 0.7 ± 0.6 | 0.7 ± 0.6 | 0.7 ± 0.6 | 0.8 ± 0.68 | 0.8 ± 0.6 | 0.7 ± 0.6 | |
| MAPE (%) | 10.9 ± 9.2 | 11.0 ± 9.4 | 11.0 ± 9.3 | 11.0 ± 9.3 | 10.9 ± 9.2 | 11.4 ± 9.7 | 11.1 ± 9.4 | 11.0 ± 9.3 | |
| RLV | 0.501 | 0.495 | 0.493 | 0.488 | 0.498 | 0.459 | 0.473 | 0.493 | |
| MAE (L) | 0.4 ± 0.3 | 0.4 ± 0.3 | 0.4 ± 0.3 | 0.4 ± 0.3 | 0.4 ± 0.3 | 0.4 ± 0.3 | 0.4 ± 0.3 | 0.4 ± 0.3 | |
| MAPE (%) | 13.9 ± 12.5 | 14.0 ± 12.6 | 14.0 ± 12.6 | 14.0 ± 12.6 | 13.9 ± 12.4 | 14.5 ± 13.1 | 14.1 ± 12.7 | 14.0 ± 12.6 | |
| LLV | 0.507 | 0.497 | 0.496 | 0.492 | 0.498 | 0.465 | 0.469 | 0.496 | |
| MAE (L) | 0.4 ± 0.3 | 0.4 ± 0.3 | 0.4 ± 0.3 | 0.4 ± 0.3 | 0.4 ± 0.3 | 0.4 ± 0.3 | 0.4 ± 0.3 | 0.4 ± 0.3 | |
| MAPE (%) | 15.2 ± 14.0 | 15.3 ± 14.2 | 15.4 ± 14.2 | 15.3 ± 14.0 | 15.2 ± 14.0 | 15.8 ± 14.6 | 15.6 ± 14.3 | 15.4 ± 14.2 | |
| TLV | 0.512 | 0.511 | 0.508 | 0.503 | 0.514 | 0.479 | 0.482 | 0.508 | |
| MAE (L) | 0.7 ± 0.6 | 0.7 ± 0.6 | 0.7 ± 0.6 | 0.7 ± 0.6 | 0.7 ± 0.6 | 0.8 ± 0.6 | 0.8 ± 0.6 | 0.78 ± 0.6 | |
| MAPE (%) | 14.1 ± 12.7 | 14.2 ± 12.8 | 14.3 ± 12.9 | 14.2 ± 12.8 | 14.0 ± 12.5 | 14.6 ± 13.2 | 14.5 ± 13 | 14.3 ± 12.9 | |
| HV | 0.429 | 0.427 | 0.428 | 0.429 | 0.430 | 0.418 | 0.419 | 0.429 | |
| MAE (L) | 0.1 ± 0.1 | 0.1 ± 0.1 | 0.1 ± 0.1 | 0.1 ± 0.1 | 0.1 ± 0.1 | 0.1 ± 0.1 | 0.1 ± 0.1 | 0.1 ± 0.1 | |
| MAPE (%) | 14.0 ± 11.4 | 14.0 ± 11.4 | 14.0 ± 11.5 | 14.1 ± 11.5 | 13.9 ± 11.4 | 14.2 ± 11.6 | 14.2 ± 11.7 | 14.0 ± 11.5 |
MLP, multilayer perception; SVM, support vector machine; KNN, -nearest neighbors; MLR, multivariant linear regression; XGBoost, extreme gradient boosting.
Fig. 4.
MAPEs of the eight machine learning methods in predicting the anatomical volumes of key chest anatomical structures.
Fig. 5.
Scatter plots of the CT-derived volumes based on automated segmentation and the predicted volumes based on the MLP, XGBoost, and decision tree models based on the 10-fold cross-validation.
4. Discussion
We verified the feasibility of predicting the three-dimensional (3D) volumes of key thoracic structures from subject demographics. The objective is to facilitate lung size match for lung transplants. Eight machine learning methods were used to develop the regression models based on a cohort of 4610 subjects. We note that the novelty of this study is not the development of novel machine learning algorithms but the idea of predicting 3D volumes of several thoracic structures from subject demographics. Specifically, this study has several unique characteristics compared with published reports (Table 4). First, this study developed models to predict heart and thoracic cavity volumes based on subject demographics, which, to our knowledge, has not been attempted by other investigators. Second, our large cohort of over 4500 cases is by far the largest study to date. Third, we evaluated eight popular machine learning methods in predicting the volumes from subject demographics. Finally, since multiple anatomical volumes were predicted in this study, the developed models can be potentially applicable to different lung transplant approaches, such as single, bilateral, or heart-lung transplantation, and can serve as a supplement to current methods to improve lung transplantation.
Table 4.
Published studies for predicting lung size from subject demographics.
| Authors, year | Subjects | Predictor variables | MAE (L) | RMSE | MAPE (%) | ||
|---|---|---|---|---|---|---|---|
| Kon et al. (2011)10 | 500 | Age, gender, height, race | — | — | — | RLV: 0.72 | — |
| LLV: 0.70 | |||||||
| TLV: 0.72 | |||||||
| Park et al. (2015)12 | 269 | Height, weight, age | pTLV_Male: 0.604 | pTLV_Male: 0.208 | — | pTLV_Male: 10.9 ± 9.0% | |
| pTLV_Female: 0.462 | pTLV_Female: 0.378 | — | pTLV Female: 11.0 ± 8.5% | ||||
| Konheim et al. (2016)14 | 500 | Age, gender, race, height, BMI, body surface area | — | — | — | RLV: 0.72LLV: 0.69 TLV: 0.72 | — |
| Jung et al. (2016)13 | 264 | Age, height, body surface area | — | — | — | — | pTLC: 16.4 ± 11.8% |
| Suryapalam et al. (2021)23 | 480 | Height, weight, age, sex, ethnicity | — | — | pRLV_Male: 0.131 | — | — |
| pLLV_Female: 0.136 | |||||||
| Our study | 4610 | Age, gender, race, height, weight, smoking status, cigarette package year | pTCV: 0.7 ± 0.6 pRLV: 0.4 ± 0.3 pLLV: 0.4 ± 0.3 pTLV: 0.7 ± 0.6 pHV: 0.1 ± 0.1 | — | pTCV: 0.628 pRLV: 0.501 pLLV: 0.507 pTLV: 0.514 pHV: 0.430 | — | pTCV: 10.9 ± 9.2% pRLV: 13.9 ± 12.5% pLLV: 15.2 ± 14.0% pTLV: 14.0 ± 12.5% pHV: 13.9 ± 11.4% |
MAE, mean absolute error; RMSE, the root mean square; MAPE, mean absolute percentage error; F, female; M, male.
We found no significant differences between the performance of the machine learning prediction models (). This may be caused by the fact that the predictor variables were relatively simple and their number was limited. Notably, the involved thoracic structures are dynamic structures, and their volume computations depend on the respiratory state (e.g., inspiration and expiration) and cardiac cycle. In particular, we found that smoking history affected the anatomical volumes as well. Despite these, our results demonstrated a very promising performance, which outperformed other published reports (Table 4). The performance improvement may be attributed to the use of a much larger dataset.
We trained and validated the classical U-Net model to segment several thoracic structures and computed their volumes for developing prediction models. The U-Net segmentation models showed relatively high performance in segmenting these structures. Nevertheless, there were still errors between the computerized results and the manual outlines. However, the automated computerized approach makes it possible to efficiently process a large number of chest CT scans for reliable regression modeling. We did not develop CNN-based segmentation models in this study because the classical U-Net model demonstrated high accuracy in segmenting these structures. Specifically, the Dice coefficients for segmenting the right lung, left lung, heart, and thoracic cavity were , , , and , respectively. Also, the classical U-Net model is simple and has fewer parameters as compared with other sophisticated U-Net variates (e.g., R2Unet, UNet++), making it a lighter model and easy to implement. As demonstrated in other studies,18,24,25 many state-of-the-art CNN image segmentation models only demonstrated a very limited improvement in segmentation performance compared with traditional CNN models, and most of them are variants of the U-Net model.
There are limitations with this study. First, our cohort was created from existing COPD and lung cancer studies. All the study participants were current or former smokers. Second, the subjects had an age range from 40 to 70 years. It would be beneficial to expand the cohort to include younger and nonsmoker subjects. Third, most of the subjects are white. Although our results showed that race contributed little to the prediction performance, this could be caused by our imbalanced cohort. Additional investigation is needed to clarify this further. Finally, the presence of thoracic abnormalities may affect the volumes of the relevant structures but were not considered in this study.
5. Conclusion
Our study demonstrates the feasibility of predicting lung, heart, and thoracic cavity volumes from subject demographics. Compared with published reports, our study used a much larger cohort and analyzed more chest volumetric characteristics that may potentially affect lung size match. Our prediction models also demonstrated higher accuracy in predicting lung volume compared with other studies. We believe our results demonstrate the feasibility of predicting the 3D volumes of key anatomical features from subject demographics and that our prediction models may improve lung size matching for single lung, bilateral lung, and heart-lung transplants.
Acknowledgments
This work was supported in part by research grants from the National Institutes of Health (NIH) (U01CA271888 and R01CA237277).
Biography
Biographies of the authors are not available.
Disclosures
The authors have no conflicts of interest to declare.
Contributor Information
Lucas Pu, Email: lucaspu2007@gmail.com.
Joseph K. Leader, Email: jklst3@pitt.edu.
Alaa Ali, Email: Alaa.m.s.ali11@gmail.com.
Zihan Geng, Email: zihangen@andrew.cmu.edu.
David Wilson, Email: wilsondo@upmc.edu.
References
- 1.Valapour M., et al. , “OPTN/SRTR 2020 annual data report: lung,” Am. J. Transplant. 22 Suppl. 2, 438–518 (2022). 10.1111/ajt.16991 [DOI] [PubMed] [Google Scholar]
- 2.Valapour M., et al. , “OPTN/SRTR 2019 annual data report: lung,” Am. J. Transplant. 21 Suppl. 2, 441–520 (2021). 10.1111/ajt.16495 [DOI] [PubMed] [Google Scholar]
- 3.Snyder J. J., et al. , “The equitable allocation of deceased donor lungs for transplant in children in the United States,” Am. J. Transplant. 14(1), 178–183 (2014). 10.1111/ajt.12547 [DOI] [PubMed] [Google Scholar]
- 4.Weill D., “Access to lung transplantation. The long and short of it,” Am. J. Respir. Crit. Care Med. 193(6), 605–606 (2016). 10.1164/rccm.201511-2257ED [DOI] [PubMed] [Google Scholar]
- 5.Yusen R. D., et al. , “Lung transplantation in the United States, 1999-2008,” Am. J. Transplant. 10(4 Pt. 2), 1047–1068 (2010). 10.1111/j.1600-6143.2010.03055.x [DOI] [PubMed] [Google Scholar]
- 6.De Meester J., et al. , “Lung transplant waiting list: differential outcome of type of end-stage lung disease, one year after registration,” J. Heart Lung Transplant. 18(6), 563–571 (1999). 10.1016/S1053-2498(99)00002-9 [DOI] [PubMed] [Google Scholar]
- 7.Weill D., et al. , “A consensus document for the selection of lung transplant candidates: 2014: an update from the Pulmonary Transplantation Council of the International Society for Heart and Lung Transplantation,” J. Heart Lung Transplant. 34(1), 1–15 (2015). 10.1016/j.healun.2014.06.014 [DOI] [PubMed] [Google Scholar]
- 8.The American Society for Transplant Physicians (ASTP)/American Thoracic Society(ATS)/European Respiratory Society(ERS)/International Society for Heart and Lung Transplantation(ISHLT), “International guidelines for the selection of lung transplant candidates,” Am. J. Respir. Crit. Care Med. 158(1), 335–339 (1998). 10.1164/ajrccm.158.1.15812 [DOI] [PubMed] [Google Scholar]
- 9.Orens J. B., et al. , “International guidelines for the selection of lung transplant candidates: 2006 update: a consensus report from the Pulmonary Scientific Council of the International Society for Heart and Lung Transplantation,” J. Heart Lung Transplant. 25(7), 745–755 (2006). 10.1016/j.healun.2006.03.011 [DOI] [PubMed] [Google Scholar]
- 10.Kon Z. N., et al. , “27 Predictive algorithms for matching donor and recipient lung size for transplantation using three-dimensional computed tomographic (3D CT) volumetry,” J. Heart Lung Transplant. 30(4, Suppl.), S17 (2011). 10.1016/j.healun.2011.01.034 [DOI] [Google Scholar]
- 11.Barnard J. B., et al. , “Size matching in lung transplantation: an evidence-based review,” J. Heart Lung Transplant. 32(9), 849–860 (2013). 10.1016/j.healun.2013.07.002 [DOI] [PubMed] [Google Scholar]
- 12.Park C. H., et al. , “New predictive equation for lung volume using chest computed tomography for size matching in lung transplantation,” Transplant. Proc. 47(2), 498–503 (2015). 10.1016/j.transproceed.2014.12.025 [DOI] [PubMed] [Google Scholar]
- 13.Jung W. S., et al. , “The feasibility of CT lung volume as a surrogate marker of donor-recipient size matching in lung transplantation,” Medicine-Baltimore 95(27), e3957 (2016). 10.1097/MD.0000000000003957 [DOI] [PMC free article] [PubMed] [Google Scholar]
- 14.Konheim J. A., et al. , “Predictive equations for lung volumes from computed tomography for size matching in pulmonary transplantation,” J. Thorac. Cardiovasc. Surg. 151(4), 1163–1169.e1 (2016). 10.1016/j.jtcvs.2015.10.051 [DOI] [PubMed] [Google Scholar]
- 15.Wilson D. O., et al. , “The Pittsburgh Lung Screening Study (PLuSS): outcomes within 3 years of a first computed tomography scan,” Am. J. Respir. Crit. Care Med. 178(9), 956–961 (2008). 10.1164/rccm.200802-336OC [DOI] [PMC free article] [PubMed] [Google Scholar]
- 16.Chandra D., et al. , “The association between lung hyperinflation and coronary artery disease in smokers,” Chest 160(3), 858–871 (2021). 10.1016/j.chest.2021.04.066 [DOI] [PMC free article] [PubMed] [Google Scholar]
- 17.Ronneberger O., Fischer P., Brox T., “U-Net: convolutional networks for biomedical image segmentation,” arXiv:1505.04597 (2015).
- 18.Pu L., et al. , “Automated segmentation of five different body tissues on computed tomography using deep learning,” Med. Phys. 50(1), 178–191 (2022). 10.1002/mp.15932 [DOI] [PMC free article] [PubMed] [Google Scholar]
- 19.Ho T. K., ed., “Random decision forests,” in Proc. 3rd Int. Conf. Document Anal. and Recognit., 14–16 August (1995). 10.1109/ICDAR.1995.598994 [DOI] [Google Scholar]
- 20.Cortes C., Vapnik V., “Support-vector networks,” Mach. Learn. 20(3), 273–297 (1995). 10.1007/BF00994018 [DOI] [Google Scholar]
- 21.Chen T., Guestrin C., “XGBoost: a scalable tree boosting system,” in Kdd ’16, pp. 785–794 (2016). 10.1145/2939672.2939785 [DOI] [Google Scholar]
- 22.Cover T., Hart P., “Nearest neighbor pattern classification,” IEEE Trans. Inf. Theor. 13(1), 21–27 (1967). 10.1109/TIT.1967.1053964 [DOI] [Google Scholar]
- 23.Suryapalam M., et al. , “An anthropometric study of lung donors,” Prog. Transplant. 31(3), 211–218 (2021). 10.1177/15269248211024611 [DOI] [PubMed] [Google Scholar]
- 24.Beeche C., et al. , “Super U-Net: a modularized generalizable architecture,” Pattern Recognit. 128, 108669 (2022). 10.1016/j.patcog.2022.108669 [DOI] [PMC free article] [PubMed] [Google Scholar]
- 25.Wang L., et al. , “Automated delineation of corneal layers on OCT images using a boundary-guided CNN,” Pattern Recognit. 120, 108158 (2021). 10.1016/j.patcog.2021.108158 [DOI] [PMC free article] [PubMed] [Google Scholar]


