Background:
Gallbladder carcinoma is the most common cancer of the biliary tract, and the immune checkpoint blockade showed promising efficacy in the treatment of advanced gallbladder carcinoma. However, the underlying mechanisms remain unknown.
Methods:
Single-cell RNA sequencing was used to reveal immune cell dynamics in an anti-PD-1 responder with gallbladder carcinoma liver metastases. Gene set variation analysis, pseudotime analysis, single-cell regulatory network inference and clustering analysis, and CellChat analysis were used to identify the functions of each cell cluster. Immunohistochemistry and multicolored immunohistochemistry analysis were applied to confirm the intratumoral cell types, and the prognostic value of CXCL13+CD8+T cells in patients with gallbladder carcinoma liver metastases with immunotherapy was evaluated. Four biliary tract carcinoma and 3 immunotherapy bulk RNA-seq datasets were analyzed to investigate the prognostic value of CXCL13+CD8+T cells and SPP1+TAMs.
Result:
A total of 19,648 high-quality single-cell transcriptome data were obtained from liver metastasis before and after aPD-1 therapy. We discovered improved cytotoxic activity in CD8+T cells and enhanced proinflammatory phenotypes in myeloid cells. The identified SPP1+TAMs were related to poor prognosis. The increased effector/memory T cells represented characteristics similar to exhausted T cells in transitory status after aPD-1therapy, which may play a crucial role in the antitumor immune response. We further revealed that CXCL13+T cells in a high subtype of biliary tract carcinoma were characterized as a ‘hot tumor’ profile with high immune scores, correlated to the immunostimulatory context with favorable survival, and can predict effective responses to immunotherapy.
Conclusions:
Our study provided an overview of immune cell dynamics in gallbladder carcinoma liver metastases after aPD-1 treatment and highlighted the importance of CXCL13+T cells in biliary tract carcinoma and effective responses to immunotherapy, which would advance the understanding and treatment of the disease.
INTRODUCTION
Gallbladder carcinoma (GBC) is the most common cancer of the biliary tract and the sixth most common type of gastrointestinal cancer globally, with substantial variation by sex and geographical region.1 Although surgery is commonly used in GBC, the therapeutic effect is limited as most patients are diagnosed at advanced stages, and only 10% of patients are eligible for surgery.2 The clinical outcome of GBC is poor, with an overall 5-year survival rate of less than 5%.3 Although gemcitabine combined with cisplatin revealed significant antitumor activity as the first-line therapy for metastatic biliary tract cancer (BTC), no recommended therapy has been established yet after the failure of first-line treatment.4
Research efforts toward programmed cell death 1 protein (PD-1) blockade immunotherapy had been done in BTC. A phase 2 study of Nivolumab for patients with advanced refractory BTC, including 17 patients with GBC, showed a modest efficacy with a durable response.5 The combination strategy of PD-1 inhibitors and chemotherapy for advanced patients with BTC also revealed signs of clinical activity, indicating a promising efficacy of immunotherapy in GBC.6
Tumor-infiltrating lymphocytes are crucial to the prognosis of patients and closely correlated with the curative effect of immune checkpoint inhibitors7,8 Single-cell RNA sequencing (scRNA-seq) provides a powerful means to identify the expression profiling of specific cellular composition and transcriptional landscape, offering deeper insights into cellular diversity.9 Revealing the characteristic of TME in GBC is of great importance to guide immunotherapy. This study aimed to reveal the change of TME in metastatic GBC from an immunotherapy responder by scRNA-seq and improve the understanding of the mechanisms of aPD-1 therapy in GBC, aiming to find a potential prognostic biomarker for immunotherapy in BTC.
METHODS
Human tumor samples
The samples were collected from the gallbladder liver metastasis lesion in an aPD-1 responder before and after therapy by biopsy, including fresh samples for scRNA-seq and formalin-fixed and paraffin-embedded for immunohistochemistry (IHC) examination (Figure 1A). Formalin-fixed and paraffin-embedded samples from 7 patients who received gallbladder carcinoma liver metastases (GLM) resection were collected for validation. All of them received aPD-1 therapy following surgery. The immunotherapy response information (including 3 responders and 4 nonresponders) was obtained from the electronic medical record. Written informed consent was obtained from the patient, and ethical approval was obtained from the Institutional Review Board of Fudan University Shanghai Cancer Center, following the Declaration of Helsinki (Shanghai, China, IRB approved protocol number GDREC2016175H).
FIGURE 1.
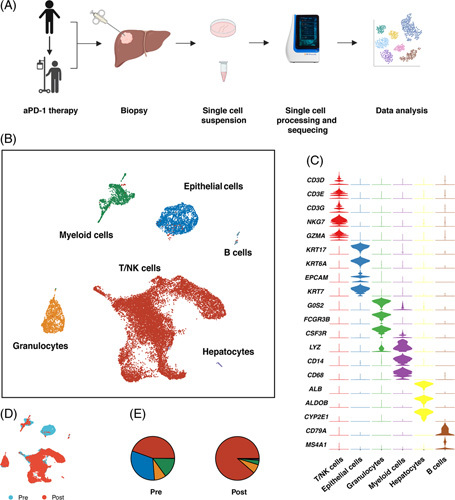
(A) Scheme of experimental design. (B) UMAP plot of 19,648 cells from pre-aPD-1 and post-aPD-1 therapy biopsy samples. (C) Heatmap of the characteristic gene in each cell cluster. (D) UMAP plot of the distribution of cells from pre-aPD-1 and post-aPD-1 therapy samples. (E) Proportion of each cell type in pre-aPD-1 and post-aPD-1 therapy samples. Abbreviations: aPD-1, anti-programmed cell death 1 protein.
Single-cell dissociation
The fresh biopsy samples were digested with Solo Tumor Dissociation Kit (Sinotech Genomics, JZ-SC-58201) for 45 minutes at 37°C with sustained agitation. Next, samples were filtered through 40 μm sterile strainers and centrifuged at 300 g for 5 minutes. After supernatants were discarded, the pelleted cells were suspended in Red Blood Cell Lysis Buffer (Miltenyi Biotec) to lyse red blood cells, and cells were incubated at 25°C for 10 minutes. After washing with PBS containing 0.04% BSA, cell pellets were resuspended in PBS containing 0.04% BSA and passed through a 35 μm cell strainer. Dissociated single cells were stained using Calcein-AM (Thermo Fisher Scientific) and Draq7 (BD Biosciences) to assess the viability using BD Rhapsody Scanner (BD Biosciences) for quality assessment.
Single-Cell RNA library and Sequencing
Cells were loaded in BD Rhapsody micro-well cartridges with cell capture beads.10 Next, cell capture beads were retrieved, and reverse transcription was performed. The cDNA library was constructed by microbeads-captured single-cell transcriptome containing cell labels and unique molecular identifiers information. All procedures were performed with BD Rhapsody cDNA Kit (BD Biosciences, Cat. No. 633773) and BD Rhapsody Targeted mRNA & AbSeq Amplification Kit (BD Biosciences, Cat No. 633801). The libraries were sequenced on the NovaSeq platform (Illumina).
scRNA-seq was performed using the Whole Transcriptome Assay Analysis Pipeline (v1.8). The output matrix of unique molecular identifiers counts for each gene per cell was used for downstream analysis. Genome Reference Consortium Human Build 38 (GRCh38) was used as a reference for the BD pipeline. The scRNA-seq data generated in this paper were deposited in Genome Sequence Archive with access number HRA002862 (https://ngdc.cncb.ac.cn/gsa-human/browse/HRA002862).
Single-Cell RNA processing
The raw output data were processed with the R package Seurat (v4.0.5). Cells that had fewer than 300 detected genes or had>20% mitochondrial gene counts were filtered out. Further, we removed the potential doublets using the DoubletFinder package (v2.0.3).11 The batch effects were removed by the Harmony package (v0.1.0).12 We applied SCTransform to the Seurat object and principal components analysis for dimensionality reduction. The top 15 principal components were used in subsequent cell cluster analysis. The main cell clusters were identified with the FindNeighbors and FindClusters functions. The nonlinear dimensional reduction was performed using UMAP. The cell types were annotated based on the DEGs and the well-known cellular markers from the literature.
Trajectory analysis
Single-Cell pseudotime trajectory analysis was performed with Monocle 2 R package(v2.22.0).13 Branch expression analysis modeling was applied for branch fate-determining gene analysis. The enrichment GO terms of the genes in each cluster were calculated with the clusterProfiler (v4.2.2) package.14
SCENIC analysis
SCENIC analysis was performed with R package SCENIC (v1.2.4) to measure the difference between cell clusters based on transcription factors or their target genes.15
Interactome analysis
We analyzed our scRNA-seq data for potential ligand-receptor interaction using the CellChat R package (v1.1.3).16
DEGs identification and GO enrichment analysis
Differentially upregulated genes were identified with the FindMarkers function, and the cluster-specific overrepresented GO biological process was calculated with the clusterProfiler package (version 4.2.2).14 We applied the gene set variation analysis (GSVA) to assess the relative pathway activities in the myeloid cells. The gene set lists were derived from the 50 hallmark gene sets in MSigDB databases.17
Analysis of Immune Cell Characteristics
To verify differences in the immunity of CXCL13 T high and low groups, we used the “Single sample gene set enrichment analysis ” algorithm through GSVA for tumor infiltration lymphocytes analysis and the “Estimate” package to calculate the immune score based on the expression level of RNA-seq.18
Definition of cell signature and cell function score
The signature of CXCL13 T cells, SPP1+TAMs, CXCL9 TAMs, and cDCs was based on the top differentially expressed genes in each cluster. We calculated the exhaustion score and effector memory score through “AddModuleScore” based on a set of T-cell exhaustion-related genes and effector/memory-related genes.19 The gene used for angiogenesis and phagocytosis scores were based on MsigDB. The M1/M2 signatures were acquired from Azizi and Zhang et al’s research20 (Supplementary Table 1, http://links.lww.com/HC9/A241).
Correlation analysis
We calculated the average expression of signature genes of corresponding immune cell clusters in bulk RNA-seq data. Pearson correlation analysis was applied to further confirm the correlation between distinct immune cell types.
Survival analysis
We acquired the SKCM, BRCA, CHOL, and HNSC datasets from The Cancer Genome Atlas (TCGA) datasets. The Cox proportional hazards model implemented in the R package ‘survival’ was used to perform survival analysis. Kaplan-Meier analysis was used to compare survival, and the Log-rank test p value was calculated.
IHC and multicolored IHC analysis
The 5 um non-stained formalin-fixed and paraffin-embedded slides were applied for immune staining. Paraffin sections were then placed in a 70°C paraffin oven for 1 hour, followed by deparaffinized in xylene and then rehydration. Ag was recovered with citric acid buffer (pH 6.0) in the oven for 60 minutes. Inactivate endogenous peroxidase by incubation in 3% H2O2 for 15 minutes. After preincubation with 10% normal goat serum to block nonspecific sites for 10 minutes, sections are incubated overnight with primary antibodies including anti-CD8 antibody (Abcam, cat.189926), anti-CD4 antibody (Abcam, cat.133616), anti-Anti-Osteopontin antibody (Abcam, cat.269411), anti-CD68 antibody (Abcam,cat.213363), anti-BCA1 (Abcam, cat.246518), and antibody CD19 (Abcam, cat.134114) in a humidified chamber at 4°C. Secondary HRP-conjugated antibodies were added and incubated at room temperature for 10 minutes. For multicolored IHC analysis, fluorophore-conjugated TSA were used after incubation with secondary antibodies. After washing with PBS twice, the images were visualized using the TissueFAXS platform (TissueGnostics).
Statistical analysis
All statistical analysis was performed in SPSS version 24.0 software (SPSS, Inc., Chicago, IL, USA). Wilcoxon test and Kruskal-Wallis test were used for group comparison. All reported p value were 2-tailed, and the statistical significance was defined as p value less than 0.05.
RESULTS
Initial analysis of scRNA-seq data
We generated scRNA-seq data from liver metastasis lesions before and after aPD-1 therapy and 19648 high-quality single-cell transcriptome data were obtained (Figure 1A). After unsupervised clustering, 6 main cell subsets were identified, including myeloid cells, NK/T cells, epithelial cells, neutrophil cells, hepatocytes, and B cells (Figure 1B, C). We noted that after aPD-1 therapy, NK/T cells took the majority part in cell populations, while the epithelial cells almost cannot be identified (Figure 1D, E), indicating the efficacy of aPD-1 therapy in this patient.
aPD-1 therapy increases overall T-cell infiltrations in the GCLM microenvironment
NK/T cells included 3 main clusters CD8, CD4 T cells, and NK cells (Figure 2A). The results showed an increase in the proportion of CD8+ T cells and NK cells but not CD4+ T cells (Figure 2B), consistent with previous opinions that CD8+T-cell infiltration into tumors could predict survival and response to immunotherapy.21,22
FIGURE 2.
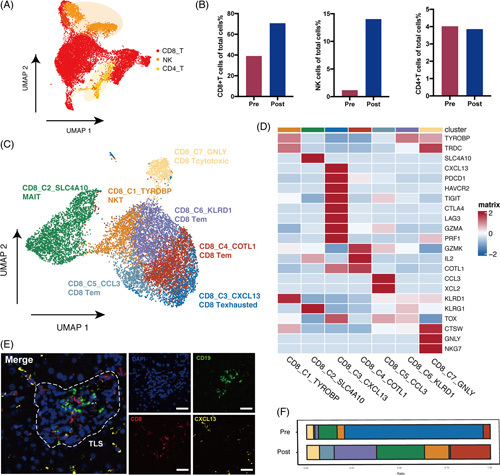
(A) UMAP plot of NK/T cell clusters, including CD4, CD8 T cells, and NK cells. (B) Comparison of the percentage of CD4, CD8 T cells, and NK cells in total cells between pre-aPD-1 and post-aPD-1 therapy samples. (C) UMAP plot of CD8+T cell clusters. (D) Heatmap of the top characteristic gene in each cell type. (E) Representative mIHC image of CXCL13+CD8+T cells stained with CD8, CXCL13, and CD19. Scale bar, 20 μm. (F) Proportion of each cell type in pre-aPD-1 and post-aPD-1 therapy samples, Abbreviations: aPD-1, anti-programmed cell death 1 protein; mIHC, multicolored immunohistochemistry.
The subclustering of CD8+T cells identified 7 subclusters: the NKT cluster (CD8_C1_TYROBP) was characterized by the high expression of TYROBP, TRDC, and CD3D; the mucosal-associated invariant T cluster (CD8_C2_SLC4A10) was characterized by specific expression of SLC4A10; the exhausted T-cell cluster (CD8_C3_CXCL13) was with high expression of exhaustion gene PDCD1, CTLA4, HAVCR2, and LAG3; the cytotoxic T cluster (CD8_C7_GNLY) was characterized by the expression of cytotoxic genes GNLY and NKG7; and the 3 effector/memory T clusters (Tem) (CD8_C4 COTL1, CD8_C5_CCL3, and CD8_C6_KLRD1) were characterized by low levels of naive markers SELL, TGF7, CCR7, LEF1, and high expression of cytokines and effector genes IL-2, CCL5, XCL1, and GZMK (Figure 2C, D).
There was an increased proportion of effector and memory T cells, cytotoxic T cells, and a decrease of exhausted T cells (Tex) after therapy (Figure 2F). The high level of CXCL13+CD8 T cells at baseline was reported to predict better responses to the immunotherapy.23 The phenomenon of decrease of exhausted T cells after aPD-1 therapy was also consistent with the report in Zhang et al’s study that responsive tumors were with high terminal Tex infiltration in baseline.23 We further confirmed the presence of CD8-CXCL13 T cells by multicolor IHC staining, formatting a tertiary lymphoid structures, which was reported to correlate to better response to immunotherapy (Figure 2E, Figure. S1A, http://links.lww.com/HC9/A240).24
Enhanced cytotoxicity of CD8+T cells following aPD-1 therapy
We examined treatment-induced transcriptional dynamics following aPD-1 therapy in Tem and Tex clusters (Figure 3A). Although pre-CD8 Tex still had high expression of GZMB and PRF, it is reported that transcriptional features are not always directly transformed into functional capabilities in dysfunctional T cells.25 Compared with others, post-Tem showed enhanced cytotoxicity. Transcriptomic analysis indicated that effector and memory-related genes of IL-2, TNF, IFNG, GZMK, and CD44; transcription factors of TBX21 and BCL6; TCR signaling-related genes of NR4A1, NR4A3; co-stimulatory molecules of CD28 and TNFRSF4, TNFRSF14; as well as HLA genes and integrins were upregulated, while exhaustion-related genes were downregulated after aPD-1therapy. This performance is confirmed by the decreased exhaustion score and increased effector memory score (Figure 3B).
FIGURE 3.
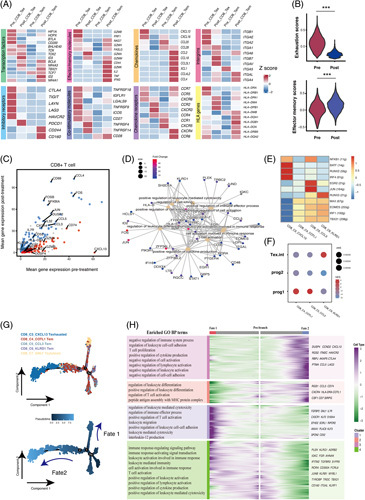
(A) Heatmap of transcriptomic expression of genes in pre-aPD-1 and post-aPD-1 therapy effector/memory T cells and exhausted T cells. (B) Violin plot of the effector memory score and exhaustion score of CD8+T cells (Wilcoxon test). (C) Scatterplots of differentially expressed genes of CD8+T cells between pre-aPD-1 and post-aPD-1 therapy tumors. The red dot represents upregulated genes in the pre-aPD-1 tumor, while the blue dot represents upregulated genes in the post-aPD-1 tumor (adjust p value < 0.05 and average log2FC>1.2). (D) The enriched pathway with genes upregulated in CD8+T cells in the post-aPD-1 tumor. (E) Heatmap of the AUC scores of TF motifs estimated per cell by SCENIC in Tex and Tem clusters. (F) GSEA enrichment of Tem and Tex subsets with signatures previously reported by literature. p values were calculated by a 1-tailed permutation test by GSEA. (G) Pseudotime analysis of 5 major CD8+T cell clusters showed 2 differentiation trajectory fates. (H) The branched heatmap showed changes in both lineages. The hierarchically clustered genes were shown on the right side. GO-enriched pathways of each cluster were shown on the left side. Abbreviations; aPD-1, anti-programmed cell death 1 protein; GSEA, gene set enrichment analysis; NES, normalized enrichment score; SCENIC: Single-cell regulatory network inference and clustering.
Compared with pre-aPD-1 tumors, CD8+T cells in post-aPD-1 tumors upregulated genes associated with T-cell activation: CD69 and HLA-DRA; T cell chemokines such as CCL3, CCL4, ad CCL5; oxidative phosphorylation pathway such as FOS, JUN, and NFKB126; innate-like and memory T cell phenotype KLRB1 and IL7R,27 while genes associated with immunosuppressive functions such as HAVCR2, TIGIT, and LAG3 were downregulated, suggesting low inhibitory signals (Figure 3C). In addition, genes upregulated after the treatment were enriched in pathways of T-cell activation, positive regulation of cytokine production, leukocyte-mediated cytotoxicity, immune effector process, and leukocyte differentiation, further suggesting its augmented effector property after aPD-1 blockade treatment (Figure 3D).
Expanded Tem cluster in transitory status with progenitor Tex characteristics
Our result revealed that Tem largely expanded after aPD-1 therapy. As aPD-1 was reported to enhance antitumor immunity by targeting precursor exhausted T cells,28,29 we further investigate whether they have similar properties with precursor Tex. SCENIC analysis in 3 Tem and Tex clusters identified that EOMES and TBX21 were highly expressed in Tem clusters, which were the key transcriptional factors in the developmental biology of exhausted T cells (Figure 3E). The GSEA analysis with reported signature genes of precursor Tex cells (progenitor and transitory) revealed that CD8_C3_CCL3 Tem and CD8_C4_COTL1 Tem shared the highest similarities with Tex prog1, while CD8_C6_KLRD1 Tem was similar to intermediate Tex cells (Figure 3F).30 The transcriptional expression also showed that Tem clusters were with a low expression of coinhibitory molecules and a high expression of effector molecules (Figure 3A).
The pseudotime trajectory analysis identified 2 fates in CD8+T cells (Figure 3G). Fate1 cells differentiate towards GNLY+T cells, characterized by the high expression of FGFBP2, GNLY, CX3CR,1, and KLRG1, correlated with T-cell activation, immune effector process, and leukocyte-mediated cytotoxicity signals. Fate2 cells differentiate towards CXCL13 T cells, characterized by the high expression of HAVCR2, CTLA4, LAG,3, and CXCL13, enriched in T-cell activation, cytokine production, as well as negative regulation of immune system process pathways (Figure 3H). The results indicated that 3 Tem clusters were in transitory status with the capacity to differentiate into either cytotoxic cells or exhausted cells.
aPD-1 therapy changes the composition and transcriptional profile of myeloid cells
The subclustering of the myeloid cells revealed 8 clusters (Figure 4A). The macrophage clusters were enriched in the baseline sample, while monocyte clusters took the majority in myeloid cells after aPD-1 therapy (Figure 4B). SPP1+TAMs highly expressed SPP1 and TREM2, representing antiinflammatory macrophages, were reported to be malignantly associated, and were exclusively enriched in colorectal liver metastasis (Figure 4C).19,20 Multicolored IHC confirmed the existence of the SPP1+TAM subset in GLM (Figure 4D, Figure S1, http://links.lww.com/HC9/A240). Bulk RNA-seq datasets from 2 intrahepatic cholangiocarcinoma (ICC) cohorts (Fu-ICCA and E-MTAB-6389) showed that patients with high filtrations of SPP1+TAMs were associated with poor overall survival (Figure 4E).
FIGURE 4.
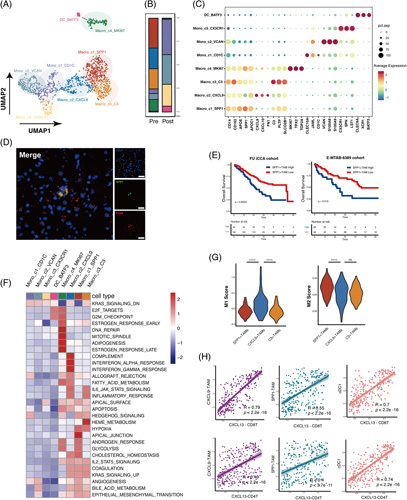
(A) UMAP plot of the myeloid compartment. (B) The relative proportion of the myeloid cells in each cluster. (C) Dot plot of expression of the marker gene in each cluster. (D) Representative multicolor IHC image of SPP1+TAM stained with SPP1 and CD68. Scale bar, 20 μm. (E) Kaplan-Meier survival curves for the OS of patients from the Fudan ICC cohort and E-MTAB-6389 cohort according to the level of intratumor SPP1+TAMs (Log-rank test and p values are shown). (F) The heatmap of GSVA of the 50 hallmark gene sets in MSigDB among 7 myeloid cell clusters. (G) Violin plot of M1 score and M2 score of 3 macrophage clusters (Kruskal-Wallis test). (H) Scatterplots of Pearson correlation between CD8+CXCL13+T cells and CD4+CXCL13+T cells with SPP1+TAMs, CXCL9+TAMs, and cDC1s in the Fudan ICC data based on the signature gene expressions. Abbreviations; aPD-1, anti-programmed cell death 1 protein; IHC, immunohistochemistry; ICC, intrahepatic cholangiocarcinoma.
CXCL9+TAMs expressed a high level of CXCL9 and CXCL10, chemokines known to mediate T-cell recruitment, presenting proinflammatory properties, were reported related to positive responses to immune checkpoint blockade in patients with melanoma and lung carcinoma.31,32 However, C3+TAMs also representing antiinflammatory macrophages were reported enriched in nonresponders with BRC.19 The GSVA showed that SPP1+TAMs were enriched with the hypoxia and glycolysis pathway; CXCL9+TAMs showed heightened activities of IFN-α, IFN-γ, and inflammatory signaling pathways and C3 TAMs were enriched with epithelial-mesenchymal transition IL6-JAK-STAT3 signaling (Figure 4F). SPP1+TAMs had a higher M2 score, while CXCL9 TAMs had a higher M1 score (Figure 4G). The findings indicated that the proportion between CXCL9+TAMs and SPP1+TAMs/C3+TAMs may influence the efficacy of immunotherapy. Based on the bulk RNA-seq data, SPP1+TAMs, CXCL9+TAMs, and cDC1s were found to be highly correlated with CXCL13 T cells (Figure 4H), indicating that CXCL13 T cells may be activated by specific myeloid cells as reported.33
aPD-1 therapy improved antitumor response in myeloid cells
Our results showed that the angiogenesis score was significantly reduced while the phagocytosis score was significantly enhanced, indicating an antitumor response in myeloid cells after aPD-1 therapy (Figure 5A). The immune checkpoint markers HAVCR2 and CD47, immunosuppressive myeloid markers like MRC1, TREM2, and GPNMB, and T-cell suppressive genes such as VEGFA and ENTPD were downregulated after aPD-1 therapy, while T-cell trafficking chemokine genes IL-32 and CCL5 were upregulated (Figure 5B). By comparing enriched GO pathways between pre-aPD-1 and post-aPD-1 therapy samples, we found that pre-therapy tumors highly expressed genes involved in pathways of Ag processing presentation, leukocyte-mediated immunity, while the post-aPD-1 therapy sample was involved in pathways of phagocytosis, T-cell activation, cytokine production, and immune response (Figure 5C).
FIGURE 5.
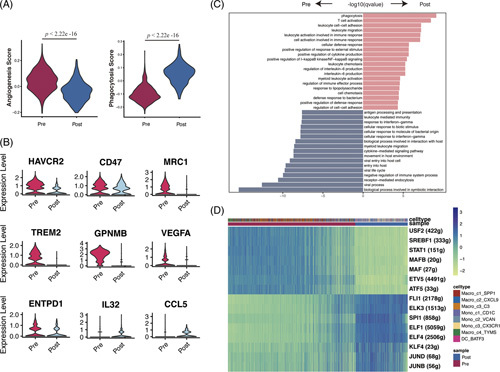
(A) Violin plot of angiogenesis score and phagocytosis score of myeloid cell clusters in the pre-aPD-1 and post-aPD-1 tumor (Wilcoxon test). (B) Expression of genes in myeloid cell clusters across the pre-aPD-1 and post-aPD-1 tumor (C) Enriched pathways in myeloid cells in pre-PD-1 therapy and post-aPD-1 therapy, calculated by Benjamini-Hochberg method and adjusted p value < 0.01. (D) Heatmap of the AUC scores of TF motifs in myeloid cells estimated per cell by SCENIC. Differentially activated TF motifs between pre-aPD-1 therapy and post-aPD-1 therapy were shown, respectively. Abbreviations; aPD-1, anti-programmed cell death 1 protein; SCENIC: Single-cell regulatory network inference and clustering.
We further performed SCENIC analysis to identify the essential motifs change after aPD-1 therapy in myeloid cells. JUND and JUNB, which induce proinflammatory chemokines and cytokines and thus promote M1 macrophage activation were upregulated, as well as stemness-inducing factors KLF4, core TF in macrophage lineage commitment SPI1, indicating a proinflammatory phenotype in myeloid cells after immunotherapy.34 While differentiation factors MAFB and MAF, which led to the differentiation of monocytes into TAMs and M2 macrophages, were downregulated.35,36 Thus, our observations elucidated that myeloid cells in GLM presented with proinflammatory characteristics after aPD-1 therapy (Figure 5D).
aPD-1 therapy potentially promotes T cell activity and alleviates suppressive microenvironment
CellChat analysis was performed to identify the change of receptor ligands in response to aPD-1 among all the immune cells. We compared the significant overall information flow of signaling pathways before and after aPD-1 therapy and investigated the signal flow pattern of each cluster (Figure 6A, B). The interactions enriched after PD-1 therapy included CD40-CD40L, driving the activation and priming of effector CD8+T cells; LIGHT-LTβR, normalizing tumor vasculature to promote tumor immune cells infiltration; CD48-CD244, regulation of effector/memory T-cell generation; LCK-CD8A/CD8B, related to TCR signaling and T-cell development; and XCR-XCL1/XCL2, involved in Ag cross-presentation. However, we also noted enhanced CSF1-CSFR1 interaction, which gives the tumor access to the vessels, and thus promotes tumor metastasis, indicating the potential therapeutic target (Figure 6C). In addition, several interactions were downregulated, including inhibitory receptor pathway BTLA-TNFRSF14 and TIGIT-NECTIN2; SPP1-CD44, mediating macrophage polarization and promoting immune escape; and GAS6-AXL and TGFb-TGFBR1/TGFBR2, related to immunosuppressive TME. The CellChat analysis revealed the transformation of ligands and receptors after aPD-1 therapy, suggesting an immunostimulatory status and providing a potential target for combined therapy.
FIGURE 6.
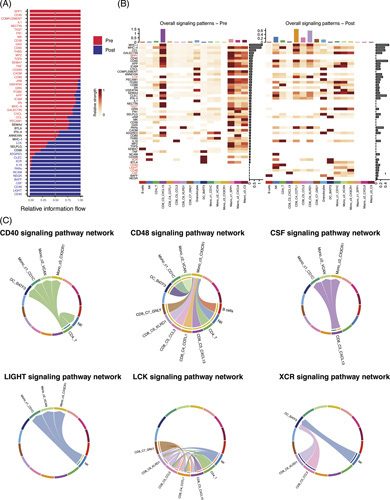
(A) The overall information flow of signaling pathways showed significant differences between pre-aPD-1and post-aPD-1 tumors. (B) The comparison of overall signaling associated with each cell cluster between pre-aPD-1 and post-aPD-1 tumor. (C) Visualization of upregulated signaling ligand-receptor pairs in chord diagram.
High CXCL13+T infiltrations are associated with inflammatory immune phenotype and predict favorable survival in BTC
We note that tumor-infiltrating CXCL13+CD8+T cells in GLM represented a highly exhausted subtype. We further investigated the influence of CXCL13+T cells in the TME of BTC. Immune infiltration of the TCGA cholangiocarcinoma cohort exhibited that TME, with a high level of CXCL13+T cell infiltration, correlated with more activated B cells, CD4 and CD8 T cells, DCs, and macrophages (Figure 7A), as well as with a significantly higher immune score calculated by Estimate Scoring (Figure 7B), indicating an immune-inflammatory phenotype. Similar results were found in extrahepatic cholangiocarcinoma cohorts (Supplementary Figure 2A, http://links.lww.com/HC9/A239). Further analysis in mRNA expression from the Fu-ICC cohort revealed a positive correlation between CXCL13 expression and antitumor immune response by T-cell infiltrations (Figure 7C). These data suggested that CXCL13 is associated with the enhanced cytotoxic activity of T cells. The survival analysis of the CHOL-TCGA and Fu-ICC cohort showed that a high level of tumor-infiltrating CXCL13+T cells represented significantly longer overall survival and progression-free survival than the low group (Figure 7D). This phenomenon suggested that high CXCL13+T cell infiltration constructed a “hot” immune TME and may be a favorable prognostic factor of BTC. We further confirmed this result in various cancers, including skin cutaneous melanoma, breast invasive carcinoma, and head and neck squamous cell carcinoma from TCGA (Supplementary figure 1B, http://links.lww.com/HC9/A239).
FIGURE 7.
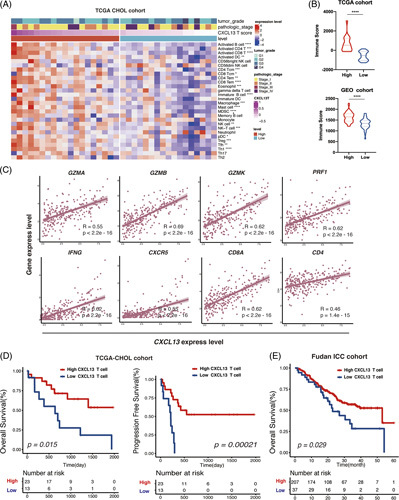
(A) Heatmap showing immune infiltration by ssGSEA analysis across stratification in TCGA-CHOL cohort. (B) Comparison of the ESTIMATE immune score in the TCGA cohort and GEO-eCCA cohort by CXCL13T stratification (Wilcoxon test). (C) Pearson correlation analysis of CXCL13+expression and CXCL13+with GZMA, GZMB, GZMK, PRF1, IFNG, CXCR5, CD8A, and CD4 from Fudan-iCCA cohort. (D) Kaplan-Meier survival curves for OS and PFS of patients from the TCGA-CHOL cohort and Fudan ICC cohort according to the level of intratumor CXCL13+Tcells (Log-rank test and p values are shown). *p < 0.05, **p < 0.01, ***p < 0.001, ****p < 0.0001. Abbreviation: eCCA extrahepatic cholangiocarcinoma; ssGSEA, Single sample gene set enrichment analysis.
High CXCL13+CD8+T-cell infiltrations correlated to favorable response to immunotherapy
Tumor-infiltrating CXCL13+T cells were assumed to interrelate with immunostimulatory contexture in BTC TME and bring better clinical outcomes, potentially benefiting from immunotherapy. The result of mIHC showed that the number of intratumoral CXCL13+CD8+T cells before immunotherapy was significantly higher in aPD-1 responders than that in nonresponders (Figure 8A), suggesting that CXCL13+CD8+T cells at baseline may be a prognostic factor of GLM to immunotherapy. Three published immunotherapy cohorts were applied to assess the predictive immunotherapeutic value of CXCL13+CD8+T cells in various tumor types. The result indicated that patients with a higher number of CXCL13+CD8+T cells also had significantly prolonged overall survival (Figure 8B). In addition, patients with a higher number of CXCL13+CD8+T cells had a significantly better response rate to immunotherapy (Figure 8C). In IMvigor 210 cohorts, patients with a higher number of CXCL13+CD8+T cells were associated with higher scores, including CD8 T effector, Ag presentation, and immune checkpoint, compared with the lower group (Figure 8D). These data suggest that CXCL13+CD8+T cell infiltrations are a predictive and prognostic biomarker for cancer immunotherapy in various types of cancers.
FIGURE 8.
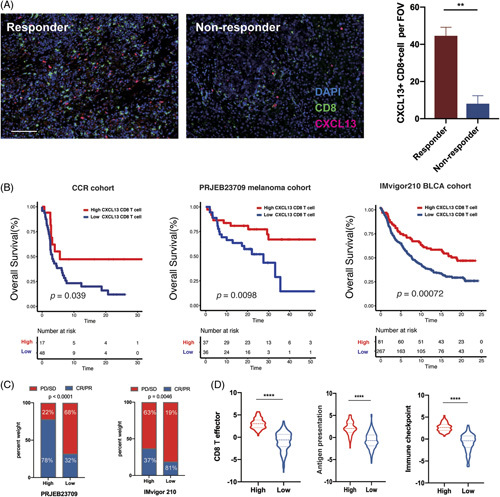
(A) Representative mIHC in responder and nonresponder treated with aPD-1 therapy. Scale bar,100 μm. The comparison of numbers of CXCL13+CD8+T cells in each group was shown in boxplots (Wilcoxon test). (B) Kaplan-Meier survival curves for the OS of patients from the CCR cohort, PRJEB23709, and IMvigor210 BLCA cohort according to the level of intratumor CXCL13+CD8+T cells (Log-rank test). (C) Rate of clinical response (CR/PR and SD/PD) with high or low CXCL13+CD8+T cells level in PRJEB23709 and IMvigor210 cohorts, respectively (chi-square Test). (D) Violin plot of CD8 effector, Ag presentation, and checkpoint score in pre-aPD-1 and post-aPD-1 tumors in IMvigor210 BLCA cohort (Wilcoxon test). Abbreviations; aPD-1, anti-programmed cell death 1 protein.
DISCUSSION
aPD-1 therapy triggered an antitumor immune response through the retrieval of cytotoxic T-cell function.37 In this study, the large expansion of Tem after aPD-1 therapy was unlikely from the reverse of terminal Tex due to its epigenetic stability.38 As aPD-1 therapy enhanced the recruitment of numerous tumor-reactive T cells with new clone phenotypes into the tumor, the potential resource of Tem may be the circulating system or lymphoid organ.23,39 PD-1 antibody takes priority to expand the progenitor and intermediate Tex subset, supporting the fact of a larger expansion of progenitor 1-like COTL1+Tem and CCL3+Tem and intermediate-like KLRD1+Tem.38 Our result was consistent with Zhang et al’s findings that precursor T cells accumulated after aPD-1 therapy in NSCLC. However, research in triple-negative breast cancer and basal cell carcinoma reported the expansion of terminal Tex after immunotherapy.40 This phenomenon may be explained by the intrinsic nature of cancer.
CXC Motif Chemokine Ligand 13 (CXCL13) plays an important role in the modulation of the tumor microenvironment.41 CXCL13 interacts with its ligand CXCR5 to modulate the activity of cytotoxic T cells.42,43 The infiltration of CXCL13+T cells was positively correlated to tertiary lymphoid structures, recruiting activated immune effectors to play an antitumor response. High CXCL13 expression was associated with prolonged clinical outcomes in high-grade serous ovarian cancer.43 In this study, we identify CXCL13+T cells as a potential prognostic marker in BTC, indicating the roles of CXCL13-producing T cells to form an immune-hot microenvironment for BTC. However, CXCL13+CD8+T cells were reported to be associated with poor survival in renal cell carcinoma.44
Our results provided CXCL13+CD8+T cells as a potential biomarker in the prognosis of immunotherapy. The TCGA analysis showed that immunotherapy-sensitive cancers such as melanoma and lung adenocarcinoma were with relatively high levels of CXCL13+CD8+T cells.19 High-level CXCL13+T cells in baseline were associated with better response in atezolizumab combined with paclitaxel in triple-negative breast cancer.19 Thommen et al also reported that PD-1+CXCL13+CD8+T cell indicated a potential response to immunotherapy in NSCLC.45 This phenomenon may be related to the expansion and activation of CXCR5+CD8 T cells.43
SPP1+TAMs were highly enriched in colorectal liver metastases and regarded as a potential factor of liver metastases with angiogenesis characteristics related to poor survival.46 The immune fluorescence staining of 264 patients with ICC revealed that high infiltration of SPP1+TAMs was associated with inferior outcomes, consistent with our result.47 SPP+1 TAMs were reported to interact with FAP+fibroblast cells, remodeling the extracellular matrix and inhibiting the infiltration of immune cells, leading to immunotherapy resistance.48 Another study in colorectal liver metastasis revealed that patients who respond to neoadjuvant chemotherapy showed a decrease of SPP1+macrophages, while the opposite results were observed in the nonresponders.49 CXCL9+TAMs, similar to C1QC+TAMs, were related to proinflammatory and antitumor activity. However, CXCL9 TAMs expressed a high level of genes associated with positive responses to immunotherapy.32,42 It is of note that the survival analysis in ICC indicated that the high-level infiltration of CXCL9+TAMs in baseline was associated with poor survival. Further investigation of these 2 macrophage subsets will contribute to revealing the mechanism of immunotherapy in liver metastases.
In conclusion, our study revealed the change of immune profiles in GLM with PD-1 blockade and identified CXCL13+T cells as a potential prognostic biomarker as well as CXCL13+CD8 T cells as a favorable predictor in response to immunotherapy in BTC. A larger cohort of aPD-1-treated BTC patients is needed to validate our findings in the future.
Supplementary Material
Acknowledgments
AUTHOR CONTRIBUTIONS
Lin Xie and Zhouyu Ning contributed to the paper equally.
CONFLICTS OF INTEREST
The authors have no conflicts to report.
Footnotes
Abbreviations: BTC, Biliary tract carcinoma; CXCL13, CXC Motif Chemokine Ligand 13; GBC, Gallbladder carcinoma; GLM, Gallbladder carcinoma liver metastases; GSEA, gene set enrichment analysis; GSVA, Gene set variation analysis; ICC, intrahepatic cholangiocarcinoma; IHC, Immunohistochemistry; mIHC, multicolored immunohistochemistry; NES, normalized enrichment score; PD-1, Programmed cell death 1 protein; SCENIC, Single-cell regulatory network inference and clustering; scRNA-seq, Single-cell RNA sequencing; ssGSEA, Single sample gene set enrichment analysis; TCGA, The Cancer Genome Atlas.
Supplemental Digital Content is available for this article. Direct URL citations are provided in the HTML and PDF versions of this article on the journal’s website, www.hepcommjournal.com.
Contributor Information
Lin Xie, Email: 20111230048@fudan.edu.cn.
Zhouyu Ning, Email: yuzhou3065@126.com.
Yongqiang Hua, Email: keqiang1215@126.com.
Peng Wang, Email: peng_wang@fudan.edu.cn.
Zhiqiang Meng, Email: mengshca@fudan.edu.cn.
REFERENCES
- 1.Wistuba II, Gazdar AF. Gallbladder cancer: lessons from a rare tumour. Nat Rev Cancer. 2004;4:695–706. [DOI] [PubMed] [Google Scholar]
- 2.Hundal R, Shaffer EA. Gallbladder cancer: epidemiology and outcome. Clin Epidemiol. 2014;6:99. [DOI] [PMC free article] [PubMed] [Google Scholar]
- 3.Goetze TO, Paolucci V. Adequate extent in radical re-resection of incidental gallbladder carcinoma: analysis of the German Registry. Surg Endosc. 2010;24:2156–2164. [DOI] [PubMed] [Google Scholar]
- 4.Valle J, Wasan H, Palmer DH, Cunningham D, Anthoney A, Maraveyas A, et al. Cisplatin plus gemcitabine versus gemcitabine for biliary tract cancer. N Engl J Med. 2010;362:1273–1281. [DOI] [PubMed] [Google Scholar]
- 5.Kim RD, Chung V, Alese OB, El-Rayes BF, Li D, Al-Toubah TE, et al. A phase 2 multi-institutional study of nivolumab for patients with advanced refractory biliary tract cancer. JAMA Oncol. 2020;6:888–894. [DOI] [PMC free article] [PubMed] [Google Scholar]
- 6.Ueno M, Ikeda M, Morizane C, Kobayashi S, Ohno I, Kondo S, et al. Nivolumab alone or in combination with cisplatin plus gemcitabine in Japanese patients with unresectable or recurrent biliary tract cancer: a non-randomised, multicentre, open-label, phase 1 study. Lancet Gastroenterol Hepatol. 2019;4:611–621. [DOI] [PubMed] [Google Scholar]
- 7.Lin J, Long J, Wan X, Chen J, Bai Y, Wang A, et al. Classification of gallbladder cancer by assessment of CD8+ TIL and PD-L1 expression. BMC Cancer. 2018;18:1–10. [DOI] [PMC free article] [PubMed] [Google Scholar]
- 8.Wang J, Bo X, Wang C, Xin Y, Nan L, Luo R, et al. Low immune index correlates with favorable prognosis but with reduced benefit from chemotherapy in gallbladder cancer. Cancer Sci. 2020;111:219–228. [DOI] [PMC free article] [PubMed] [Google Scholar]
- 9.Macosko EZ, Basu A, Satija R, Nemesh J, Shekhar K, Goldman M, et al. Highly parallel genome-wide expression profiling of individual cells using nanoliter droplets. Cell. 2015;161:1202–1214. [DOI] [PMC free article] [PubMed] [Google Scholar]
- 10.Fan HC, Fu GK, Fodor SPA. Combinatorial labeling of single cells for gene expression cytometry. Science. 2015;347:1258367. [DOI] [PubMed] [Google Scholar]
- 11.McGinnis CS, Murrow LM, Gartner ZJ. DoubletFinder: doublet detection in single-cell RNA sequencing data using artificial nearest neighbors. Cell Syst. 2019;8:329–337. e324. [DOI] [PMC free article] [PubMed] [Google Scholar]
- 12.Korsunsky I, Millard N, Fan J, Slowikowski K, Zhang F, Wei K, et al. Fast, sensitive and accurate integration of single-cell data with Harmony. Nat Methods. 2019;16:1289–1296. [DOI] [PMC free article] [PubMed] [Google Scholar]
- 13.Trapnell C, Cacchiarelli D, Grimsby J, Pokharel P, Li S, Morse M, et al. The dynamics and regulators of cell fate decisions are revealed by pseudotemporal ordering of single cells. Nat Biotechnol. 2014;32:381–386. [DOI] [PMC free article] [PubMed] [Google Scholar]
- 14.Yu G, Wang L-G, Han Y, He Q-Y. clusterProfiler: an R package for comparing biological themes among gene clusters. OMICS. 2012;16:284–287. [DOI] [PMC free article] [PubMed] [Google Scholar]
- 15.Aibar S, González-Blas CB, Moerman T, Huynh-Thu VA, Imrichova H, Hulselmans G, et al. SCENIC: single-cell regulatory network inference and clustering. Nat Methods. 2017;14:1083–1086. [DOI] [PMC free article] [PubMed] [Google Scholar]
- 16.Jin S, Guerrero-Juarez CF, Zhang L, Chang I, Ramos R, Kuan CH, et al. Inference and analysis of cell-cell communication using CellChat. Nature Commun. 2021;12:1–20. [DOI] [PMC free article] [PubMed] [Google Scholar]
- 17.Liberzon A, Subramanian A, Pinchback R, Thorvaldsdóttir H, Tamayo P, Mesirov JP. Molecular signatures database (MSigDB) 3.0. Bioinformatics. 2011;27:1739–1740. [DOI] [PMC free article] [PubMed] [Google Scholar]
- 18.( INVALID CITATION 20,21).
- 19.Zhang Y, Chen H, Mo H, Hu X, Gao R, Zhao Y, et al. Single-cell analyses reveal key immune cell subsets associated with response to PD-L1 blockade in triple-negative breast cancer. Cancer Cell. 2021;39:1578–1593. e1578. [DOI] [PubMed] [Google Scholar]
- 20.Zhang L, Li Z, Skrzypczynska KM, Fang Q, Zhang W, O’Brien SA, et al. Single-cell analyses inform mechanisms of myeloid-targeted therapies in colon cancer. Cell. 2020;181:442–459. e429. [DOI] [PubMed] [Google Scholar]
- 21.Jansen CS, Prokhnevska N, Master VA, Sanda MG, Carlisle JW, Bilen MA, et al. An intra-tumoral niche maintains and differentiates stem-like CD8 T cells. Nature. 2019;576:465–470. [DOI] [PMC free article] [PubMed] [Google Scholar]
- 22.Herbst RS, Soria JC, Kowanetz M, Fine GD, Hamid O, Gordon MS, et al. Predictive correlates of response to the anti-PD-L1 antibody MPDL3280A in cancer patients. Nature. 2014;515:563–567. [DOI] [PMC free article] [PubMed] [Google Scholar]
- 23.Liu B, Hu X, Feng K, Gao R, Xue Z, Zhang S, et al. Temporal single-cell tracing reveals clonal revival and expansion of precursor exhausted T cells during anti-PD-1 therapy in lung cancer. Nature Cancer. 2022;3:108–121. [DOI] [PubMed] [Google Scholar]
- 24.Schumacher TN, Thommen DS. Tertiary lymphoid structures in cancer. Science. 2022;375:eabf9419. [DOI] [PubMed] [Google Scholar]
- 25.Van der Leun AM, Thommen DS, Schumacher TN. CD8+ T cell states in human cancer: insights from single-cell analysis. Nat Rev Cancer. 2020;20:218–232. [DOI] [PMC free article] [PubMed] [Google Scholar]
- 26.Dougherty JA, Kilbane Myers J, Khan M, MG, Angelos MG, Chen C-A. Dual-specificity phosphatase 4 overexpression in cells prevents hypoxia/reoxygenation-induced apoptosis via the upregulation of eNOS. Front Cardiovasc Med. 2017;4:22. [DOI] [PMC free article] [PubMed] [Google Scholar]
- 27.Ruiz AL, Soudja SM, Deceneux C, Lauvau G, Marie JC. NK1. 1+ CD8+ T cells escape TGF-β control and contribute to early microbial pathogen response. Nat Commun. 2014;5:1–13. [DOI] [PMC free article] [PubMed] [Google Scholar]
- 28.Im SJ, Hashimoto M, Gerner MY, Lee J, Kissick HT, Burger MC, et al. Defining CD8+ T cells that provide the proliferative burst after PD-1 therapy. Nature. 2016;537:417–421. [DOI] [PMC free article] [PubMed] [Google Scholar]
- 29.Miller BC, Sen DR, Al Abosy R, Bi K, Virkud YV, LaFleur MW, et al. Subsets of exhausted CD8+ T cells differentially mediate tumor control and respond to checkpoint blockade. Nat Immunol. 2019;20:326–336. [DOI] [PMC free article] [PubMed] [Google Scholar]
- 30.Beltra J-C, Manne S, Abdel-Hakeem MS, Kurachi M, Giles JR, Chen Z, et al. Developmental relationships of four exhausted CD8+ T cell subsets reveals underlying transcriptional and epigenetic landscape control mechanisms. Immunity. 2020;52:825–841. e828. [DOI] [PMC free article] [PubMed] [Google Scholar]
- 31.Peperzak V, Veraar EAM, Xiao Y, Bąbała N, Thiadens K, Brugmans M, et al. CD8+ T cells produce the chemokine CXCL10 in response to CD27/CD70 costimulation to promote generation of the CD8+ effector T cell pool. J Immunol. 2013;191:3025–3036. [DOI] [PubMed] [Google Scholar]
- 32.House IG, Savas P, Lai J, Chen AXY, Oliver AJ, Teo ZL, et al. Macrophage-derived CXCL9 and CXCL10 are required for antitumor immune responses following immune checkpoint blockade. Clin Cancer Res. 2020;26:487–504. [DOI] [PubMed] [Google Scholar]
- 33.Ferris ST, Durai V, Wu R, Theisen DJ, Ward JP, Bern MD, et al. cDC1 prime and are licensed by CD4+ T cells to induce anti-tumour immunity. Nature. 2020;584:624–629. [DOI] [PMC free article] [PubMed] [Google Scholar]
- 34.Tugal D, Liao X, Jain MK. Transcriptional control of macrophage polarization. Arterioscler Thromb Vasc Biol. 2013;33:1135–1144. [DOI] [PubMed] [Google Scholar]
- 35.Hou P, Luo L, Chen H, Chen Q, Bian X, Wu S, et al. Ectosomal PKM2 promotes HCC by inducing macrophage differentiation and remodeling the tumor microenvironment. Mol Cell. 2020;78:1192–1206. e1110. [DOI] [PubMed] [Google Scholar]
- 36.Aziz A, Soucie E, Sarrazin S, Sieweke MH. MafB/c-Maf deficiency enables self-renewal of differentiated functional macrophages. Science. 2009;326:867–871. [DOI] [PubMed] [Google Scholar]
- 37.McLane LM, Abdel-Hakeem MS, Wherry EJ. CD8 T cell exhaustion during chronic viral infection and cancer. Annu Rev Immunol. 2019;37:457–495. [DOI] [PubMed] [Google Scholar]
- 38.Pauken KE, Sammons MA, Odorizzi PM, Manne S, Godec J, Khan O, et al. Epigenetic stability of exhausted T cells limits durability of reinvigoration by PD-1 blockade. Science. 2016;354:1160–1165. [DOI] [PMC free article] [PubMed] [Google Scholar]
- 39.Li J, Byrne KT, Yan F, Yamazoe T, Chen Z, Baslan T, et al. Tumor cell-intrinsic factors underlie heterogeneity of immune cell infiltration and response to immunotherapy. Immunity. 2018;49:178–193. e177. [DOI] [PMC free article] [PubMed] [Google Scholar]
- 40.Bassez A, Vos H, Van Dyck L, Floris G, Arijs I, Desmedt C, et al. A single-cell map of intratumoral changes during anti-PD1 treatment of patients with breast cancer. Nat Med. 2021;27:820–832. [DOI] [PubMed] [Google Scholar]
- 41.Tan P, Shi M, Lai L, Tang Z, Xie N, Xu H, et al. Regulative role of the CXCL13-CXCR5 axis in the tumor microenvironment. Prec Clin Med. 2018;1:49–56. [DOI] [PMC free article] [PubMed] [Google Scholar]
- 42.Qu Y, Wen J, Thomas G, Yang W, Prior W, He W, et al. Baseline frequency of inflammatory Cxcl9-Expressing tumor-associated macrophages predicts response to Avelumab treatment. Cell Rep. 2020;32:107873. [DOI] [PubMed] [Google Scholar]
- 43.Yang M, Lu J, Zhang G, Wang Y, He M, Xu Q, et al. CXCL13 shapes immunoactive tumor microenvironment and enhances the efficacy of PD-1 checkpoint blockade in high-grade serous ovarian cancer. J Immunother Cancer. 2021;9:e001136. [DOI] [PMC free article] [PubMed] [Google Scholar]
- 44.Dai S, Zeng H, Liu Z, Jin K, Jiang W, Wang Z, et al. Intratumoral CXCL13+ CD8+ T cell infiltration determines poor clinical outcomes and immunoevasive contexture in patients with clear cell renal cell carcinoma. J Immunother Cancer. 2021;9:e001823. [DOI] [PMC free article] [PubMed] [Google Scholar]
- 45.Thommen DS, Koelzer VH, Herzig P, Roller A, Trefny M, Dimeloe S, et al. A transcriptionally and functionally distinct PD-1+ CD8+ T cell pool with predictive potential in non-small-cell lung cancer treated with PD-1 blockade. Nat Med. 2018;24:994–1004. [DOI] [PMC free article] [PubMed] [Google Scholar]
- 46.Liu Y, Zhang Q, Xing B, Luo N, Gao R, Yu K, et al. Immune phenotypic linkage between colorectal cancer and liver metastasis. Cancer Cell. 2022;40:424–437. e425. [DOI] [PubMed] [Google Scholar]
- 47.Sun BY, Zhou C, Guan RY, Liu G, Yang ZF, Wang ZT, et al. Dissecting intra-tumoral changes following immune checkpoint blockades in intrahepatic cholangiocarcinoma via single-cell analysis. Front Immunol. 2022;13:871769; 1767. [DOI] [PMC free article] [PubMed] [Google Scholar]
- 48.Qi J, Sun H, Zhang Y, Wang Z, Xun Z, Li Z, et al. Single-cell and spatial analysis reveal interaction of FAP+ fibroblasts and SPP1+ macrophages in colorectal cancer. Nat Commun. 2022;13:1–20. [DOI] [PMC free article] [PubMed] [Google Scholar]
- 49.Wu Y, Yang S, Ma J, Chen Z, Song G, Rao D, et al. Spatiotemporal immune landscape of colorectal cancer liver metastasis at single-cell level. Cancer Discov. 2022;12:134–153. [DOI] [PubMed] [Google Scholar]
Associated Data
This section collects any data citations, data availability statements, or supplementary materials included in this article.


