Abstract
Herein, we introduced a rapid detection method for residual trace levels of triazophos in water and agricultural products using an immunoassay based on catalytic hairpin self-assembly (CHA). The gold nanoparticles (AuNPs) surface was modified with triazophos antibody and sulfhydryl bio-barcode, and an immune competition reaction system was established between triazophos and its ovalbumin-hapten (OVA-hapten). The bio-barcode served as a catalyst to continuously induce the CHA reaction to achieve the dual signal amplification. The method does not rely on the participation of enzymes, and the addition of fluorescent materials in the last step avoids interfering factors, such as a fluorescence burst. The emitted fluorescence was detected at 489/521 nm excitation/emission wavelengths. The detection range of the developed method was 0.01-50 ng/mL for triazophos, and the limit of detection (LOD) was 0.0048 ng/mL. The developed method correlates well with the results obtained by LC-MS/MS, with satisfactory accuracy (expressed as recovery %) and sensitivity. In sum, the designed method is reliable; meanwhile, it provides a new approach to detect pesticide residues rapidly and quantitatively.
Keywords: Catalyzed hairpin self-assembly, Enzyme-free amplification, Fluorescence detection, Triazophos, Gold nanoparticles
1. Introduction
Triazophos, a moderately toxic broad-spectrum organophosphate (OP) pesticide, is mainly used to reduce pest population and diseases in rice and other agricultural products. Owing to its long residual half-life, it might have a toxicological impact on human health and the environment [1]. Presently, OP residues have become an essential issue in food safety in China, which necessitated developing a rapid method for detecting residues.
Pesticide residues are basically identified, confirmed, and quantified using conventional analytical methods, such as gas chromatography (GC) [2], high-performance liquid chromatography (HPLC) [3], gas chromatography-tandem mass spectrometry (GC-MS/MS) [4], liquid chromatography-tandem mass spectrometry (LC-MS/MS) [5,6]. However, these instruments are expensive and require skilled technicians; the analysis time is long, making them unrealistic and inconvenient for rapid on-site screening. With the development of enzyme inhibition technology [7], much attention has been paid to immunoassays, such as enzyme-linked immunosorbent assay (ELISA) [8], biosensors [9], and other rapid detection techniques [10,11] based on modern biotechnology, as they are fast, simple, cost-effective. However, the risk of false-positive results is high, and sensitivity is insufficient to meet the in-situ detection of trace pesticides. Therefore, developing a sensitive and straightforward method for rapidly detecting ultra-residual levels of harmful pesticide residues in various matrices is crucial.
As one of the rapid detection techniques for pesticide residues, bio-barcode technology was first proposed by Chad Mirkind [12] in 2003 and was successfully applied to detect prostate-specific antigens through monoclonal and polyclonal antibodies corresponding to the target protein. Furthermore, based on the high sensitivity and specificity, the bio-barcode assay has been used for quantitative detection of proteins [13], nucleic acids [14], biotoxins [15], and other substances [16] through continuous improvement models combined with various technological designs.
Pesticides and other small molecules are not suitable for the sandwich detection mode due to steric hindrance. To overcome this problem, our group has used a competitive model instead of a traditional sandwich structure to detect small molecule pesticides quantitatively. Combined with magnetic nanoparticles (MMPs), small molecule pesticides, and AuNPs, we established a high sensitivity bio-barcode immunoassay based on real-time fluorescence quantitative (RT-PCR) [17], droplet digital PCR (ddPCR) [18], and microplate silver staining [19], respectively. Further, we have developed a multi-residual method for detecting OPs (such as triazophos, parathion, and chlorpyrifos) based on bio-barcode oligonucleotide fluorescent probes [20]. This assay showed good recovery and substantially improved the sensitivity compared with traditional ELISA and instrumental methods. It also has good applicability and accuracy for monitoring agricultural products, such as fruits and vegetables. Nevertheless, the above-reported methods also have some limitations, such as more complex experimental operations or instability of fluorescent materials.
Isothermal amplification of nucleic acid was based on its amplification capacity using different design approaches to amplify its signal. It includes hybridization chain reaction (HCR) [21], rolling circle amplification (RCA) [22], loop-mediated isothermal amplification (LAMP) [23], catalytic hairpin self-assembly (CHA) [24] and others. CHA, developed based on the HCR technique, is activated by the target chain at a constant temperature and hybridizes with two hairpin structures in sequence. The target chain acts as a “catalyst” in the whole reaction, generating multiple signal amplification without the need for enzyme amplification. The technique is simple, highly sensitive, cheap, and allows rapid amplification reactions. It has particular potential for medical diagnosis, environmental monitoring, and food safety applications.
Therefore, an immunoassay method was developed based on dual signal amplification using bio-barcode and CHA for rapid and sensitive determination of triazophos (Scheme 1). The triazophos OVA-hapten was conjugated on the surface of a 96-MicroWell™ black plate. As small molecules (such as pesticides) have only one antigenic determinant cluster, they can compete with triazophos OVA-hapten to bind triazophos monoclonal antibodies (mAbs) to establish an immune competitive reaction system. After washing away the unbound material, dithiothreitol (DTT) and labeled fluorescent hairpin structures were added to the microplate. DTT releases the SH-DNA modified on the AuNPs from the complexes and catalyzes the amplification reaction by hybridizing the hairpin structure H1, H2. Driven by free energy, the bio-barcode as a target chain triggers the CHA reaction to amplify the signal. Since H2 was labeled with a fluorescent substance, pesticide quantification was performed based on the measured fluorescent signal. Remarkably, the fluorescence extinction was effectively reduced because the labeled fluorescent substance was added at the end of the reaction system step. Hence, this immunoassay provides a novel view in safeguarding agricultural products.
Scheme. 1.
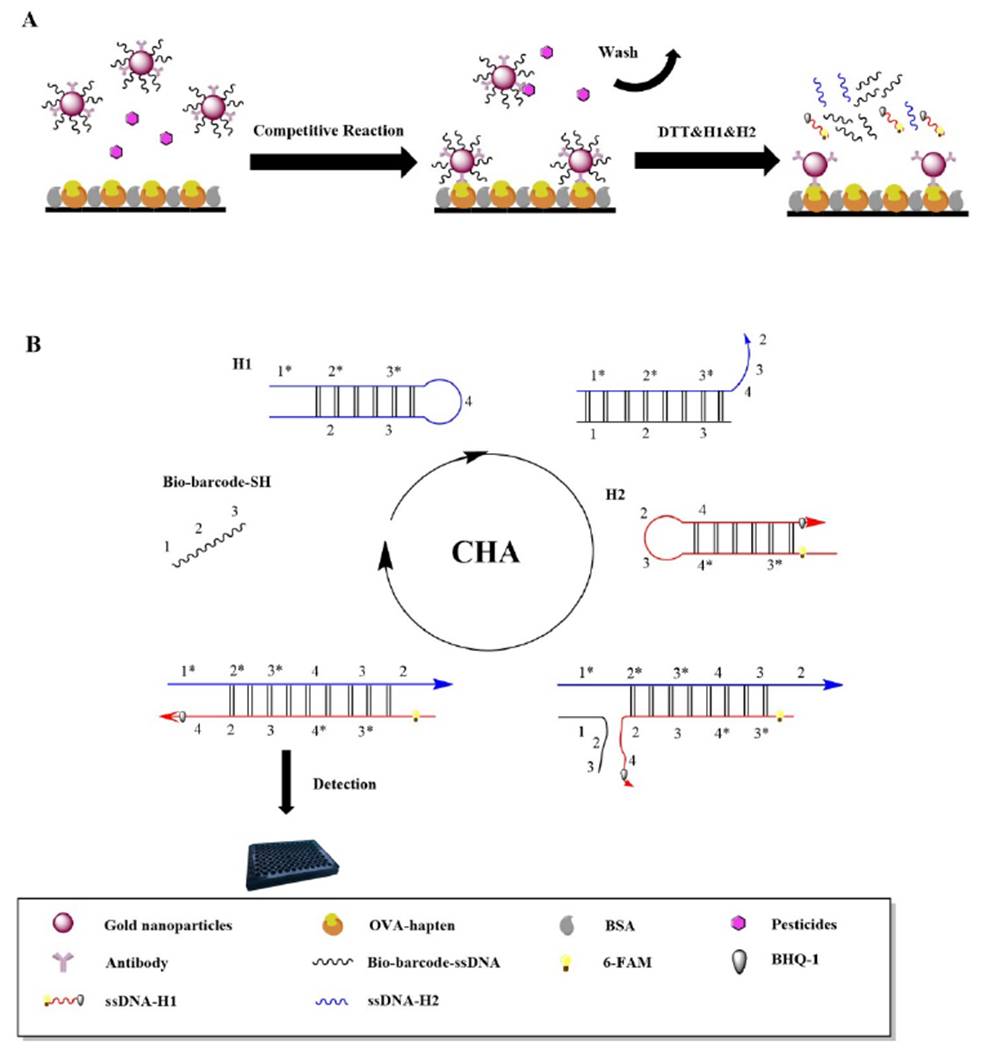
Schematic illustration of the competitive immunoassay CHA for detection of triazophos.
2. Experimental
2.1. Materials and reagents
Concentrated hydrochloric acid and nitric acid were purchased from Beijing Chemical Reagent Factory (Beijing, China). Methanol, HPLC-grade acetonitrile (ACN), formic acid, and ammonium acetate were procured from Thermo Fisher Scientific (MA, USA). Sodium chloride (NaCl), magnesium chloride (MgCl2), potassium chloride (KCl), potassium carbonate (K2CO3), disodium hydrogen phosphate (Na2HPO4), potassium dihydrogen phosphate (KH2PO4), sodium bicarbonate (NaHCO3), anhydrous magnesium sulfate (MgSO4), sodium carbonate (NaCO3), and Tween-20 were acquired from Beijing Chemical Reagent Co., Ltd. (Beijing, China). N-Propylethylenediamine (PSA) and Octadecyltrimethoxysilane (C18) were obtained from Bonna-Agela Technologies (Tianjin, China). Polyethylene glycol 20000 (PEG 20000) and Tris-EDTA (TE) buffer (pH 7.4) were supplied by Solarbio (Beijing, China). Tris (2-carboxyethyl) phosphine (TCEP), dithiothreitol (DTT), chloroauric acid (HAuCl4-3H2O), trisodium citrate (Sodium Citrate), and bovine serum albumin (BSA) were purchased from Sigma-Aldrich (St. Louis, MO, USA). Triazophos analytical standard (98%) was provided by Dr. Ehrenstorfer GmbH (Augsburg, Germany). The triazophos OVA-haptens (GB85, 10 mg/mL) and mAbs (1.4 mg/mL) were generously donated by Beijing Kwinbon Biotechnology Co., Ltd. (Beijing, China), and the Institute of Pesticide and Environmental Toxicology (Zhejiang University, Zhejiang, China).
According to Chen et al. [25], the three DNA base sequences for the DNA strands that were used in our experimental work include (A) bio-barcode sulfhydryl DNA initiation strand, (B) catalytic hairpin structure H1, and (C) catalytic hairpin structure H2 (Table S1). All oligonucleotides were generated by Shanghai Sangon Biotechnology Co., Ltd. (Shanghai, China).
2.2. Functionalization of AuNPs probes
Herein, the AuNPs were carried out based on previously described by Nam et al. [12] with some minor modifications. Firstly, TE and TCEP solutions were dissolved in a 1:1 ratio of sulfhydryl modified bio-barcode DNA to a final concentration of 50 µM and then shaken well for 3 h for DNA activation. After shaking for 1.5 h, 1 mL of the bare AuNPs was passed through a 0.22 µm PES filter membrane, the pH was adjusted to 8.5-9.0 by adding 30 µL of 0.2 mol/L K2CO3 solutions, and then incubated for 1 h at room temperature. After 10-15 min of standing with 20.16 µg/mL of the triazophos monoclonal antibody, the mixture was vortex-mixed with slight shaking. At the end of the reaction, the sulfhydryl DNA strand (A) was added to the above mix, slowly mixed well, and left to stand for 16 h at 4°C. The next day, 30% PEG 20000 was added to the AuNPs to a final concentration of 0.5%, and the mixture aging was carried out by 24 h salt addition method at 4°C. After aging, 10% BSA was added to the mixture to a final concentration of 1%, incubated for 1 h at 37°C, and then centrifuged at 4°C for 15 min at 12000 rpm/min. The supernatant was discarded to remove the unmodified antibody and bio-barcode DNA sulfhydryl chain, and then 400 µL of probe suspension was added. The mixture was mixed well and stored at 4 °C.
2.3. Preparation of hairpin probes
All hairpin probes were centrifuged at 4000 rpm/min for 45-60 s. A stock solution of 50 μM H1 and H2 was prepared by adding distilled water and then denatured at 95°C for 5 min before use. Afterwards, the solution was slowly cooled at room temperature, folded into a stem-loop structure, and stored at 4°C. H1 and H2 were diluted to 0.5 µM using 40 mmol/L Tris-HCl (pH 8.5, containing Mg2+ 8 mmol/L and Na+ 100 mmol/L).
2.4. Fluorescence and agarose gel electrophoresis analysis
To assess the feasibility of CHA, we used fluorescence measurement and agarose gel electrophoresis. The bio-barcode SH-DNA was centrifuged at 4000 rpm for 30-60 s, dissolved in sterile water to 50 μM, and then diluted to 10-105 different multiples of bio-barcode SH-DNA by adding 5 μM H1 5 μL and 5 μM H2 15 μL and reacted at 37°C for 90 min. The fluorescence readings were detected at 489/521 nm excitation/emission wavelengths.
In agarose gel electrophoresis analysis, 3% agarose gel solution was prepared and stained with a diluted top red solution. After solidification, 9 μL of the sample was mixed with 1 μL 10×DNA loading buffer into each channel separately, at 110 mV in 1×TAE buffer (40 mM Tris-acetate, 1 mM EDTA, pH 8.0) for 40 min. Bio-Rad ChemDoc XRS imaged the gel.
2.5. Competitive bio-barcode immunoassay based on CHA
The prepared triazophos OVA-hapten (10 mg/mL) was diluted 8000 times with carbonate buffer solution, and 100 µL of each well was added to a 96-MicroWell™ black plate and wrapped overnight. The next day, the coating solution in the black plate was poured out and washed three times by washing buffer (0.01 mol/L PBST) and pat drying. After that, the black plate was blocked with 1% BSA for 1 h at 37°C to close excess protein binding sites. After the blocking was completed, the encapsulated solution was poured out of the black plate and washed three times with 0.01 mol/L PBST and pat drying. A 50 µL of a 10-fold dilution of AuNPs and 50 µL of pesticide diluent or sample solution was added to each well of a pat-dried microtiter plate. After 2 min of gentle shaking, the reaction was conducted at 37°C for 1 h in a constant humidity chamber. At the end of the competition reaction, the wells are rewashed 3 times with 0.01 mol/L PBST and patted dry. After that, 100 µL of 12.5 µM DTT solution was added to each well to dissociate the bio-barcode sulfhydryl DNA strand that was bound to the AuNPs, followed by the addition of 0.5 µM hairpin structure (H1 5 µL and H2 15 µL). Finally, the mixture was slowly mixed for 2 min in a humidity chamber set at 37°C for 90 min. After the reaction, the fluorescence was detected at 489/521 nm emission/absorption wavelengths in an Infinite M200 PRO Microplate reader (TECAN, Männedorf, Switzerland).
2.6. Real sample pre-treatment
To verify the applicability and accuracy of the bio-barcode immunoassay based on CHA, we have chosen laboratory tap water, apple, cucumber, cabbage, and rice samples. All samples were procured from local markets (Beijing, China) and confirmed to be free from triazophos by LC-MS/MS. According to the National Food Safety Standard Maximum Residue Limits for Pesticides in Food (GB 2763-2021) [26], the maximum residue limit for triazophos was set at 0.1 mg/kg. Thereby, three spiked concentrations have been set for high, medium, and low levels. The triazophos standard solution was added to laboratory tap water at a final concentration of 10, 50, and 100 µg/kg, mixed well and left to stand for more than 4 h. Then, the water samples were filtered and used directly for LC-MS/MS and the assay of this method. The pre-treatment method uses efficient, fast, safe, and simple QuEChERS [27]. For agricultural samples, homogenized samples (10 g) were weighed into 50 mL centrifuge tubes to which triazophos standard solutions were added at a final concentration of 10, 50, and 100 µg/kg. The mixture was left undisturbed for more than 4 h. After that, 10 mL acetonitrile was added, and the mixture was shaken for 5 min. Next, 4 g anhydrous MgSO4 and 1 g of NaCl were added, vortexed for 5 min, and centrifuged at 5000 rpm/min for 5 min at 4°C. Next, the supernatant was transferred to a new 5 mL centrifuge tube containing 100 mg PSA and 100 mg C18, shaken well for 5 min, and centrifuged at 5000 rpm/min for 5 min at 4°C. The supernatant was collected and filtered, and 1 mL was used for detection by LC-MS/MS. Another 100 µL was blown dry with nitrogen and re-dissolved in 5% methanol-phosphate-buffered saline (PBS) to 2 mL for detection by the immunoassay method used in this experiment.
3. Results and discussion
3.1. Characterization and optimization of AuNPs
The AuNPs before and after modification were characterized by Ultraviolet (UV), transmission electron microscope (TEM), and energy-dispersive X-ray spectroscopy (EDS). In Fig. 1a, the UV scan of the unlabeled AuNPs shows a maximum absorption peak at 520 nm, and the AuNPs probe labeled with triazophos mAbs and sulfhydryl ssDNA shows a maximum absorption peak at 528 nm. The maximum absorption of the modified AuNPs probe was shifted from 520 nm to 528 nm, and the color changed from burgundy to purplish red, indicating that the antibody and the bio-barcode sulfhydryl DNA strand have been modified on the surface of the AuNPs.
Fig. 1.
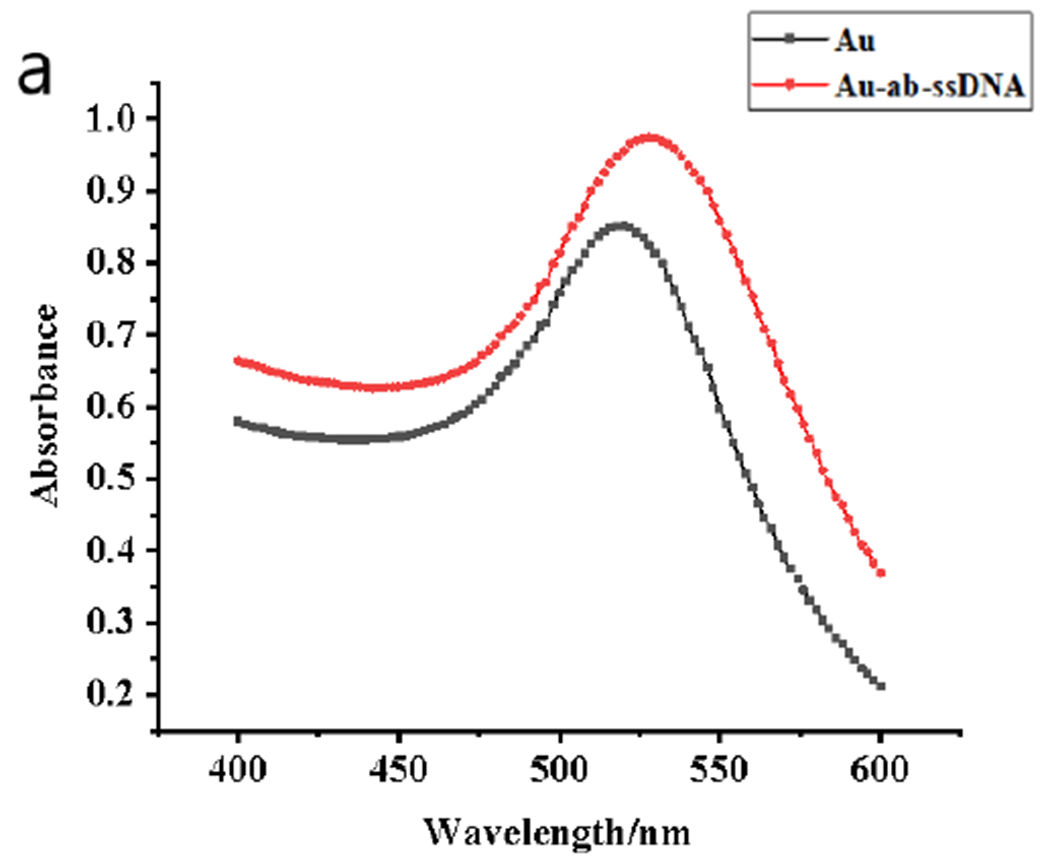
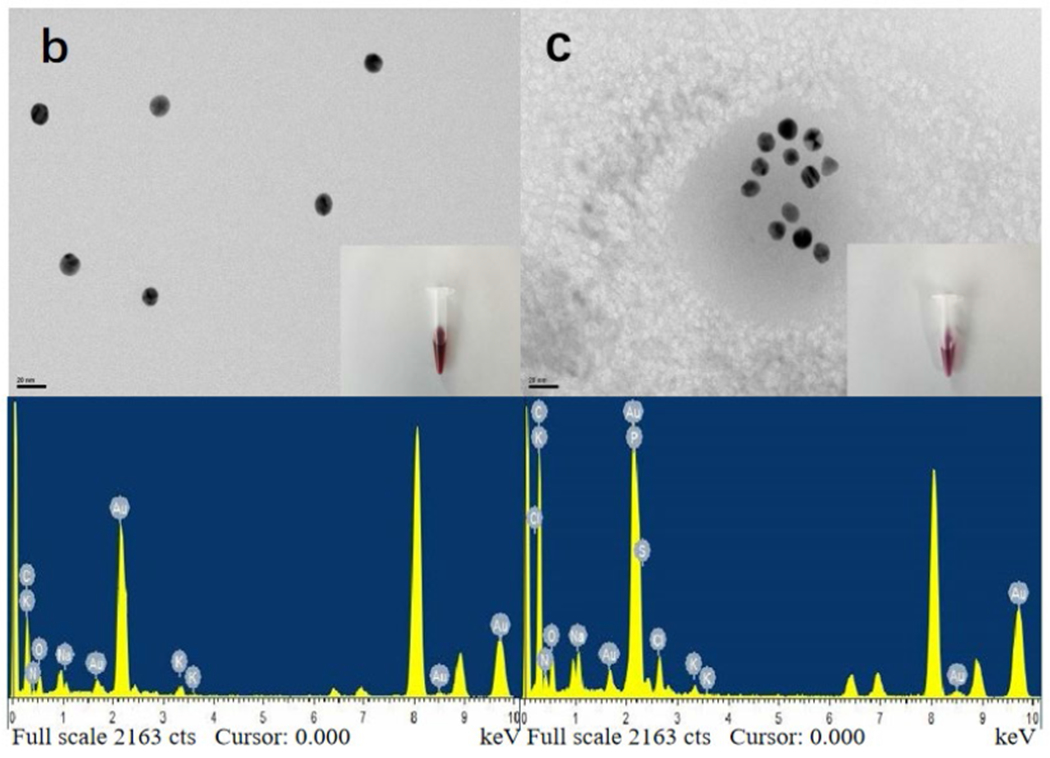
The UV-Vis spectra of bare AuNPs (black line) and AuNPs modified with antibodies and ssDNA (red line) (a), TEM images and EDS of bare AuNPs (b), and TEM images and EDS modified AuNPs probes (c).
The particle size of AuNPs before and after modification was 13 nm, with uniform particle size and good dispersion, and there was no aggregation for AuNPs. The TEM image (Fig. 1b) of the AuNPs after labeling the antibody and the bio-barcode thiol DNA chain shows a white aperture on the surface of the AuNPs because it is labeled with the antibody and the bio-barcode DNA chain. The EDS results of labeled AuNPs probe (Fig. 1c) have C, K, N, O, Na, Cl, compared to pre-labeling (Fig. 1b) and contain two characteristic elements: S and P elements represent ssDNA and mAbs labelled on AuNPs, respectively. It also proves that the mAbs and the ssDNA have been successfully modified on the surface of the AuNPs probe.
3.2. Optimization of antibody addition in the AuNPs
As the nanogold surface is modified with antibodies, a double electron layer will cover its surface. If the antibody addition is insufficient, the salt ions in the nanogold will disrupt the electron equilibrium. When the antibody addition is moderate or slightly in access, the AuNPs agglomeration is avoided. The optimal amount of triazophos pesticide was determined using colorimetric and a UV spectrophotometric method. In 1 mL of AuNPs, 30 μL of 0.2 mol/L K2CO3 was added to adjust the pH to 8.5-9.0 and left to stand for 10-15 min. Afterwards, antibody volumes of 2, 4, 6, 8, 10, 12, 14, and 16 μL were added. After mixing, 100 μL of 10% NaCl was added, and the changes were observed after standing for 1 h. The UV emission wavelengths were scanned at 400-600 nm. Fig. 2 shows that the nanogold solution with the addition of antibody amount 2-10 μL showed a blue color, due to the agglomeration phenomenon of nanogold, because of insufficient antibody amount. The nanogold solutions with antibodies of 12-16 μL were not agglomerated, and the solutions appeared purple-red. No color change was observed when the antibody solution was 12 μL, the minimum antibody concentration to stabilize 1 mL of AuNPs. The achieved concentration of monoclonal antibody to triazophos pesticide was 1.4 mg/mL. The optimal amount of antibody should be 120% of the above concentration in the actual experiment, so it was determined that the optimal protein concentration for antibody use was 20.16 μg/mL.
Fig. 2.
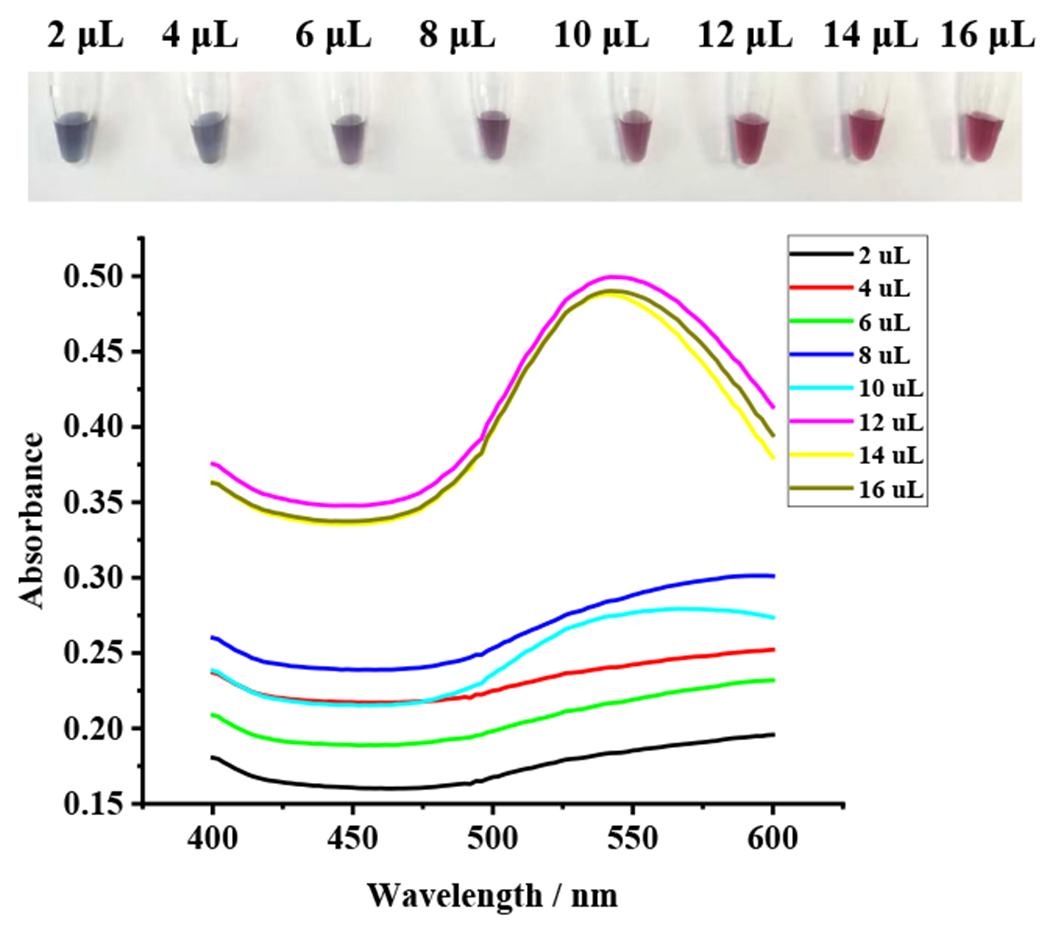
Optimization of the dose regimens of mAbs (1.4 mg/mL) modified by nanogold using colorimetric and UV spectrophotometric methods.
3.3. Feasibility analysis
Fluorescence and agarose electrophoresis analyses were conducted to verify the presence of the DNA strand. As shown in Fig. S1: with the increase of the concentration of target DNA, the fluorescence change intensity of the CHA reaction was evident, which proves that the H1 and H2 hairpin self-assembly structures are feasible when the target DNA is present. The agarose electrophoresis results are shown in the upper right corner of Fig. S1, H1 and H2 complemented the target strand when the target strand was added, opened the hairpin structure, and CHA reaction and DNA amplification occurred. Thus, the feasibility of the experiment was demonstrated.
3.4. Optimization of competition detection reaction parameters
A solution of the reaction system containing a particular concentration of methanol (commonly used to dissolve OPs) plays an essential role in the immune reaction of OVA-hapten and mAb. To optimize methanol content, 0.01 mol/L PBS buffer solutions with 0, 2.5, 5, 10, 20, and 40% pesticide concentrations (50 ng/mL) were prepared. The highest measured fluorescence intensity was recorded when the pesticide standard concentration buffer contained 5% methanol in 0.01 mol/L PBS (Fig. S2). The fluorescence intensity gradually decreased with increasing methanol concentration, indicating that the optimal amount of methanol promoted the reaction. In contrast, the excess of methanol hindered the reaction, so a PBS buffer containing 5% methanol was chosen as the most suitable concentration of the standard pesticide buffer.
The working concentrations of antibodies and OVA-hapten influenced competitive bio-barcode immunoassay’s reaction efficiency and sensitivity. The working concentrations of antibody and OVA-hapten were optimized using the orthogonal test method. The AuNPs were diluted 10, 20, and 40 times with 0.01 mol/L PBS, and the OVA-hapten was diluted 4000, 8000, 16000, and 32000 times with 0.05 mol/L carbonate buffered saline (CBS), respectively. The optimal working concentrations of OVA-hapten and AuNPs were determined according to the inhibition rate. Finally, the dilutions of OVA-hapten and AuNPs were chosen to be 8000 times and 10 times, respectively.
3.5. Optimization of CHA system
DTT can release DNA strands on the surface of nanogold instead of traditional heat denaturation as a potent reducing agent. Not only it can dissociate the bio-barcode DNA strands modified on the surface of AuNPs (in the form of -SH strands), but also it has a protective effect on sulfhydryl groups. Therefore, the impact of DTT concentration on the degree of dissociation of DNA strands on the CHA was investigated. The fluorescence intensity increased and leveled off with the DTT concentration; the signal reached the highest intensity when the DTT concentration was 12.5 mmol/L (Fig. S3). Therefore, the optimum concentration of the DTT was chosen as 12.5 mmol/L.
The catalytic hairpin reaction system buffer’s concentration, pH, and Mg2+ content can affect the catalytic hybridization reaction. Therefore, these factors were optimized, and the obtained fluorescence intensity was examined. The concentration of hairpin working buffer was set at 10, 20, 30, 40, 50, and 60 mmol/L Tris-HCl (pH 7.5) for the post-reaction measurement, and the results are shown in Fig. 3a. With the Tris-HCl (pH 7.5) increase, the fluorescence intensity first increased and then decreased. The highest fluorescence intensity was achieved when the concentration of Tris-HCl (pH 7.5) was 40 mmol/L. Therefore, the optimum concentration of the hybridization reaction buffer system was set at 40 mmol/L.
Fig. 3.
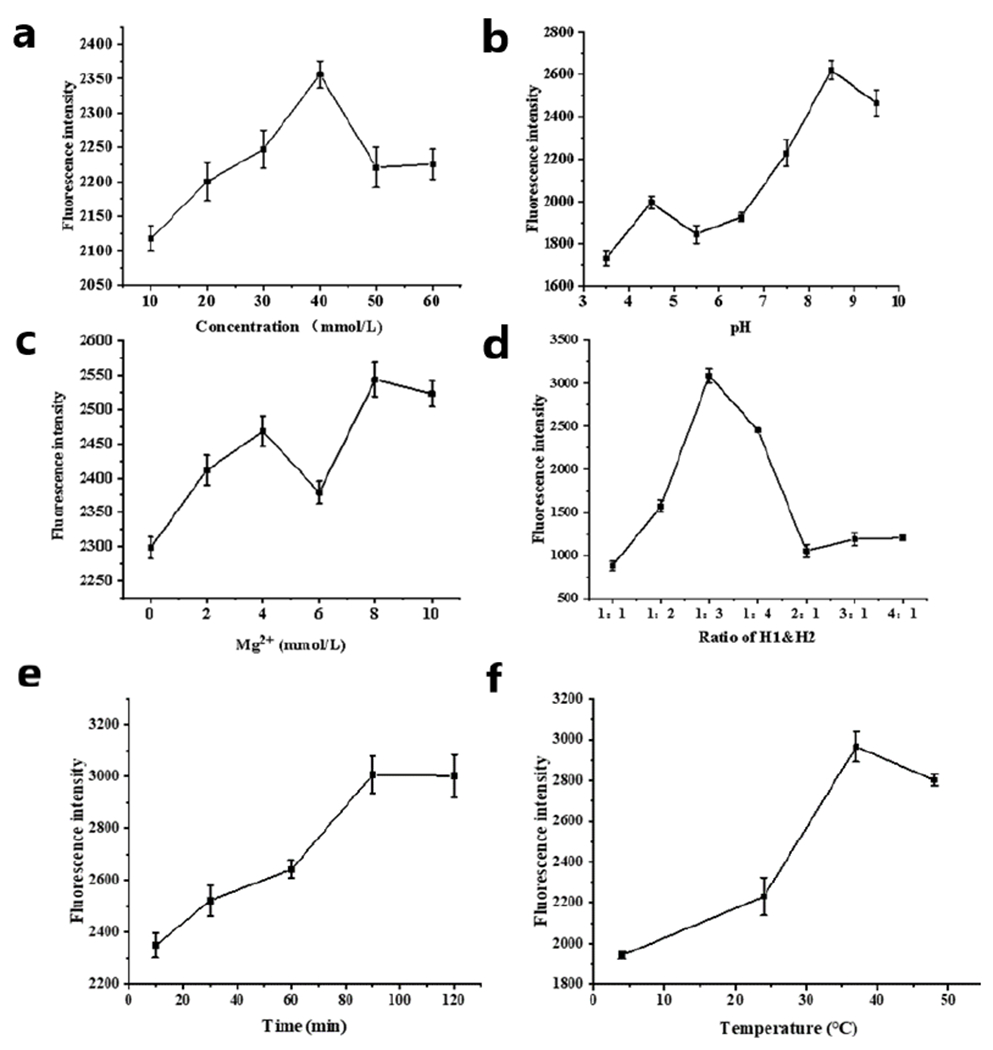
Optimization of CHA reaction system parameters: (a): Tris-HCl concentration; (b): Tris-HCl pH; (c): Mg2+ concentration; (d): hairpin structure H1&H2 ratio; (e): reaction time; and (f): reaction temperature.
After determining the optimum concentration, the hairpin working buffer (pH 3.5, 4.5, 5.5, 6.5, 7.5, 8.5, and 9.5) and concentrations of 40 mmol/L Tris-HCl were prepared to measure the as shown in Fig. 3b). With the increase of Tris-HCl pH, the fluorescence intensity first increased and then decreased, and the fluorescence intensity was the highest when the pH of Tris-HCl was 8.5. Therefore, the optimum pH of the hybridization reaction buffer system was 8.5.
Mg2+, as a metal ion, has a catalytic assist in the CHA reaction. Therefore, the fluorescence was measured for the hairpin working buffer containing Mg2+ at 0, 2, 4, 6, 8, and 10 mmol/L. In Fig. 3c, the fluorescence reached a maximum at the Mg2+ concentration of 8 mmol/L. Thus, an Mg2+ concentration of 8 mmol/L was chosen to promote the reaction.
The target chain as the initiating chain continues to induce the next round of CHA reaction. The amount of hairpin structure (H1 and H2) is the crucial factor in this experiment, and the ratio of the two amounts determines the saturation degree and amplification efficiency of the reaction. Herein, we optimized the hairpin (H1 and H2) addition ratio and set seven hairpin structure addition ratios, namely 1:1, 1:2, 1:3, 1:4, 2:1, 3:1 and 4:1. As shown in Fig. 3d, when H1 and H2 addition ratio was 1:3, its fluorescence intensity was the highest, i.e., the highest reaction efficiency. Therefore, 1:3 was assigned as the optimal incorporation ratio of the hairpin.
The catalytic hybridization self-assembly reaction is to dissociate the SH-DNA modified on the surface of the AuNPs after the addition of DTT. The target chain dissociates and reacts with the H1, H2 under the impetus of free energy; complementary hybridization occurs. With the extension of time, the fluorescent group 6-FAM modified by the hairpin structure can be released, and the fluorescence intensity would increase continuously. If the reaction time is insufficient, the reaction will not proceed sufficiently, resulting in low fluorescence intensity. The target and H1, H2 were explored to obtain the optimal fluorescence intensity for detection. During the catalytic hairpin self-assembly reaction, the fluorescence intensity was measured on the zymography at five time periods, including 10, 30, 60, 90, and 120 min. The results shown in Fig. 3e indicate that the fluorescence reaches its maximum at 90 min, so the reaction time was chosen to be 90 min.
The temperature has a crucial role in the stability of the DNA strand and the hybridization reaction in the catalytic hybridization self-assembly reaction. If the temperature is low, it may hinder the spontaneous catalytic response of the entropic free energy and the reaction efficiency. If it is high, it may destabilize and close the stem-loop structure. The optimal reaction temperature was obtained by exploring the fluorescence intensity measured by the reaction temperature of the target chain with H1 and H2. Four reaction temperatures, including 4, 24, 37, and 48°C, were designed for the fluorescence measurement of the catalytic reaction. Fig. 3f shows that the fluorescence intensity increased and then slightly decreased with increasing the temperature, reaching the maximum intensity at 37°C. The catalytic hairpin reaction may be less efficient when the incubation temperature is too low. On the other hand, when the incubation temperature was too high, the hairpin structure became less stable with the target DNA strands, and the fluorescence intensity decreased. Hence, a reaction temperature of 37°C was chosen as the most suitable reaction temperature.
3.6. Sensitivity of triazophos detection
Triazophos standard at different concentrations (from 0.01 – 50 ng/mL) was prepared under the optimal conditions. As shown in Fig. 4, the standard curve was plotted with the Log value of concentration (LogC) as the horizontal coordinate and the inhibition rate as the vertical coordinate. The two coordinates had an excellent linear relationship with a linear equation of y=9.9879x+33.144 and correlation coefficients of 0.965. The calculated LOD (the concentration of triazophos causing 10% inhibition of the maximum fluorescence) was 0.0048 ng/mL. They were calculated using the following equation (1):
| (1) |
where “I” represents the rate of inhibition, “Fmax” represents the fluorescence intensity without pesticides, “Fmin” represents the fluorescence intensity of blank control well, “Fx” represents a fluorescence intensity at a pesticide concentration of x.
Fig. 4.
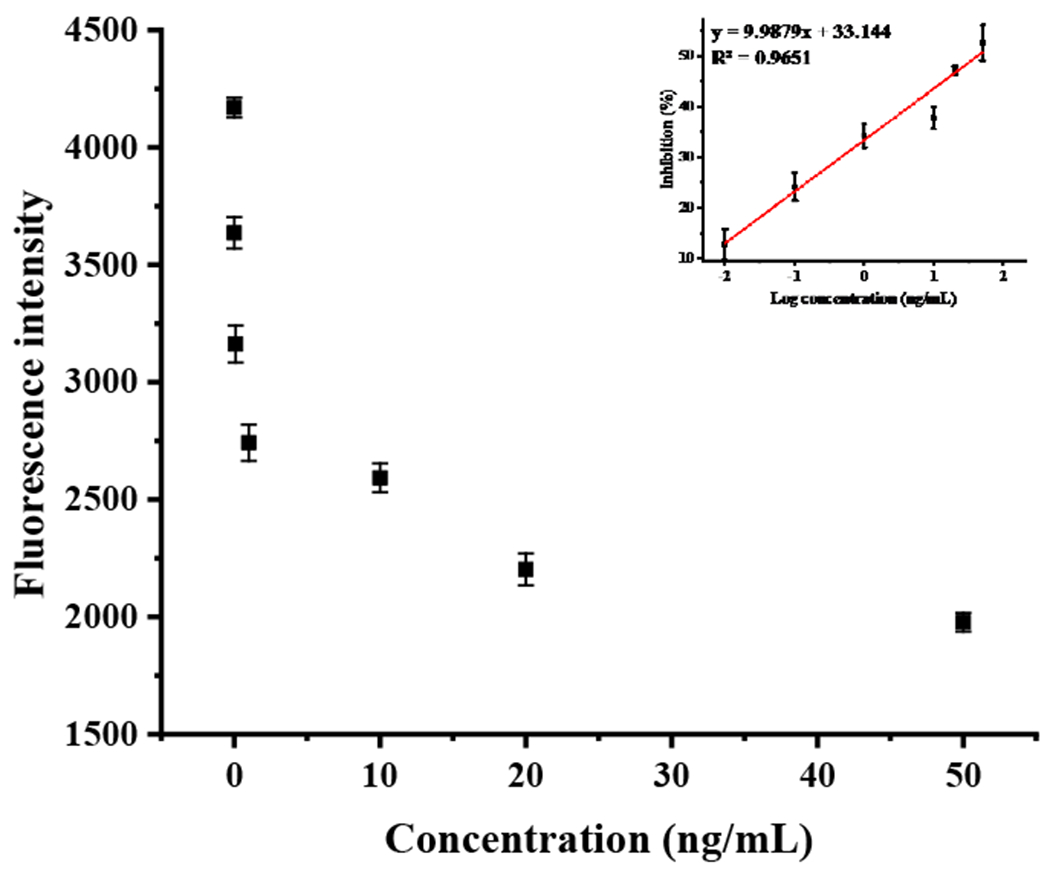
Standard curve for detecting triazophos using the proposed method.
3.7. Accuracy and precision
Three concentration levels of 10, 50, and 100 µg/kg were spiked to tap water, apple, cucumber, cabbage, and rice samples to determine the actual triazophos level in real samples: five parallel experiments were conducted for each sample. The results of the established method were compared with that of LC-MS/MS, as shown in Table S2. Recoveries were ranged between 81.0 to 104.1% with RSDs of 5.0-17.4% (the proposed method) and 86.3-105.4% with RSDs of 2.7-10.4% (LC-MS/MS). These results denote that the developed bio-barcode has high sensitivity and can achieve rapid and quantitative detection of pesticide residues.
3.8. Relevance studies
The recoveries estimated by LC-MS/MS were linearly fitted to the proposed bio-barcode immunoassay method developed herein. The x-axis represents the results of the catalytic hairpin self-assembly-based bio-barcode immunoassay, and the y-axis represents the results obtained by LC-MS/MS. The results are shown in Fig. 5, and the linear equations were as follows: water: y=1.05x+2.327, R2=0.9494; apple: y=0.9499x+0.85, R2=0.9345; cucumber: y=1.0406x+2.3932, R2=0.9447; cabbage: y=0.897x+2.8795, R2=0.9398; and rice: y=1.1108x −3.1476, R2=0.9628. The results were correlated well, which further confirmed the accuracy and applicability of the proposed method.
Fig. 5.
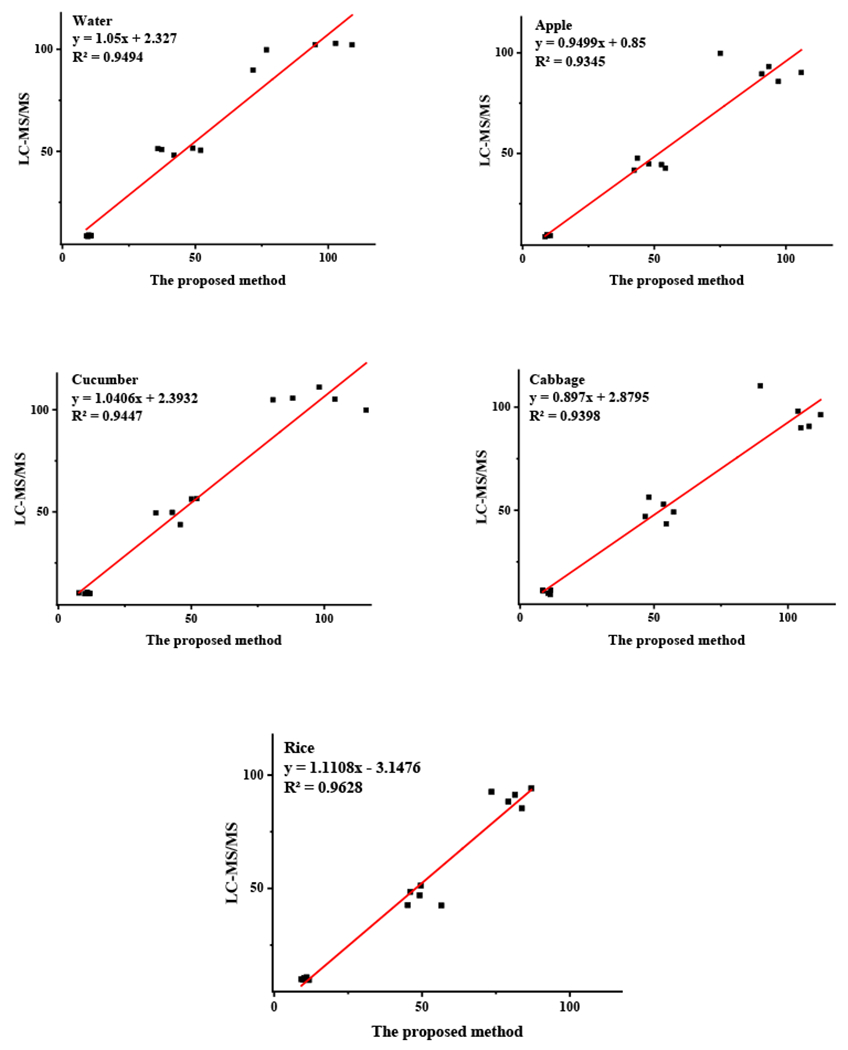
Correlation coefficients between the proposed method and LC-MS/MS for detecting triazophos residues in water and agricultural samples (apple, cucumber, cabbage, and rice).
3.9. Comparison with nanomaterial-based optical methods
A comparison of nanomaterial-based optical methods to determine triazophos with the current methodology detection from several aspects, such as linear range, recovery, LOD and samples, is summarized in Table 1. The established method has the advantages of low LOD and high sensitivity. The superior advantage of this method is that the stability of the fluorescent group is ensured by the addition of the fluorescent group in the last step compared to FIABOSA, which further improves the sensitivity and extends the linear range. However, the reproducibility and stability are lower compared to other immunoassays, need further improvement.
Table. 1.
Various nanomaterial-based optical methods for the determination of triazophos.
| Method | Materials | Matrix | LOD | Linear Range | Recovery (%) | Ref |
|---|---|---|---|---|---|---|
| Fluorescence sensor | MMIPs-CDs@VPA | Cucumber | 0.0015 mM | 0.0035-0.20 mM | --- | [28] |
| Chemilumine-scence system | Fe3O4@COF-AuNPs | Cabbage,cucumber, and tomato | 1 nM | 5.0-300.0 nM | 96.8-108.7 | [29] |
| Colorimetric immunoassay | Cit-AgNPs | River water, tap water, and apple | 5 nM | 0.1-280 μM | 82.0-100.8 | [30] |
| FIABOSA | AuNPs | Water, rice, cucumber, and apple | 0.006 ng/mL | 0.01-20 ng/mL | 85.0-110.3 | [31] |
| This Method | AuNPs | Water, apple, cucumber, cabbage, and rice | 0.0048 ng/mL | 0.01-50 ng/mL | 81.0-104.1 | This work |
FIABOSA: Fluorescence immunoassay based on oligonucleotides signal amplification.
4. Conclusion
A highly sensitive and efficient competitive bio-barcode immunoassay combined with CHA dual signal amplification was developed to detect triazophos in different matrices. The proposed method showed good recovery and accuracy in field incurred samples. The developed method is feasible, specific, does not require enzyme participation, and can be used for rapid quantitative analysis of other small molecules using fluorescence intensity at a constant temperature. Overall, this immunoassay can provide great potential for application in small molecule trace detection such as pesticide residues. However, it still needs to be optimized and improved for on-site testing.
Supplementary Material
Acknowledgements
This study was financially supported by the National Key Research Program of China (No. 2019YFC1604503), NIEHS Superfund Research Program (No. P42 ES04699), Agricultural Science and Technology Innovation Program of CAAS (No. CAAS-ZDRW202011), and Ningbo Innovation Project for Agro-Products Quality and Safety (No. 2019CXGC007).
Footnotes
Compliance with Ethical Standards
The authors declare that they have no conflict of interest.
References
- 1.Bhandari G, Zomer P, Atreya K, Mol HGJ, Yang X, Geissen V (2019) Pesticide residues in Nepalese vegetables and potential health risks. Environ Res 172:511–521. 10.1016/j.envres.2019.03.002 [DOI] [PubMed] [Google Scholar]
- 2.Agüera A, Contreras M, Fernandez-Alba AR (1993) Gas chromatographic analysis of organophosphorus pesticides of horticultural concern. J Chromatogr A 655(2):293–300. 10.1016/0021-9673(93)83235-K [DOI] [Google Scholar]
- 3.Arias PG, Martínez-Pérez-Cejuela H, Combès A, Pichon V, Pereira E, Herrero-Martínez JM, Bravo M (2020) Selective solid-phase extraction of organophosphorus pesticides and their oxon-derivatives from water samples using molecularly imprinted polymer followed by high-performance liquid chromatography with UV detection. J Chromatogr A 1626:461346. 10.1016/j.chroma.2020.461346 [DOI] [PubMed] [Google Scholar]
- 4.Harischandra NR, Pallavi MS, Bheemanna M, PavanKumar K, Chandra Sekhara Reddy V, Udaykumar NR, Paramasivam M, Yadav S (2021) Simultaneous determination of 79 pesticides in pigeonpea grains using GC–MS/MS and LC–MS/MS. Food Chem 347:128986. 10.1016/j.foodchem.2020.128986 [DOI] [PubMed] [Google Scholar]
- 5.Acosta-Dacal A, Rial-Berriel C, Díaz-Díaz R, Bernal-Suárez MdM, Luzardo OP (2021) Optimization and validation of a QuEChERS-based method for the simultaneous environmental monitoring of 218 pesticide residues in clay loam soil. Sci Total Environ 753:142015. 10.1016/j.scitotenv.2020.142015 [DOI] [PubMed] [Google Scholar]
- 6.Noh HH, Kim CJ, Kwon H, Kim D, Moon BC, Baek S, Oh MS, Kyung KS (2020) Optimized residue analysis method for broflanilide and its metabolites in agricultural produce using the QuEChERS method and LC-MS/MS. Plos One 15(10). 10.1371/journal.pone.0235526 [DOI] [PMC free article] [PubMed] [Google Scholar]
- 7.Pogačnik L, Franko M (2001) Optimisation of FIA system for detection of organophosphorus and carbamate pesticides based on cholinesterase inhibition. Talanta 54(4):631–641. 10.1016/S0039-9140(01)00314-9 [DOI] [PubMed] [Google Scholar]
- 8.Xu Z, Dong J, Yang J, Wang H, Jiang Y, Lei H, Shen Y, Sun Y (2012). Development of a sensitive time-resolved fluoroimmunoassay for organophosphorus pesticides in environmental water samples. Anal Methods 4(10), 3484. 10.1039/c2ay25534k [DOI] [Google Scholar]
- 9.Yu G, Wu W, Zhao Q, Wei X, Lu Q (2015) Efficient immobilization of acetylcholinesterase onto amino functionalized carbon nanotubes for the fabrication of high sensitive organophosphorus pesticides biosensors. Biosens Bioelectron 68:288–294. https://doi.org/https://doi.org/10.1016/j.bios.2015.01.005 [DOI] [PubMed] [Google Scholar]
- 10.Karczmarczyk A, Baeumner AJ, Feller K-H (2017) Rapid and sensitive inhibition-based assay for the electrochemical detection of Ochratoxin A and Aflatoxin M1 in red wine and milk. Electrochim Acta 243:82–89. 10.1016/j.electacta.2017.05.046 [DOI] [Google Scholar]
- 11.Liu B, Gong H, Wang Y, Zhang X, Li P, Qiu Y, Wang L, Hua X, Guo Y, Wang M (2018) A gold immunochromatographic assay for simultaneous detection of parathion and triazophos in agricultural products. Anal Methods 10. 10.1039/C7AY02481A [DOI] [Google Scholar]
- 12.Nam J-M (2003) Nanoparticle-based bio-bar codes for the ultrasensitive detection of proteins. Science 301(5641):p.1884–1886. 10.1126/science.1088755 [DOI] [PubMed] [Google Scholar]
- 13.Sedighi A, Krull UJ (2019) Enhanced Immunoassay Using a Rotating Paper Platform for Quantitative Determination of Low Abundance Protein Biomarkers. Anal Chem 91(8):5371–5379. 10.1021/acs.analchem.9b00502 [DOI] [PubMed] [Google Scholar]
- 14.Wang Q, Su J, Xu J, Xiang Y, Yuan R, Chai Y (2012) Dual amplified, sensitive electrochemical detection of pathogenic sequences based on biobarcode labels and functional graphene modified electrode. Sens Actuators B 163(1):267–271. 10.1016/j.snb.2012.01.050 [DOI] [Google Scholar]
- 15.Broto M, Salvador JP, Galve R, Marco MP (2018) Biobarcode assay for the oral anticoagulant acenocoumarol. Talanta 178:308–314. 10.1016/j.talanta.2017.09.006 [DOI] [PubMed] [Google Scholar]
- 16.Guan N, Li Y, Yang H, Hu P, Lu S, Ren H, Liu Z, Soo Park K, Zhou Y (2021) Dual-functionalized gold nanoparticles probe based bio-barcode immuno-PCR for the detection of glyphosate. Food Chem 338:128133. 10.1016/j.foodchem.2020.128133 [DOI] [PubMed] [Google Scholar]
- 17.Pengfei Du MJ, GeChen, Chan Zhang, Zejun Jiang, Yanxin Zhang, Pan Zou, Yongxin She FJ, Hua Shao, Shanshan Wang, Lufei Zheng & Jing Wang(2016) A Competitive Bio-Barcode Amplification Immunoassay for Small Molecules Based on Nanoparticles. Sci Rep 6(1):38114. 10.1038/srep38114 [DOI] [PMC free article] [PubMed] [Google Scholar]
- 18.Cui X, Jin M, Zhang C, Du P, Chen G, Qin G, Jiang Z, Zhang Y, Li M, Liao Y, Wang Y, Cao Z, Yan F, Abd El-Aty AM, Wang J (2019) Enhancing the Sensitivity of the Bio-barcode Immunoassay for Triazophos Detection Based on Nanoparticles and Droplet Digital Polymerase Chain Reaction. J Agric Food Chem 67(46):12936–12944. 10.1021/acs.jafc.9b05147 [DOI] [PubMed] [Google Scholar]
- 19.Du P, Jin M, Zhang C, Chen G, Cui X, Zhang Y, Zhang Y, Zou P, Jiang Z, Cao X, She Y, Jin F, Wang J (2018) Highly sensitive detection of triazophos pesticide using a novel bio-bar-code amplification competitive immunoassay in a micro well plate-based platform. Sens Actuators B 256:457–464. 10.1016/j.snb.2017.10.075 [DOI] [Google Scholar]
- 20.Zhang C, Jiang Z, Jin M, Du P, Chen G, Cui X, Zhang Y, Qin G, Yan F, Abd El-Aty AM, Hacimüftüoğlu A, Wang J (2020) Fluorescence immunoassay for multiplex detection of organophosphate pesticides in agro-products based on signal amplification of gold nanoparticles and oligonucleotides. Food Chem 326:126813. 10.1016/j.foodchem.2020.126813 [DOI] [PubMed] [Google Scholar]
- 21.Liu S, Wang Y, Ming J, Lin Y, Cheng C, Li F (2013) Enzyme-free and ultrasensitive electrochemical detection of nucleic acids by target catalyzed hairpin assembly followed with hybridization chain reaction. Biosens Bioelectron 49:472–477. https://doi.org/https://doi.org/10.1016/j.bios.2013.05.037 [DOI] [PubMed] [Google Scholar]
- 22.Zhang M, Huo B, Yuan S, Ning B, Bai J, Peng Y, Liu B, Gao Z (2018) Ultrasensitive detection of T-2 toxin in food based on bio-barcode and rolling circle amplification. Anal Chim Acta 1043:98–106. 10.1016/j.aca.2018.09.007 [DOI] [PubMed] [Google Scholar]
- 23.Sukphattanaudomchoke C, Siripattanapipong S, Thita T, Leelayoova S, Piyaraj P, Mungthin M, Ruang-areerate T (2020) Simplified closed tube loop mediated isothermal amplification (LAMP) assay for visual diagnosis of Leishmania infection. Acta Trop 212. 10.1016/j.actatropica.2020.105651 [DOI] [PubMed] [Google Scholar]
- 24.Cui Y, Fan S, Yuan Z, Song M, Hu J, Qian D, Zhen D, Li J, Zhu B (2021) Ultrasensitive electrochemical assay for microRNA-21 based on CRISPR/Cas13a-assisted catalytic hairpin assembly. Talanta 224:121878. 10.1016/j.talanta.2020.121878 [DOI] [PubMed] [Google Scholar]
- 25.Chen R, Sun Y, Huo B, Yuan S, Sun X, Zhang M, Yin N, Fan L, Yao W, Wang J, Han D, Li S, Peng Y, Bai J, Ning B, Liang J, Gao Z (2020) Highly sensitive detection of ochratoxin A based on bio-barcode immunoassay and catalytic hairpin assembly signal amplification. Talanta 208:120405. 10.1016/j.talanta.2019.120405 [DOI] [PubMed] [Google Scholar]
- 26.MOA, 2021. National food safety standard—maximum residue limits for pesticides in food. GB 2763–2021. Beijing, China. [Google Scholar]
- 27.Anastassiades M, Lehotay SJ, Stajnbaher D, Schenck FJ (2003) Fast and easy multiresidue method employing acetonitrile extraction/partitioning and “dispersive solid-phase extraction” for the determination of pesticide residues in produce. J AOAC Int 86(2):412–431. 10.1093/jaoac/86.2.412 [DOI] [PubMed] [Google Scholar]
- 28.Ma S, He J, Guo M, Sun X, Zheng M, Wang Y (2018) Ultrasensitive colorimetric detection of triazophos based on the aggregation of silver nanoparticles. Colloids and Surfaces A: Physicochemical and Engineering Aspects 538:343–349. 10.1016/j.colsurfa.2017.11.030 [DOI] [Google Scholar]
- 29.Ma Y, Zhao Y, Xu X, Ding S, Li Y (2021) Magnetic covalent organic framework immobilized gold nanoparticles with high-efficiency catalytic performance for chemiluminescent detection of pesticide triazophos. Talanta 235:122798. 10.1016/j.talanta.2021.122798 [DOI] [PubMed] [Google Scholar]
- 30.Wu M, Fan Y, Li J, Lu D, Guo Y, Xie L, Wu Y (2019) Vinyl Phosphate-Functionalized, Magnetic, Molecularly-Imprinted Polymeric Microspheres’ Enrichment and Carbon Dots’ Fluorescence-Detection of Organophosphorus Pesticide Residues. Polymers 11(11):1770. 10.3390/polym11111770 [DOI] [PMC free article] [PubMed] [Google Scholar]
- 31.Zhang C, Du P, Jiang Z, Jin M, Chen G, Cao X, Cui X, Zhang Y, Li R, Abd El-Aty AM, Wang J (2018). A simple and sensitive competitive bio-barcode immunoassay for triazophos based on multi-modified gold nanoparticles and fluorescent signal amplification. Anal Chim Acta 999, 123–131. 10.1016/j.aca.2017.10.032 [DOI] [PubMed] [Google Scholar]
Associated Data
This section collects any data citations, data availability statements, or supplementary materials included in this article.


