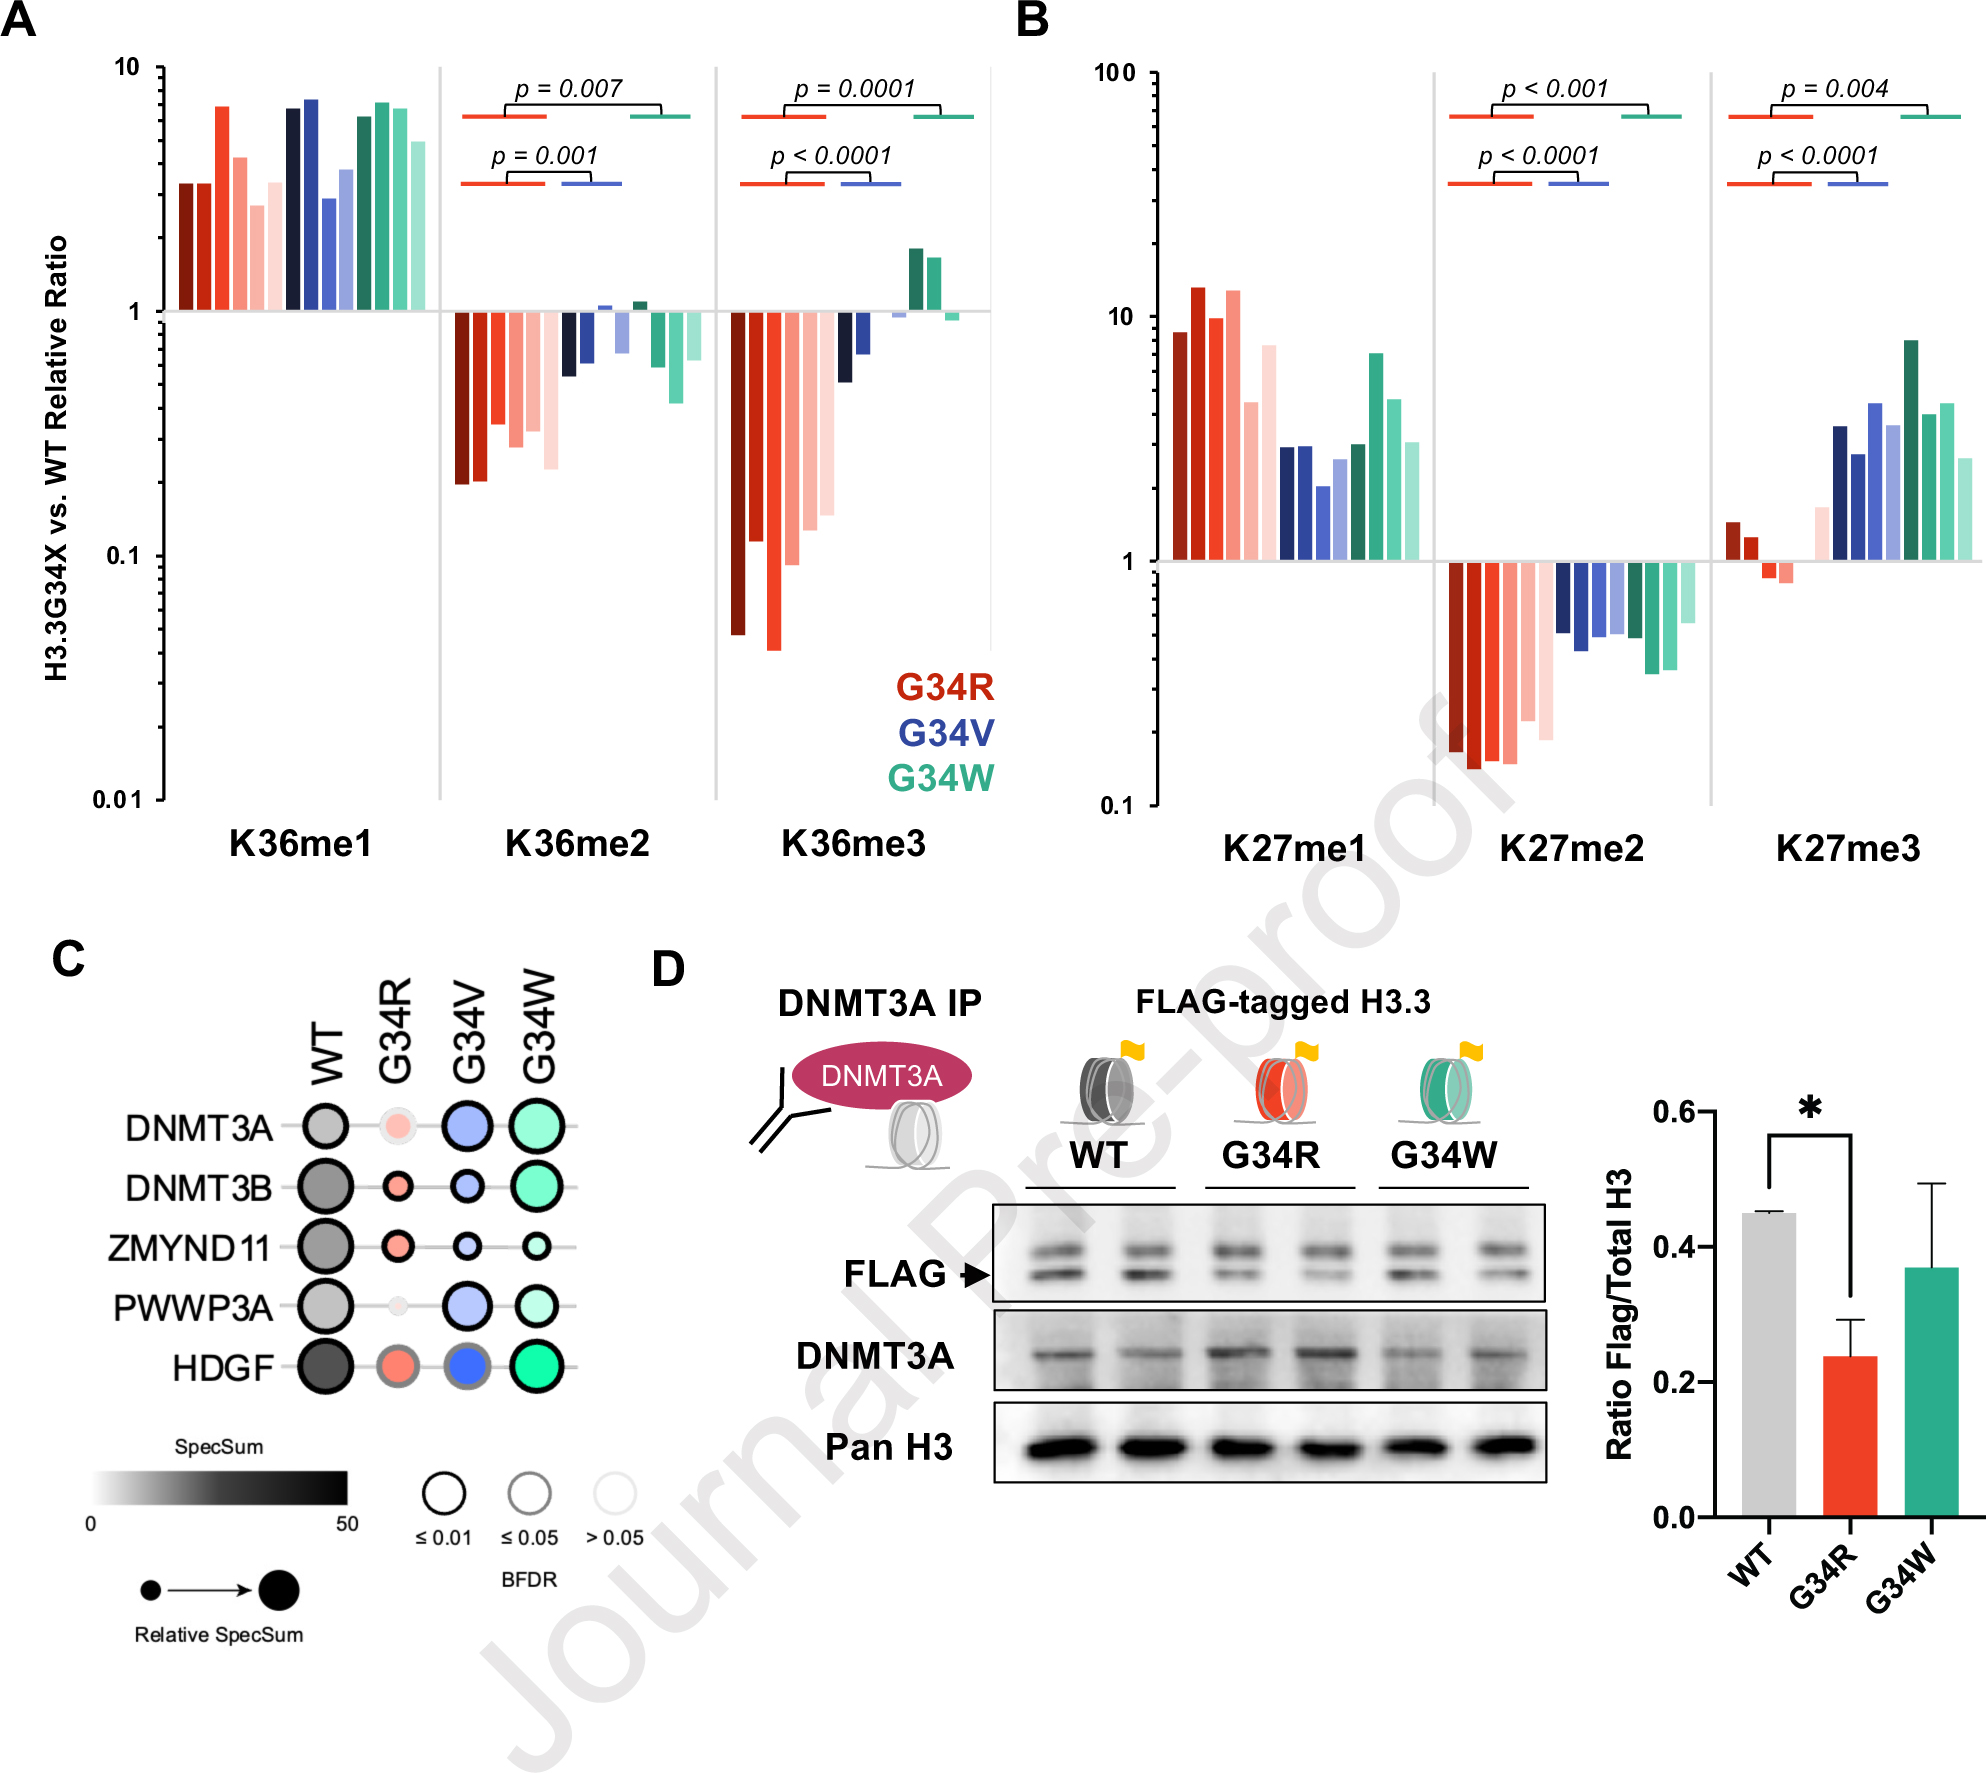
Figure 4. G34R histone tails are depleted of H3K36me2/3 and impaired for DNMT3A recruitment.

A. Waterfall plot depicting relative cis differences of histone H3K36 methylation levels on G34-mutant H3.3 histone tails compared to non-mutated H3.3 measured by histone PTM mass spectrometry. Histones were extracted from murine DKI G34R/V/W NPCs (3 biological replicate, 2 technical replicates). Note: H3K36 di- and tri-methylation is severely depleted in G34R, compared to G34V/W (p-value depicts significance derived from student pairwise t-test). B. Similar waterfall plot as panel A, depicting H3K27 methylation cis differences on G34-mutant H3.3 histone tails compared to non-mutated H3.3, as measured by histone PTM mass spectrometry. C. Bubble plot depicting BioID interaction frequency of G34-mutant histones (bait) with chromatin modifiers (prey) detected using MS in G34R/V/W and H3.3 WT expressing U2-OS lines (n=2). Note the decrease interaction with DNMT3A and DNMT3B in G34R histones. D. Immunoprecipitation/immunoblot confirmation of decrease DNMT3A (bait) interaction with G34R histones in C3H10T1/2 cell lines exogenously expressing FLAG-tagged H3.3 WT and G34-mutant histones (prey) (n=2). * Denotes p < 0.05, student’s t-test.
