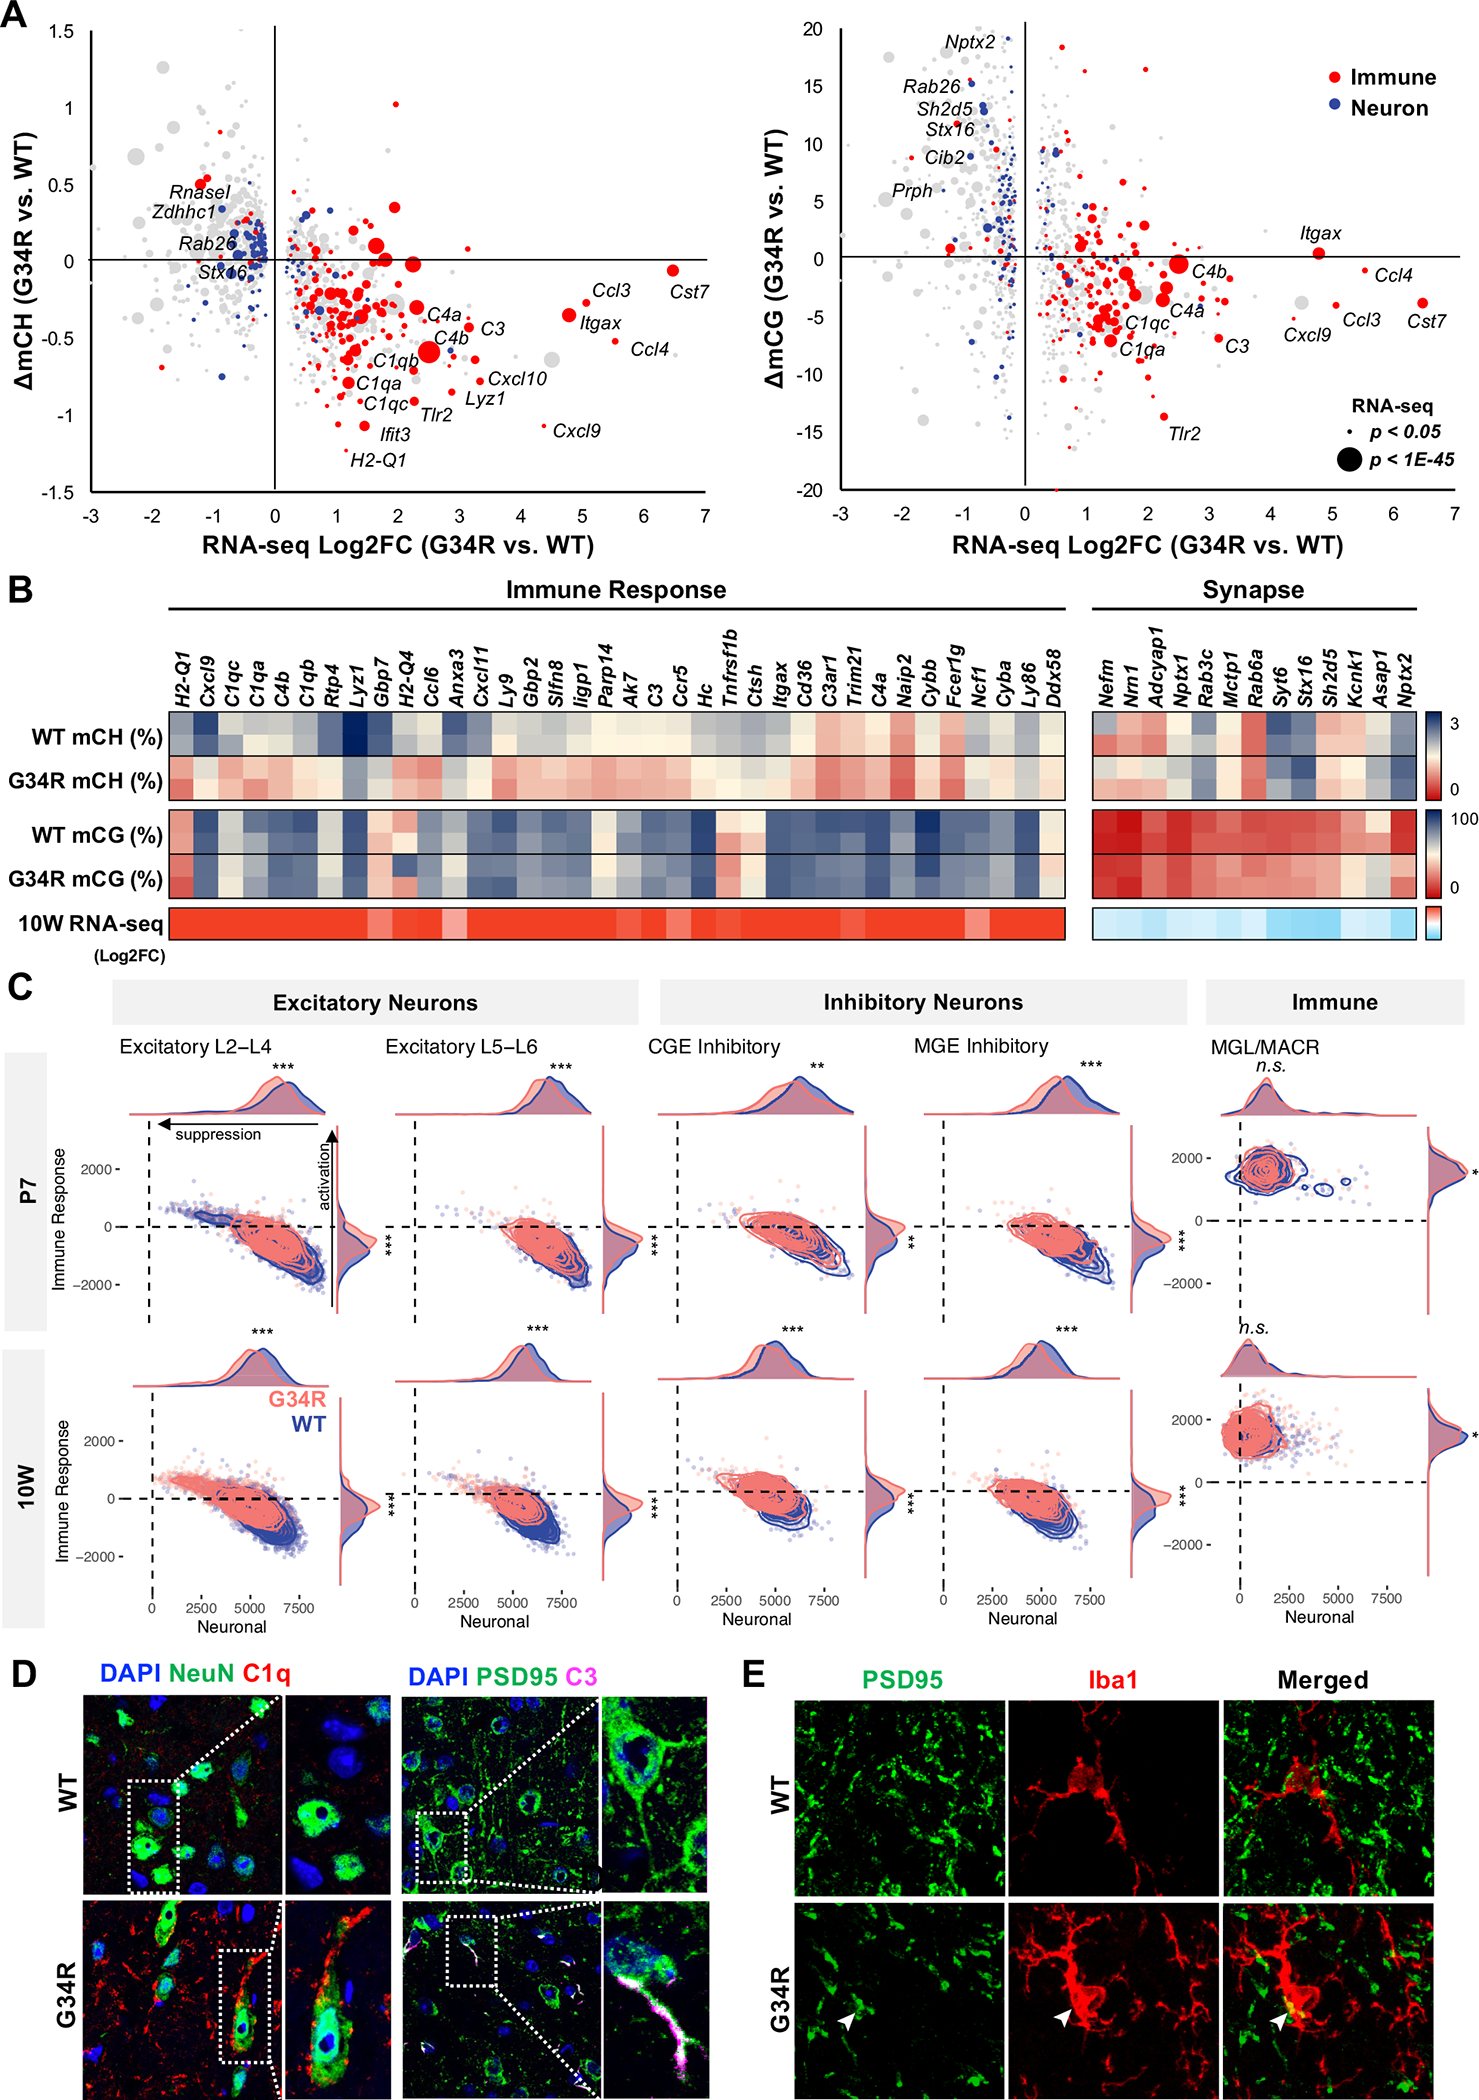
Figure 6. Altered DNA methylation is concurrent with transcriptional dysregulation of immune and neuronal genes.

A. Immune genes are CH-hypomethylated and up-regulated, whereas neuronal genes are CG-hypermethylated and downregulated in G34R cortex. 2D bubble plot depicting change of CH (left) and CG methylation (right) correlated with bulk transcriptional dysregulation in 10W G34R cortex (n = 2). Size of bubble depicts significance of expression dysregulation. Gene ontology annotation of DE genes with immune response function in red, whereas genes annotated with synapse are in blue. B. Heatmap depiction of DNA methylation change (% methylation) and transcriptional change (log2FC) in 10W G34R vs. WT cortex. C. G34R neurons show activation of immune genes and suppression of neuronal genes compared to WT neurons. Density plot showing hypomethylated immune gene enrichment score (y-axis) vs. hypermethylated neuronal gene enrichment score (x-axis) in G34R (pink) and WT (blue) neurons and immune cells from P7 (N = 7848 cells; 3809 G34R, 4039 WT) and 10W (n = 17396 cells; 8539 G34R, 8857 WT) single nuclei transcriptome data. *** p < 2.2e-16, ** p < 1e-10, * p < 0.01, Wilcoxon rank sum test with continuity correction. D. Left: immunofluorescent co-staining of neuron NeuN (green) and complement C1Q (red) depicting G34R-specific accumulation of complement in neuron from substantia nigra region of 10-week brain (63x). Right: immunofluorescent co-staining of postsynaptic protein PSD95 (green) and complement C3 (magenta) from cortex region of 10W brain. E. Immunofluorescent co-staining of PSD95 (green) and microglia marker Iba1 (red) from cortex region of 10W brain. White arrowheads mark colocalization of PSD95 with IBA1 (63x).
