

SUMMARY
Loss of Fragile X Messenger Ribonucleoprotein (FMRP) causes Fragile X syndrome (FXS), the most prevalent form of inherited intellectual disability. Here we show that FMRP interacts with voltage-dependent anion channel (VDAC) to regulate the formation and function of endoplasmic reticulum (ER)-mitochondria contact sites (ERMCS), structures critical for mitochondrial calcium (mito-Ca2+) homeostasis. FMRP deficient cells feature excessive ERMCS formation and ER-to-mitochondria Ca2+ transfer. Genetic and pharmacological inhibition of VDAC or other ERMCS components restored synaptic structure, function, and plasticity and rescued locomotion and cognitive deficits of Drosophila dFmr1 mutant. Expressing FMRP C-terminal domain (FMRP-C), which confers FMRP-VDAC interaction, rescued the ERMCS formation and mito-Ca2+ homeostasis defects in FXS patient iPSC-derived neurons and locomotion and cognitive deficits in Fmr1 knockout mice. These results identify altered ERMCS formation and mito-Ca2+ homeostasis as contributors to FXS and offer potential therapeutic targets.
Keywords: Fragile X syndrome (FXS), Fragile X Messenger Ribonucleoprotein (FMRP), Voltage-dependent anion channel (VDAC), ER-mitochondria contact site (ERMCS), Mitochondrial calcium (mito-Ca2+) homeostasis
Graphical Abstract
eTOC Blurb
Geng et al. show that the formation and function of organelle contact sites between ER and mitochondria is altered in Fragile X syndrome, the most prevalent form of inherited intellectual disability, and that restoration of the structure and function of these contact sites can rescue disease phenotypes in multiple models.
INTRODUCTION
FXS results from repeat expansion within the Fmr1 gene that lead to loss of expression of FMRP protein1,2, an RNA-binding protein that regulates translation3. FMRP exhibits wide tissue expression, including energy-demanding brain and muscle tissues, although the impact of FMRP loss has been mainly studied in the central nervous systems, where synaptic defects at the cellular and systems level have been observed in FXS patients and animal models4-9. In addition to intellectual disability and autistic behaviors, FXS patients present other symptoms including irregular physical features and metabolic abnormalities5,10,11. FXS research has been focused on the premise that FMRP acts as a promiscuous translation repressor binding numerous brain RNAs, with excess translation underlying FX pathogenesis3,12. The mode of translational regulation by FMRP has not been explicit or consistent in vivo, and the key translational target(s) mediating the effect of FMRP remains to be identified13-17. So far, efforts focusing on translational aspects of FMRP have not led to therapeutic benefit18, suggesting that studies of other biological functions of FMPR are warranted.
Animal studies revealed FXS-associated metabolic defects suggestive of mitochondrial dysfunction17,19,20-22. Mitochondria are dynamic and complex organelles with essential roles in many aspects of biology, from energy production and intermediary metabolism to intracellular signaling and apoptosis23,24. In addition to bioenergetics, mitochondria exert other effects. essential for neurons, including Ca2+ buffering and redox signaling25-28. These effects make mitochondria particularly important to brain function and may underlie the selective vulnerability of brain tissues to mitochondrial dysfunction29-31. Ca2+ is profoundly involved in synapse biology. Under basal conditions, Ca2+ entry into mitochondria is needed for synaptic physiology, as mito-Ca2+ regulates the activities of TCA cycle enzymes and electron transport chain (ETC) components32-34. Ca2+ uptake by mitochondria helps buffer Ca2+ transients generated by synaptic signaling, preventing the detrimental effects of bursts of Ca2+ influxes26. Mito-Ca2+ is vital for synaptic plasticity. For example, the slow release of tetanically accumulated mito-Ca2+ underlies post-tetanic potentiation (PTP), a form of short-term memory35. Spatially stable mitochondrial compartments exist in dendrites to support local translation, dendritic spine morphogenesis, and synaptic plasticity36,37. Under pathological conditions, over-accumulation of mito-Ca2+ can trigger mitochondrial permeability transition pore (mPTP) opening, releasing toxic agents and causing cell death38.
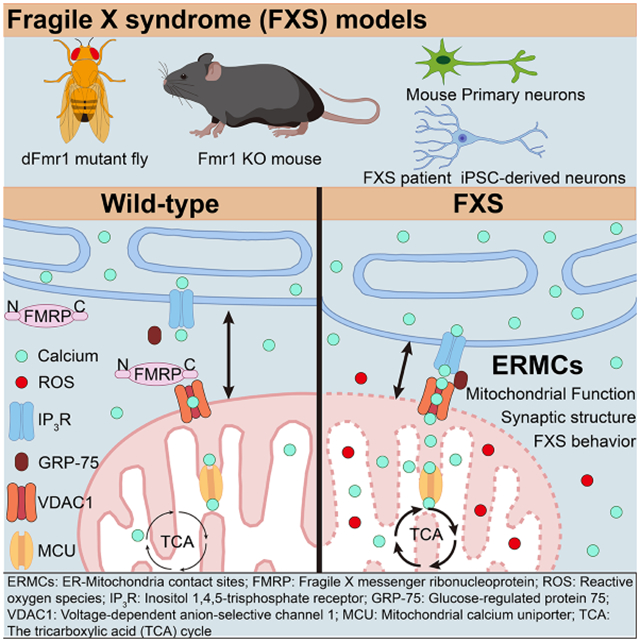
Mitochondria make intimate contacts with other organelles, such as the ER39. ER represents a major source of mito-Ca2+. Ca2+ uptake from ER occurs at the ER-mitochondria contact sites (ERMCS), where local Ca2+ can reach high levels40. Proteins mediating Ca2+ transfer at ERMCS include inositol 1,4,5-trisphosphate receptors (IP3R) on the ER side, voltage-dependent anion-selective channels (VDAC) in the mitochondrial outer membrane (OMM), and mitochondrial Ca2+ uniporter (MCU) in the inner membrane38. Other proteins such as the molecular chaperone glucose-regulated protein 75 (GRP75) are also present at ERMCS41. In addition to Ca2+ transfer, the IP3R-GRP75-VDAC axis serves a tethering role to connect ER and mitochondria42. ERMCS also regulates lipid synthesis and transfer, autophagosome formation, mitochondrial biogenesis and dynamics, and inflammation43,44. ERMCS is increasingly being appreciated as a key controller of mito-Ca2+ homeostasis, and there is an emerging role of altered ERMCS and mito-Ca2+ in the pathogenesis of neurodegenerative disease45-47. How mito-Ca2+ signaling transits from physiological to pathological, and whether ERMCS and mito-Ca2+ homeostasis is altered in mental disorders are topics of great interest.
Here we show that FMRP directly interacts with ERMCS component VDAC to regulate ERMCS formation and function. In Drosophila and mouse FXS models, FMRP deficient mammalian cells, and FXS patient fibroblasts and iPSC-derived neurons, excessive ERMCS formation resulted in mito-Ca2+ overload. Inhibition of VDAC or other ERMCS components restored synaptic morphology and function and rescued behavioral deficits of dFmr1 flies and Fmr1 knockout (KO) mice. Moreover, a truncated form of FMRP (FMRP-C), which is sufficient for FMRP-VDAC interaction, rescued the ERMCS formation and mito-Ca2+ homeostasis defects in FMRP deficient cells and neurons derived from Fmr1 KO mice and FXS patient iPSCs, and ameliorated the locomotor and cognitive deficits of Fmr1 KO mice. These results identify altered ERMCS and mito-Ca2+ as contributors to FXS pathogenesis.
RESULTS
Regulation of Mitochondrial Function by FMRP in Drosophila and Mammalian Cells
Intrigued by the reported flight defect of dFmr148, and its abnormal wing posture, signs of muscle mitochondrial dysfunction as seen in PINK1 flies49, we tested functional interaction between PINK1 and dFmr1. The formation of an aberrant form of complex-I 30 kD subunit (C-I30-u), which is caused by mitochondrial stress50, was enhanced by dFmr1 RNAi, with the knockdown efficiency of two independent RNAi lines confirmed by western blot (WB) (Fig. S1A), whereas dFmr1 overexpression (OE) reduced C-I30-u (Fig. 1A). This was correlated with enhancement of the mitochondrial morphology defect of PINK1 mutant flies by dFmr1 RNAi and suppression by dFmr1-OE (Fig. 1B). The wing posture defect of dPINK1 was also enhanced by dFmr1 RNAi (Fig. 1C). Further supporting a mitochondrial role of FMRP, mitochondrial Hsp60 level was increased in FMRP deficient cells treated with the mitochondrial toxin rotenone (Fig. 1D), and FMRP level in mouse brain was reduced after treatment with MPTP (Fig. S1B), a mitochondrial toxin that targets complex I. Moreover, in cultured cells (Fig. S1C), and in vivo in Drosophila (Fig. S1D), FMRP protein level was decreased, and cell viability was compromised in FMRP deficient cells under mitochondrial stress induced by rotenone, CCCP, and antimycin + oligomycin (A+O) (Fig. S1E).
Figure 1. Regulation of mitochondrial function by FMRP.

(A) Immunoblots showing the effect of dFmr1 inhibition or overexpression on C-I30-u (arrowhead) formation in PINK1 flies. Values: C-I30-u/C-I30 ratio. Tubulin (TUBA): loading control.
(B) Immunostaining and quantification of damaged muscle mitochondria in control (w−), PINK1, and dFmr1-deficient PINK1 mutant flies.
(C) Quantification of wing posture defect in PINK1 and PINK1 flies with dFmr1 deficiency or overexpression.
(D) Immunoblots measuring HSP60 level in FMRP-deficient cells after rotenone treatment. Values: normalized HSP60 and FMRP level.
(E) TauSTED microscopy images of fibroblasts immunostained for FMRP and TOM20. Arrow indicates colocalization. Values: Manders’ correlation coefficients (MCC) M1 and M2. P>0.95 in Costes randomization test.
(F, G) TauSTED images and quantification of MCC of FMRP and TOM20 colocalization in fibroblasts after A+O treatment (F). P>0.95 in Costes randomization test. Immunoblots detect FMRP in the mitochondrial fraction relative to VDAC1 (G).
(H) Immunostaining of dFMRP and GFP in Mhc>mito-GFP fly muscle after drug treatment and quantification of MCC. Arrowheads: dFMRP localized to mitochondria. P>0.95 in Costes randomization test.
(I) Proteinase K digestion assay testing FMRP mitochondrial localization.
(J) Immunoblots testing RNA-dependency of FMRP mitochondrial localization.
(K) Subcellular fractionation and immunoblot detection of FMRP in various fractions. Markers: IP3R1 and GRP75 (MAM); Calnexin (ER); VDAC1 (mitochondria); (ACTB (cytosol).
(L) Colocalization between GFP-FMRP and MAM (labeled by TOM20-VAPB PLA). Arrowhead: FMRP and MAM colocalization.
Data are means ± SD based on at least 3 independent experiments; * P < 0.05; ** P < 0.01. See also Figure S1.
To test if FMRP might be localized to mitochondria to exert its function, we used super resolution microscopy TauSTED to examine FMRP localization in human fibroblasts (Fig. 1E) and U2OS cells (Fig. S1F). Partial FMRP colocalization with TOM20-labeled mitochondria was observed. Partial mitochondrial localization of FMRP was also observed in fly dopaminergic neurons (Fig. S1G), cultured mouse cortical neurons (Fig. S1H), and mouse brain slices (Fig. S1I). We next tested the effect of mitochondrial damage on FMRP localization. We treated cells with A+O for a short term (6 h), a condition that did not affect FMRP level, and found more FMRP colocalized with mitochondria in fibroblasts (Fig. 1F) and U2OS cells (Fig. S1F). WB analysis confirmed this result (Fig. 1G). In Drosophila muscle expressing the mitochondrial marker mitoGFP and treated with rotenone and CCCP for a short-term, increased dFMRP and mitoGFP colocalization was observed (Fig. 1H). Increased mitochondrial localization of dFMRP was also observed in PINK1 RNAi flies (Fig. S1J). These results suggest that FMRP may be recruited to mitochondria to handle mitochondrial stress.
FMR1 is Localized to ERMCS
To determine the mitochondrial location of FMRP, we performed protease K digestion with or without detergent treatment to permeabilize membrane. FMRP showed similar sensitivity to protease K as VDAC (Fig. 1I), suggesting OMM localization of FMRP. Since FMRP is a translation repressor and RNA-binding protein, we tested whether its mitochondrial localization is due to binding to mRNAs of nuclear-encoded mitochondrial proteins known to associate with OMM51. Thus, RNase A was used to treat purified mitochondria. Although a small portion of FMRP was released into the supernatant, the majority of FMRP still associated with RNase-treated mitochondria (Fig. 1J), indicating RNA-independent localization to OMM.
Previous studies indicated that PINK1 regulates ERMCS45. Given the functional interaction between PINK1 and dFmr1, we tested if FMRP is localized to ERMCS. ERMCS can be obtained biochemically as mitochondria-associated ER membranes (MAMs)52. FMRP was detected by WB analysis of mitochondrial, ER and MAM fractions (Fig. 1K). Consistent with this, endogenous FMRP was found to partially colocalize with an ER and ERMCS marker VAPB by TauSTED (Fig. S1K). ERMCS can also be labeled by a mitochondria-ER split GFP reporter (MER-splitGFP) 53. Fluorescent MER-splitGFP is reconstituted when mitochondria and ER make close contact. Endogenous FMRP or transfected Flag-tagged FMRP colocalized with MER-splitGFP in U2OS and HeLa cells (Fig. S1L), supporting FMRP localization to ERMCS. Moreover, when proximity ligation assay (PLA) of Tom20 and VAPB was used to detect ERMCS in U2OS cells, colocalization of FMRP with the PLA signals was observed (Fig. 1L). Together, these results support an ERMCS localization of FMRP.
Negative Regulation of ERMCS Formation by FMRP
To test the functional role of FMRP at ERMCS, we analyzed ERMCS in FXS fibroblasts (Fig. 2A) and FMRP deficient U2OS cells (Fig. 2B) by TauSTED microscopy of mitochondrial (Tom20) and ER (VAPB) markers. The contact between ER and mitochondria was increased in these cells compared to controls (Fig. 2A-C). This increased ERMCS was unlikely caused by increased ER or mitochondrial content, as the levels of ER and mitochondrial marker proteins tested were largely unaltered in FXS fibroblasts (Fig. S2A). We next used MER-splitGFP to measure the effect of FMRP on ERMCS. MER-splitGFP exhibited dynamic changes in fluorescence in different treatment conditions mimicking starvation (EBSS), and mitochondrial (CCCP, A+O), lysosomal (BFA), proteasomal (BTZ), or ER (TG, tunicamycin) stresses (Fig. S2B). As reported54, starvation (EBSS) induced MER-splitGFP signal, which receded when cells were returned to normal culture condition (Fig. S2C). In FMRP deficient cells, MER-splitGFP positive signals and signal intensities were significantly increased (Fig. S2D), and more MER-splitGFP signals colocalized with Tom20 (Fig. 2D). One concern with the splitGFP approach is it might not accurately monitor ERMCS dynamics, as once formed, the GFP might be too stable to be dissociated. To address this concern, we used the MERLIN method55, which depends on proximity energy transfer rather than GFP reconstitution to report ERMCS. This method also revealed increased ERMCS formation in FMRP deficient cells (Fig. 2E). PLA was also used to detect the contact between Tom20-labeled mitochondria and Calnexin-marked ER. PLA signals were significantly increased in FXS fibroblasts (Fig. 2F) and FMRP deficient U2OS cells (Fig. 2G). Finally, we used EM to examine contacts between mitochondria and ER. The distance between mitochondria and ER was decreased in Fmr1 KO mouse neurons (Fig. 2H) and FMRP deficient U2OS cells (Fig. 2I), indicating closer contact. Thus, multiple lines of evidence obtained with complementary approaches support a negative regulation of ERMCS formation by FMRP.
Figure 2. FMRP negatively regulates ERMCS formation.

(A, B, C) TauSTED microscopy images of control and FXS fibroblasts (A), or FMRP-deficient cells immunostained for mitochondria (TOM20) and ER (VAPB). Arrowhead: ERMCS. MCC was quantified (C). P>0.95 in Costes randomization test.
(D) Confocal analysis of MER-splitGFP and Tom20 colocalization in control and sh-FMR1 cells.
(E) Schematic of the MERLIN reporter system and effect of FMRP deficiency on MERLIN signal.
(F, G) Images and quantification of PLA of Calnexin and Tom20 in control and FXS fibroblasts (F), or control and sh-FMR1 cells (G).
(H, I) EM images and quantification of the distance between mitochondria and ER in hippocampal neurons of WT and Fmr1 KO mice (H), or control and sh-FMR1 cells (I).
Data are means ± SD based on at least 3 independent experiments; * P < 0.05, ** P<0.01 vs. control or normal groups. See also Figures S2.
Defective PINK1-Parkin Mediated Mitophagy in FMR1 Deficient Cells
Loosening Mito-ER contact stimulated, whereas forced contact inhibited autophagy56. Consistently, an artificial Mito-ER tether (Mito-TagBFP-ER) inhibited PINK1/Parkin-mediated mitophagy (Fig. S2E). Overexpression of just PTPIP51, an endogenous mitochondrial protein that facilitates mito-ER tethering56, also inhibited mitophagy (Fig. S2F). Mitophagy was further detected using the mito-Keima reporter, which turns red in the acidic lysosome when mitochondria are being degraded57. The fluorescence shift from green to red was increased under CCCP treatment condition, which induces mitophagy58, whereas FMRP knockdown had opposite effect (Fig. S2G), suggesting that mitophagy was impaired in FMRP deficient cells. In another assay, cells were transfected with PARKIN-YFP, which translocates to mitochondria upon CCCP treatment to promote mitophagy58. While mitochondria were largely cleared after 18 hr CCCP treatment in control cells, they persisted in FMRP deficient cells (Fig. S2H, I). Together, these data suggest that FMRP positively regulates Parkin-mediated mitophagy, presumably through its effect on ERMCS formation and/or function.
FMRP Regulates IP3R-Mediated ER-to-Mitochondria Ca2+ Transfer
We next tested the effect of altered ERMCS on mito-Ca2+ in FXS. Mito-Ca2+ in dFmr1 mutant or RNAi flies was measured using mito-GCaMP59. Control and dFmr1 mutant flies had comparable expression of mito-GCaMP protein (Fig. S3A). However, mito-Ca2+ level as indicated by mito-GCaMP signal was significantly increased in dFmr1 flies (Fig. 3A). Loss of FMRP also exacerbated the mito-Ca2+ defect in PINK19B9 mutant (Fig. S3B). Cytosolic Ca2+ as measured with cyto-GCaMP was also moderately increased in dFmr1 flies, but to a lesser degree than mito-Ca2+ (Fig. S3C), suggesting that the higher mito-Ca2+ was not simply a reflection of cytosolic Ca2+. In FXS fibroblasts and FMRP deficient cells, mito-Ca2+ as measured with Rhod2-AM signal intensity normalized by mitochondrial mass was also increased (Fig. 3B, C; S3D), and this mito-Ca2+ increase was also not simply due to cytosolic Ca2+ change as cyto-Ca2+ indicated by Fura-3 AM was only mildly changed in these cells (Fig. S3E, F). We also used cells transfected with mito-GCaMP to monitor the effect of FMRP on mito-Ca2+ dynamics. Histamine, an IP3-generating agonist, can be used to induce Ca2+ release from the ER and increase mito-Ca2+ uptake60. Knockdown of FMRP dramatically increased histamine-induced peak mito-Ca2+ level (Fig. 3D). Mito-Ca2+ was further examined using mtFura2AM, a mitochondrial-targeted ratiometric calcium indicator61. Knockdown of FMRP dramatically increased basal mito-Ca2+ and histamine-induced peak mito-Ca2+ (Fig. 3E, F). Similar effect was seen in FXS fibroblasts (Fig. 3G). The dynamics of Ca2+ transfer from ER to mitochondria was measured using the ER-Ca2+ indicator ER-GCaMP3 and mitochondrial matrix-Ca2+ indicator Mito4x-jRCaMP1b. While ER-Ca2+ showed no significant change after histamine treatment, presumably due to the high basal ER-Ca2+ level, peak mito-Ca2+ was increased in FMRP deficient cells, and the rate of Ca2+ transfer was faster (Fig. 3H-J), indicating facilitated ER-to-mitochondria Ca2+ transfer. Consistent with mito-Ca2+ regulating the activities of TCA cycle enzymes and ETC components, mitochondrial ATP level was increased in dFMR1-RNAi flies (Fig. 3K) and FMRP deficient U2OS cells (Fig. 3K). On the other hand, in FXS fibroblasts and iPSC-derived neurons (Fig. S3G), or in HEK293T cells overexpressing a mito-ER tether (Fig. S3H), cellular ATP levels were slightly decreased. These results suggesting that cellular and mitochondria ATP production in response to FMRP deficit can be cell type or context dependent and may not directly correlate with FXS pathogenesis. Mitochondria from dFmr1 flies were also sensitive to Ca2+-induced mitochondrial swelling (Fig. 3L).
Figure 3. IP3R-mediated ER-to-mitochondrial Ca2+ transfer is regulated by FMRP.

(A) Images and quantification of mito-GCaMP signal in DA neurons of dFmr1-RNAi and dFmr1/+ flies. Signals were normalized relative to TH-Gal4>mito-GCaMP.
(B, C) Images and quantification of mito-Ca2+ level as measured with Rhod-2 AM in FXS fibroblasts (B), and sh-FMR1 U2OS cells (C) with normalization by mitochondrial areas.
(D) Images of mito-GCaMP signal and traces of mito-GCaMP dynamics upon stimulation with histamine (100 μM) in control and sh-FMR1 cells.
(E-F) Images of ratiometric mito-Fura-2 AM signal under basal condition and traces of mito-Fura-2 AM dynamics upon stimulation with histamine in control and sh-FMR1 cells (E). The peak and basal (F) mito-Ca2+ were calculated based on the trace of mito-Fura-2 AM with and without histamine treatment.
(G) Traces of mito-Fura-2 AM dynamics upon stimulation with histamine in normal and FXS fibroblasts, and the calculated peak and basal mito-Ca2+ levels.
(H-J) Images of basal and histamine-stimulated ER-Ca2+ (ER-GCaMP3) and mito-Ca2+ (Mito-RCaMP6) signals (H) and representative traces of signal dynamics (I), calculated peak ER-Ca2+ or mito-Ca2+ fluorescence, and the time of Ca2+ transfer from ER to mitochondria (J) after histamine treatment in control and sh-FMR1 cells.
(K) ATP measurement in the thorax of dFmr1 RNAi flies and sh-FMR1 cells.
(L) Calcium-induced swelling of mitochondria isolated from WT and MHC-Gal4>dFmr1 RNAi flies.
(M) Effect of IP3R1, IP3R3, RyR1, RyR2, RyR3 and MCU knockdown on mito-Ca2+ in control and sh-FMR1 cells.
Data are means ± SD based on at least 3 independent experiments; * P < 0.05; ** P < 0.01 in Student’s t test. See also Figure S3.
IP3Rs and RyRs were the major Ca2+ release channels in the ER. To identify the channel critical for mito-Ca2+ dyshomeostasis in FMRP deficient cells, IP3R1, IP3R3, RyR1, RyR2, RyR3 were knockdown using shRNA, and mito-Ca2+ was detected with Rhod-2 AM. Knockdown of IP3R blocked FMRP deficiency-induced mito-Ca2+ increase. As a positive control, MCU knockdown also blocked mito-Ca2+ increase in FMRP deficient cells (Fig. 3M). Thus, ERMCS is involved in mito-Ca2+ deregulation in FXS.
ER-to-Mitochondria Ca2+ Transfer Mediates FMRP Function in Drosophila
To assess the contribution of deregulated ER-to-mitochondria Ca2+ transfer to FXS pathogenesis in an in vivo setting, we used the dFmr1 model48, which recapitulates salient features of the disease62,63. We treated dFmr1 flies with compounds that interfere with ER-to-mitochondria Ca2+ transfer or the toxic effect of mito-Ca2+ overload. For this purpose, we treated animals with 2-aminoethyldiphenyl borate (2-APB), an IP3R antagonist64, DIDS, an inhibitor of VDAC65, and Cyclosporine A (CsA), an inhibitor of mito-Ca2+ overload-induced mPTP opening that prevents the dissipation of mitochondrial membrane potential (MMP) 66.
Hyperlocomotion is a hallmark FXS phenotype that is observed in dFmr1 homozygous and heterozygous larvae67. 2-APB, CsA, and DIDS treatments alleviated this defect of dFmr1 larvae (Fig. 4A). Overgrowth of dendritic structures is a diagnostic characteristic in FXS patients and a primary phenotype of Fmr1 mutant mice and flies62,63. At the larval neuromuscular junction (NMJ), 2-APB, CsA, and DIDS rescued the synaptic defects in terms of branch number, bouton number, and NMJ length in dFmr1 mutants (Fig. 4B). Adult dFmr1 flies exhibited poor climbing and learning and memory abilities. 2-APB, CsA, and DIDS rescued this climbing defect in a dose-dependent manner (Fig. S3I, J). For learning and memory testing, we used the aversive taste memory assay68. dFmr1 flies exhibited compromised memory of the aversive taste they just experienced. This behavioral deficit was rescued by 2-APB, CsA, and DIDS (Fig. S3K). The rescuing effects of 2-APB, CsA, and DIDS were correlated with normalization of mito-Ca2+ (Fig. 4C).
Figure 4. ER-to-mitochondria Ca2+ transfer mediates FMRP function in Drosophila.

(A) Images of the crawling paths of WT and dFmr1 larvae without or with 2-APB, CsA, or DIDS treatment. Each color indicates a crawling path of an individual larva followed for 30 sec. Graph shows quantification of distance traveled.
(B) Confocal images of NMJ staining of WT and dFmr1 larvae without or with 2-APB, CsA, or DIDS treatment. NMJs were labeled with HRP (presynaptic marker) and DLG (postsynaptic marker). Graphs show quantification of branch number, boutons number, and NMJ length in drug treated dFmr1 mutant larvae.
(C) Representative images of mito-GCaMP and quantification of signal intensity in control, dFmr1 mutant, and dFmr1 RNAi flies after 2-APB, CsA or DIDS treatment. Signals were normalized relative to TH-Gal4>mito-GCaMP control.
(D) Representative EPSPs and mEPSPs recorded from larval muscle 6 in wild type (control) and dfmr1Δ50M lines. Each top trace represents the mean of 30 continuously evoked responses from the same muscle fiber. The bottom traces show 3 s of continuous recordings. 2-APB (+2-APB) or DIDS (+DIDS) was added in fly food and HL3 solution as indicated. Scale bars: 10 mV, 50 ms (top) and 1 mV, 200 ms (bottom).
(E) Mean EPSPs and mEPSPs amplitudes and mEPSP frequency are shown. n=14-17 cells for each case. Statistical significance was assessed using one-way ANOVAs followed by Tukey’s post hoc test, *p<0.05, **p<0.01, n.s., not significant.
(F) Open field test to measure hyperactivity and anxiety in WT and Fmr1 KO mice before and after oral administration of CsA (12.5 mg/kg) for 7 days. Paired t test was applied.
(G) Dose dependent effect of 2-APB, CsA and DIDS on mito-Ca2+ level in control and sh-FMR1 cells measured with Rhod-2AM, which was normalized with mitochondrial areas (fluorescent images in Figure S6A).
Data are means ± SD based on at least 3 independent experiments; * P < 0.05; ** P < 0.01. ns, not significant. See also Figure S3, S4 and S5.
FMRP deficiency causes electrophysiological defects in neurons such as hyperexcitability and impaired homeostatic plasticity. 2-APB and DIDS rescued the hyperexcitability defect (increased EPSP amplitude) at the NMJ synapses of dFmr1 mutant with a dose response (Fig. 4D, E). Moreover, impaired pre-synaptic homeostatic plasticity was observed in dFmr1, as shown by the inability to maintain EPSP amplitude in the presence of philanthotoxin-433 (PhTX), a glutamate receptor antagonist69 (Fig. S3L-R). An increase of quantal content (QC) was observed in dFmr1 animals as in control animals, suggesting that synaptic homeostasis can still be induced in these animals. However, normalized QC was reduced in dFmr1 relative to control animals. 2-APB rescued the EPSP amplitude and QC defects of synaptic homeostasis in dFmr1 animals (Fig. S3L-R).
Treatment of Fmr1 KO mice with CsA rescued the anxiety-related behavior as shown by the time spent in the center in the open field assay (Fig. 4F). Despite the poor blood-brain-barrier penetration and thus low brain bioavailability of 2-APB and DIDS, which precluded in vivo testing of their effect in Fmr1 KO mice, both 2-APB and DIDS could rescue the abnormal dendritic spine morphology of culture neurons derived from Fmr1 KO mice (Fig. S3S). 2-APB, CsA, and DIDS also rescued the mito-Ca2+ defect in FMRP deficient cells (Fig. 4G; S4A) and FXS fibroblasts (Fig. S4B, C) and FXS iPSC-derived neurons (Fig. S4D). High levels of mito-Ca2+ can stimulate respiratory chain activity, leading to higher reactive oxygen species (ROS) production. Indeed, MMP, a readout of mitochondrial health that can be measured with the JC1 or TMRM dyes, was decreased in FXS fibroblasts compared to control fibroblasts, and 2-APB, CsA, and DIDS maintained MMP in FXS fibroblasts (Fig. S5A). Similar protective effect was observed in FMRP deficient U2OS cells with or without treatment with the mitochondrial toxin rotenone, which caused MMP reduction in control cells and further reduction in FMRP deficient cells (Fig. S5B, C). Mitochondrial ROS as measured with MitoSOX was increased in FMRP deficient cells, and 2-APB, CsA, and DIDS significantly attenuated this defect (Fig. S5D). Moreover, 2-APB, CsA, and DIDS protected FMRP deficient cells against rotenone-induced cytotoxicity (Fig. S5E). Thus, ER-to-mitochondria Ca2+ transfer through ERMCS critically mediates FMRP function.
The C-terminal Domain of FMRP Directly Interacts with ERMCS Component VDAC1
We investigated the basis of FMRP regulation of ERMCS and mito-Ca2+. ERMCS component VDAC1 level was increased in FMRP deficient cells (Fig. 5A), although VDAC1 mRNA level was not significantly changed (Fig. S6A). VDAC was also increased in dFmr1 flies (Fig. S6B). To identify mitochondrial proteins interacting with or in the vicinity of FMRP, we applied proximity labeling using miniTurbo70. Consistent with the mitochondrial and stress granule (SG) localization of FMRP71, FMRP-miniTurbo-labelled proteins were found to colocalize with SG (Fig. S6C) and mitochondria (Fig. S6D), supporting that FMRP-miniTurbo faithfully recapitulated FMRP subcellular localization. FMRP-miniTurbo labelled ERMCS-related proteins VDAC1 and GRP75, but not SDHA, a complex II protein (Fig. S6E), demonstrating specificity. In co-IP assays, only VDAC1 showed specific interaction with FMRP (Fig. 5B), suggesting that GRP75 is in the vicinity but may not physically interact with FMRP. FMRP interaction with VDAC was also detected in Drosophila (Fig. S6F). To test whether VDAC1 binding may interfere with the RNA-binding activity of FMRP, we performed RNA-IP of reported FMRP binding targets in cells with or without VDAC1 co-expression. No change in mRNA binding by FMRP was detected after VDAC1 coexpression (Fig. S6G).
Figure 5. FMRP-C interacts with VDAC1 and mediates mitochondrial localization.

(A) Immunoblots of ERMCS and mPTP-related proteins in control and sh-FMR1 cells, or normal and FXS fibroblasts.
(B) Co- IP assay showing FMRP-VDAC1 interaction in mouse brain lysate.
(C, D) Images and quantification of PLA detection of IP3R3 and VDAC1 interaction in FXS fibroblasts (C) and sh-FMR1 cells (D).
(E) Effect of FMRP knockdown on VDAC1 and GRP75 interaction in co-IP assay.
(F) Immunoblots of N-terminally GFP tagged FMRP fragments in mitochondrial fraction isolated from cells transfected with the respective constructs (input).
(G) GFP-trap pull-down assay showing FMRP-C binding to VDAC1.
(H) Co-IP assay showing the RGG domain of FMRP and the N-term 26 aa of VDAC1 mediate FMRP-VDAC1 interaction.
(I, J) Immunoblotting (I) and confocal imaging (J) showing decreased mitochondrial localization of FMRP when the RGG domain is deleted. MCC was quantified (J). P>0.95 in Costes randomization test.
(K) Confocal imaging showing decreased colocalization with MER-splitGFP of FMRPΔRGG-FLAG compared to FMRP-FLAG. MCC was quantified (K). P>0.95 in Costes randomization test.
Data are means ± SD based on at least 3 independent experiments; ** P < 0.01. See also Figure S6 and S7.
We further tested the effect of FMRP on VDAC function at ERMCS. The VDAC1-IP3R interaction as detected by PLA was increased in FXS fibroblasts (Fig. 5C) and FMRP deficient U2OS cells (Fig. 5D). Moreover, VDAC1 interaction with Grp75 as detected by co-IP was increased in FMRP deficient cells (Fig. 5E), suggesting that FMRP may normally antagonize VDAC1 interaction with GRP75, an interaction that underlies ERMCS formation41. FMRP thus remodels protein-protein interaction dynamics within ERMCS.
To map the domain(s) in FMRP critical for mitochondrial localization, we made deletion constructs (Fig. S6H; 5F). The N and M domains were found critical for FMRP localization to arsenite-induced SG, whereas the RGG domain in the C-terminus was dispensable (Fig. S6I). SG association generally reflects the abilities of FMRP to associate with ribosomes and repress translation71,72. Next, cells were transfected with GFP-tagged fragments of FMRP, and GFP was used for FMRP detection by WB (Fig. 5F) or immunofluorescence (Fig. S6J). Full-length FMRP (FL-FMRP) and FMRP fragments containing the C-terminal domain showed enriched mitochondrial localization. Next, FL-FMRP, FMRP-NM and FMRP-C were transfected into cells and GFP pull-down was conducted to detect interaction with VDAC1. FL-FMRP and FMRP-C, but not FMRP-NM, showed interaction with VDAC1 (Fig. 5G), indicating that FMRP-C mediates FMRP-VDAC1 interaction. The GXXXG motifs at the N-terminus of VDAC1 have been implicated in VDAC1 interaction with other proteins73. We wondered if such motifs might interact with the Gly-rich RGG domain in FMRP-C. A Δ26M-VDAC1 construct with the N-term GXXXG motifs deleted was made and co-transfected into cells with FMRP and FMRPΔRGG. Whereas the FMRP/VDAC1 interaction was readily detected, neither FMRPΔRGG/VDAC1 nor FMRP/Δ26M-VDAC1 showed detectable interaction (Fig. 5H), suggesting that the N-terminus of VDAC1 and the RGG domain of FMRP mediate FMRP/VDAC1 interaction. Further supporting the role of the RGG domain, FMRPΔRGG showed less mitochondrial localization than FL-FMRP (Fig. 5I, J). FMRPΔRGG was also less colocalized with MER-splitGFP-labeled ERMCS than FL-FMRP (Fig. 5K). Thus, FMRP-C is involved in FMRP mitochondrial localization, and the RGG domain in FMRP-C mediates FMRP interaction with VDAC1 and FMRP localization to ERMCS.
Reduction of VDAC Dosage Rescues Synaptic and Behavioral Defects of dFmr1 Flies
The interaction between FMRP and VDAC, and the increased IP3R-VDAC1 and Grp75-VDAC1 interactions in FMRP deficient cells suggested that the IP3R-Grp75-VDAC1 axis was hyperactive in the absence of FMRP. We tested if reduction of VDAC function would be able to rescue the dFmr1 mutant phenotypes. Halving the gene dosage of Porin, the sole fly homolog of mammalian VDAC, alleviated the synaptic morphology defects at dFmr1 larval NMJ h (Fig. S7A). The hyperactive locomotor behavior of dFmr1 mutant larvae was also rescued (Fig. S7B). The learning and memory (Fig. S7C) and climbing (Fig. S7D) deficits of dFmr1 adult flies were also rescued. Together, these data demonstrate the in vivo role of VDAC in mediating the synaptic and behavioral effects of FMRP.
FMRP-C is Sufficient to Rescue ERMCS Formation and Mito-Ca2+ Homeostasis Defects in FMRP Deficient Cells, Including FXS Patient iPSC-Derived Neurons
To assess which domain in FMRP is critical for mito-Ca2+ homeostasis, the different fragments of FMRP were transfected into FMRP deficient cells, and Rhod-2 AM was used to detect mito-Ca2+. FL-FMRP (or NMC), FMRP-MC, and FMRP-C, proteins that contain the C-terminal domain dramatically decreased mito-Ca2+ (Fig. 6A) and attenuated the heightened IP3R-VDAC1 interaction detected by PLA in FMRP deficient cells (Fig. 6B). Furthermore, consistent with FMRP-C being important for mitochondrial health, it protected against A+O and rotenone induced mitochondrial damage on cell viability (Fig. S8A).
Figure 6. FMRP-C is sufficient to rescue the ERMCS formation and mito-Ca2+ homeostasis defects in FMRP deficient cells.

(A) Rhod-2 AM staining and quantification of mito-Ca2+ in FMR1 KO cells transfected with various FMRP fragments.
(B) Images and quantification of PLA of VDAC1 and IP3R3 interaction in FXS fibroblasts transfected with various FMRP fragments.
(C) Schematic of Mito-ER splitTurboID and application of Mito-ER splitTurboID to detect biotinylated ERMCS proteins to measure ERMCS change in FMR1 KO cells transfected with FMRP-N and FMRP-C.
(D) Time course of mt-Fura-2 AM-indicated mito-Ca2+ dynamics after histamine treatment of control, FMR1 KO and FMRP-C transfected control and FMR1 KO cells, and the calculated peak and basal mito-Ca2+ levels.
(E) Ca2+-induced swelling of mitochondria isolated from control cells expressing FMRP-N, FMRP-C, or FMRP. CsA serves as control.
(F) Ca2+-induced swelling of mitochondria isolated from FMR1 KO cells expressing FMRP-N, FMRP-C, or FMRP.
(G) Mito-Ca2+ as measured by Rhod-2AM, and normalized with mitochondrial areas in normal and FXS iPSC neurons with or without FMRP-C.
(H) Images of PLA of VDAC/GRP75 interaction and signal quantification in normal and FXS iPSC neurons with or without FMRP-C.
(I) Mitochondrial mass and mitochondrial morphology measured by TOM20 immunostaining in normal and FXS iPSC neurons with or without FMRP-C.
(J) Representative images of PSD95 and TOM20 staining in normal and FXS iPSC neurons with or without FMRP-C. PSD95 puncta density was quantified.
Data are means ± SD based on at least 3 independent experiments; # P < 0.05; ## P < 0.01 vs NC or normal group. * P < 0.05; ** P < 0.01 vs Fmr1 KO or FXS group. See also Figure S8.
To further test the effect of FMRP-C on ERMCS formation, we used a split-TurboID construct that has the N fragment of TurboID localized to mitochondria and the C fragment to the ER74. When ERMCS is formed, split-TurboID will be reconstituted and proximity labeling of proteins in ERMCS will occur. With this method, we found that biotinylated proteins were increased in FMRP deficient cells, consistent with more ERMCS being formed (Fig. 6C). Importantly, while expression FMRP-N had no effect on ERMCS protein biotinylation in FMRP deficient cells, FMRP-C restored that to WT levels (Fig. 6C; Fig. S8B).
To further assess the effect of FMRP-C on mito-Ca2+, the ratiometric Mito-Fura-2AM dye was applied to FMRP-C transfected FMR1 KO cells. FMRP-C tuned down basal mito-Ca2+ and histamine-induced peak mito-Ca2+ level in FMR1 KO cells (Fig. 6D). To test if FMRP directly regulates mito-Ca2+, we purified FMRP-N, FMRP-C and FL-FMRP recombinant proteins and applied them to isolated mitochondria. Ca2+-induced mPTP opening and ensuing mitochondrial swelling was measured. Ca2+-induced mitochondrial swelling was abolished by CsA, an inhibitor of mPTP and a positive control for the assay. FMRP-C and FL-FMRP both blocked Ca2+-induced mitochondrial swelling (Fig. 6E). Mitochondria from FMR1 KO cells were more sensitive to Ca2+-induced swelling (Fig. 6F), which was attenuated by FMRP-C or FL-FMRP (Fig. 6F).
We further used FXS patient-derived neurons to validate the role of FMRP-C in regulating ERMCS and mito-Ca2+. FXS iPSC-derived neurons exhibited higher mito-Ca2+ compared to controls (Fig. 6G). FMRP-C lowered mito-Ca2+ in FXS neurons without affecting normal neurons. Consistent with findings from cultured non-neuronal cells (Fig. 5E), PLA assay showed that VDAC1-GRP75 interaction was increased in FXS neurons. FMRP-C decreased such interaction (Fig. 6H). As previously observed in Fmr1 KO mice20, more fragmented mitochondria were observed in FXS iPSC-derived neurons. This defect was rescued by the FMRP-C (Fig. 6I). The increase in the number of postsynaptic marker PSD-95-positive puncta, an indication of excess synapse formation, was also rescued by FMRP-C (Fig. 6J). FMRP-C also rescued the increased mito-ROS and decreased MMP defects in Fmr1 KO (Fig. S8C, D) or FXS iPSC-derived neurons (Fig. S8E, F). In contrast, FMRP-N had no obvious effect on mitochondrial Ca2+ (Fig. S8G, H), VDAC1-GRP75 interaction (Fig. S8I), and mitochondrial morphology (Fig. S8J), but it moderately alleviated the deregulation of PSD95 puncta density (Fig. S8K). Together, these results indicate that the function of FMRP-C in regulating ERMCS and is conserved in human neurons.
FMRP-C Rescues Mito-Ca2+ Homeostasis and Cognitive Function of Fmr1 KO Mice
To assess the effect of FMRP-C in an in vivo mammalian system, we expressed Flag-tagged FMRP-C under the neuronal Syn1 promoter using AAV-PHP.eB viral delivery. AAV-PHP.eB-Syn1-FMRP-C-Flag viruses were injected into the lateral ventricles of 2-month-old Fmr1 KO mice (Fig. 7A). The efficiency of FMRP-C expression was assessed by co-staining FLAG and neuronal marker MAP2 in the cortex and hippocampus. FMRP-C was specifically expressed in neurons (Fig. 7A). Immunoblotting (Fig. 7B) and immunofluorescence (Fig. S9A-C) detected FMRP-C in the cortex, hippocampus, and striatum. Co-staining of Flag with the mitochondrial marker Tom20 showed partial co-localization (Fig. 7C). Partial co-localization of FMRP-C with ER was also detected (Fig. S9D).
Figure 7. FMRP-C rescues mito-Ca2+ homeostasis and cognitive function of Fmr1 KO mice.

(A) Schematic diagram of AAV-FMRP-C-Flag injection, and images of FMRP-C expressing cells in coronal sections of cortex and hippocampus costained with anti-MAP2 and FLAG antibodies.
(B) Immunoblots showing FMRP-C-FLAG expression mouse brain regions.
(C) Confocal images showing FMRP-C (FLAG) and mitochondria (TOM20) colocalization.
(D) Co-IP assay detecting VDAC1 interaction with GRP75 and FMRP-C, and effect of FMRP-C on VDAC1-GRP75 interaction in Fmr1 KO mouse brain.
(E) PLA detection of FMRP-C-FLAG and VDAC1 interaction in the cortex of FMRP-C-FLAG expressing Fmr1 KO mouse brain.
(F) Co-IP assay detecting FMRP-C interaction with VDAC1 in WT or Fmr1 KO mice expressing FMRP-C-FLAG.
(G) Measurement of mitochondrial ATP and mito-Ca2+ levels.
(H) Confocal images of 4-HNE and FLAG immunostaining in the cortex of Fmr1 KO and FMRP-C-expressing Fmr1 KO mouse brain, and data quantification.
(I) Immunoblots and quantification of levels of the indicated proteins in WT, Fmr1 KO and AAV-FMRP-C-Flag injected WT and Fmr1 KO mouse brains (n = 3/group).
(J) Representative traces showing typical examples of the exploring behavior of WT, Fmr1 KO, and AAV-FMRP-C-Flag injected WT and Fmr1 KO mice in the open field test. Distance traveled and time spent in the center area are measured.
(K) Schematic of the training, and NPR and NOR assays. Histogram represents the exploration time spent for the experimental groups on each object during training. DI was quantified.
Data are means ± SD based on at least 3 independent experiments; # P < 0.05; ## P < 0.01 vs WT group. * P < 0.05; ** P < 0.01* vs Fmr1 KO group. See also Figure S9.
In mouse brain slices treated with 50 mM KCl to enhance neuronal activity, FMRP-VDAC1 interaction was not changed, suggesting that this interaction is not regulated by neuronal activity (Fig. S9E). Brain tissues from Fmr1 KO mice and Fmr1 KO mice infected with FMRP-C virus were used in co-IP assays to pull down VDAC1 and detect GRP75 and FMRP-C. VDAC1 interacted with both FMRP-C and GRP75, and the VDAC1-GRP75 interaction was decreased in FMRP-C expressing mice (Fig. 7D), consistent with result from cultured cells (Fig. 5E). PLA detected VDAC1-FMR1-C interaction at perinuclear sites in the cortex of FMRP-C expressing mice (Fig. 7E), and specific VDAC1-FMRP-C interaction was confirmed in reciprocal co-IP that pulled down FMRP-C first and detected VDAC1 (Fig. 7F). As in dFmr1 flies and FMRP deficient cells, mitochondrial ATP level was slightly increased in the cortex and hippocampus of Fmr1 KO mouse brain. This was rescued by FMRP-C (Fig. 7G). Significantly increased mito-Ca2+ was observed in the cortex and hippocampus of Fmr1 KO mouse brain. This was also rescued by FMRP-C (Fig. 7G). Consistent with increased oxidative stress in Fmr1 KO brain20, Fmr1 KO mouse brain tissues had elevated levels of 4-HNE, a marker of lipid peroxidation, which was decreased by FMRP-C (Fig. 7H). Camk2α, App, Psd95, Mfn2 are candidate targets of FMRP in cells75,76. We measured levels of these mRNAs in the hippocampus and cortex of WT, Fmr1 KO, and FMRP-C-expressing WT and Fmr1 KO mice. Only Camk2α level was significantly different between WT and Fmr1-KO, but this was not affected by FMRP-C (Fig. S9F). The protein levels of candidate FMRP targets APP, PSD95, MAP2, and SOD1 were also not affected by FMRP-C (Fig. 7I; S9G). Although the protein and mRNA levels of VDAC1 were slightly increased in Fmr1 KO mice, they were not affected by FMRP-C (Fig. 7I; S9F, G). These data suggest that FMRP-C may not exert translational control on putative FMRP targets.
Behavioral features of individuals with FXS include cognitive impairment, hyperactivity, attention deficits, sensory hypersensitivity, and social interaction and autistic-like behaviors. Many of these phenotypes are recapitulated in Fmr1 KO mice77. In the open field assay (Fig. 7J), Fmr1 KO mice showed increased total distance traveled compared to WT littermates, indicative of hyperactivity. Fmr1 KO mice also spent more time in the center of the arena, possibly indicating reduced anxiety. All these phenotypes were significantly rescued by FMRP-C, whereas WT mice were not affected by FRMP-C expression. In the novel object recognition (NOR) assay (Fig. 7K), the exploration time spent with objects in each group during the training period was similar, indicating no obvious difference between groups and objects at baseline. Fmr1 KO mice exhibited deficits in the NOR and novel place recognition (NPR) tests. FMRP-C rescued these learning and memory deficits. Together, these results support the notion that FMRP-C critically mediates the mito-Ca2+ homeostasis and cognitive functions of FMRP, and that it likely exerts its effects through direct interaction with VDAC1 at ERMCS.
DISCUSSION
A key finding from this study is that mito-Ca2+ homeostasis conferred by Ca2+ transfer from ER to mitochondria is deregulated in FXS. Using well-accepted Drosophila and mouse FXS models, and cultured mammalian cells, including patient iPSC-derived neurons, we show that FMRP performs a conserved function in regulating mito-Ca2+ homeostasis. Through proximity labeling and protein-protein interaction analyses, we show that FMRP is present at ERMCS where it physically interacts with the ERMCS protein VDAC. FMRP appears to antagonize the activity of the IP3R-GRP75-VDAC axis on ER-mitochondria tethering and ER-to-mitochondria Ca2+ transfer, as both processes are heightened in FMRP deficient cells. Importantly, genetic and pharmacological manipulations that inhibit the IP3R-VDAC axis effectively rescued the aberrant synaptic morphology and function, hyperlocomotion and learning and memory deficits of dFmr1 flies, and behavioral deficit in Fmr1 KO mice. Restoration of VDAC interaction with FMRP using FMRP-C rescued behavioral deficits of Fmr1 KO mice and cellular defects in mito-Ca2+, MMP, and mito-ROS in FXS iPSC neurons. Our findings uncover ERMCS-directed mito-Ca2+ homeostasis as a previously unappreciated cellular process mediating FMRP function and a potential therapeutic target for FXS.
Altered mitochondrial function has been observed in previous studies of Fmr1 KO mice and dFmr1 flies17,19-22. In two of the studies that explored the underlying mechanisms, one reported mitochondrial fusion defect in Fmr1 KO mouse caused by reduced mRNA and protein levels of Huntingtin, and pharmacological restoration of mitochondrial fusion proves to be beneficial20. Another study reported mitochondrial inner membrane proton leak in FXS neurons caused by abnormally high levels of the ATP synthase c-subunit, with the proton leak causing persistence of an immature metabolic phenotype. Here ATP synthase c-subunit is not a direct target of FMRP. Rather FMRP regulates proton leak through its target mRNA encoding ATP synthase β-subunit22. Our study shows that beyond the canonical mechanism of FMRP acting through RNA-binding and translational control as shown by the above studies, a non-canonical mechanism involving direct interaction with ERMCS component VDAC1 also mediates FMRP regulation of mitochondrial function, synaptic morphology and function, and behavioral output. Supporting the importance of ERMCS and mito-Ca2+ to brain health, mutations in ERMCS components are linked to neurological defects78-80. Beside Ca2+ transfer, ERMCS performs other functions, from lipid synthesis and transfer, mitochondrial remodeling, to autophagy and immunity, processes fundamental to neuronal health and defects in which have been seen in FXS16,20,81. While this study focuses on the role of mito-Ca2+, future studies will test the contribution of the various other ERMCS functions to FXS pathogenesis.
Our results identify VDAC as an interacting partner and a critical mediator of FMRP function. VDAC is a β-barrel membrane protein located in the OMM that is involved in the transport of metabolites, neurotransmitters, calcium, mitochondrial DNA, and cytochrome C across mitochondrial membrane under physiological and pathological conditions82. As such, it exerts strong influence on the life and death decisions of neurons. VDAC has two conductance states: an open anion selective state, and a closed and slightly cation-selective state. VDAC conductance states play major roles in regulating mitochondrial membrane permeability. The VDAC pore can be modulated via binding partners, leading to a reversible closed state82. FMRP interacts with the N-terminus of VDAC, which has been implicated in the voltage-sensitive gating of VDAC, as well as reversible stabilization of the barrel in an open state83. It is thus possible that FRMP may regulate the gating and conductance states of VDAC through interaction with its N-terminus. Future structural studies will test this possibility.
Mitochondrial oxidative stress and high cellular calcium concentrations trigger opening of the mPTP, and VDAC has been implicated in regulating the opening of the mPTP84. Transient mPTP opening regulates Ca2+ and mito-ROS signaling, while prolonged mPTP opening results in mitochondrial energetic dysfunction, organelle swelling, rupture, and cell death84. Transient mPTP opening and the resultant mito-Ca2+ increase may promote ATP production by stimulating the TCA cycle and the ETC as many enzymes in these processes are Ca2+-dependent. But prolonged mPTP opening may lead to mito-Ca2+ overload, MMP decrease and compromised ATP production and cell viability. Physiological regulation of the mPTP is important for cellular health, development, and aging85,86. In the developing nervous system, transient opening of the mPTP can generate short bursts of mito-ROS, which mediate metabolic switch from glycolysis to OxPhos and can suppress neural progenitor cell proliferation and promote neuronal differentiation87. Opening of the mPTP also plays a role in mitochondrial quality control, as mPTP opening depolarizes mitochondria, marking them for mitophagy88. So far VDAC’s role in mPTP has been mainly studied in pathological contexts such as ischemic stroke89. It would be interesting to test potential roles of VDAC-FMRP interaction on neuronal development and synaptic maturation and plasticity.
An overarching goal of FXS research is to achieve deeper understanding of disease mechanisms so that rational therapeutic approaches can be devised to treat the disease. Current proposed therapeutic approaches for FXS mostly target the excess of protein synthesis, but the lack of clear efficacy in patients suggests that other critical molecular alterations may also need to be considered18. Given the efficacy of ERMCS and VDAC-targeting compounds in the animal models tested here, drugs targeting ERMCS/mito-Ca2+ as stand-alone therapy or combination therapy with drugs targeting translation may deserve serious consideration.
Limitations of the study:
Our iPSC studies are limited by the number of cell lines available. More cell lines will help reveal possible heterogeneity of phenotypes among normal subjects and patients. Although FMRP-C can rescue some of the behavioral defects of Fmr1 KO mouse, it remains to be determined if this is mediated by components of the ERMCS and if dFMR1-C exerts similar activity in flies. Finally, although FMRP-C interacts with VDAC and influences ERMCS formation and mito-Ca2+ homeostasis, we cannot exclude the possibility that interaction with other proteins or cellular pathways is also important for organismal function of FMRP.
STAR★METHODS
Resource Availability
Lead Contact. Further information and requests for resources and reagents should be directed to and will be fulfilled by the Lead Contact, Bingwei Lu (bingwei@stanford.edu)
Materials Availability. All unique/stable reagents generated in this study are available from the Lead Contact with a completed Materials Transfer Agreement.
- Data and Code Availability.
- All data reported in this paper will be shared by the lead contact upon request.
- This paper does not report original code.
- Any additional information required to reanalyze the data reported in this work paper is available from the Lead Contact upon request.
Experimental Model and Subject Details
Mouse
Fmr1 KO mice provided by Dr. Lu Chen of Stanford University or purchased from Jackson Lab (#003025) were maintained as colonies at the Stanford University Animal Facility. Food and water were available ad libitum, and the cage contained shredded paper bedding as standard housing. Animals were kept on a 12-h light/dark cycle (lights on at 6:00 h), and the room temperature was controlled via a thermostat set at 21°C. Animal welfare and experimental procedures were approved by the Stanford University Administrative Panel on Animal Care (APLAC).
Drosophila
All Drosophila stocks and genetic crosses were raised on standard fly food and maintained at 25°C in fly incubators with a 12 h light: dark cycle. The fly stocks were obtained from the following sources: UAS-mito-GFP was a gift from Dr. William Saxton. PINK1B9 and Porin A2 mutant were obtained from Dr. Jongkyeong Chung; The dFmr1 RNAi (#27484, #35200), UAS-dFmr1 (#6931), Fmr1Δ113M (#67403) and Fmr1Δ50M (#6930), UAS-KDEL-GFP (#9898); and UAS-mito-DsRed (#93056) fly stocks were obtained from the Bloomington Drosophila Stock Center. All other stocks were general lab stocks or generated in our laboratory. Fly food was prepared with a standard receipt (Water, 17 L; Agar, 93 g; Cornmeal, 1,716 g; Brewer’s yeast extract, 310 g; Sucrose, 517 g; Dextrose, 1033 g). Both males and females were used for the described studies as no phenotypic differences were observed between sexes.
Cell Lines
U2OS, HEK293T, Hela cells were purchased from ATCC, and normal fibroblast (GM03377, AG01552D) and FXS patient derived fibroblasts (GM05131 and GM05185) were purchased from Coriell Institute for Medical Research. All cells were cultured in DMEM high-glucose media (11965084, Gibco) supplemented with 10% FBS (100-602, Gemini Bio) and Penicillin-Streptomycin (15140-122, Gibco). FXS (WC005i-FX11-7 and WC007i-FX13-2) and normal (UWWC1-DS2U) iPSC cell lines were obtained from WiCell Research Resources (Wicell, WI).
METHOD DETAILS
Primary neuronal culture
For primary neuronal culture, cover glasses were coated with 100 μg/mL poly-L-lysine overnight before primary neuronal culture. The dissected cortex from P0 C57Bl6 and FMR1 KO mouse were transferred into 10 ml of PBS on a 35-mm dish on ice, and the cortex was cut into small pieces and transferred into 50 ml FALCON tubes with 10 ml HBSS containing 0.125% Trypsin at 37°C for 20 min followed by DMEM containing 10% FBS to neutralize digestion. These cells were then cultured in Neurobasal media supplemented with B27 (GIBCO), 0.5 mM glutamine (GIBCO), 25 μM glutamate (Sigma-Aldrich), penicillin/streptomycin. The medium was changed once two days. On days in vitro (DIV) 2, cells were infected with Lenti-virus to overexpress FMRP-C. On DIV 9, the cells were used to measure mitochondrial functions. On DIV 5, cells were treated with 10 μM 2-APB, or 10 μM DIDS for 5 days.
iPSC-derived neuronal culture
Normal and FXS iPSCs were differentiated according to a protocol previously described 90. Briefly, Normal and FXS iPSCs were treated with Accutase and plated as dissociated cells on Matrigel-coated plates using mTeSR1 supplemented with ROCK inhibitor. The next day, cells were transfected with TetO inducible NGN2 lentivirus using polybrene (8 μg/ml, Sigma). The following day, culture medium was replaced with N2 containing Doxycycline (2 μg/ml) with subsequent puromycin selection (2 μg/ml). After puromycin selection, H1 ESCs and FXS iPSCs cells were transfected with FMRP-C lentivirus and viral transfected neurons retained in N2 medium with change of medium every day for 10 days. Then differentiated neurons were processed for in situ PLA, mito-Ca2+, and immunostaining assays.
MPTP mouse model of PD
MPTP-PD modeling was conducted as described previously 91. Adult male C57Bl/6 mice were administered intraperitoneally with MPTP (dissolved in PBS) in a final concentration of 25 mg/kg daily for five consecutive days. After 12 days, mice were sacrificed and the striatum was dissected and kept at −80°C refrigerator for further experiments.
Compound treatments
2-Aminoethoxydiphenyl borate (2-APB), Cyclosporin A (CsA) and 4’-diisothiocyano-2,2’-disulfonic acid stilbene (DIDS) were dissolved in water and mixed with Formula 4-24® Instant Drosophila Medium. For fly calcium assay, 100 μM 2-APB, 5 μM CsA and 100 μM DIDS were mixed in the food and feed fly for 24 h. For larvae crawling pathway, 100 μM 2-APB, 5 μM CsA and 100 μM DIDS were mixed in corn meal/agar food and feed them for 24 h. For NMJ assay, 100 μM 2-APB, 5 μM CsA and 100 μM DIDS feed for 2 days. For climbing and memory assays, flies were fed instant food containing different concentrations of 2-APB (5, 10, 100 μM), CsA (1, 5, 10 μM) or DIDS (5, 50, 100 μM) for 5 days. For mitochondrial calcium assay in cell line and fibroblasts, cells were incubated with 2-APB (100 or 200 μM), CsA (5 or 20 μM) or DIDS (100 or 300 μM) for 6 h. For sensitive primary neurons, 10 μM 2-APB or 10 μM DIDS were used for 5 days.
For CsA treated C57BL6 and FMR1 KO mice, CsA was dissolved in 20% 2-Hydroxylpropyl-beta-cyclodextrin (HP-beta-CD) (H107, Sigma Aldrich), and mice were oral administrated by 12.5 mg/kg once a day for one week.
Larval crawling assay
Larval crawling abilities were measured similarly as reported previously 67. Briefly, third-instar larvae (n =10) were placed on the center of a 10-cm petri dish containing 2% agarose, and their crawling behavior was digitally recorded for 30 second using a camera. The snapshots of video imaged every 1 sec were used to trace a travel path for each individual larva by Manual Tracking in ImageJ (NIH, USA), and movement distances were calculated using ImageJ.
Larval NMJ analysis
NMJs on larval body wall muscle were stained with the mouse anti-Discs large 1 (anti-Dlg) primary antibody (DSHB) and Texas Red-conjugated anti-HRP (Jackson Immuno Research). At least 6 third-instar stage (L3) larvae of normal body size were dissected and the muscle 4 NMJs of abdominal segments 4 (A4) were analyzed. All fluorescent pictures were taken with a 63× objective on a Leica SP8 Confocal Microscope. The numbers of synaptic branches, synaptic boutons, and the maximum length of each NMJ were measured using ImageJ. A synaptic branch was defined as an axonal projection with at least 2 synaptic boutons.
Climbing ability of adult flies
For climbing trials, 15 male flies were transferred to a 250 mL glass graduated cylinder that was sealed with paper to prevent escape. The flies were knocked down to the bottom. The percentage of flies that crossed the 17 cm line within 15 second was measured. Three trials were performed for each population and their average was taken for a sample value. Experiments were performed between 4-5 pm to minimize potential effects of circadian oscillation.
Taste memory assay
Taste memory assay was performed according to published methods with slight modification 68. Flies were starved for 12 h and anesthetized on ice before fixed onto a glass slide using nail polish. The flies were kept at 25°C in a humidified incubator to recover for 2 h. The assay was divided into three different phases. The first is the pretest where the legs of flies were stimulated by 500 mM sucrose. Flies with positive proboscis extension were used in the second phases. The second phase is training phase where files were presented with 500 mM sucrose at the leg while simultaneously being punished with 10 mM quinine hydrochloride solutions at the labellum. Training was repeated 20 times for each fly. Data for the training binned into four five-trial. After training was completed, the flies were given 500 mM sucrose stimuli at the leg at different time intervals (0, 5, 15, 30, 45 and 60 min), and the proboscis extension response was recorded.
Electrophysiology
Drosophila electrophysiological recordings were performed from the neuromuscular junction (NMJ) at room temperature in HL3 saline containing the following components (in mM): 70 NaCl, 5 KCl, 10 NaHCO3, 10 MgCl2, 110 sucrose, 8 HEPES, and 1 CaCl2. Muscle fiber 6 in abdominal segments 3 and 4 from third-instar larvae were used. To induce presynaptic homeostasis at larval NJM, we perfused 10 μM Philanthotoxin (PhTX) to block glutamatergic transmission in the animal for 10 min in semi-intact preparations as described before 69. Semi-intact preparations were achieved by pinning the anterior and posterior extremities of a larva and then making dorsal incisions, without stretching the muscle fibers, in HL3 saline containing 0.3 mM CaCl2. After PhTX perfusion, the CNS, fat and gut were then removed after carefully cutting the segmental nerves proximal to the ventral ganglion. Intracellular recordings of EPSPs and mEPSP were conducted with sharp electrodes filled with 3 M KCl. mEPSPs were collected for up to 2 min using Axoclamp 900A amplifier. mEPSPs were identified manually and the traces were analyzed using MiniAnalysis (Synaptosoft), and the average mEPSP frequency was calculated by dividing the total number of mEPSP events by 120 seconds (s). EPSPs were evoked by stimulating segmental nerves with ~8 μm diameter suction electrodes filled with HL3 solution. 1 ms pulses with 50 nA at 0.05 Hz were introduced for EPSPs generation. Quantal content (QC) was calculated by dividing mean EPSP by mean mEPSP for each cell. Cells with resting membrane potential maintaining between −55 and −60 mV were used in the study. All statistics analyses were performed in GraphPad Prism 6.
Immunostaining and super resolution imaging
Flies were anesthetized using CO2-enriched air, and thorax or brain tissue was dissected under a dissecting microscope and fixed in fixing solution (4% paraformaldehyde and 0.3% Triton X-100 in PBS) at 4°C overnight. The thoraces were subdivided into small chunks. The brain was removed from the head cuticle, and the surrounding trachea was carefully removed. Samples were permeabilized with 0.5% Triton X-100 in PBS for 45 min. After blocking with 3% BSA for 1 h, tissues were incubated with primary antibodies at 4°C overnight. Thoraces were washed three times with PBST (PBS with 0.1% Triton X-100) and incubated with fluorescent-dye-conjugated secondary antibodies for 1 h at room temperature. Nuclei were stained with DAPI (10 μg/ml) for 30 min. Images were acquired using Leica SP8 Confocal Microscope.
Cells were washed with PBS, fixed with 4% paraformaldehyde for 15 min and permeabilized with 0.5% Triton X-100 in PBS for 15 min. After blocking with 3% BSA for 1 h, cells were incubated with primary antibodies at 4°C overnight. Slides were washed three times with PBST and incubated with fluorescent-dye-conjugated secondary antibodies for 1 h at room temperature. Nuclei were stained with DAPI (10 μg/ml) for 3 min. Images were acquired using Leica SP8 Confocal Microscope.
For super resolution imaging, cells were seed on #1.5 glass coverslips (Deckglaser). The staining was performed as immunostaining, and Goat anti-Rabbit IgG (H+L) Cross-Adsorbed Secondary Antibody (Alexa Fluor™ 488, Invitrogen) and Goat anti-Mouse IgG (H+L) Cross- Adsorbed Secondary Antibody (Alexa Fluor™ 555, Invitrogen) were used in dual color staining followed by ProLong Gold Antifade Mountant (P10144). The super-resolution images were taken by 660 nm gated TauSTED (Leica).
Quantitative colocalization analysis
Colocalization between organelles was quantified using the Manders' correlation coefficients (MCC) that is invariant to ROI size and unequal signal strength and total signal strength 92. MCC was carried out with the JACoP plugin of the Image J software (NIH [http://rsb.info.nih.gov/ij/plugins/track/jacop.html]) to measure the colocalization of FMRP with organelles (mitochondria and ER) and MERCs. The MCC values varied from 0 to 1, indicating no co-localization or complete co-localization, respectively. The Mander’s coefficients is independent of the pixel intensities within the individual channels. Images were processed with a 2-pixel median filter (XY block size), and background was subtracted with a 1-pixel sliding paraboloid before quantitation (Z block size). Costes randomization test is calculated by comparing the coincidence of colocalization in an original image against the coincidence of colocalization in a randomized imaged of shuffled pixels (200 times) in JACoP plugin. The p value of ⩾95% in Costes randomization test suggests that colocalization is significant and not random.
Western blotting
Cultured cells and fly tissues were lysed in lysis buffer (50 mM Tris-HCl pH7.4, 150 mM NaCl, 10% glycerol, 1% Triton X-100, 5 mM EDTA) containing protease/phosphatase inhibitor (B14001/B15001, Bimake). After centrifugation at 14,000 × g at 4°C for 15 min and denaturation by boiling in loading buffer, samples containing 30 μg proteins were separated by 12.5% SDS-PAGE or NuPAGE™ Bis-Tris gel and transferred onto PVDF membranes. Following blocking with 5% nonfat milk at room temperature for 1 h, membranes were incubated with primary antibodies at 4°C overnight. Membranes were rinsed three times with TBST (0.1% Tween20 in TBS) for 10 min each and incubated with HRP-conjugated secondary antibody for 1 hour. After being washed three times with TBST for 10 minutes each, the membrane was completely incubated with ECL substrate (Perkin Elmer, Beaconsfield, UK) for 1 min. Finally, membrane was exposed to autoradiography film in a darkroom. Intensity of immunoblot bands was quantified using ImageJ software.
Real time-qPCR and RNA immunoprecipitation (RNA-IP)
Quantitative real-time PCR (qPCR) was performed using PowerUp™ SYBR™ Green Master Mix (A25742, Invitrogen) in a total volume of 10 μl using Applied Biosystems™ StepOne™ Real-Time PCR System (Applied Biosystems) as follows: 95 °C for 30 s, 40 cycles of 95 °C for 5 s, and 60 °C for 30 s. All results were normalized to the expression of β-actin, and relative quantification was calculated by the 2−ΔΔCt method.
For RNA-IP, cells transfected with FMRP-FLAG-MYC or cotransfected with FMRP-FLAG-MYC and 3FLAG-VDAC1 were harvested and lysated in freshly prepared lysis buffer (1% Triton X-100, 150 mM NaCl, 50 mM Tris·HCl, pH 8.0, 1 × protease inhibitor mixture, 400 units/ml RNase inhibitor). The suspensions were incubated on ice for 20 min with occasional mixing by inversion. Debris were cleared by centrifugation at 15,000 × g for 15 min. The equal amount of samples were normalized based on protein concentration. 20 μl anti-myc beads magnetic beads (MedChemExpress) were added to the samples, and IP was carried out by rotating the tubes at 4°C for 6 h. After IP, beads were washed three times with lysis buffer. RNA extraction from the beads with RNeasy mini kit from Qiagen (Valencia, CA) was carried out according to the manufacturer's instructions. Reverse transcription was performed by using an iScript cDNA synthesis kit (Bio-Rad). The targets of FMRP were analyzed by qPCR of cDNA using Quick-Load® Taq 2X Master Mix (NEB).
Co-IP assay
Cells or fly tissues were homogenized in lysis buffer. After centrifuging at 14,000 g and 4°C for 15 min, the supernatant was immediately transferred to new tubes. Protein concentration was measured using BCA kit. A total of 10 μl 50% protein A/G agarose was added to 1 ml sample solution and shaken for 30 min to eliminate nonspecific binding proteins. After centrifuging 500 g for 15 min, 1 μg primary antibody was added into the supernatant to mix for 1 h followed by adding 20 μl 50% protein A/G agarose at 4°C overnight. Then, the tubes were centrifuged at 500 g for 5 min, the pellet was washed 3 times with precooled PBST, and the beads were boiled in loading buffer. The supernatants were collected and subjected to Western blot analysis.
For GFP-IP, 24 hrs after being transfected with GFP-tag plasmids using lipofectamine 3000 (Invitrogen), HEK293 cells were collected and lysed in lysis buffer containing protease/phosphatase inhibitor. After centrifugation at 14,000 g and 4°C for 15 min, 20 μl 50% GFP-trap agarose (GTA-10, Chromotek) was added to the supernatant and mixed at 4°C overnight. Then, the tubes were centrifuged at 500 g for 5 min, the pellet was washed 3 times with precooled PBST, and the beads were boiled in loading buffer. The supernatants were collected and subjected to Western blot analysis.
Crude mitochondria and MAM isolation
MAM isolation was performed as described 52. In brief, cells were manually homogenized in buffer (30 mM Tris-HCl pH 7.4, 225 mM mannitol, 75 mM sucrose, 0.5 mM EGTA, protease inhibitor and 0.5% BSA) on ice. Nuclei and unbroken cell debris were pelleted by centrifugation at 700 × g for 5 min. The nuclei-free supernatant was collected and centrifuged at 6300 × g for 10 min at 4 °C. Supernatant containing ER and various multivesicular particles was collected as crude cytosolic supernatant and keep on ice for further fractionation. The pellet containing crude mitochondria and MAM was washed twice and suspended in 2 ml of resuspension buffer (250 mM mannitol, 5 mM HEPES, pH 7.4, and 0.5 mM EGTA), layered on top of 30% percoll (v/v) medium (225 mM mannitol, 25 mM HEPES, pH 7.4, 1 mM EGTA), and centrifuged at 95,000 × g for 45 min. The pellet was collected as pure mitochondria, and the supernatant containing MAM was further centrifuge at 100,000 × g for 60 min at 4 °C. After centrifugation, the purified MAM fraction could be seen as a floating sheet at the bottom of the tube. The crude cytosolic supernatant was centrifuged at 20,000 × g for 30 min at 4 °C followed by ultracentrifuging at 100,000 × g for 60 min at 4 °C, the pellet was collected as purified ER. All the fractions were flash frozen by liquid nitrogen and preserved in −80 °C until further analysis.
Mitochondria digestion with proteinase
For proteinase K digestion, crude mitochondrial fraction isolated from two 10-cm dishes of HEK293T cells was suspended in resuspension buffer and equally divided into 8 parts. Each part was incubated with different proteinase K (0.1, 0.3, 1, 3 μg/ml) with or without 1% Triton X-100 for 15 min on ice. For RNase digestion, crude mitochondria were incubated with 50 μg/ml for 1 h at room temperature. Mitochondria were pelleted by centrifugation at 13,000 × g for 10 min, and analyzed by SDS-PAGE and Western blotting.
MERLIN (Mitochondria-ER Length Indicator Nanosensor) assay
MERLIN55 is based on bioluminescence resonance energy transfer (BRET) to detect distances between the mitochondria (mitochondria-targeted mVenus) and ER (ER-targeted Rluc). In brief, the cells were transfected with MERLIN constructs for 16 h, washed with PBS, incubated with 5 μM coelenterazine (S7777, Selleck) in PBS for 5 min in the dark. Signals were measured using the dual emission option at 480 nm (Rluc-signal) and 527 nm (BRET-signal) by Infinite 200 PRO plate reader (Tecan).
Plasmid construction
To construct pMER-splitGFP, the fragment containing TOMM70 and 2× spGFP11 cloned from pLVX-Mitot-2×spGFP11, and the fragment containing spGFP1-10 and the residues 228-259 of UBE2J2 cloned from plx304-spGFP1-10-ERt, and P2A self-cleaving peptides were inserted into pEGFP-N3 vector. MER-splitGFP was cloned through PCR and inserted in pLenti CMVie-IRES-BlastR to generate the lenti viral construct. The intensity of MER-splitGFP were detected by performing flow cytometry (NovoCyte Quanteon™ Flow Cytometer, ACEA Biosciences).
The human VDAC cDNA construct was cloned into the p3FLAG-Myc-CMV vector in frame using the restriction enzyme NotI/BamHI sites (New England Biolabs). Δ26M-VDAC was generated from p-3FLAG-Myc-VDAC using Q5® Site-Directed Mutagenesis Kit (E0554S, NEB). Full-length clone for FMR1 was obtained from Origene. A PCR-based strategy was used to obtain the following truncated constructs for FMR1: FMRP-N (1-211), FMRP-NM (1-422), FMRP-NMΔRGG (1-516), full length FMRP, FMRP-M (212-422), FMRP-MC (212-632), FMRP-C (423-632). These sequences were cloned into pEGFP-Cl vector using EcoRI/PstI cloning sites. All constructs were verified using sequencing.
Recombinant protein purification
Human FMRP-N, FMRP-C and FMRP cDNAs were cloned into pCold vector, and plasmids were transformed into the BL21(DE3) Competent E. coli (C2527, NEB) by heat shock. Cells were grown in LB medium supplemented with 100 μg/ml ampicillin at 37°C in a Shaker at 200 rpm until cells reached optical density at 600 nm (OD600) of 0.6. Recombinant expression was induced at 16°C and addition of 0.5 mM IPTG. After 12 h cells were harvested by centrifugation and resuspended in ice-chilled sonication buffer (50 mM Tris HCl pH 8.0, 250 mM NaCl, 1× cOmplete protease inhibitor cocktail (Roche)) and sonicated on ice at 300 W (total time 10 min. 3s on, 5s off) using a VibraCell sonicator (Sonics). Then, the lysates were centrifugated at 10,000× g for 30 min at 4°C, and the supernatants were collected for purification. Briefly, the Ni2+-charged resin was mixed with the supernatant. The mixture was incubated at 4°C with rotation for 2 h. After loading to a 3 ml column, the resin-supernatant reaction was subsequently washed with sonication buffer and eluted with 500 mM imidazole in sonication buffer. The eluted fractions from Ni2+ chelating purification were applied to Microcon-10 kDa Centrifugal Filter for concentration and desalting. FMR1-N, FMR1-C and FMR1-containing solutions were pooled, concentrated, and stored at −80°C.
Lenti and AAV-virus preparation
The short-hairpin RNA sequence of Fmr1 (GCGTTTGGAGAGATTACAAAT) was synthesized and subcloned between the AgeI and EcoRI restriction sites of the pLKO.1 puro lentivirus expression vector (Addgene). For making Fmr1 KO cells, sgRNA (CACCGTTGGTGGTTAGCTAAAGTG) targeting Fmr1 was synthesized and subcloned into lentiCRISPRv2. To overexpress FMRP-C in neurons, the C- terminus of FMRP was cloned into pCDH-EF1-FHC vector. Lentivirus was produced in HEK293T cells after psPAX2, pMD2.G and CRISPR V2 or pLKO.1 transfection, concentrated using Lenti-X™ Concentrator (Clontech Laboratories 631231), and divided into small aliquot and stored at −80°C. To establish FMRP deficient stable U2OS cell lines, cells were plated in 6-well plates in medium with 10%FBS and 2 μg/ml polybrene and infected with 20 μl of virus. The medium was refreshed, and puromycin (2 μg/ml) was added for selection after 48 h.
The AAV-PHP.eB-Syn1-FMRP-C-FLAG virus (3.1 × 10¹²vg/ml) was produced by standard triple-transfection methods into HEK293T cells using a pAAV-U6-hSyn::mCherry.3xFLAG-WPRE transgene plasmid, a pUCmini-iCAP-PHP.eB capsid plasmid, and a pHelper plasmid. These plasmids were transfected into HEK293T cells by using Lipofectamine 2000, and cells were further cultured for 72 h. Cells were collected by centrifugation, and AAV virus in cells were enriched by using a AAVpro® Purification Kit Maxi (All Serotypes) (Cat#6666, Takara). Titer was determined by qPCR according to Addgene’s manual.
ICV injection
Two-month-old WT and Fmr1 KO mice were anesthetized with 2% isoflurane gas and 2% oxygen. After mice were immobilized in a stereotaxic apparatus, a linear skin incision was made over the midline, and a 1-mm burr hole was drilled in the skull 0.4 mm anterior and 1 mm lateral to the midline on the right hemisphere using a mechanical drill. AAV-PHP.eB-Syn1-FMRP-C-FLAG (1×10¹⁰vg of each mouse) was injected unilaterally into the lateral ventricle 1.8 mm below the surface of the skull using a Hamilton syringe mounted to a microinjection pump with a 33G needle. Injection rate was 500 nl/min. The needle remained in place in the injection site for an additional 5 min before being slowly removed.
In situ proximity ligation assay
In situ proximity ligation assays (PLA) in fibroblasts and U2OS cells were performed as described previously (Fredriksson et al., 2002). Cells were washed with PBS, fixed with 4% paraformaldehyde for 15 min, and permeabilized with 0.5% Triton-X in PBS for 15 min, followed by blocking and overnight incubation with primary antibodies at 4°C. Cells were washed, probed with secondary antibodies conjugated with oligonucleotide (Probe Anti-Rabbit PLUS and Anti-Mouse MINUS), ligated, and amplified using In Situ Detection Reagents Red (DUO92002, DUO92004, DUO92008, Duolink, Sigma-Aldrich). Images were acquired using Leica SP8 Confocal Microscope. The number of in situ PLA blobs in each cell were counted.
Electron microscopy
Fresh brain tissues cut into 3 × 3 mm blocks or cells plated in 24-well plates were fixed 1 hour in fixation buffer (0.1 M sodium cacodylate buffer, 1% glutaraldehyde, and 4% formaldehyde) at room temperature and kept at 4°C overnight. The samples were processed, trimmed, and stained according to the standard protocols implemented at the Cell Sciences Imaging Facility at Stanford University School of Medicine. The images were acquired using the JEOL TEM 1400 electron microscope. The distance between the ER and mitochondrial outer membrane was obtained by measuring the closest distance between their contours using ImageJ.
Subcellular Ca2+ measurements
Rhod-2AM staining
Cells were washed with PBS and loaded with 5 μM Rhod-2AM (R1244, Invitrogen) in HBSS without calcium/magnesium for 1 h. Cells were washed with PBS twice to remove the extra dyes. The fluorescent intensity was detected at an excitation wavelength of 552 nm and an emission wavelength of 581 nm using an Infinite 200 PRO plate reader (Tecan).
Genetically encoded calcium indicators
Cells transfected with Mito-GCaMP plasmid or co-transfected with ER-GCaMP3 and Mito-RCaMP1b for 24 h were incubated in HBSS without calcium/magnesium and treated with 100 μM Histamine. The GCaMP or RCaMP intensities were recorded using Leica SP8 Confocal Microscope and were processed using Image J software (National Institutes of Health). Fluorescent signals were expressed as ΔF/F0 values, where F0 is basal fluorescence before the addition of histamine and F is a peak intensity of fluorescence in the response. Imaging of TH-Gal4>mito-GCaMP flies was performed as previously described 45. Briefly, brain samples were dissected and incubated in HBSS without calcium/magnesium, mounted to a coverslip and GCaMP fluorescence signal detected using a Leica SP8 Confocal Microscope.
Mt-Fura-2 AM staining
Mt-Fura-2 AM is a membrane-permeant fluorescent mitochondria-targeted sensor for ratiometric analysis of mitochondrial calcium. It was previously described 61 and obtained from Andrea Mattarei. In brief, cells were washed with PBS and loaded with 2 μM mt-fura-2 AM in HBSS without calcium/magnesium for 1 h. Then, cells were washed with PBS twice to remove the extra dyes. Mt-fura-2 AM with an excitation peak at 400 nm and an emission peak at 510 nm will shift from 400 nm to 340 nm when binds to calcium, and the 340/400 nm excitation ratio for fura-2 allows accurate measurements of the mitochondrial Ca2+ concentration. The ratio of 340/400 with or without 100 μM Histamine was recorded by using a FLEXstation II Fluorometer (Molecular Devices).
Proximity labeling with FMR1-miniTurbo
MiniTurbo was cloned from C1(1-29)-miniTurbo-V5_pCDNA3 (#107174, Addgene) and fused to the C-terminus of FMRP to form FMRP-miniTurbo using a NEBuilder® HiFi DNA Assembly Master Mix kit (E2621S, NEB). Three 10 cm dishes containing 70% confluent HEK293T cells were transfected with FMRP-miniTurbo using PEI (1 μg/ml) for 24 h, 500 μM biotin was added to cells for 6 h, and cells were collected and lysed in 1 ml of lysis buffer. After centrifugation at 14,000 × g for 15 min, supernatant was collected and incubated with 25 μl Pierce™ High Capacity NeutrAvidin™ Agarose (29202, Thermofisher) at 4°C overnight. Beads were collected by centrifuging at 500 × g for 5 min and washed twice with lysis buffer. Finally, beads were resuspended in loading buffer and boiled for 10 min followed by Western blot analysis. The boiled samples were loaded on 10% SDS-PAGE gel and enriched on the top of the gel after running at short time. The gel was performed Coomassie Brilliant Blue Stain, and the enriched band was cut to do HPLC-MS in Stanford University Mass Spectrometry (SUMS) to identify the proximity proteins.
Mitochondrial ATP measurement
ATP was measured using an ATP Bioluminescence Assay Kit CLS II (11699709001; ROCHE) by following the manufacturer’s protocol and normalized with protein concentration. Mitochondria were isolated from cells, muscle of flies and brain tissues of mice as mentioned above, and the mitochondrial proteins were measured using the BCA kits. The luciferase activity is measured using Lumat LB 9507 (Berthold Technologies).
Mitochondrial swelling assay
The concentrations of mitochondria isolated from the brain of male Fmr1 KO mice or from the muscle of dFmr1-RNAi flies or dFmr1 overexpressing cells were measured using the BCA kits (Thermo fisher). Isolated mitochondria were resuspended in recording buffer (70 mM sucrose, 230 mM mannitol, 5 mM HEPES-KOH, 1 mM KH2PO4, supplemented with 0.8 μM rotenone, 5 mM Succinate, pH 7.4). 300 μM CaCl2 was added and light scattering at 540 nm was measured using a microplate reader (Biotek Epoch). As a positive control, 10 μM CsA was applied in the mitochondrial suspension to incubate for 5 minutes before 300 μM CaCl2 was applied.
Mitochondrial membrane potential measurement
Mitochondrial membrane potential (MMP) was assessed using JC-1 dye (T3168, Invitrogen) and Image-iT™ TMRM Reagent (I34361, Invitrogen). Fluorescent images were captured by Leica SP8 Confocal Microscope, JC-1 red/green ratio was measured according to the instruction manual using a TECAN microplate reader.
MitoSOX detection of mitochondrial ROS
Cells were incubated with 5 μM MitoSOX™ reagent for 30 minutes in the dark at 37°C, and then washed gently three times with PBS. Fluorescent images were captured by Leica SP8 confocal microscope.
CCK8 assay
CCK8 assay was performed to assess cell viability. Sh-Ctrl cells, sh-FMR1 cells, Fmr1 KO cells or transfected cells were cultured in a 96-well plate. After 24 h, cells were treated with rotenone (5 μM and 10 μM), or CCCP (20 μM), or A+O (10 μM antimycin A/10 μM oligomycin) for 24 h. 10 μl of CCK8 was added into each well and after incubation for 2 hr, cell viability was determined by measuring the absorbance at 450 nm.
Mouse behavioral assays
Mouse behavioral studies were performed at the Stanford Behavioral and Functional Neuroscience Laboratory (SBFNL) at Stanford University School of Medicine.
Open field test
Open field is applied to measure locomotor activity, which is assessed in open field arenas (45 × 45 cm2) with a designated center zone size (40 × 40 cm2). Mouse is placed in the arena and allowed to freely move in the dark for a total of 10 min while being recorded by an overhead camera. The footage is then analyzed by an automated tracking system for the following parameters: distance moved, velocity, and time spent in center zones.
Novel place recognition (NPR) and novel object recognition (NOR) tests
NPR and NOR were performed using a 3-day protocol to evaluate recognition memory. Objects were generally consistent in height and volume, but different in shape and appearance. During habituation, the mice were allowed to explore an empty arena. 24 hours after habituation, each mouse was placed in the arena and could explore three identical objects placed at an equal distance for 5 min (training phase). Mouse was then removed for a 4 min retention interval and one object was moved to another corner. Mouse was returned to the arena (5 min) and could explore a familiar and novel located sample object (NPR). On day 3, one object was replaced by a new one (pink cylinder) and mouse was allowed to explore for 5 min (NOR). The performance of each group in the NPR and NOR tasks were represented by discrimination index (DI), defined as the difference in exploration time (T) between novel object (TO1) and the other two objects (TO2), divided by the total time spent exploring both objects: DI = (TO1−TO2)/(TO1+TO2). A positive discrimination index represents a greater level of interaction with the novel place or object.
Quantification and Statistical Analysis
Statistical analysis was performed using GraphPad Prism 9 (Windows version 9, GraphPad Software, San Diego, CA, USA). Statistical significance was determined by the unpaired Student t test when two groups were compared. One-way analysis of variance (ANOVAs) followed by Tukey’s multiple comparison test was used for comparisons among multiple groups. All data are represented as mean ± S.D of at least three independent experiments, with P<0.05 being considered statistically significant difference.
Unpaired Student’s t test (Fig. 1F, 2C-I, all in Fig. 3, all in Fig. 5, 7H); Paired Student’s t test (Fig. 4F); ANOVA (Fig. 1B, 1C, 1H, 4A-C, 4E, 4G, all in Fig. 6, 7G, 7I-K). Sample sizes are as follows: Fig. 1B, n=5 from 5 flies in each group; Fig. 1C, n=3 tests with 12 flies in each group one time; Fig. 1F, n=5 images; Fig. 1H, n=5 flies; Fig. 2C, n=5 images; Fig. 2D, n=14 cells; Fig. 2E, n=7 tests; Fig. 2F, n=20 cells; Fig. 2G, n=20 cells; Fig. 2H, n=20 mitochondria; Fig. 2I, n=20 mitochondria. Fig. 3A, n=5 flies; Fig. 3B, n=7 tests; Fig. 3C, n=10 cells; Fig. 3D, n=3 tests; Fig. 3E, F, n=3 tests; Fig. 3G, n=3 tests; Fig. 3I, J, n=3 tests; Fig. 3K, n=5 tests with 10 flies in each group each time; Fig. 3L, n=3 tests; Fig. 3M, n=5 tests. Fig. 4A, n=10 larva; Fig. 4B, n=3; Fig. 4C, n=5 flies; Fig. 4E, n=15; Fig. 4F, n=4 mice in wildtype and n=5 mice in KO group; Fig. 4G, n=4 images; Fig. 5C, n=15 cells; Fig. 5D, n=20 cells; Fig. 5J, n=8 cells; Fig. 5K, n=8 cells; Fig. 6A, n=5 images; Fig. 6B, n=5 positive cells; Fig. 6D, n=3 tests; Fig. 6G, n=5 images; Fig. 6H, n=15 cells; Fig. 6I, n=8 images; Fig. 6J, n=8 cells; Fig. 7G, n=3 mice; Fig. 7H, n=3 mice; Fig. 7I, n=3 mice; Fig. 7J and K, n=5 in WT, n=3 in WT+C, n=9 in KO, n=7 in KO+C.
Supplementary Material
KEY RESOURCES TABLE
| REAGENT or RESOURCE | SOURCE | IDENTIFIER |
|---|---|---|
| Antibodies | ||
| FMR1 | ProteinTech | Cat#13755-1-AP |
| FMR1 | Biolegend | Cat#859001 |
| ACTB | ProteinTech | Cat#66009-1-Ig |
| VDAC | Millipore | Cat#MABN504 |
| CHCHD3 | Abcam | Cat#Ab224565 |
| ATP5A | Abcam | Cat#Ab14748 |
| SDHA | Abcam | Cat#Ab137040 |
| IP3R1 | Santa Cruz | Cat#Sc-6093 |
| IP3R3 | Merck Millipore | Cat#Ab9076 |
| GRP75 | Abcam | Cat#Ab82591 |
| Calnexin | ProteinTech | Cat#10427-2-AP |
| Calreticulin | ProteinTech | Cat#27298-1-AP |
| TOM20 | Santa Cruz | Cat#sc-17764 |
| CypD | ProteinTech | Cat#12716-1-AP |
| ANT1/2 | ProteinTech | Cat#15997-1-AP |
| MCU | ProteinTech | Cat#26312-1-AP |
| MFN2 | Cell Signaling Technology | Cat#9482 |
| Mirol | Sigma | Cat#AV44817 |
| G3BP1 | ProteinTech | Cat#13057-2-AP |
| PSD95 | Cell Signaling Technology | Cat#3450 |
| MAP2 | ProteinTech | Cat#17490-1-AP |
| Tyrosine Hydroxylase | Merck Millipore | Cat#AB152 |
| VAPB | ProteinTech | Cat#14477-1-AP |
| Streptavidin (HRP) | Abcam | Cat#Ab7403 |
| Myc | Cell Signaling Technology | Cat#2272 |
| FLAG | Sigma | Cat#F1804 |
| FLAG | Sigma | Cat#F7425 |
| GFP | Abcam | Cat#Ab13970 |
| GFP | ProteinTech | Cat#66002-1-Ig |
| Texas Red-conjugated anti-horseradish peroxidase | Jackson ImmunoResearch | N/A |
| Discs large (Dlg, Drosophila) | DSHB | 4F3 anti-discs large |
| dFMR1 | DSHB | anti-dFmr1, 5A11 |
| dVDAC | Abcam | Cat#Ab14734 |
| dMARF | Lab stock | N/A |
| dACTB | Santa Cruz | Cat#sc-69879 |
| Chemicals, peptides, and recombinant proteins | ||
| Rhod-2, AM | Invitrogen | Cat#R1244 |
| Fluo-3, AM | Invitrogen | Cat#F1242 |
| JC-1 | Invitrogen | Cat#T3168 |
| TMRM | Invitrogen | Cat#I34361 |
| MitoSOX | Invitrogen | Cat#M36008 |
| MPTP | Selleck | Cat#S4732 |
| Antimycin | Sigma | Cat#A8674 |
| Oligomycin | Sigma | Cat#O4876 |
| CCCP | Sigma | Cat#C2759 |
| Rotenone | Sigma | Cat#R8875 |
| EBSS | Gibco | Cat#24010043 |
| Brefeldin A (BFA) | Selleck | Cat#S7046 |
| Bortezomib (BTZ) | Selleck | Cat#S1013 |
| Thapsigargin (TG) | Cayman | Cat#10522 |
| Tunicamycin | Cayman | Cat#11445 |
| Histamine | Sigma | Cat#H7125 |
| Cyclosporine A (CsA) | Sigma | Cat#PHR1092 |
| 2-APB | Sigma | Cat#D9754 |
| DIDS | Sigma | Cat#309795 |
| Deposited Data | ||
| Full Western blot images | Mendeley data | (https://data.mendeley.com/datasets/wpkr4trvtb/1) |
| Experimental models: Cell lines | ||
| U2OS | Gift from Ron Kopito, Stanford University | N/A |
| HEK293T | Lab stock | N/A |
| HEK293A | Lab stock | N/A |
| HELA | ATCC | CCL-2 |
| Normal fibroblasts | Coriell Institute for Medical Research | GM03377, AG01552D |
| FXS patient derived fibroblasts | Coriell Institute for Medical Research | GM05131, GM05185 |
| Normal iPSC cell line | WiCell Research Resources | UWWC1-DS2U |
| FXS patients derived iPSC cell lines | WiCell Research Resources | WC005i-FX11-7, WC007i-FX13-2 |
| Experimental models: Organisms/strains | ||
| Mouse C57BL/6J | Jackson lab | Cat#000664; RRID:IMSR JAX:000664 |
| Mouse Fmr1 KO | Jackson lab | Cat#003025; RRID:IMSR JAX:003025 |
| Drosophila UAS-mito-GFP | gift from Dr. William Saxton; University of California, Santa Cruz. | N/A |
| Drosophila PINK1B9 mutant | Gift from Dr. Jongkyeong Chung; Seoul National University | N/A |
| Drosophila Porin A2 mutant | Gift from Dr. Jongkyeong Chung; Seoul National University | N/A |
| Drosophila dFmr1 RNAi | Bloomington Drosophila Stock Center | Cat#27484, Cat#35200 |
| Drosophila UAS-dFmr1 | Bloomington Drosophila Stock Center | Cat #6931 |
| Drosophila Fmr1Δ113M mutant | Bloomington Drosophila Stock Center | Cat #67403 |
| Drosophila Fmr1Δ50M mutant | Bloomington Drosophila Stock Center | Cat #6930 |
| Drosophila UAS-KDEL-GFP | Bloomington Drosophila Stock Center | Cat #9898 |
| Drosophila UAS-mito-DsRed | Bloomington Drosophila Stock Center | Cat #93056 |
| Oligonucleotides | ||
| Camk2α mouse Forward: 5’-TGCCTGGTGTTGCTAACCC-3’; Reverse: 5’-CCATTAACTGAACGCTGGAACT -3’ | This paper | N/A |
| App mouse Forward: 5’-TCCGAGAGGTGTGCTCTGAA-3’; Reverse: 5’-CCACATCCGCCGTAAAAGAATG-3’ | This paper | N/A |
| Dlg4 (Psd95) mouse Forward: 5’-TGAGATCAGTCATAGCAGCTACT-3 ’; Reverse: 5’-CTTCCTCCCCTAGCAGGTCC-3’ | This paper | N/A |
| Vdac1 mouse Forward: 5’-CCCACATACGCCGATCTTGG-3’; Reverse: 5’-GTGGTTTCCGTGTTGGCAGA-3’ | This paper | N/A |
| Mcu mouse Forward: 5’-ACTCACCAGATGGCGTTCG-3’; Reverse: 5’-CATGGCTTAGGAGGTCTCTCTT-3ȁ | This paper | N/A |
| Actb mouse Forward: 5’-TGAACCCTAAGGCCAACCG-3’; Reverse: 5’-CACCATCTCCAGAGTCCAGCA-3’ | This paper | N/A |
| Mmp9 human Forward: 5’-TCGTCATCGTCGAAATGGGC-3’; Reverse: 5’-GGGACGCAGACATCGTCATC-3’ | This paper | N/A |
| Map1b human Forward: 5’-GCTTAGTAACTCCCCGATCTCTT-3’; Reverse: 5 ’-CACCGAGGTGCGCTTAATGAT-3’ | This paper | N/A |
| Psd95 human Forward: 5’-GCACGTCCACTTCATTTACAAAC-3’; Reverse: 5’-TCGGTGACGACCCATCCAT-3’ | This paper | N/A |
| App human Forward: 5’-CCATCTGCATAGTCTGTGTCTG-3’; Reverse: 5’-GCCCTGCGGAATTGACAAG-3’ | This paper | N/A |
| Recombinant DNA | ||
| p3FLAG-Myc-CMV | Sigma | Cat#E9283 |
| pEGFP-C1 | Clontech | Cat#6084-1 |
| FMR1-FLAG | Origene | Cat#RC222699 |
| ER-GFP | Addgene | Cat#68072 |
| Mito-DsRed | Addgene | Cat#55838 |
| Mt-Keima | Gift from Wenjie Guo, Nanjing University | N/A |
| PTPIP51-myc | Gift from Chao Tong, Zhejiang University | N/A |
| Parkin-YFP | Addgene | Cat#23955 |
| Mito-mtagBFP-ER | Addgene | Cat#105007 |
| Mito-GCaMP | Addgene | Cat#105009 |
| ER-GCaMP3 | Addgene | Cat#64854 |
| CMV-Mito4x-jRCaMP1b | Addgene | Cat#127873 |
| pLKO.1 puro | Addgene | Cat#8453 |
| LentiCRISPRv2 puro | Addgene | Cat#98290 |
| pCDH-EF1-FHC | Addgene | Cat#64874 |
| pAAV-U6-hSyn::mCherry.3xFLAG-WPRE | Addgene | Cat#120392 |
| pHelper (pAdDeltaF6) | Addgene | Cat#103005 |
| pUCmini-iCAP-PHP.eB | Addgene | Cat#103005 |
| pMito-mVenus | Gift from Ana J García-Sáez, University of Tübingen | N/A |
| pRluc-ER | Gift from Ana J García-Sáez, University of Tübingen | N/A |
| pMER-splitGFP | This paper | N/A |
| Human FMR1 shRNA 5’-GCGTTTGGAGAGATTACAAAT-3’ | This paper | N/A |
| Negative Control shRNA 5’-CCTAAGGTTAAGTCGCCCTCG-3’ | This paper | N/A |
| Human IP3R1 shRNA 5’-GGGATCGACAAATGGATTTAT-3’ | This paper | N/A |
| Human IP3R3 shRNA 5’-GCTGGAAGATCAACCTGTTTA-3’ | This paper | N/A |
| Human RyR1 shRNA 5’-CCGCCTCTTTCATGGACATAT-3’ | This paper | N/A |
| Human RyR2 shRNA 5’-GGTGACTCAGTATGCTATATA-3’ | This paper | N/A |
| Human RyR3 shRNA 5’-GAAAGCCCAGAAGCCTTAAAT-3’ | This paper | N/A |
| Human MCU shRNA 5’-GCAAGGAGTTTCTTTCTCTTT-3’ | This paper | N/A |
| Human FMR1 sgRNA 5’--CACCGTTGGTGGTTAGCTAAAGTG-3’ | This paper | N/A |
| Software and algorithms | ||
| FIJI | Distribution of ImageJ | https://imagej.net/software/fiji/downloads |
| GraphPad Prism | GraphPad Software Inc | https://www.graphpad.com/scientific-software/prism/ |
| Leica LAS X | Leica | https://www.leica-microsystems.com/products/microscope-software/p/leica-las-x-ls/ |
| SoftMaxPro Software | Molecular Devices | N/A |
| Flowjo | BD | https://www.flowjo.com/solutions/flowjo/downloads |
Highlights.
FMRP interacts with VDAC to regulate ER-mitochondria contact site (ERMCS)
FMRP interaction with VDAC regulates mitochondrial Ca2+ (mito-Ca2+) homeostasis
The C-terminal domain of FMRP (FMRP-C) interacts with VDAC
FMRP-C can restore ERMCS and mito-Ca2+ homeostasis, rescuing Fmr1 KO mouse behavior
ACKNOWLEDGEMENTS
We are grateful to Drs. M. Wernig, A. Mattarei, A. Ting for cell lines, plasmids, dyes, and antibodies; Drs. S. Birman, T. Littleton, J. Chung, W. Saxton, the Vienna Drosophila RNAi Center, and the Bloomington Drosophila Stock Center for fly stocks; Stanford PAN facility for primer synthesis; Dr. Lu Chen for Fmr1 mice and brain tissues and sterotactic injection; Dr. Bo Zhou for iPSC culture; Dr. Nay Saw and SBFNL for mouse behavioral assays; The Axelrod, Bogyo, Lipsick, and Svensson Labs in the Department of Pathology, Stanford University School of Medicine for sharing reagents and equipment; J. Gaunce and W. Jiao for maintaining fly stocks and providing technical supports, and members of the Lu lab for discussions. This work was supported by the NIH (R21MH127340, R01NS084412, R01NS083417, and R01AR074875 to B.L), and National Natural Science Foundation of China (81970999 to Y.P).
Footnotes
DECLARATION OF INTERESTS
B.L. is a cofounder and serves on the Scientific Advisory Board of Cerepeut Inc.
Publisher's Disclaimer: This is a PDF file of an unedited manuscript that has been accepted for publication. As a service to our customers we are providing this early version of the manuscript. The manuscript will undergo copyediting, typesetting, and review of the resulting proof before it is published in its final form. Please note that during the production process errors may be discovered which could affect the content, and all legal disclaimers that apply to the journal pertain.
REFERENCES
- 1.Verkerk AJ et al. Identification of a gene (FMR-1) containing a CGG repeat coincident with a breakpoint cluster region exhibiting length variation in fragile X syndrome. Cell 65, 905–914, doi: 10.1016/0092-8674(91)90397-h (1991). [DOI] [PubMed] [Google Scholar]
- 2.Pieretti M et al. Absence of expression of the FMR-1 gene in fragile X syndrome. Cell 66, 817–822, doi: 10.1016/0092-8674(91)90125-i (1991). [DOI] [PubMed] [Google Scholar]
- 3.Darnell JC & Klann E The translation of translational control by FMRP: therapeutic targets for FXS. Nat Neurosci 16, 1530–1536, doi: 10.1038/nn.3379 (2013). [DOI] [PMC free article] [PubMed] [Google Scholar]
- 4.Davis JK & Broadie K Multifarious Functions of the Fragile X Mental Retardation Protein. Trends Genet 33, 703–714, doi: 10.1016/j.tig.2017.07.008 (2017). [DOI] [PMC free article] [PubMed] [Google Scholar]
- 5.Hagerman RJ & Hagerman P Fragile X-associated tremor/ataxia syndrome - features, mechanisms and management. Nat Rev Neurol 12, 403–412, doi: 10.1038/nrneurol.2016.82 (2016). [DOI] [PubMed] [Google Scholar]
- 6.Weisz ED, Monyak RE & Jongens TA Deciphering discord: How Drosophila research has enhanced our understanding of the importance of FMRP in different spatial and temporal contexts. Exp Neurol 274, 14–24, doi: 10.1016/j.expneurol.2015.05.015 (2015). [DOI] [PubMed] [Google Scholar]
- 7.Nelson DL, Orr HT & Warren ST The unstable repeats--three evolving faces of neurological disease. Neuron 77, 825–843, doi: 10.1016/j.neuron.2013.02.022 (2013). [DOI] [PMC free article] [PubMed] [Google Scholar]
- 8.Bhakar AL, Dolen G & Bear MF The pathophysiology of fragile X (and what it teaches us about synapses). Annu Rev Neurosci 35, 417–443, doi: 10.1146/annurev-neuro-060909-153138 (2012). [DOI] [PMC free article] [PubMed] [Google Scholar]
- 9.Bassell GJ & Warren ST Fragile X syndrome: loss of local mRNA regulation alters synaptic development and function. Neuron 60, 201–214, doi: 10.1016/j.neuron.2008.10.004 (2008). [DOI] [PMC free article] [PubMed] [Google Scholar]
- 10.Ramirez-Cheyne JA et al. Fragile X syndrome and connective tissue dysregulation. Clin Genet 95, 262–267, doi: 10.1111/cge.13469 (2019). [DOI] [PubMed] [Google Scholar]
- 11.Schrander-Stumpel C et al. Prader-Willi-like phenotype in fragile X syndrome. Clin Genet 45, 175–180, doi: 10.1111/j.1399-0004.1994.tb04018.x (1994). [DOI] [PubMed] [Google Scholar]
- 12.Penagarikano O, Mulle JG & Warren ST The pathophysiology of fragile x syndrome. Annu Rev Genomics Hum Genet 8, 109–129, doi: 10.1146/annurev.genom.8.080706.092249 (2007). [DOI] [PubMed] [Google Scholar]
- 13.Myrick LK et al. Independent role for presynaptic FMRP revealed by an FMR1 missense mutation associated with intellectual disability and seizures. Proc Natl Acad Sci U S A 112, 949–956, doi: 10.1073/pnas.1423094112 (2015). [DOI] [PMC free article] [PubMed] [Google Scholar]
- 14.Greenblatt EJ & Spradling AC Fragile X mental retardation 1 gene enhances the translation of large autism-related proteins. Science 361, 709–712, doi: 10.1126/science.aas9963 (2018). [DOI] [PMC free article] [PubMed] [Google Scholar]
- 15.McMahon AC & Rosbash M Promiscuous or discriminating: Has the favored mRNA target of Fragile X Mental Retardation Protein been overlooked? Proc Natl Acad Sci U S A 113, 7009–7011, doi: 10.1073/pnas.1607665113 (2016). [DOI] [PMC free article] [PubMed] [Google Scholar]
- 16.Tabet R et al. Fragile X Mental Retardation Protein (FMRP) controls diacylglycerol kinase activity in neurons. Proc Natl Acad Sci U S A 113, E3619–3628, doi: 10.1073/pnas.1522631113 (2016). [DOI] [PMC free article] [PubMed] [Google Scholar]
- 17.Weisz ED et al. Loss of Drosophila FMRP leads to alterations in energy metabolism and mitochondrial function. Hum Mol Genet 27, 95–106, doi: 10.1093/hmg/ddx387 (2018). [DOI] [PMC free article] [PubMed] [Google Scholar]
- 18.Berry-Kravis EM et al. Drug development for neurodevelopmental disorders: lessons learned from fragile X syndrome. Nat Rev Drug Discov 17, 280–299, doi: 10.1038/nrd.2017.221 (2018). [DOI] [PMC free article] [PubMed] [Google Scholar]
- 19.Lumaban JG & Nelson DL The Fragile X proteins Fmrp and Fxr2p cooperate to regulate glucose metabolism in mice. Hum Mol Genet 24, 2175–2184, doi: 10.1093/hmg/ddu737 (2015). [DOI] [PMC free article] [PubMed] [Google Scholar]
- 20.Shen M et al. Reduced mitochondrial fusion and Huntingtin levels contribute to impaired dendritic maturation and behavioral deficits in Fmr1-mutant mice. Nat Neurosci 22, 386–400, doi: 10.1038/s41593-019-0338-y (2019). [DOI] [PMC free article] [PubMed] [Google Scholar]
- 21.Griffiths KK et al. Inefficient thermogenic mitochondrial respiration due to futile proton leak in a mouse model of fragile X syndrome. FASEB J 34, 7404–7426, doi: 10.1096/fj.202000283RR (2020). [DOI] [PMC free article] [PubMed] [Google Scholar]
- 22.Licznerski P et al. ATP Synthase c-Subunit Leak Causes Aberrant Cellular Metabolism in Fragile X Syndrome. Cell 182, 1170–1185 e1179, doi: 10.1016/j.cell.2020.07.008 (2020). [DOI] [PMC free article] [PubMed] [Google Scholar]
- 23.Tait SW & Green DR Mitochondria and cell signalling. J Cell Sci 125, 807–815, doi: 10.1242/jcs.099234 (2012). [DOI] [PMC free article] [PubMed] [Google Scholar]
- 24.Wallace DC A mitochondrial paradigm of metabolic and degenerative diseases, aging, and cancer: a dawn for evolutionary medicine. Annu Rev Genet 39, 359–407, doi: 10.1146/annurev.genet.39.110304.095751 (2005). [DOI] [PMC free article] [PubMed] [Google Scholar]
- 25.Cheng A, Hou Y & Mattson MP Mitochondria and neuroplasticity. ASN Netiro 2, e00045, doi: 10.1042/AN20100019 (2010). [DOI] [PMC free article] [PubMed] [Google Scholar]
- 26.Bagur R & Hajnoczky G Intracellular Ca(2+) Sensing: Its Role in Calcium Homeostasis and Signaling. Mol Cell 66, 780–788, doi: 10.1016/j.molcel.2017.05.028 (2017). [DOI] [PMC free article] [PubMed] [Google Scholar]
- 27.Chandel NS Evolution of Mitochondria as Signaling Organelles. Cell Metab 22, 204–206, doi: 10.1016/j.cmet.2015.05.013 (2015). [DOI] [PubMed] [Google Scholar]
- 28.Kamer KJ & Mootha VK The molecular era of the mitochondrial calcium uniporter. Nat Rev Mol Cell Biol 16, 545–553, doi: 10.1038/nrm4039 (2015). [DOI] [PubMed] [Google Scholar]
- 29.Wallace DC A mitochondrial paradigm of metabolic and degenerative diseases, aging, and cancer: a dawn for evolutionary medicine. Annu Rev Genet 39, 359–407, doi: 10.1146/annurev.genet.39.110304.095751 (2005). [DOI] [PMC free article] [PubMed] [Google Scholar]
- 30.Beal MF Mitochondria and neurodegeneration. Novartis Found Symp 287, 183–192; discussion 192-186 (2007). [DOI] [PubMed] [Google Scholar]
- 31.Mattson MP, Gleichmann M & Cheng A Mitochondria in neuroplasticity and neurological disorders. Neuron 60, 748–766, doi: 10.1016/j.neuron.2008.10.010 (2008). [DOI] [PMC free article] [PubMed] [Google Scholar]
- 32.McCormack JG, Halestrap AP & Denton RM Role of calcium ions in regulation of mammalian intramitochondrial metabolism. Physiological reviews 70, 391–425 (1990). [DOI] [PubMed] [Google Scholar]
- 33.Jouaville LS, Pinton P, Bastianutto C, Rutter GA & Rizzuto R Regulation of mitochondrial ATP synthesis by calcium: evidence for a long-term metabolic priming. Proceedings of the National Academy of Sciences of the United States of America 96, 13807–13812 (1999). [DOI] [PMC free article] [PubMed] [Google Scholar]
- 34.Cardenas C et al. Essential regulation of cell bioenergetics by constitutive InsP3 receptor Ca2+ transfer to mitochondria. Cell 142, 270–283, doi: 10.1016/j.cell.2010.06.007 (2010). [DOI] [PMC free article] [PubMed] [Google Scholar]
- 35.Tang Y & Zucker RS Mitochondrial involvement in post-tetanic potentiation of synaptic transmission. Neuron 18, 483–491 (1997). [DOI] [PubMed] [Google Scholar]
- 36.Li Z, Okamoto K, Hayashi Y & Sheng M The importance of dendritic mitochondria in the morphogenesis and plasticity of spines and synapses. Cell 119, 873–887, doi: 10.1016/j.cell.2004.11.003 (2004). [DOI] [PubMed] [Google Scholar]
- 37.Rangaraju V, Lauterbach M & Schuman EM Spatially Stable Mitochondrial Compartments Fuel Local Translation during Plasticity. Cell 176, 73–84 e15, doi: 10.1016/j.cell.2018.12.013 (2019). [DOI] [PubMed] [Google Scholar]
- 38.Rizzuto R, De Stefani D, Raffaello A & Mammucari C Mitochondria as sensors and regulators of calcium signalling. Nature reviews. Molecular cell biology 13, 566–578, doi: 10.1038/nrm3412 (2012). [DOI] [PubMed] [Google Scholar]
- 39.Wu H, Carvalho P & Voeltz GK Here, there, and everywhere: The importance of ER membrane contact sites. Science 361, doi: 10.1126/science.aan5835 (2018). [DOI] [PMC free article] [PubMed] [Google Scholar]
- 40.Rizzuto R, Brini M, Murgia M & Pozzan T Microdomains with high Ca2+ close to IP3-sensitive channels that are sensed by neighboring mitochondria. Science 262, 744–747 (1993). [DOI] [PubMed] [Google Scholar]
- 41.Szabadkai G et al. Chaperone-mediated coupling of endoplasmic reticulum and mitochondrial Ca2+ channels. J Cell Biol 175, 901–911, doi: 10.1083/jcb.200608073 (2006). [DOI] [PMC free article] [PubMed] [Google Scholar]
- 42.Tiwary S, Nandwani A, Khan R & Datta M GRP75 mediates endoplasmic reticulum-mitochondria coupling during palmitate-induced pancreatic beta-cell apoptosis. J Biol Chem 297, 101368, doi: 10.1016/j.jbc.2021.101368 (2021). [DOI] [PMC free article] [PubMed] [Google Scholar]
- 43.Rowland AA & Voeltz GK Endoplasmic reticulum-mitochondria contacts: function of the junction. Nat Rev Mol Cell Biol 13, 607–625, doi: 10.1038/nrm3440 (2012). [DOI] [PMC free article] [PubMed] [Google Scholar]
- 44.Perrone M et al. The role of mitochondria-associated membranes in cellular homeostasis and diseases. Int Rev Cell Mol Biol 350, 119–196, doi: 10.1016/bs.ircmb.2019.11.002 (2020). [DOI] [PubMed] [Google Scholar]
- 45.Lee KS et al. Altered ER-mitochondria contact impacts mitochondria calcium homeostasis and contributes to neurodegeneration in vivo in disease models. Proc Natl Acad Sci U S A 115, E8844–E8853, doi: 10.1073/pnas.1721136115 (2018). [DOI] [PMC free article] [PubMed] [Google Scholar]
- 46.Xu L, Wang X & Tong C Endoplasmic Reticulum-Mitochondria Contact Sites and Neurodegeneration. Front Cell Dev Biol 8, 428, doi: 10.3389/fcell.2020.00428 (2020). [DOI] [PMC free article] [PubMed] [Google Scholar]
- 47.Area-Gomez E et al. A key role for MAM in mediating mitochondrial dysfunction in Alzheimer disease. Cell Death Dis 9, 335, doi: 10.1038/s41419-017-0215-0 (2018). [DOI] [PMC free article] [PubMed] [Google Scholar]
- 48.Zhang YQ et al. Drosophila fragile X-related gene regulates the MAP1B homolog Futsch to control synaptic structure and function. Cell 107, 591–603, doi: 10.1016/s0092-8674(01)00589-x (2001). [DOI] [PubMed] [Google Scholar]
- 49.Yang Y et al. Mitochondrial pathology and muscle and dopaminergic neuron degeneration caused by inactivation of Drosophila Pink1 is rescued by Parkin. Proc Natl Acad Sci U S A 103, 10793–10798, doi: 10.1073/pnas.0602493103 (2006). [DOI] [PMC free article] [PubMed] [Google Scholar]
- 50.Wu Z et al. MISTERMINATE Mechanistically Links Mitochondrial Dysfunction with Proteostasis Failure. Mol Cell 75, 835–848 e838, doi: 10.1016/j.molcel.2019.06.031 (2019). [DOI] [PMC free article] [PubMed] [Google Scholar]
- 51.Gehrke S et al. PINK1 and Parkin control localized translation of respiratory chain component mRNAs on mitochondria outer membrane. Cell Metab 21, 95–108, doi: 10.1016/j.cmet.2014.12.007 (2015). [DOI] [PMC free article] [PubMed] [Google Scholar]
- 52.Wieckowski MR, Giorgi C, Lebiedzinska M, Duszynski J & Pinton P Isolation of mitochondria-associated membranes and mitochondria from animal tissues and cells. Ncit Protoc 4, 1582–1590, doi: 10.1038/nprot.2009.151 (2009). [DOI] [PubMed] [Google Scholar]
- 53.Feinberg EH et al. GFP Reconstitution Across Synaptic Partners (GRASP) defines cell contacts and synapses in living nervous systems. Neuron 57, 353–363, doi: 10.1016/j.neuron.2007.11.030 (2008). [DOI] [PubMed] [Google Scholar]
- 54.Yang Z, Zhao X, Xu J, Shang W & Tong C A novel fluorescent reporter detects plastic remodeling of mitochondria-ER contact sites. J Cell Sci 131, doi: 10.1242/jcs.208686 (2018). [DOI] [PubMed] [Google Scholar]
- 55.Hertlein V et al. MERLIN: a novel BRET-based proximity biosensor for studying mitochondria-ER contact sites. Life Sci Alliance 3, doi: 10.26508/lsa.201900600 (2020). [DOI] [PMC free article] [PubMed] [Google Scholar]
- 56.Gomez-Suaga P, Paillusson S & Miller CCJ ER-mitochondria signaling regulates autophagy. Autophagy 13, 1250–1251, doi: 10.1080/15548627.2017.1317913 (2017). [DOI] [PMC free article] [PubMed] [Google Scholar]
- 57.Sun N et al. A fluorescence-based imaging method to measure in vitro and in vivo mitophagy using mt-Keima. Nat Protoc 12, 1576–1587, doi: 10.1038/nprot.2017.060 (2017). [DOI] [PubMed] [Google Scholar]
- 58.Narendra DP et al. PINK1 Is Selectively Stabilized on Impaired Mitochondria to Activate Parkin. PLoS Biol 8, e1000298 (2010). [DOI] [PMC free article] [PubMed] [Google Scholar]
- 59.Lutas A, Wahlmark CJ, Acharjee S & Kawasaki F Genetic analysis in Drosophila reveals a role for the mitochondrial protein p32 in synaptic transmission. G3 2, 59–69, doi: 10.1534/g3.111.001586 (2012). [DOI] [PMC free article] [PubMed] [Google Scholar]
- 60.Perocchi F et al. MICU1 encodes a mitochondrial EF hand protein required for Ca(2+) uptake. Nature 467, 291–296, doi: 10.1038/nature09358 (2010). [DOI] [PMC free article] [PubMed] [Google Scholar]
- 61.Pendin D et al. A Synthetic Fluorescent Mitochondria-Targeted Sensor for Ratiometric Imaging of Calcium in Live Cells. Angew Chem Int Ed Engl 58, 9917–9922, doi: 10.1002/anie.201902272 (2019). [DOI] [PubMed] [Google Scholar]
- 62.McBride SM, Holloway SL & Jongens TA Using Drosophila as a tool to identify pharmacological therapies for fragile X syndrome. Drug Discov Today Technol 10, e129–136, doi: 10.1016/j.ddtec.2012.09.005 (2013). [DOI] [PubMed] [Google Scholar]
- 63.Zarnescu DC, Shan G, Warren ST & Jin P Come FLY with us: toward understanding fragile X syndrome. Genes Brain Behav 4, 385–392, doi: 10.1111/j.1601-183X.2005.00136.x (2005). [DOI] [PubMed] [Google Scholar]
- 64.Maruyama T, Kanaji T, Nakade S, Kanno T & Mikoshiba K 2APB, 2-aminoethoxydiphenyl borate, a membrane-penetrable modulator of Ins(1,4,5)P3-induced Ca2+ release. J Biochem 122, 498–505, doi: 10.1093/oxfordjournals.jbchem.a021780 (1997). [DOI] [PubMed] [Google Scholar]
- 65.Thinnes FP et al. Channel active mammalian porin, purified from crude membrane fractions of human B lymphocytes or bovine skeletal muscle, reversibly binds the stilbene-disulfonate group of the chloride channel blocker DIDS. Biol Chem Hoppe Seyler 375, 315–322, doi: 10.1515/bchm3.1994.375.5.315 (1994). [DOI] [PubMed] [Google Scholar]
- 66.Lenartowicz E, Bernardi P & Azzone GF Phenylarsine oxide induces the cyclosporin A-sensitive membrane permeability transition in rat liver mitochondria. J Bioenerg Biomembr 23, 679–688, doi: 10.1007/BF00785817 (1991). [DOI] [PubMed] [Google Scholar]
- 67.Kashima R et al. Hyperactive locomotion in a Drosophila model is a functional readout for the synaptic abnormalities underlying fragile X syndrome. Sci Signal 10, doi: 10.1126/scisignal.aai8133 (2017). [DOI] [PMC free article] [PubMed] [Google Scholar]
- 68.Masek P, Worden K, Aso Y, Rubin GM & Keene AC A dopamine-modulated neural circuit regulating aversive taste memory in Drosophila. Curr Biol 25, 1535–1541, doi: 10.1016/j.cub.2015.04.027 (2015). [DOI] [PMC free article] [PubMed] [Google Scholar]
- 69.Frank CA, Kennedy MJ, Goold CP, Marek KW & Davis GW Mechanisms underlying the rapid induction and sustained expression of synaptic homeostasis. Neuron 52, 663–677, doi: 10.1016/j.neuron.2006.09.029 (2006). [DOI] [PMC free article] [PubMed] [Google Scholar]
- 70.Branon TC et al. Efficient proximity labeling in living cells and organisms with TurboID. Nat Biotechnol 36, 880–887, doi: 10.1038/nbt.4201 (2018). [DOI] [PMC free article] [PubMed] [Google Scholar]
- 71.Mazroui R et al. Trapping of messenger RNA by Fragile X Mental Retardation protein into cytoplasmic granules induces translation repression. Hum Mol Genet 11, 3007–3017, doi: 10.1093/hmg/11.24.3007 (2002). [DOI] [PubMed] [Google Scholar]
- 72.Kim SH, Dong WK, Weiler IJ & Greenough WT Fragile X mental retardation protein shifts between polyribosomes and stress granules after neuronal injury by arsenite stress or in vivo hippocampal electrode insertion. J Neurosci 26, 2413–2418, doi: 10.1523/JNEUROSCI.3680-05.2006 (2006). [DOI] [PMC free article] [PubMed] [Google Scholar]
- 73.Thinnes FP Alzheimer disease controls cancer - concerning the apoptogenic interaction of cell membrane-standing type-1 VDAC and amyloid peptides via GxxxG motifs. Mol Genet Metab 106, 502–503, doi: 10.1016/j.ymgme.2012.06.004 (2012). [DOI] [PubMed] [Google Scholar]
- 74.Cho KF et al. Split-TurboID enables contact-dependent proximity labeling in cells. Proc Natl Acad Sci U S A 117, 12143–12154, doi: 10.1073/pnas.1919528117 (2020). [DOI] [PMC free article] [PubMed] [Google Scholar]
- 75.Brown V et al. Microarray identification of FMRP-associated brain mRNAs and altered mRNA translational profiles in fragile X syndrome. Cell 107, 477–487, doi: 10.1016/s0092-8674(01)00568-2 (2001). [DOI] [PubMed] [Google Scholar]
- 76.Darnell JC et al. Fragile X mental retardation protein targets G quartet mRNAs important for neuronal function. Cell 107, 489–499, doi: 10.1016/s0092-8674(01)00566-9 (2001). [DOI] [PubMed] [Google Scholar]
- 77.Santos AR, Kanellopoulos AK & Bagni C Learning and behavioral deficits associated with the absence of the fragile X mental retardation protein: what a fly and mouse model can teach us. Learn Mem 21, 543–555, doi: 10.1101/lm.035956.114 (2014). [DOI] [PMC free article] [PubMed] [Google Scholar]
- 78.Egorova PA & Bezprozvanny IB Inositol 1,4,5-trisphosphate receptors and neurodegenerative disorders. FEBS J, doi: 10.1111/febs.14366 (2017). [DOI] [PubMed] [Google Scholar]
- 79.Logan CV et al. Loss-of-function mutations in MICU1 cause a brain and muscle disorder linked to primary alterations in mitochondrial calcium signaling. Nat Genet 46, 188–193, doi: 10.1038/ng.2851 (2014). [DOI] [PubMed] [Google Scholar]
- 80.Purcell SM et al. A polygenic burden of rare disruptive mutations in schizophrenia. Nature 506, 185–190, doi: 10.1038/nature12975 (2014). [DOI] [PMC free article] [PubMed] [Google Scholar]
- 81.Yan J, Porch MW, Court-Vazquez B, Bennett MVL & Zukin RS Activation of autophagy rescues synaptic and cognitive deficits in fragile X mice. Proc Natl Acad Sci U S A 115, E9707–E9716, doi: 10.1073/pnas.1808247115 (2018). [DOI] [PMC free article] [PubMed] [Google Scholar]
- 82.Varughese JT, Buchanan SK & Pitt AS The Role of Voltage-Dependent Anion Channel in Mitochondrial Dysfunction and Human Disease. Cells 10, doi: 10.3390/cells10071737 (2021). [DOI] [PMC free article] [PubMed] [Google Scholar]
- 83.Shuvo SR, Ferens FG & Court DA The N-terminus of VDAC: Structure, mutational analysis, and a potential role in regulating barrel shape. Biochim Biophys Acta 1858, 1350–1361, doi: 10.1016/j.bbamem.2016.03.017 (2016). [DOI] [PubMed] [Google Scholar]
- 84.Kwong JQ & Molkentin JD Physiological and pathological roles of the mitochondrial permeability transition pore in the heart. Cell Metab 21, 206–214, doi: 10.1016/j.cmet.2014.12.001 (2015). [DOI] [PMC free article] [PubMed] [Google Scholar]
- 85.Hom JR et al. The permeability transition pore controls cardiac mitochondrial maturation and myocyte differentiation. Dev Cell 21, 469–478, doi: 10.1016/j.devcel.2011.08.008 (2011). [DOI] [PMC free article] [PubMed] [Google Scholar]
- 86.Zhou B et al. Mitochondrial Permeability Uncouples Elevated Autophagy and Lifespan Extension. Cell 177, 299–314 e216, doi: 10.1016/j.cell.2019.02.013 (2019). [DOI] [PMC free article] [PubMed] [Google Scholar]
- 87.Hou Y et al. Mitochondrial superoxide production negatively regulates neural progenitor proliferation and cerebral cortical development. Stem Cells 30, 2535–2547, doi: 10.1002/stem.1213 (2012). [DOI] [PMC free article] [PubMed] [Google Scholar]
- 88.Gottlieb RA & Mentzer RM Autophagy during cardiac stress: joys and frustrations of autophagy. Annu Rev Physiol 72, 45–59, doi: 10.1146/annurev-physiol-021909-135757 (2010). [DOI] [PMC free article] [PubMed] [Google Scholar]
- 89.Gupta R & Ghosh S Putative roles of mitochondrial Voltage-Dependent Anion Channel, Bcl-2 family proteins and c-Jun N-terminal Kinases in ischemic stroke associated apoptosis. Biochim Open 4, 47–55, doi: 10.1016/j.biopen.2017.02.002 (2017). [DOI] [PMC free article] [PubMed] [Google Scholar]
- 90.Zhang Y et al. Rapid single-step induction of functional neurons from human pluripotent stem cells. Neuron 78, 785–798, doi: 10.1016/j.neuron.2013.05.029 (2013). [DOI] [PMC free article] [PubMed] [Google Scholar]
- 91.Geng J et al. Andrographolide alleviates Parkinsonism in MPTP-PD mice via targeting mitochondrial fission mediated by dynamin-related protein 1. Br J Pharmacol 176, 4574–4591, doi: 10.1111/bph.14823 (2019). [DOI] [PMC free article] [PubMed] [Google Scholar]
- 92.Dunn KW, Kamocka MM & McDonald JH A practical guide to evaluating colocalization in biological microscopy. Am J Physiol Cell Physiol 300, C723–742, doi: 10.1152/ajpcell.00462.2010 (2011). [DOI] [PMC free article] [PubMed] [Google Scholar]
Associated Data
This section collects any data citations, data availability statements, or supplementary materials included in this article.