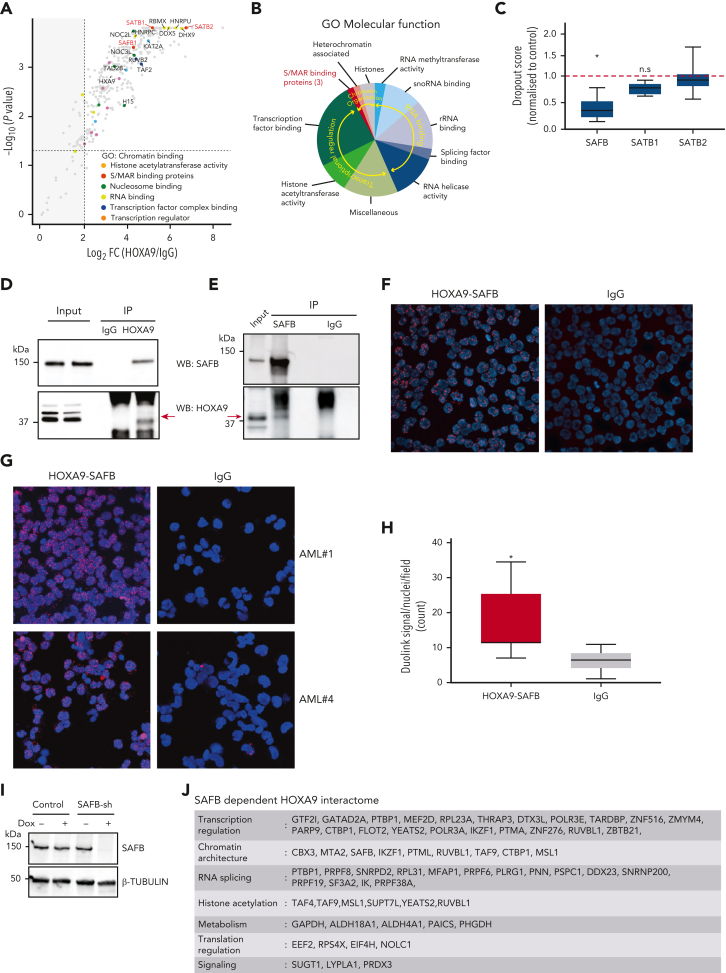
Figure 1.
HOXA9 interacts with matrix binding (S/MAR) protein SAFB. (A) Volcano plot displaying the label-free mass spectrometry (MS) quantification of HOXA9 pulldown in MOLM13 cells. The plot shows log2 ratios of averaged peptide MS intensities between HOXA9-immunoprecipitation (IP) and control-IP (IgG) eluate samples (x-axis) plotted against the negative log10 P values (y-axis) calculated across the replicate data sets (1-tailed Student t test, n = 2 replicates). Maximum upper values were set for the x- and y-axis to accommodate all detected proteins in the plot. A dashed horizontal line marks P = .05. Vertical dashed line marks enrichment >2 log2 fold. Chromatin-binding proteins, pulled down by HOXA9 are colored as indicated, and selected protein names are shown. The full data set is given in supplemental Table 1. (B) Summary of proteins pulled down by HOXA9-IP, categorized based on the information of the molecular functions obtained from GO analyses; false discovery rate < 0.000001. (C) Box plot represents depletion of SAFB, SATB1, and SATB2 by CRISPR in 5 AML cell lines. Dropout score was calculated by normalizing to control cells (non-AML).20 (D) Western blot analyses validating the HOXA9 and SAFB interaction in MOLM13 cells via coimmunoprecipitation. HOXA9 is immunoprecipitated from MOLM13 cells and blotted for SAFB (top) and HOXA9 (bottom). (E) As in panel D, SAFB is immunoprecipitated from MOLM13 cells and blotted for HOXA9 (bottom) and SAFB (top). (F) Images showing PLA using Duolink in MOLM13 cells confirming the interaction between HOXA9 and SAFB in situ. Antibodies against HOXA9 (rabbit polyclonal antibodies) and SAFB (mouse monoclonal antibodies) were used. Rabbit and mouse IgGs were used as negative controls. (G) Images show PLA, using Duolink in primary AML cells from 2 individual patient samples. (H) Box and whisker plot shows cumulative differential signal (analyzed by Arivis software) as the number of Duolink-positive dots per nuclei across multiple patients (n = 7). Dots observed in IgG were also counted and plotted as a negative control. Statistical significance was calculated against IgG control using the paired t test (2-tailed, P < .05), ∗P < .05. (I) Representative western blot showing SAFB knockdown via doxycycline-inducible shRNAs in MOLM13 cells at 48 hours postinduction. β-Tubulin was used as a loading control. (J) Summary table of SAFB-dependent HOXA9 interacting proteins (n = 60); false discovery rate < 0.05. Full details are provided in supplemental Table 1. log2 FC, log2 fold change; ns., not significant; rRNA, ribosomal RNA; snoRNA, small nucleolar RNA.

