

Summary
Seasonal influenza vaccination elicits hemagglutinin (HA)-specific memory B (Bmem) cells, and although multiple Bmem cell populations have been characterized, considerable heterogeneity exists. We found that HA-specific human Bmem cells differed in expression of surface marker FcRL5 and transcriptional factor T-bet. FcRL5+T-bet+ Bmem cells were transcriptionally similar to effector-like memory cells while T-betnegFcRL5neg Bmem cells exhibited stem-like central memory properties. FcRL5+ Bmem cells did not express plasma cell-commitment factors but did express transcriptional, epigenetic, metabolic and functional programs that poised these cells for antibody production. Accordingly, HA+ T-bet+ Bmem cells at day 7 post-vaccination expressed intracellular immunoglobulin, and tonsil-derived FcRL5+ Bmem cells differentiated more rapidly into antibody-secreting cells (ASCs) in vitro. The T-bet+ Bmem cell response positively correlated with long-lived humoral immunity, and clonotypes from T-bet+ Bmem cells were represented in the secondary ASC response to repeat vaccination, suggesting that this effector-like population predicts influenza vaccine durability and recall potential.
Keywords: T-bet, memory B cells, plasmablasts, influenza vaccination, durable immunity
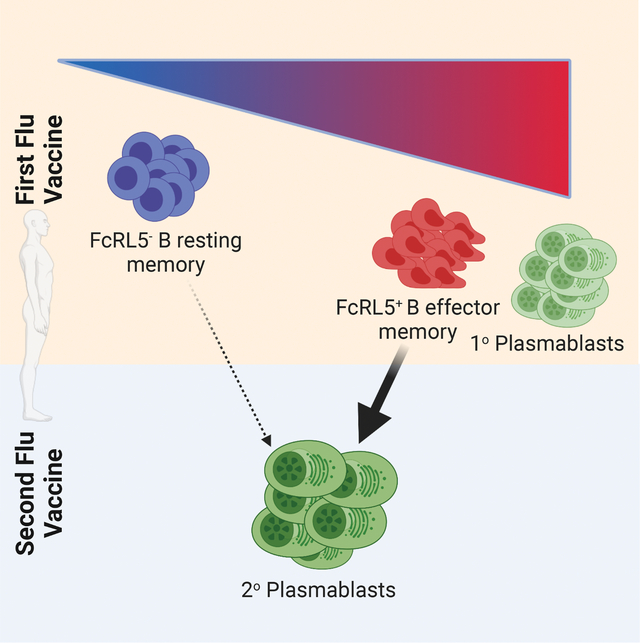
Graphical Abstract
eTOC
Seasonal influenza vaccination recalls pre-existing memory B cells for immune protection. Here Nellore et. al. show that intramuscular influenza vaccination elicits a population of effector memory B cells that are transcriptionally, epigenetically and metabolically poised for antibody production. The magnitude of this FcRL5- and T-bet-expressing effector memory subset response correlates with long-lived antibody responses to influenza vaccination.
Introduction
Following exposure to previously encountered antigens (Ag), the immune system initiates a recall response dominated by pre-existing memory B (Bmem) cells1 that can either enter the GC2 to produce new daughter cells or can rapidly proliferate and differentiate into short-lived plasmablasts (PB), which produce antibodies (Ab) that decrease morbidity and mortality3. The cues that direct some Bmem cells toward this early protective “effector-like” fate and the relationship between effector Bmem cells and other GC-derived or extrafollicular Bmem cell populations are not well understood4.
Prior studies of the CD8+ T cell memory demonstrate that transcription factors (TF) like BACH2 and TCF7 are critical for maintenance of the stem-like properties of memory T cells5,6, while TFs like BATF and T-bet confer memory T cells with rapid effector potential7,8. Many of these same fate-guiding TFs are also expressed by different B cell subsets. For example, BACH2 maintains Bmem cell identity9 and must be repressed10,11 during Bmem cell differentiation into antibody secreting cells (ASCs) while T-bet is reported to support ASC formation by mouse Bmem cells responding to flu infection12. Although circulating T-bet expressing HA-specific Bmem cells have been observed in flu-vaccinated individuals13,14, this subset has not been examined in detail because the markers typically used to subdivide Bmem cells, like CD27 and CD21, do not resolve the CD27+ Bmem cell compartment into discrete T-bet-expressing and T-betneg populations.
To address how T-bet expressing human Bmem cells contribute to vaccine responses, we used FcRL5 as a cell surface surrogate marker to subdivide the inactivated influenza vaccine (IIV)-elicited human hemagglutinin (HA)-specific Bmem cell compartment into T-bet expressing and non-expressing subpopulations. Here, we show that FcRL5+ and FcRL5neg subsets are clonally, transcriptionally, epigenetically, and functionally distinct from one another. The T-bet+ FcRL5+ response to IIV correlates with durable vaccine-induced humoral immunity and can be recalled one year later, indicating that these “effector-like” Bmem cells not only contribute to humoral immunity but may also represent an easily measured early biomarker for IIV durability.
Results
Influenza-specific FcRL5+T-bet+ Bmem cells represent a phenotypic and clonally distinct subset.
A study12 using mouse B cells suggests that Bmem cells with effector potential express T-bet. To evaluate whether T-bet expressing human Bmem cells exhibit effector attributes, we used fluorochrome-conjugated H1 and H3 HA tetramers to characterize circulating HA-specific (HA+) B cells in healthy donors (HD) immunized with seasonal IIV. By day 7 (D7) post-IIV we detected ASCs/PBs (Fig. S1A–B) and IgDneg H1-specific B cells (Fig. 1A). These B cells could be subdivided into a population co-expressing T-bet and Fc receptor like 5 (FcRL5) and a T-betnegFcRL5neg population (Fig. 1B). To address whether the T-bet+FcRL5+ subset was phenotypically related to other flu-specific Bmem cell subsets, we examined expression of T-bet within the previously described CD71+ Bmem cell subset15 and the CD21lo subsets13,14. Consistent with prior studies of D14 IIV-elicited B cells14 (Fig. S1C), we observed that the D7 HA-specific CD21lo Bmem cell subset contained both T-bet+ and T-betneg cells (Fig. S1D) and that T-bet+ and T-betneg cells were both found within the D7 HA-specific CD71+ Bmem cell subset15 (Fig. S1E). Subdividing the IgDneg HA+ B cells using T-bet or FcRL5 expression, revealed that most of the HA-specific B cells on D7 post-IIV expressed the canonical memory marker CD27 (Fig. 1C). However, T-betneg and T-bet+ HA+ B cells could be distinguished by expression of CXCR5, CCR7 and CD62L, which were higher in T-betneg cells, and CXCR3, which was increased in the T-bet+ cells (Fig. 1C). Comparison of the immunoglobulin (Ig) isotype and somatic mutation frequencies in the heavy chain variable region (VH) of the BCRs (Table S1) expressed by FcRL5+ and FcRL5neg IgDneg H3-specific B cell populations indicated that isotype-switched B cells predominated in both subsets (Fig. 1D, Table S1) and that both populations exhibited similar frequencies of VH mutations (Fig. 1E, Fig. S1F–G), even when the analysis was restricted to isotype-switched B cells (Fig. S1H–J). Both populations could still be detected at D120 post-vaccination (Fig. S1K–M) and a comparison of BCR clonotypes in the circulating D7 HA-specific FcRL5+ and FcRL5neg subsets with the BCR clonotypes found in D120 circulating IgDneg Bmem cells demonstrated that lineages found in D7 T-bet+FcRL5+ and T-betnegFcRL5neg could persist for at least 120 days (Fig. 1F–G). Thus, both populations, while phenotypically distinct, exhibited attributes of Ag-experienced Bmem cells.
Figure 1. Seasonal influenza vaccination elicits distinct HA-specific Bmem cell subsets.
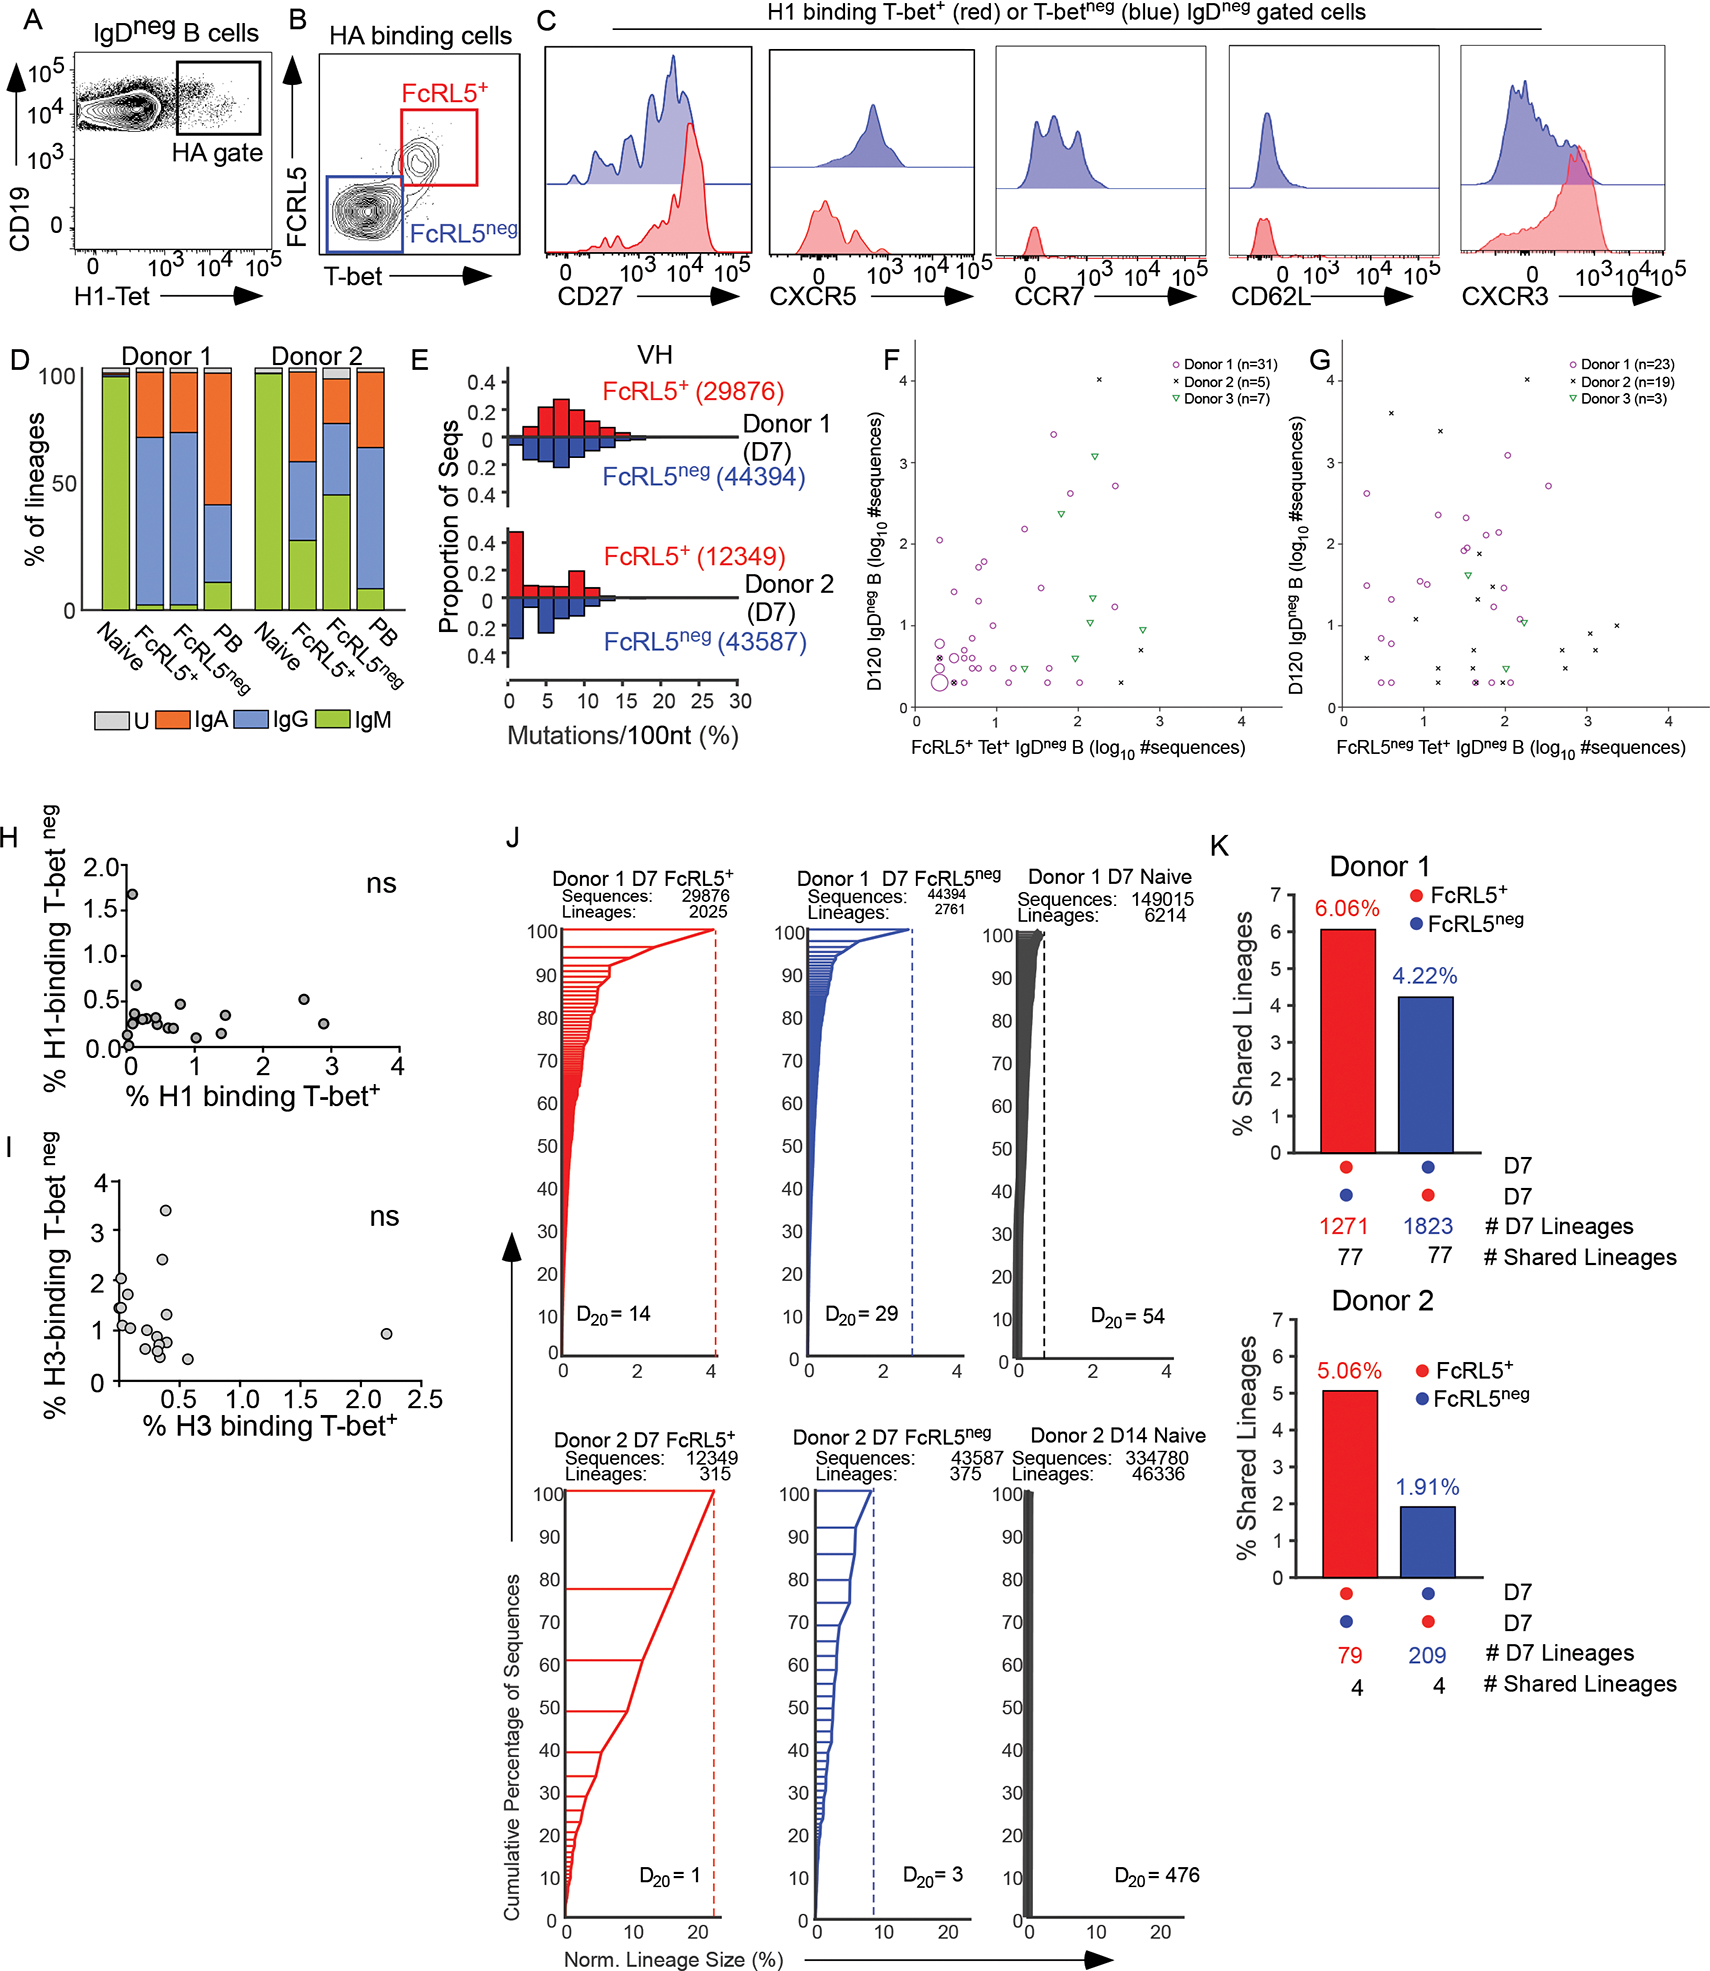
(A-C) FACS plots showing HA-tetramer binding versus CD19 expression (A) and FcRL5 versus T-bet expression (B) by HA-specific IgDneg B cells from blood of a D7 post-IIV HD. Histograms (C) showing cell surface marker expression by the H1-specific IgDneg T-bet+ (red) and T-betneg (blue) B cells.
(D-E) IGH VH BCR repertoire analysis of sort-purified circulating H3-specific FcRL5+ and FcRL5neg IgDneg B cells, IgD+ naïve B cells, and IgDnegCD38hi PBs from 2 HD on D7 post-IIV. Isotype distribution (D) in each D7 subset (U = “unidentified”). Distribution of VH sequence mutation frequencies (E) in H3-specific IgDneg FcRL5+ and FcRL5neg cells. Number of sequences in each population indicated.
(F-G) Shared lineages between D120 total IgDneg B cells (y-axis) and HA-specific FcRL5+ (F) or FcRL5neg (G) IgDneg B cells (x-axis) from 3 HDs on D7 or D14 post-IIV. Axes indicate size of shared lineages (symbols) defined as ≥2 sequences in each lineage in each population. Numbers of shared lineages (n) for each donor indicated. Larger symbols represent multiple shared lineages of the same sizes.
(H-I) Frequencies of T-bet+ and T-betneg cells within H1-specific (H) or H3-specific (I) IgDneg B cell subsets measured in each individual (n=19) on D7 post-IIV. ns = not significant.
(J) VH BCR lineages in sort-purified naïve and D7 H3-specific FcRL5+ or FcRL5neg IgDneg B cells with lineages ordered by size (y-axis) and % of total number of sequences (x-axis). Data reported as Diversity index 20 (D20) values, total number of sequences per subset, and lineages per subset.
(K) Lineage sharing between D7 FcRL5+ and FcRL5neg subsets reported as percentage of shared non-singleton lineages. The numbers of shared and total non-singleton lineages per donor and subset also reported.
Additional BCR repertoire data reported in Table S1, Fig 1F–J and Fig. S1N. See Fig. S1 for gating strategy and additional phenotypic characterization of B cell subsets.
Next, we determined the size of the D7 Bmem cell subsets in each vaccinated individual and found no correlation between the frequencies of the two populations within the same HD (Fig. 1H–I). We then used the VH BCR repertoire data to evaluate lineage sharing within the B cell subsets (Table S1). As expected, the IIV-induced D7 FcRL5+ and FcRL5neg memory subsets had fewer lineages and were less diverse than naïve B cells (Fig. 1J), as indicated by a lower Diversity Index value16. Analysis of BCR lineages shared between the different B cell populations revealed minimal clonotypic overlap between naïve B cells and either Bmem cell subset (0.05%). By contrast, 2–6% of the lineages found in one Bmem cell subset were shared with the other Bmem cell subset (Fig. 1K), however many of the larger lineages found in each memory population were distinct (Fig. S1N). Thus, these two Bmem cell populations did not appear to be coordinately regulated.
IgDneg HA-specific FcRL5+ and FcRL5neg Bmem cells represent molecularly distinct populations.
Since the FcRL5+ and FcRL5neg Bmem cell populations differed in expression of the transcriptional and epigenetic regulator T-bet17, we performed RNA-seq and ATAC-seq analyses on D7 post-IIV sort-purified naïve B cells, PBs and IgDneg H1-specific FcRL5+ and FcRL5neg Bmem cells. We identified 1923 differentially accessible chromatin regions (DAR) and 762 differentially expressed genes (DEGs), including FCRL5 and TBX21 (Fig. S2A), between the FcRL5+ and FcRL5neg subsets. Using Principal Component Analysis (PCA) to compare the transcriptomes (Fig. 2A, Table S2) and epigenomes (Fig. 2B, Table S3) of these different populations, we observed that the naïve and Bmem cell populations separated from PBs on the PC1 axis of both PCA plots (Fig. 2A–B). Consistent with this, cell cycle genes (Fig. 2C, Fig. S2B, Table S2) and the ASC-defining TFs PRDM1, XBP1 and IRF4 (Fig. 2D–F) were highly expressed by the D7 PBs but not by the other populations. Neither FcRL5+ nor FcRL5neg Bmem cells exhibited increased chromatin accessibility (Fig. 2G) surrounding genes that are expressed specifically in ASCs and directly regulated by IRF418. Moreover, Gene Set Enrichment Analysis (GSEA) revealed no enrichment (Fig. 2H) for expression of these IRF4-controlled ASC-specific genes in the transcriptomes of either the FcRL5+ or FcRL5neg IgDneg H1-specific B cells. Likewise, Page Rank (PR)19, which integrates transcriptional and epigenetic data sets (Table S2), predicted IRF4, PRDM1 and XBP1 as regulatory hubs of D7 PBs but not D7 FcRL5+ or FcRL5neg Bmem cells (Fig. 2I–J).
Figure 2. H1-specific FcRL5+ and FcRL5neg Bmem cells are transcriptionally and epigenetically distinct.
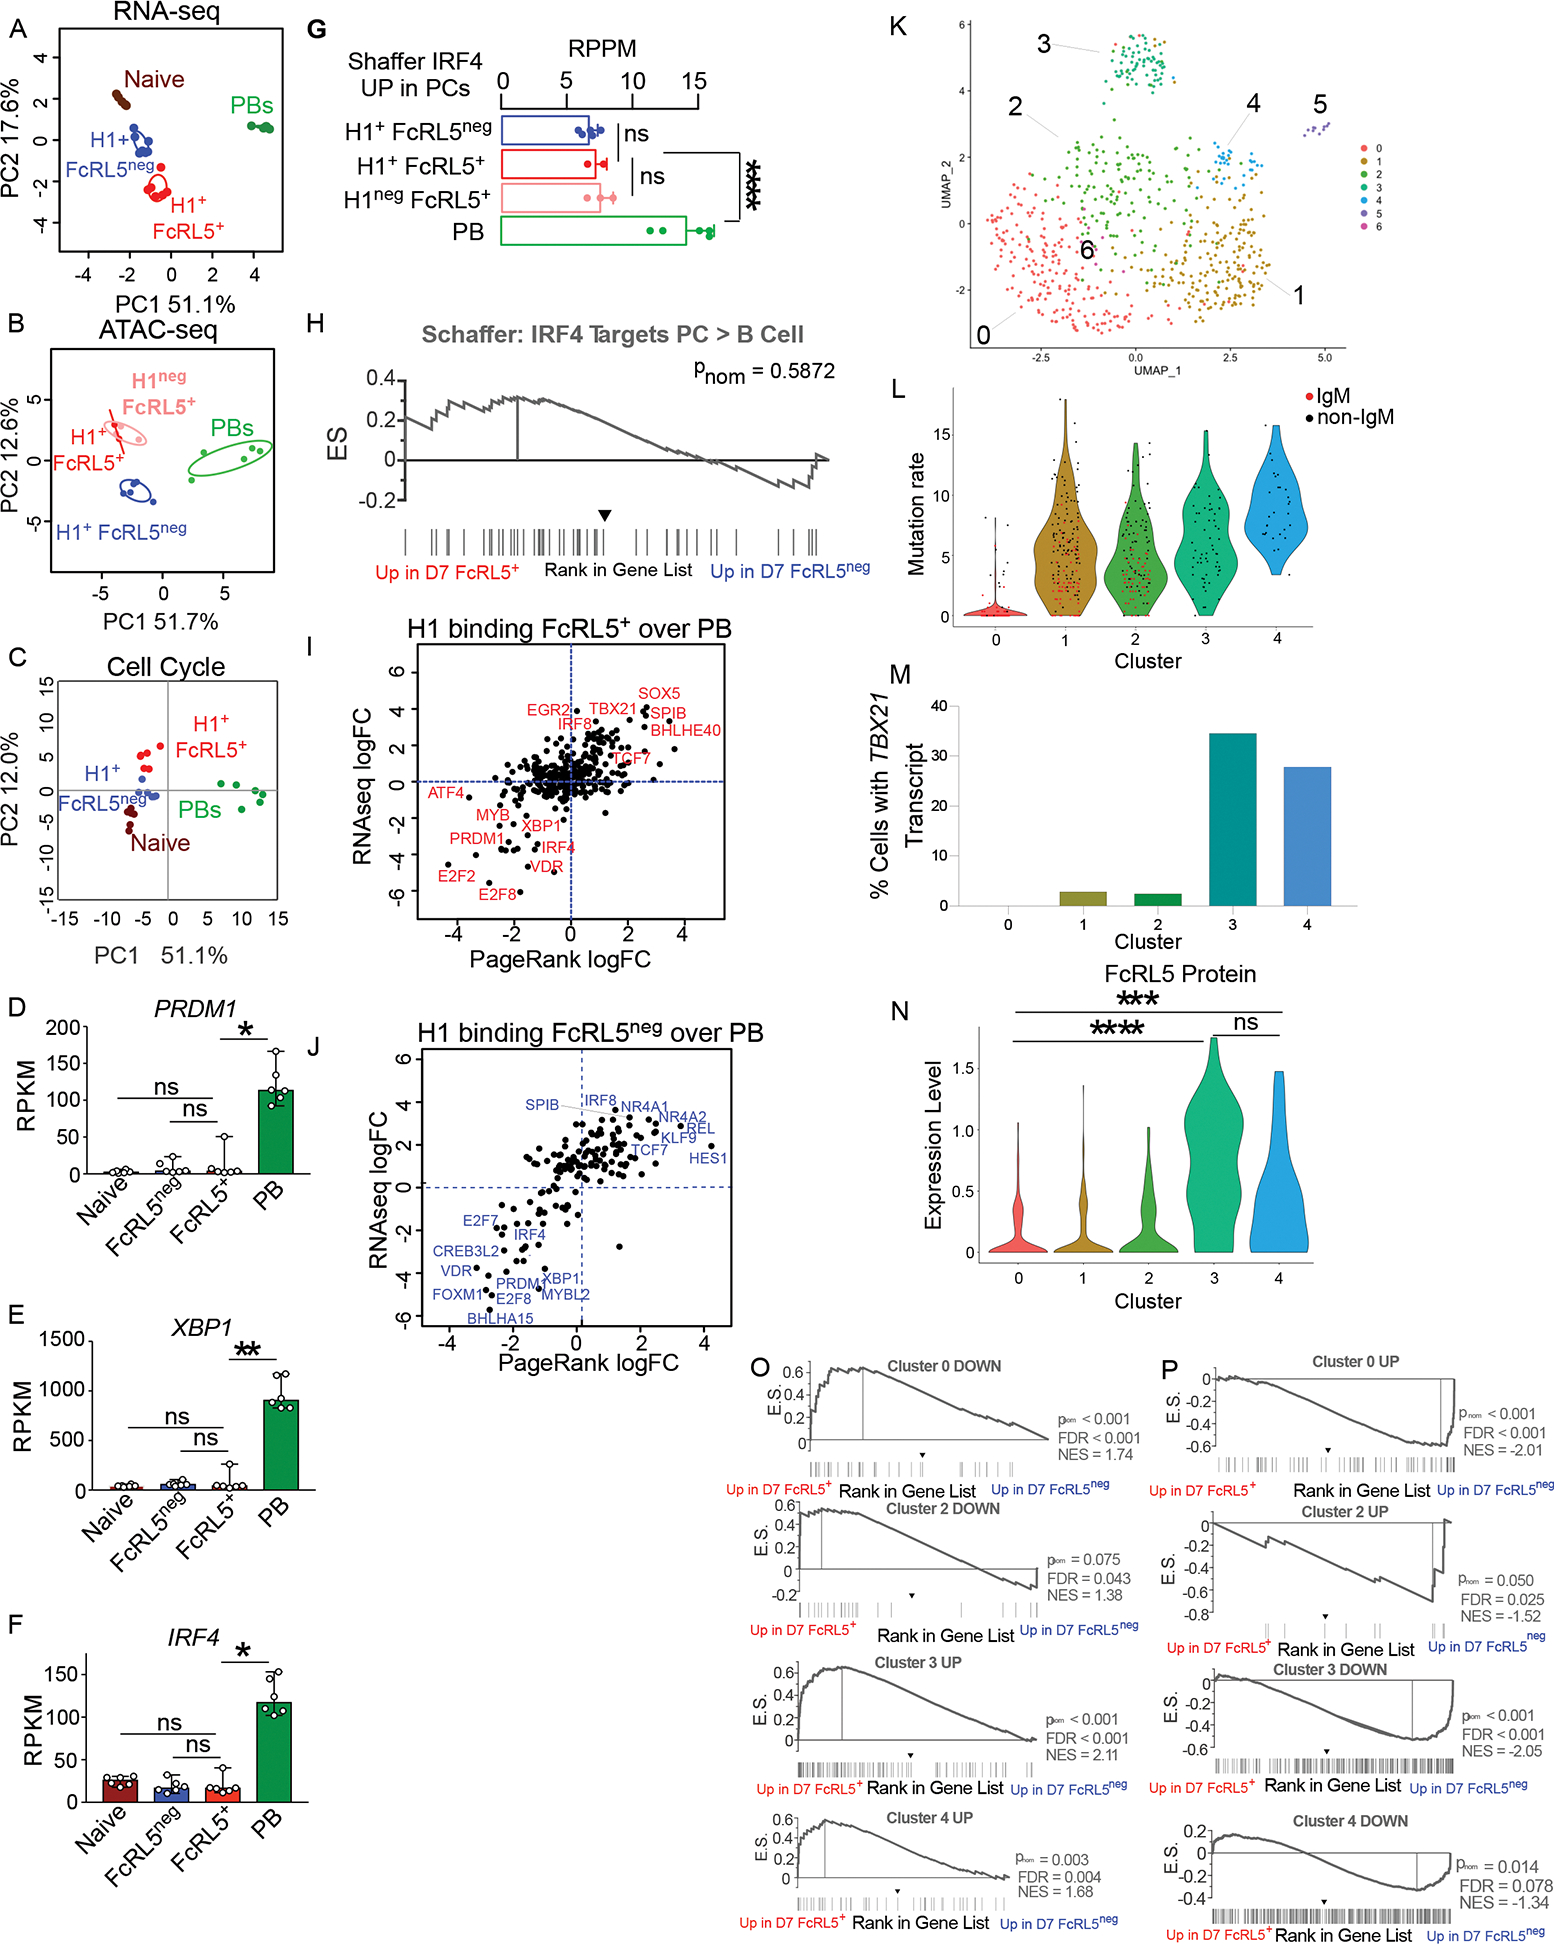
(A-J) RNA-seq and ATAC-seq analyses performed on D7 post-IIV B lineage subsets from 5–6 HDs.
(A-B) PCA of RNA-seq (A) and ATAC-seq (B) data sets from D7 B lineage subsets.
(C) PCA of cell cycle genes expressed by D7 B cell subsets.
(D-F) PRDM1 (D), XBP1 (E) and IRF4 (F) mRNA expression by D7 B cell subsets.
(G-H) Accessibility and expression of published18 IRF4-regulated ASC genes by D7 B lineage subsets. Chromatin accessibility surrounding IRF4 ASC regulon genes (G) is reported as the mean peak accessibility for all peaks mapping to IRF4 ASC regulon genes. GSEA (H) comparing the RNA-seq ranked gene list from D7 H1-specific IgDneg FcRL5+ vs FcRL5neg B cells to the IRF4 ASC regulon gene set.
(I-J) PR identified TFs predicted to regulate gene networks in D7 PBs and IgDneg H1-specific Bmem cell subsets. Data reported as logFC in PR score and logFC in mRNA expression of each TF with D7 FcRL5+ Bmem cells over PB (I) or D7 FcRL5neg Bmem cells over PBs (J). Selected TFs indicated.
(K-P) Single cell RNA-seq, BCR-seq and CITE-seq analyses of sort-purified HA-specific IgDneg B cells from 2 HD between D7-D21 post-IIV.
(K) UMAP showing transcriptional clusters (C0-C6) from single cell RNA-seq data.
(L) BCR-seq analysis of single cells in Clusters C0-C4. Data reported as VH gene mutation frequency. Unswitched (IgM+, red dots) and switched (black dots) cells are shown.
(M) TBX21 expression reported as % of cells in each cluster with at least one TBX21 transcript.
(N) CITE-seq analysis of FcRL5 protein in HA-specific IgDneg in Clusters C0-C4. Expression in single cells normalized using scTransform47 and shown as violin plots.
(O-P) GSEA comparing the ranked gene list from D7 H1-specific IgDneg FcRL5+ vs FcRL5neg B cells to the upregulated or downregulated DEGs in each single cell cluster. Data shown include single cell DEG sets enriched in D7 H1-specific IgDneg FcRL5+ (O) or FcRL5neg (P) B cells. pnom values indicated.
Data sets for RNA-seq, ATAC-seq, PR analysis, GSEA gene sets, and sc-seq datasets are provided in Tables S2–S4. Fig. S2 has additional RNA expression analysis from D7 (S2A-B) and D14 (S2C-I) B lineage subsets. Statistical analyses performed using one-way ANOVA (D-F, N). *p< 0.05, **, p<0.01, *** p<0.001, **** p <0.0001 ns= non-significant.
Our data from the D7 FcRL5+ Bmem cells appeared at odds with a previous publication14, which reports that the phenotypically similar D14 post-IIV CD27+IgDnegCD21lo cells express IRF4 and BLIMP1. Our own analysis of their data (Fig. S2C) also showed enriched expression of IRF4-controlled ASC-specific genes by the D14 post-vaccination CD27+CD21lo Bmem cells. Since the prior study14 examined the bulk CD27+CD21lo Bmem population, which contained both T-bet+ and T-betneg cells, on D14 post-IIV, we tested whether the IgDneg HA-specific FcRL5+ T-bet expressing Bmem cells also upregulated the ASC transcriptional program by D14 after IIV. Upon comparing the DEG list between D14 HA-specific FcRL5+ and FcRL5neg Bmem cells with the DEG list from the published D14 CD21hi and CD21lo total Bmem cells14, we observed limited (<13%) overlap (Fig. S2D) with no evidence that IRF4, PRDM1 or XBP1 were functioning as regulatory hubs in in either D7 or D14 FcRL5+ Bmem cells (Fig. S2E–I). Therefore, we concluded that the IIV-elicited FcRL5+ T-bet-expressing HA+ Bmem cells were not transcriptionally committed to the ASC fate.
Next, we utilized a single cell approach to address whether the T-bet+ FcRL5+ Bmem cell subset could be identified in a marker agnostic non-supervised fashion,. Unlike a recent single cell RNA analysis13, which identified 2 Bmem cell clusters following prime boost with a neo Ag (H7N9), our analysis of IIV-elicited single cell-sorted HA-specific IgDneg B cells revealed 7 clusters (Fig. 2K), including 5 clusters (C0-C4) with sufficient cells for detailed analysis (Table S4). Clusters C0, C1 and C2 contained IgM+ cells with fewer somatic mutations as well as isotype-switched cells that were more extensively mutated (Fig. 2L). Clusters C3 and C4 were almost entirely isotype-switched (Fig. 2L). C3 contained both heavily mutated switched cells as well as less mutated switched cells, while the C4 switched cells were all extensively mutated (Fig. 2L). Clusters C0, C1, and C2 contained very few TBX21-expressing cells, while clusters C3 and C4 included most of the TBX21-expressing (Fig. 2M) and FcRL5+ (Fig. 2N, Table S4) cells. Next, we defined the unique DEG (Table S4) for each cluster and used GSEA to compare these DEGs with the rank gene list derived from the bulk RNA-seq analysis of sort-purified D7 HA-specific IgDneg FcRL5+ and FcRL5neg Bmem cells. DEGs from C1 were not enriched in either the FcRL5+ or FcRL5neg Bmem cell subsets (Table S4). C0 and C2 were transcriptionally enriched for genes that are more highly expressed by the FcRL5neg Bmem cell subset while C3 and C4 were transcriptionally enriched for genes upregulated in the FcRL5+ Bmem cell subset (Fig. 2O–P). Thus, the analyses of IIV-induced HA+ Bmem cells as single cells or as phenotypically defined subsets supported the conclusion that FcRL5+ T-bet-expressing Bmem cells are molecularly distinct from FcRL5negT-betneg Bmem cells.
IgDneg HA-specific Bmem cells can be subdivided into stable effector-like and stem-like populations.
Since T-bet regulates effector function in other immune cell types20, we hypothesized that FcRL5 and TBX21-expressing HA-specific Bmem cells might exhibit transcriptional features of effector cells. Consistent with this, we found that known central memory T cell genes21 like CCR7, BCL2 and TCF7, were downregulated in the FcRL5+ Bmem cells while known effector memory T cell genes21, like TBX21, ZEB2 and CXCR3, were upregulated in FcRL5+ Bmem cells (Fig. 3A). GSEA also revealed enriched expression of effector T cell genes22,23 within the TBX21+ FcRL5+ Bmem cell compartment (Fig. 3B). Next, we used PR (Table S2) to identify TFs predicted to regulate the gene networks in D7 post-IIV HA-specific FcRL5+ relative to FcRL5neg Bmem cells. Again, we observed that effector-associated TFs7,8, like T-bet, BATF and BHLHE40, were predicted to regulate the FcRL5+ Bmem cell transcriptional gene network while central memory-associated TFs6,24, like TCF7 and LEF1, were predicted to regulate the FcRL5neg Bmem cell gene network (Fig. 3C).
Figure 3. Division of H1-specific B cells into FcRL5+ effector-like and FcRL5neg stem-like Bmem cells.

(A) Volcano plot showing DEG upregulated in D7 H1-specific IgDneg FcRL5+ (red) and FcRL5neg (blue) Bmem cells.
(B) GSEA comparing the ranked gene list from D7 H1-specific IgDneg FcRL5+ and FcRL5neg B cells to DEG that are either upregulated (KAECH22) or down-regulated (GOLDRATH23) in effector vs memory CD8+ T cells.
(C) TFs identified by PR as regulators of the D7 H1-specific IgDneg FcRL5+ and D7 H1-specific IgDneg FcRL5neg gene networks.
(D-E) Shared BCR VH lineages between H1-specific IgDneg Bmem cells isolated from the same donor at sequential timepoints. Data reported as percentage of shared lineages between different Bmem cell populations over time. The numbers of non-singleton lineages identified in each subset at each timepoint and the numbers of shared lineages for each pairwise comparison indicated.
(F) TFs identified by PR as regulators of D14 H1-specific IgDneg FcRL5+ and D14 H1-specific IgDneg FcRL5neg gene networks.
Data sets for BCR repertoire, RNA-seq, PR, and GSEA genesets provided in Tables S1–S3.
These data were consistent with the possibility that FcRL5+ Bmem cells represented recently activated memory cells while FcRL5neg Bmem cells were more mature and would accumulate with time after vaccination. If so, we predicted that we would observe a shift of the D7 FcRL5+ clonotypes into the D14 FcRL5neg population (Table S1). However, D7 FcRL5+ B cell lineages were more represented in the D14 FcRL5+ population relative to the D14 FcRL5neg subset (Fig. 3D). Similarly, we observed more connections between the D14 and the D28 FcRL5+ subsets than between the D14 FcRL5+ and D28 FcRL5neg subsets (Fig. 3E), even when rarefaction analysis was performed to control for the number of compared lineages. These results were further supported by PR (Table S2), which predicted that T-bet, BATF and BHLHE40 serve as regulatory hubs of both D7 and D14 FcRL5+ Bmem cells (Fig. 3F). Thus, the TBX21-expressing FcRL5+ memory population was not a transient intermediate but rather appeared to be a stable Bmem cell subset endowed with an effector-like molecular program.
T-bet associated transcriptome and epigenetic changes distinguish effector and resting Bmem cell programs.
Since PR predicted T-bet as a regulator of 991 genes in the FcRL5+ Bmem cell subset (Table S2), we assessed whether T-bet might contribute to the transcriptional and epigenetic landscape of FcRL5+ Bmem cells. Using the ATAC-seq data, we observed that chromatin accessibility surrounding HOMER-defined T-bet binding motifs was differentially enriched in the FcRL5+ subset relative to FcRL5neg Bmem cells and PBs (Fig. 4A). Similarly, previously described T-bet ChIP-seq peaks25 were more accessible in the FcRL5+ Bmem cells (Fig. 4B). Next, we identified genes encoding TFs that were differentially expressed between FcRL5+ and FcRL5neg Bmem cells and were also assigned to at least one T-bet binding motif containing DAR and/or T-bet ChIP-seq peak (Fig. 4C, Table S3). We observed that expression of multiple TFs changed progressively between FcRL5neg cells, FcRL5+ cells and ASCs (Fig. 4C). For example, TCF7, which is reported to support stem-like potential in memory T cells6 and BACH2, which maintains B lineage identity9 and prevents ASC development10,11, were both more highly expressed in the FcRL5neg subset and decreased progressively in the FcRL5+ cells and ASCs (Fig. 4D–E). The FcRL5+ subset and ASCs also exhibited decreased chromatin accessibility in TCF7 and BACH2 associated DARs containing T-bet binding sites (Fig. 4D–E). By contrast, ASC-associated TFs, like TOX2 and ARID3A, were more highly expressed in the FcRL5+ subset relative to the FcRL5neg subset and chromatin accessibility within the TOX2 and ARID3A assigned DAR with T-bet binding sites was increased (Fig. 4F–G). Thus, T-bet expression by FcRL5+ Bmem cells was associated with epigenetic and transcriptional changes that favor an effector-like program.
Figure 4. The transcriptome and epigenome of FcRL5+ Bmem cells display T-bet associated changes.
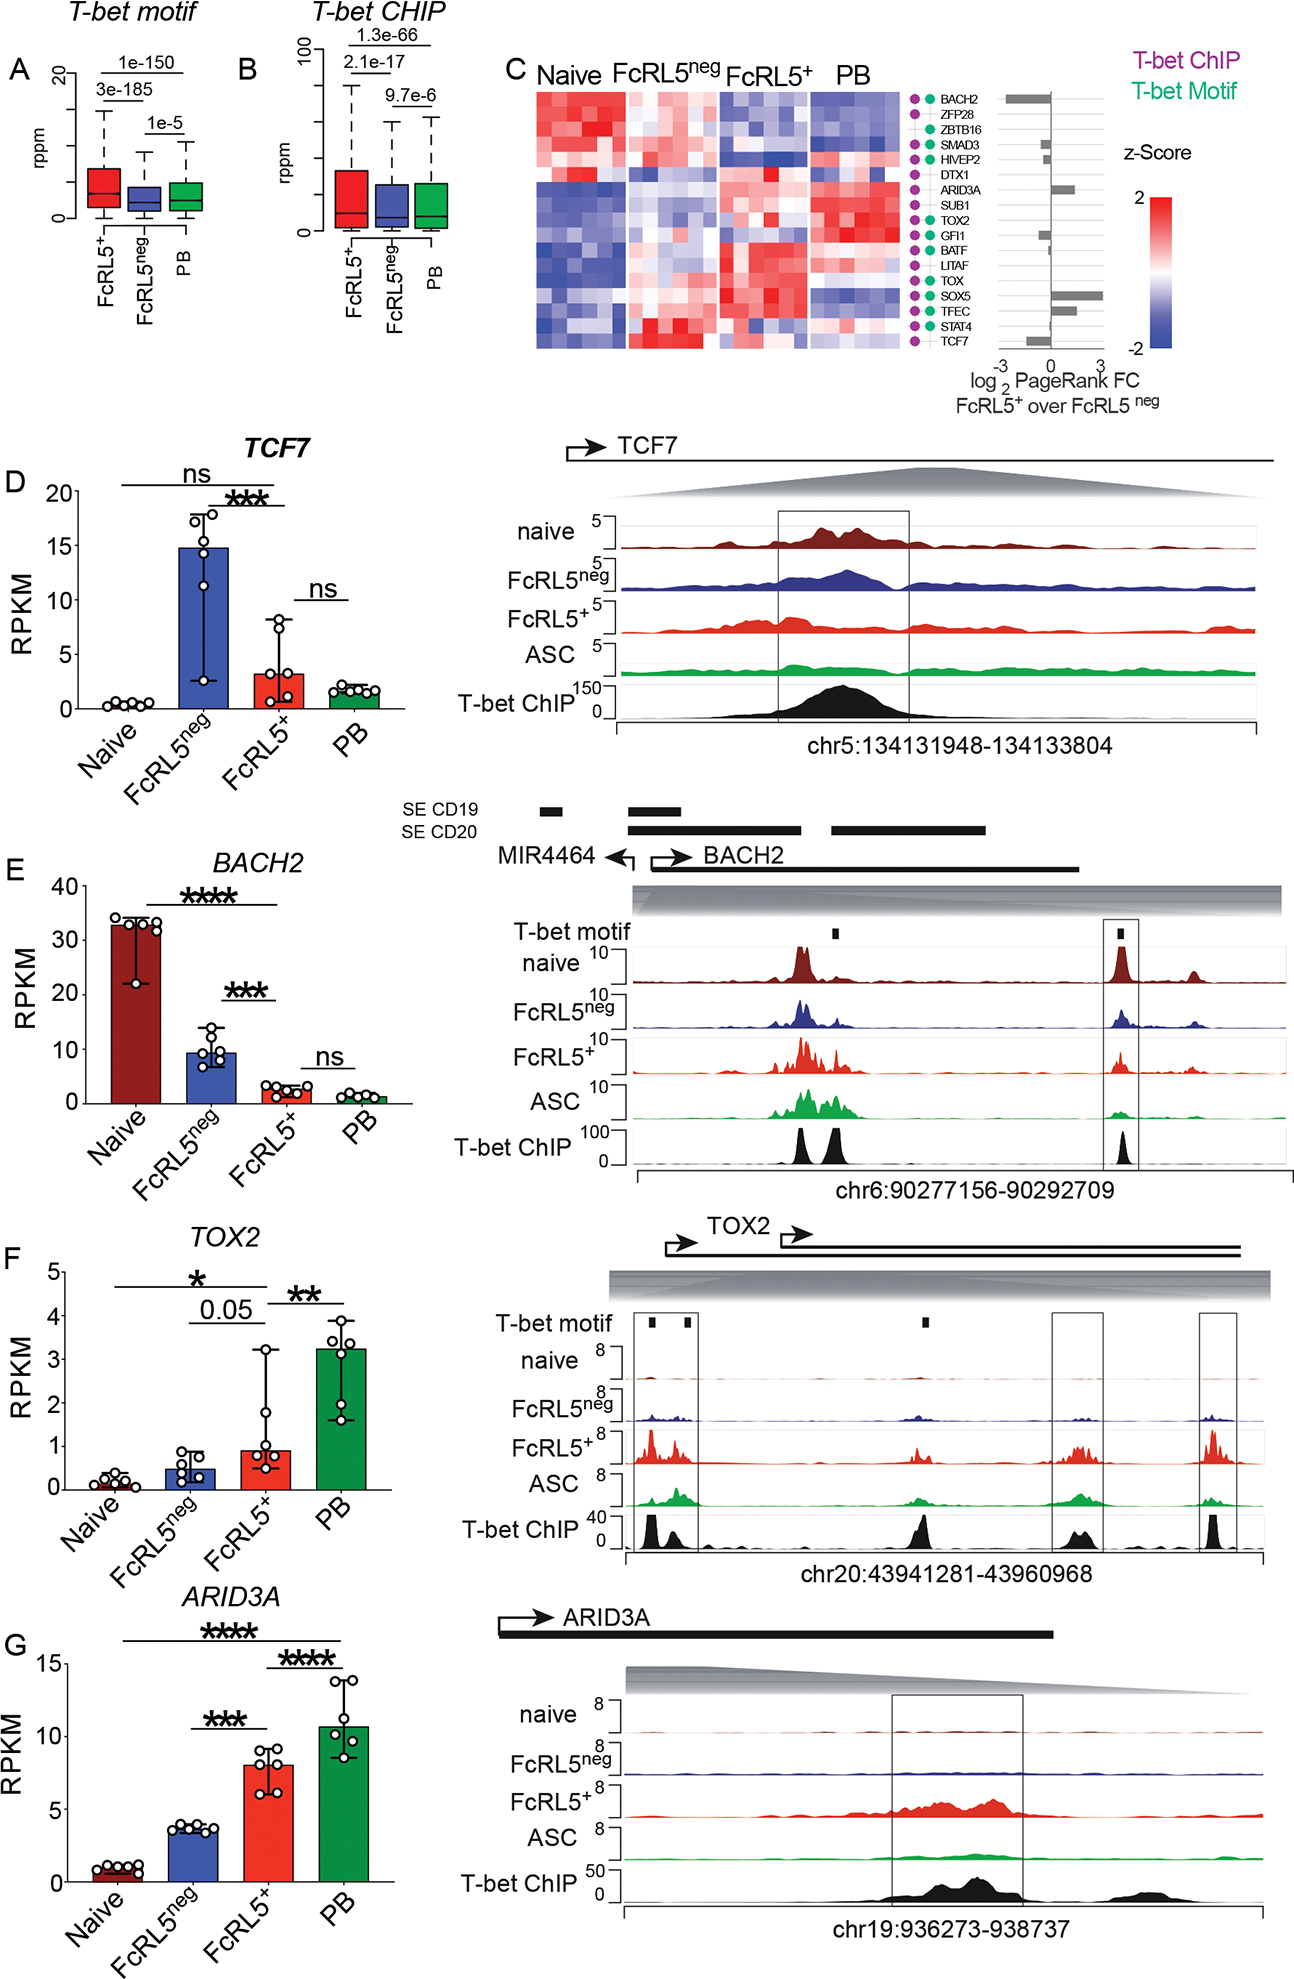
(A-B) Box plots showing chromatin accessibility surrounding (within 50 bp) defined T-bet motifs (A) and previously identified T-bet ChIP-seq peaks25 (B) in memory FcRL5+, FcRL5neg and PB populations.
(C) Expression of transcriptional regulators (n=17) that were identified as DEG between FcRL5+ and FcRL5neg Bmem cells and were also assigned to at least one DAR that contained a T-bet binding motif (green dots) and/or ChIP-seq T-bet binding site25 (purple dot). Data shown as a heat map displaying per-regulator gene z-scores of log expression in the indicated subsets. PR scores for each regulator shown as absolute value log2 FC of FcRL5+ over FcRL5neg cells.
(D-G) RNA-seq expression and genome ATAC-seq plots for TCF7 (D), BACH2 (E), TOX2 (F) and ARID3A (G). Genome ATAC-seq plots aligned with ChIP-seq T-bet binding sites25 and with ATAC-seq from resting naïve B cells48. Boxes indicate loci with significant DAR. Vertical black bars indicate HOMER-predicted consensus T-bet binding motifs. Super-enhancers in BACH2 locus identified in CD19+ and CD20+ human B cells49 shown as horizontal black bars. Shaded gray triangles indicate location of DAR-containing regions within each locus. Statistical analyses were performed using one-way ANOVA (D-G). *p< 0.05, **, p<0.01, *** p<0.001, **** p <0.0001 ns= non-significant.
Data sets for RNA-seq, ATAC-seq, transcriptional regulators and PR analyses are provided in Tables S2–S3.
TBX21-expressing FcRL5+ HA-specific Bmem cells exhibit distinct metabolic and signaling profiles.
Our prior GSEA (Fig. 3B) revealed that D7 FcRL5+ Bmem cells were enriched for expression of genes associated with T effector cells, particularly genes that regulate metabolism and protein production. To assess whether specific metabolic programs were transcriptionally enriched in the FcRL5+ TBX21+ Bmem cells subset, we performed GSEA with the curated Gene Ontology (GO) mSigDB gene set collection26. Although none of the GO gene sets were enriched within the FcRL5neg Bmem cell dataset, 185 GO gene sets were both enriched and upregulated in the FcRL5+ Bmem cell transcriptome (Table S2). We used the leading-edge gene lists from the 185 GO gene sets to cluster the gene sets with the most similar leading-edge gene lists (Table S2, Fig. 5A). Next, we selected 11 representative GO mSigDB gene sets ((Prototypic genesets i-xi), Fig. S3A, Table S2) and performed PCA using the leading-edge genes from each prototypic gene set. We observed that expression of the leading-edge gene sets from these 11 prototypic GO gene sets differed substantially between FcRL5+ and FcRL5neg HA-specific Bmem cell subsets on both D7 and D14 (Fig. 5B).
Figure 5. Metabolic gene expression differs between FcRL5+ effector and FcRL5neg stem-like Bmem cells.
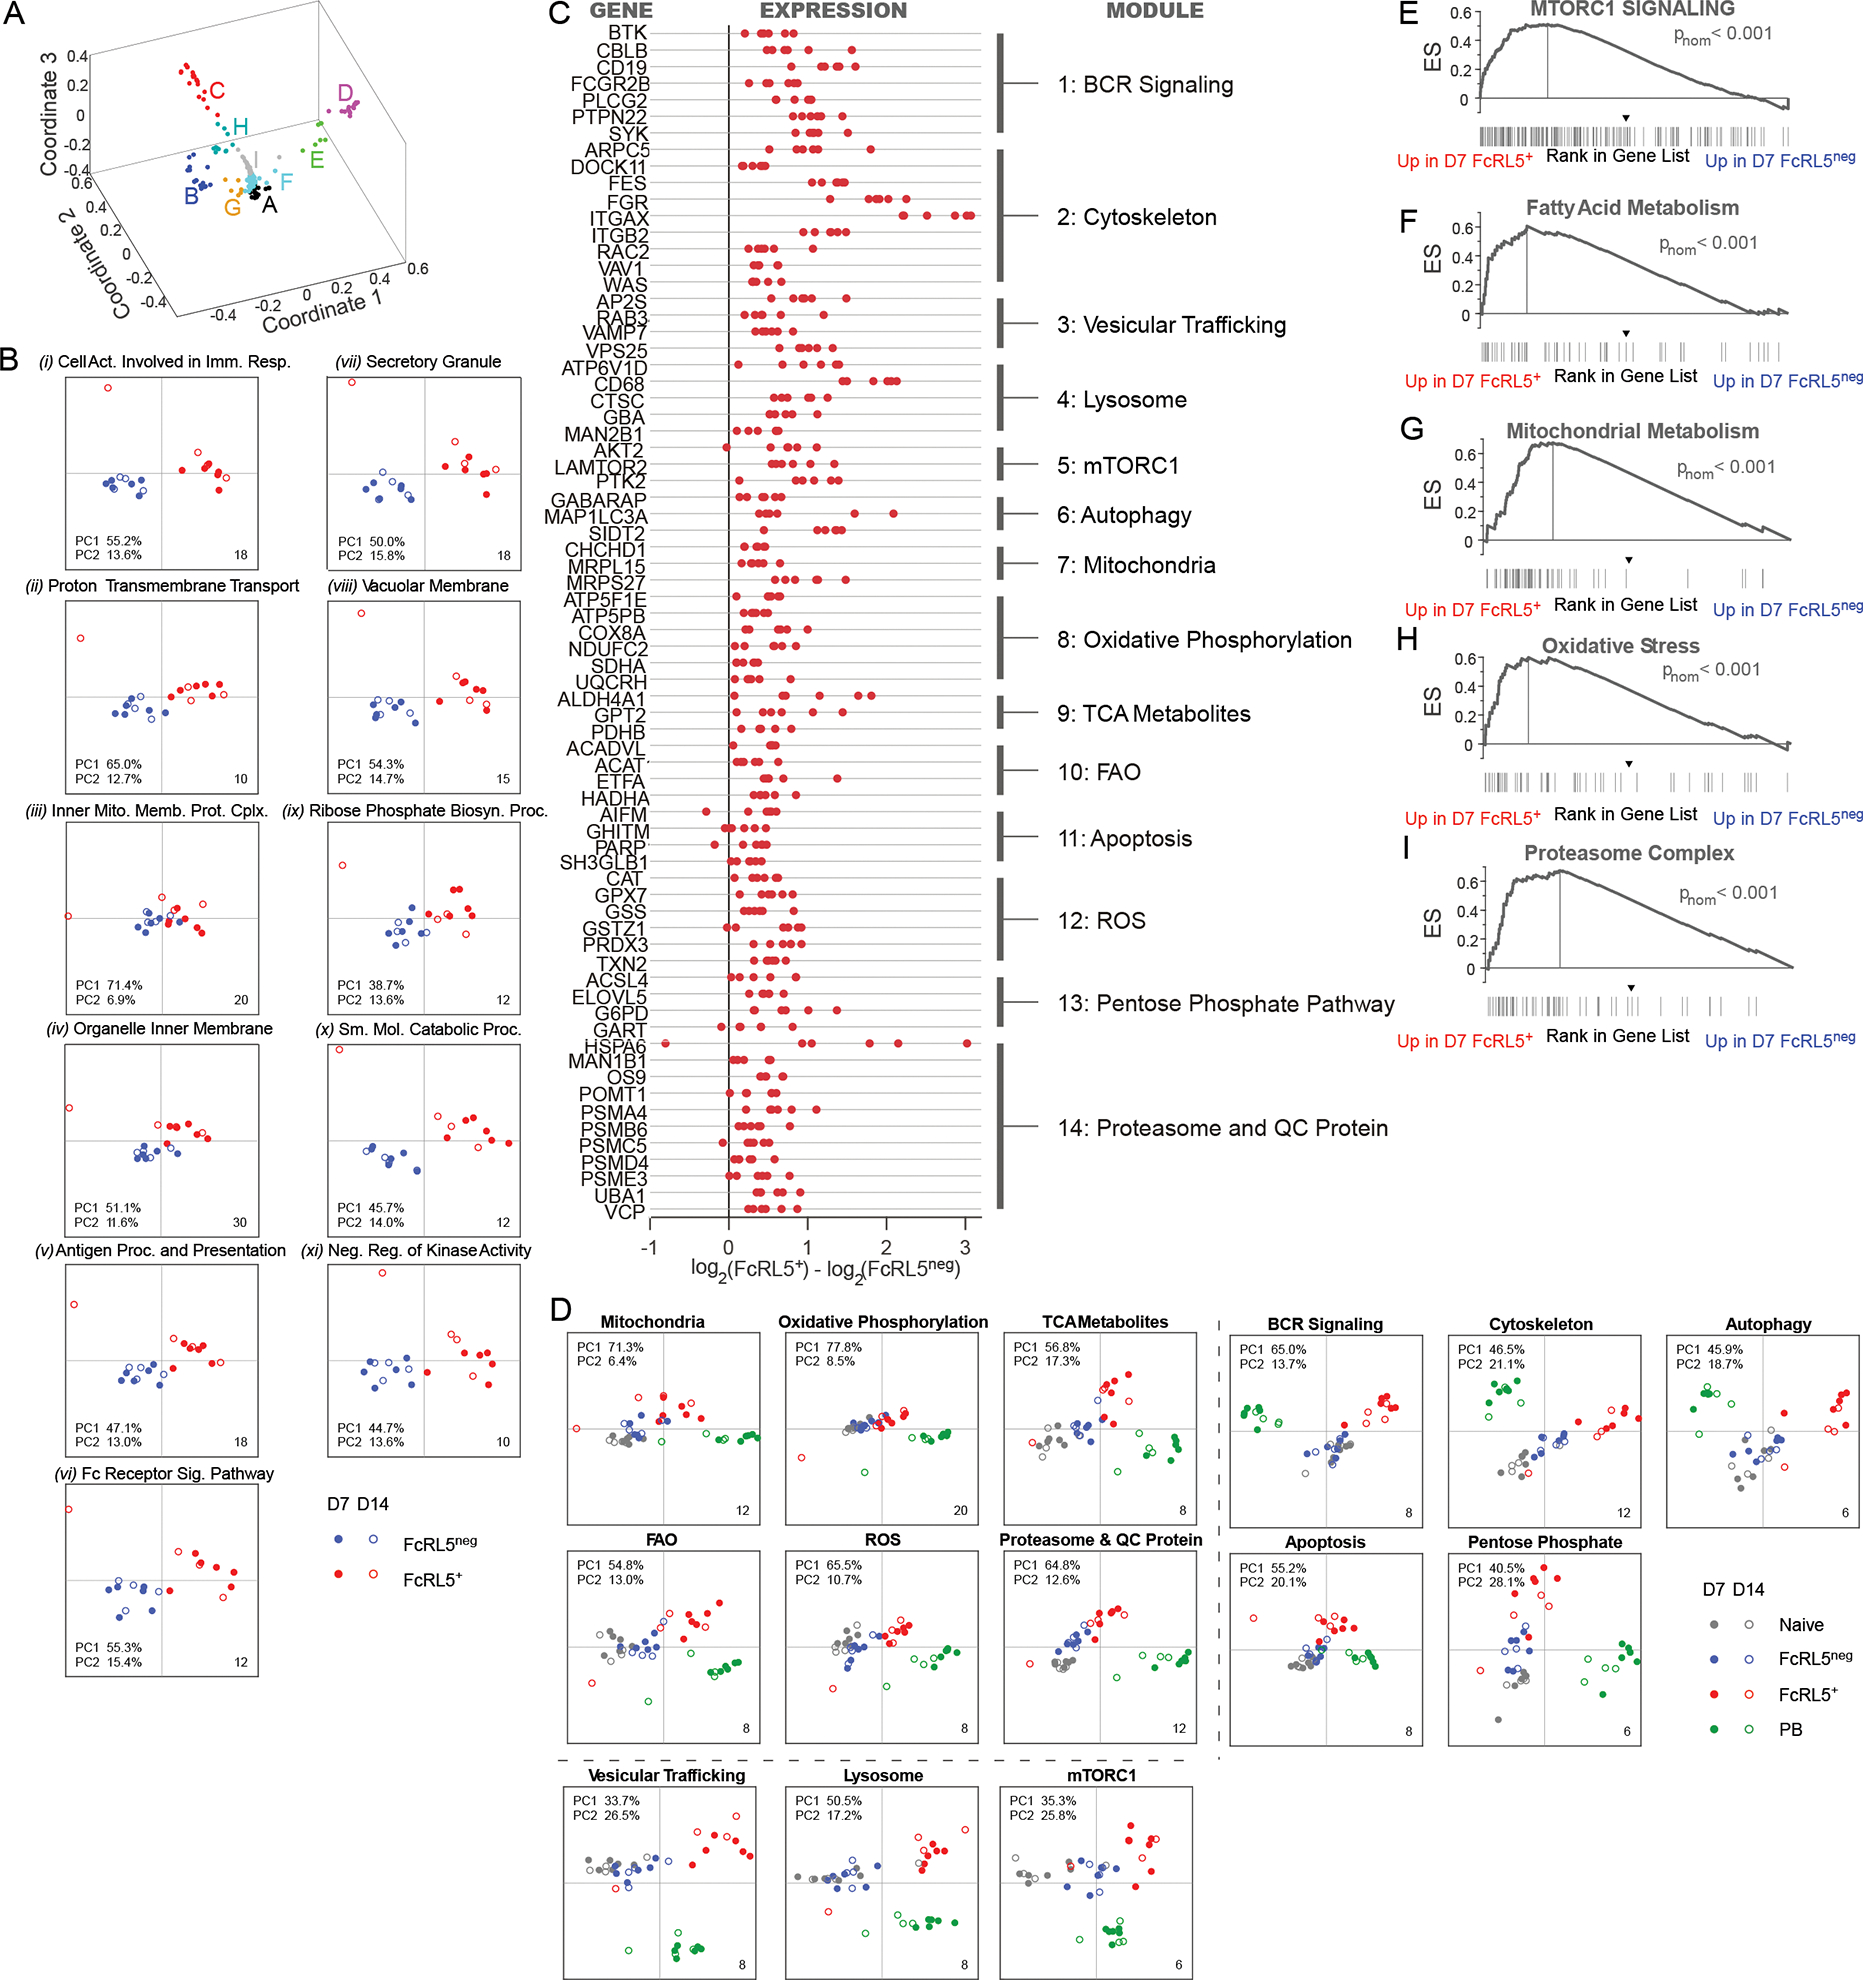
(A-C) Identification of signaling and metabolic gene modules in FcRL5+ Bmem cells. Clustering (A) of leading-edge genes from 185 GO gene lists (mSigDB v.7) that were enriched (FDR q < 0.01) for expression in D7 FcRL5+ relative to D7 FcRL5neg Bmem cells. Nine clusters (A-I) with overlapping leading edge gene sets were identified. Eleven prototypic GO gene lists (lists i-xi) representing the 9 GO gene set clusters were selected and the leading-edge genes from gene lists were functionally annotated and used for PCA (B) comparing D7 and D14 H1-specific IgDneg FcRL5+ and FcRL5neg Bmem cells. The leading-edge genes were grouped into 14 signaling and metabolic modules (C) with representative genes from each module shown as the difference in log2 FC in expression by D7 H1-specific IgDneg FcRL5+ and FcRL5neg Bmem cells. Red dots indicate individual samples with FDR q<0.05. (D) PCA using the 14 module gene sets comparing naïve B, D7 PB and D7 or D14 H1-specific IgDneg FcRL5+ and H1+ IgDneg FcRL5neg Bmem cells.
(E-I) GSEA comparing the RNA-seq ranked gene list from D7 H1-specific IgDneg FcRL5+ and FcRL5neg B cells to curated gene lists for mTORC1 signaling (E), fatty acid metabolism (F), mitochondrial metabolism (G), oxidative stress (H) and proteasome complex (I). GSEA pnom-values indicated.
Table S2 and Fig. S3 include clustering and module data, leading-edge genes from prototypic GO-gene lists, and gene lists for the signaling and metabolism modules and GSEA genesets.
We then used the functional annotations of the leading-edge genes from the 11 prototypic GO gene lists to group the genes into signaling and metabolic genes modules (Table S2). The genes in all 14 modules were upregulated by the FcRL5+ Bmem cells. These included BCR and cytoskeleton assembly and signaling genes (Modules 1–2, Fig. 5C, Fig. S3B–C) and genes involved in endosome and lysosome cargo trafficking, autophagosomes, lysosome function and the lysosome-associated mTORC1 signaling complex (Modules 3–6, Fig. 5C, Fig. S3D–G). Moreover, we consistently observed that programs regulating mitochondrial activity and ATP metabolism, including the electron transport chain (ETC), oxidative phosphorylation, the tricarboxcyclic acid (TCA) cycle and mitochondrial fatty acid β-oxidation (FAO), were activated in FcRL5+ Bmem cells (Modules 7–10, Fig. 5C, Fig. S3H–K). We noted that FcRL5+ Bmem cells upregulated genes associated with producing and degrading toxic27 reactive oxygen species (ROS). We observed that FcRL5+ Bmem cells had increased expression of genes associated with caspase-dependent and independent apoptosis as well as genes associated with detoxifying free radicals (Modules 11–12, Fig. 5C, Fig. S3L–M). These included genes in the pentose phosphate pathway (PPP), which is required for de-toxification of free radicals and biosynthesis of purines and FAs (Module 13, Fig. 5C, Fig. S3N). Finally, we found genes involved in protein production and catabolism, including components of the ER associated degradation complex (ERAD)28 and proteasome subunits, were upregulated in FcRL5+ Bmem cells (Fig. 5C Module 14, Fig. S3O). To assess whether these metabolic programs were stable attributes of the FcRL5+ Bmem cells, we performed PCA using the 14 module gene sets and observed that the these metabolic programs were also enriched in D14 FcRL5+ Bmem cells (Fig. 5D). Finally, using independently curated gene lists for each of these metabolic pathways in GSEA, we observed that the D7 FcRL5+ Bmem cell transcriptome was enriched for mTORC1 signaling genes (Fig. 5E), fatty acid metabolism (Fig. 5F), mitochondrial metabolism (Fig. 5G), oxidative stress (Fig. 5H), and the proteasome (Fig. 5I). These data therefore suggested that the HA-specific FcRL5+ Bmem cell subset represented a metabolically distinct effector-like population.
FcRL5+ Bmem cells are metabolically poised and rapidly differentiate.
To assess whether the metabolic transcriptional programs correlated with the metabolic activity of FcRL5+ Bmem cells, we performed in vitro functional assays. Since the number of circulating Ag-specific Bmem cells was limiting for most functional analyses, we evaluated the FcRL5+ and FcRL5neg CD27+IgDneg Bmem cells found in adult human lymphoid tissues29. Using FcRL5 to subdivide the tissue-residing CD27+ Bmem cells into T-bet expressing (FcRL5+) or T-bet non-expressing (FcRL5neg) populations (Fig. S4A–C), we stained the cells with H2DCF (Fig. 6A, Fig. S4D), mitotracker green (Fig. 6B, Fig. S4D) or BODIPY 510 (Fig. 6C, Fig. S4E) and measured intracellular ROS activity, mitochondrial mass and fatty acid metabolism. In each case, staining was increased in the tonsil CD27+ FcRL5+ Bmem cells. Moreover, tonsil FcRL5+ Bmem cells exhibited increased phosphorylation of the mTORC1 target, S6 kinase (Fig. 6D, Fig. S4D). Thus, tonsil CD27+FcRL5+ Bmem cells displayed metabolic attributes that were congruent with the metabolic profiles identified in the transcriptome of vaccine-elicited FcRL5+ Bmem cells.
Figure 6. FcRL5+ Bmem cells are metabolically poised to secrete Ab.

(A-D) Metabolic flow assays using tonsil-derived matched (n=6–8 donors) FcRL5+ and FcRL5neg IgDnegCD27+ Bmem cells. ROS activity (A) measured with 2, 7–dichlorohydrofluorescein diacetate (H2DCF). Mitochondrial mass (B) measured with Mitotracker Green. Membrane lipid composition (C) measured with BODIPY510. mTORC1 activation (D) measured with anti-phospho-S6 (pS6) kinase Ab. Data reported as geometric mean fluorescence (gMFI) and shown as paired analysis between FcRL5+ and FcRL5neg cells purified from the same donor.
(E-I) Proliferation and differentiation of purified donor-matched naïve (brown), FcRL5+ (red) or FcrL5neg (blue), IgDnegCD27+CD38lo/med tonsil Bmem cells. CTV labeled cells were stimulated with R848, IL-21, IL-2 and IFN-γ and assessed on D2. Cell survival (E) and frequency of cells per cell division (F) on D2 were determined by flow cytometry and reported as the mean ± SD (n = 5 donors). ASCs in D2 cultures enumerated by flow cytometry (G) with frequencies of total CD27hiCD38hi ASCs (H) and percentage of ASCs in each cell division (I) reported.
(J-K) GSEA comparing the ranked gene list from D7 H1-specific IgDneg FcRL5+ and FcRL5neg Bmem cells to genes35 induced by the mTORC1-dependent B cell activation UPR (J) or the mTORC1-dependent PC inductive UPR (K).
(L) Flow cytometry showing H1 tetramer-binding by D7 T-bet+ and T-betneg IgDneg gated B cells.
(M) Extracellular expression of IgG and IgA by D7 IgDneg HA-specific FcRL5neg and FcRL5+ Bmem cells after sequential staining with Abs to FcRL5, IgD, CD19 and HA tetramers (H1 and H3) followed by anti-IgG and anti-IgA Abs.
(N) RNA-seq analysis of IgH transcripts (IgHG1, IgHG2, IgHG3, IgHG4, IgHA1, IgHA2) from sort-purified D7 IgDneg HA-specific FcRL5neg and FcRL5+ Bmem cells.
(O-R) Image Stream analysis of sort-purified D7 post-IIV CD19+IgDneg cells measuring expression of CD38, plasma membrane Ig (detected with H1-APC tetramer), intracellular T-bet, and intracellular Ig (detected with H1-PE tetramer). Representative images (O) of individual CD38hi PBs (n=211 cells), H1 tetramer-binding T-bet+ (n=195 cells) and T-betneg (n=62 cells) cells. Intensity of intracellular (IC) H1 tetramer staining (P) and extracellular (EC) H1 tetramer staining (Q) and the ratio of EC/IC H1 tetramer staining (R) in each T-betneg, T-bet+ and CD38hi cell was determined. Ratio in (R) shown as median for the individual cells within each subset and error bars indicating the 95% confidence interval.
Fig. S4 shows additional analyses of tonsil B cell subsets, gated or purified as in (Fig. S4A–C) and examined in metabolism assays (Fig. S4D–G) or after in vitro stimulation for 2–3 days (Fig. S4H–N). Table S2 and Fig. S5A provide mTORC1-controlled UPR gene set data. Table S5 and Fig. S5C–D report BCR affinity measurements. Fig. S5B shows HA-binding expression over 8 weeks post-IIV2 and Fig. S5E shows expression of transmembrane and secretory Ig exon transcripts. Statistical analyses were performed using Wilcoxon matched-pairs signed rank tests (A-D, N), one-way ANOVA with Kruskal-Wallis Multiple Comparisons Testing (P,Q) and one-way ANOVA with Tukey’s multiple comparison testing (E, H, R). *p< 0.05, **, p<0.01, *** p<0.001, **** p <0.0001 ns= non-significant.
As B cells transition into ASCs, the cells undergo major metabolic reprogramming to support high rate Ab production and secretion30. These metabolic shifts include increasing oxidative phosphorylation31 and mTORC1 activity32 and adapting to increased cellular and ER stress through ROS detoxification mechanisms27,33 and the unfolded protein response (UPR)28. To assess whether FcRL5+ Bmem cells, which have already upregulated many of these metabolic programs, are poised to rapidly differentiate into ASCs following re-activation, we stimulated CellTrace Violet (CTV)-labeled purified tonsil-derived B cell subsets for 3 days with TLR7/8 ligand, IFNγ, IL-2 and IL-21. To ensure that the cultures were not contaminated with the previously described34 IgDnegCD27neg FcRL5+ B cells that already express the ASC commitment factors BLIMP1 and IRF4, we focused first on comparing FcRL5+ IgDnegCD27+ Bmem cells to naïve B cells and FcRL5neg IgDnegCD27+ Bmem cells. Approximately half of the naïve B cells died in culture within the first 2 days (Fig. 6E) and the cells that remained did not divide (Fig. 6F) or differentiate (Fig. 6G–I). While fewer tonsil FcRL5+ Bmem cells survived when compared to the matched FcRL5neg population (Fig. 6E), the surviving FcRL5+ Bmem cells divided at least once within 48 hours while the FcRL5neg cells remained undivided (Fig. 6F). Moreover, while very few ASCs were found in day 2 FcRL5neg Bmem cells cultures, ASCs were easily detected in matched day 2 FcRL5+ Bmem cell cultures (Fig. 6G–I). By day 3, ASCs were detected in the FcRL5neg Bmem cell cultures, however ASC formation was still less than that seen in day 3 FcRL5+ Bmem cell cultures (Fig. S4H–L). Next, we asked whether the FcRL5+ IgDnegCD27+ Bmem cells differentiated at similar rates to the previously described34 IgDnegCD27neg FcRL5+ committed pre-ASCs. Again, we observed that the FcRL5negCD27+ Bmem cells did not efficiently differentiate into ASCs within 2 days. By contrast, both the FcRL5+CD27+ Bmem cells and the IgDnegCD27negFcRL5+ pre-ASCs differentiated efficiently into ASCs (Fig. S4M–N). These data therefore suggested that the T-bet expressing FcRL5+CD27+ Bmem cells from the tonsil exhibited effector-like metabolic properties and were poised to rapidly proliferate and differentiate into ASCs.
Vaccine-specific T-bet+ Bmem cells produce intracellular Ig.
Data from mouse B cells35 demonstrate that UPR genes associated with B cell activation (B cell activity UPR) and early initiation of the ASC program (PC-inductive UPR) are induced in a XBP1-independent and mTORC1-dependent fashion. Using GSEA, we observed enrichment of both the B cell activity and PC-inductive UPR program in the D7 vaccine-elicited FcRL5+ Bmem cells (Fig. 6J–K, Fig. S5A), suggesting that these cells have upregulated metabolic programs necessary for ASC effector function.
Another feature associated with the early ASC transition30 is the switch from production of membrane-associated Ig (extracellular (EC) Ig) to secreted Ig (intracellular (IC) Ig). We therefore examined surface Ig expression in the Bmem cell subsets (Fig. 6L) and observed that the mean fluorescence intensity (MFI) of HA tetramer binding to the IgDneg T-bet+ cells was decreased (HAint) relative to that seen in the IgDneg T-betneg B cells (HAhi). This finding was not unique to our vaccine cohort as HAint cells have been observed in other studies2 (Fig. S5B). To ensure that the lower HA-binding seen in the FcRL5+ T-bet+ Bmem cells was not due to differences in the affinity of the BCRs expressed by these cells, we generated recombinant IgG1 mAbs, which were single-cell cloned from D7 FcRL5+ HAint and FcRL5neg HAhi Bmem cells, and measured the binding of these mAbs to recombinant HA protein. As we observed no significant differences in binding avidity between the Abs derived from the two Bmem cell populations (Fig. S5C–D, Table S5), we next used anti-IgG and anti-IgA reagents to quantify surface Ig expressed by the Bmem cells (Fig. 6M). This analysis, which detected the constant region of the plasma membrane-associated EC Ig and did not rely on binding to the VH domain, again indicated that the FcRL5+ T-bet-expressing Bmem cells expressed less membrane-associated Ig.
Given the reduction in Ig surface expression by the FcRL5+T-bet+ Bmem cells, we next measured class-switched IgH transcript expression. Although we observed no significant differences in IgH transcript expression by the two HA-specific Bmem cell populations (Fig. 6N), we found that the ratio of transmembrane exon transcripts to IgG secretory exon transcripts was lower in D7 FcRL5+ Bmem cells (Fig. S5E). We next used ImageStream to measure HA-specific EC Ig and IC Ig in sort-purified D7 IgDneg B lineage cells. We identified CD38hi PBs that expressed abundant IC H1-specific Ig (Fig. 6O–P) and minimal EC H1-specific Ig (Fig. 6O, Q). The T-betneg Bmem cells exhibited high expression of EC H1-specific Ig and low to undetectable expression of IC H1-specific Ig (Fig. 6O–Q). By contrast, T-bet+ H1-specific Bmem cells exhibited low expression of EC H1-specific Ig (Fig. 6O, Q) but measurable expression of IC H1-specific Ig (Fig. 6O–P). Moreover, the ratio of EC/IC H1-binding was lower in the T-bet+ Bmem cells relative to the T-betneg Bmem cells (Fig. 6R). Thus, the vaccine-induced FcRL5+ effector-like Bmem cell subset appeared poised to produce secretory Ig.
The T-bet+ Bmem cell subset contributes to secondary ASC responses and predicts enduring humoral immunity to IIV.
T cell effector memory declines more rapidly than lymphoid tissue-associated central memory36. To assess the durability of the vaccine-elicited FcRL5+ Bmem cell population, we vaccinated HD over two sequential seasons with vaccines that contained the same H1 (2015 and 2016) or H3 Ag (2016 and 2017) (Fig. 7A). On D7 post-vaccination each year, we determined the frequency of T-bet+ and T-betneg Bmem cells specific for the HA Ag that was conserved in the vaccine across consecutive years. On D7 post-immunization with the 2015 influenza vaccine (Fig. 7A), we identified both T-bet+ and T-betneg CA09(H1)-specific B cells (Fig. 7B). Following revaccination in 2017, the frequency of T-betneg CA09(H1)-specific Bmem cells remained constant while the T-bet+ fraction declined (Fig. 7B). Similar results were seen (Fig. 7C) when we compared B cells responses to HK14(H3) in 2016 and 2017. Compilation of the reactivity data across 11 HDs revealed a selective reduction in the D7 T-bet+ vaccine-specific Bmem cell subset between years 1 and 2 following repeat vaccination with the same Ag (Fig. 7D).
Figure 7. HA-specific IgDneg T-bet+ eBmem cells contribute to secondary ASC responses and predict enduring humoral immunity.
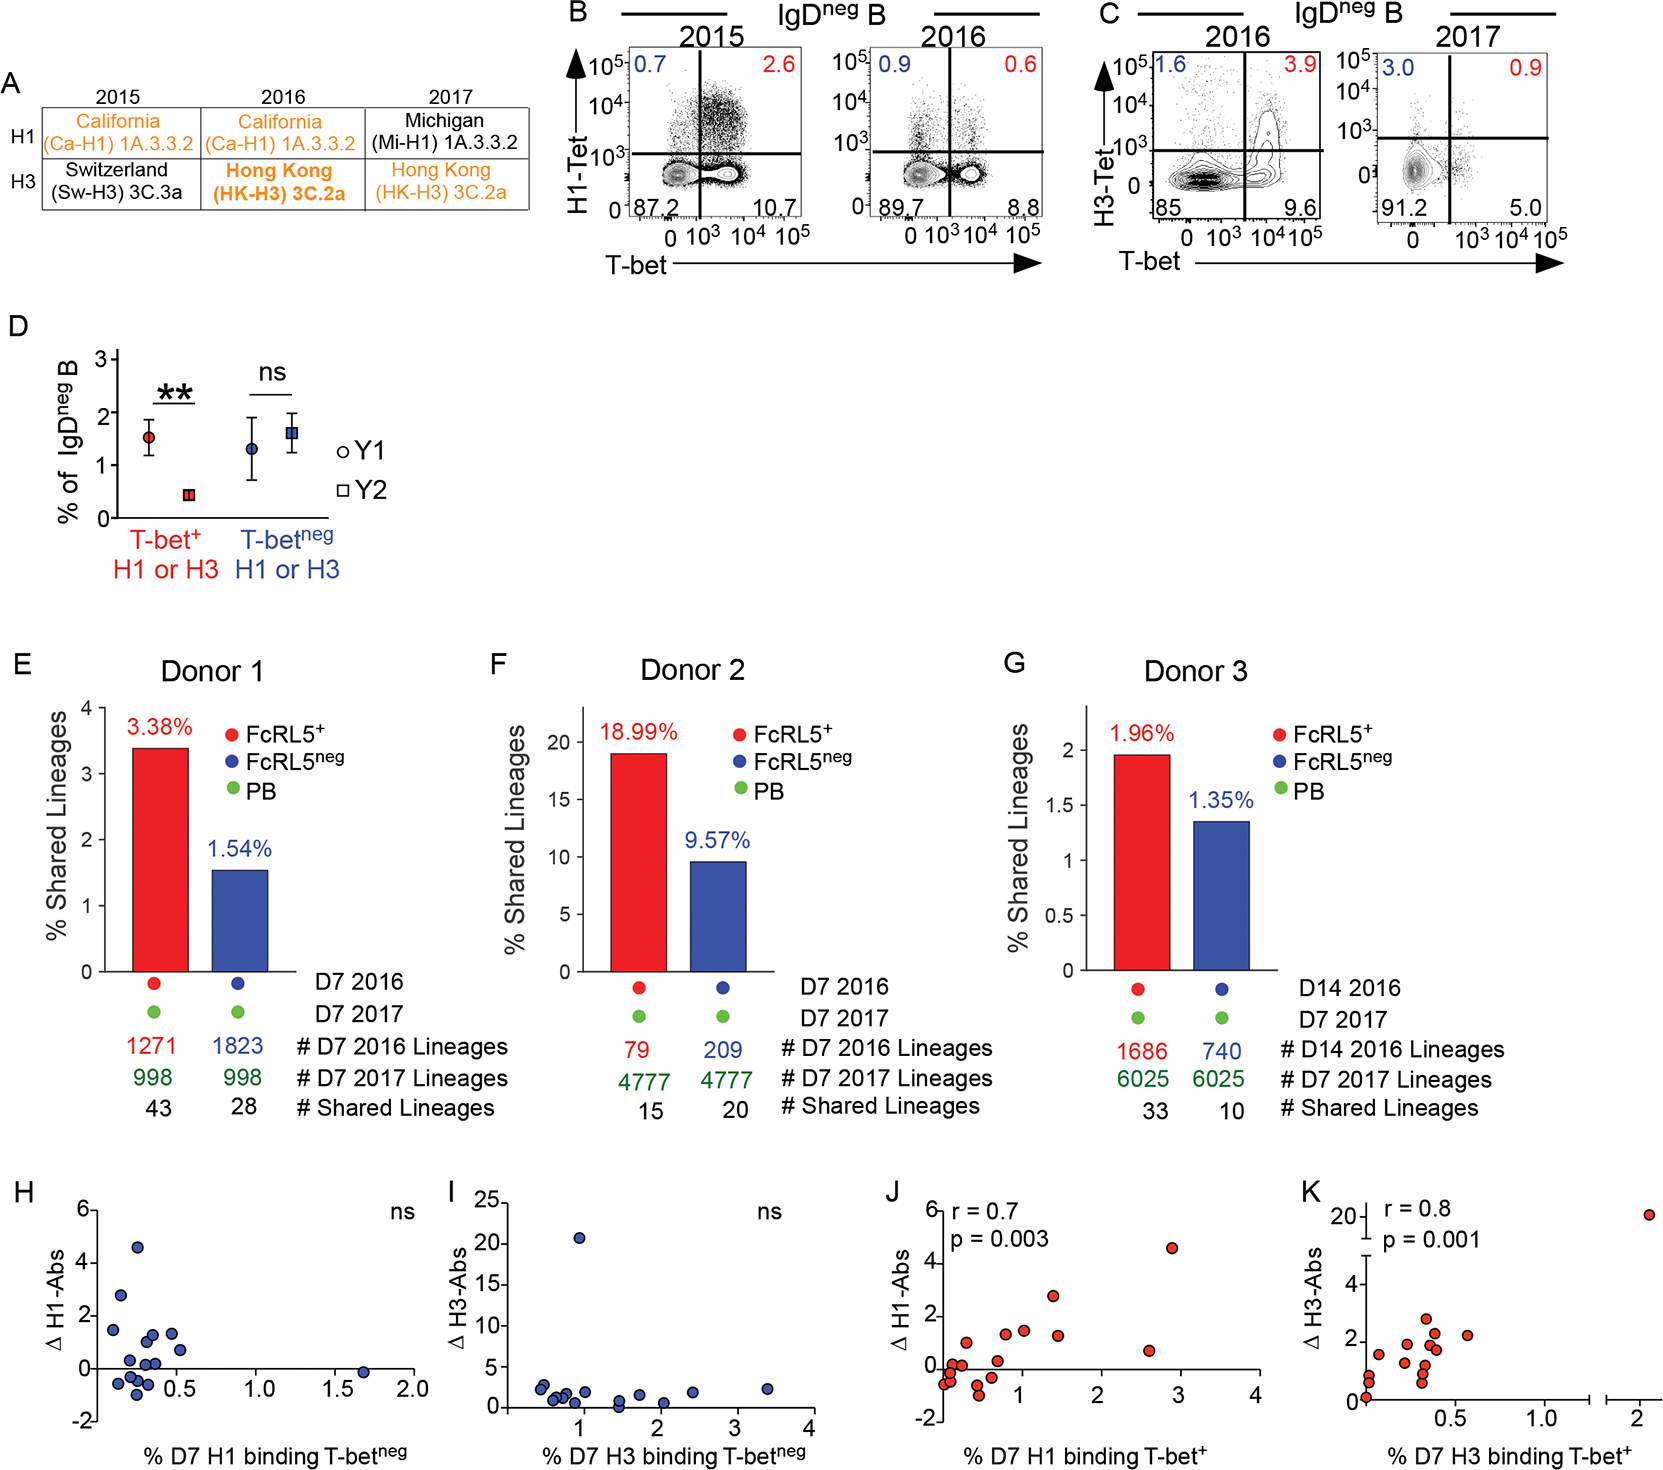
(A) Composition of H1 and H3 Ags in 2015–2017 IIV.
(B-D) Enumeration of D7 H1- or H3-specific IgDneg T-bet+ and T-betneg B cells in HD sequentially immunized with IIV between 2015 and 2016 (n=6) or between 2016 and 2017 (n=5). FACS analysis showing H1-CA09+ Bmem cells over 2 years (2015–2016) from a HD immunized with the same CA09-H1 Ag each year (B) or showing HK14-H3 Bmem cells over 2 years (2016–2017) from a HD vaccinated with the same HK14-H3 Ag each year (C). Frequencies (D), represented as mean with standard error, of the H1-specific or H3-specific T-bet+ or T-betneg B cells for 11 HD vaccinated over 2 years with IIV containing matched H1 or H3 Ags. ** p = 0.002 Wilcoxon matched-pairs signed rank tests.
(E-G) VH BCR repertoire analysis performed on H3-specific IgDneg FcRL5+ and FcRL5neg Bmem cells isolated from HDs (n=3) on D7 (E-F) or D14 (G) post-IIV and PBs isolated from the same donors one year later on D7 following re-vaccination. Data reported as percentage of shared non-singleton lineages between year 1 Bmem cells and year 2 PBs. The number of shared lineages between the PBs and Bmem cell subsets and the number of non-singleton lineages identified by population and timepoint are indicated.
(H-K) Correlation analysis of D7 IgDneg HA-specific Bmem cell responses (frequencies in blood, x axis) and vaccine-specific Ab responses (FC in titers between D0 and D120, Y axis) after IIV in HD (n=19). Comparisons include FC in H1-specific IgG titers vs % D7 H1-specific T-betneg Bmem cells (H); FC in H3-specific IgG titers and % D7 H3-specific T-betneg Bmem cells (I); FC in H1-specific IgG titers and % D7 H1-specific T-bet+ Bmem cells (J); and FC in H3-specific IgG titers and % D7 H3-specific T-bet+ Bmem cells (K). Spearman correlation (r) and significance (p) are provided. ns = no significant correlation. See Table S1 for additional correlation analyses.
The loss of the T-bet+ Bmem cell population following consecutive vaccinations might reflect a shorter lifespan for these cells or could imply that the T-bet+ Bmem cells differentiate into PBs following Ag re-exposure. To test the latter, we purified the D7 or D14 FcRL5+ and FcRL5neg HA-specific Bmem cells from three HDs and then reimmunized those individuals a year later with a vaccine containing the identical H3 Ag and a very similar H1 Ag (97.4% identity). We isolated the circulating D7 PBs following the second vaccination and compared the BCR repertoire between the year 1 Bmem cells and year 2 PBs. We identified shared lineages between the year 1 FcRL5+ Bmem cells and the year 2 PBs in all three HDs (Fig. 7E–G, Table S1). In two HDs we identified multiple lineages that exhibited 100% identical VDJ nucleotide sequences between the year 1 D7 Bmem cells and the year 2 D7 PBs. Moreover, in all 3 HDs we observed more lineage sharing between the year 1 FcRL5+ Bmem cells and the year 2 PBs relative to the sharing seen between year 1 FcRL5neg Bmem cells and year 2 PBs. While the increased frequency of sharing between the year 1 FcRL5+ Bmem cells and the year 2 PBs did not quite reach significance (p=0.058), the data showed that cells from the D7 FcRL5+ and FcRL5neg Bmem cell compartments can persist for a year and that the FcRL5+ Bmem cell subset may exhibit enhanced capacity to contribute to the rapid Bmem cell-derived ASC recall response.
Since some FcRL5+ Bmem cells and FcRL5neg Bmem cells were long-lived, we asked whether their presence on D7 post-vaccination correlated with the development of the long-lived systemic Ab response following vaccination. We therefore determined the fold-change in the vaccine-specific H1 and H3 IgG Ab response between D0 and D120 post-immunization in 19 vaccinated HD and compared this response to the size of the D7 PB, T-bet+ and T-betneg H1-specific or H3-specific Bmem cell responses in those individuals. As previously reported37, the early circulating PB response did not correlate with the long-lived humoral immune response (Fig. S6A). Similarly, we observed no correlation between the fold-increase in systemic Ab responses 4 months after vaccination and the size of the T-betneg H1-specific or T-betneg H3-specific populations on D7 (Fig. 7H–I) or D14 (Fig. S6B–C) post-vaccination. However, we observed a positive correlation between the size of the T-bet+ H1-specific and T-bet+ H3-specific Bmem cell subsets on D7 (Fig. 7J–K) and D14 (Fig. S6D–E) and the magnitude of the D120 H1- or H3-specific humoral immune response. This effect was Ag specific as no correlation was seen between the T-bet+ H1-specific Bmem cell response and the change in H3 Ab titers or vice versa (Fig. S6F–G). Thus, the T-bet+ FcRL5+ metabolically poised Bmem cells exhibit transcriptional, epigenetic and functional attributes of effector Bmem (eBmem) cells and these cells not only persist but may represent an early predictive biomarker of long-lived humoral immunity to seasonal IIV.
Discussion
Using standard phenotypic profiling approaches and marker-agnostic single cell methods, we demonstrated that IIV elicits IgDnegCD27+ FcRL5+ T-bet-expressing Bmem cells that are isotype-switched and somatically hypermutated. D7 FcRL5+T-bet+ HA-specific Bmem cells shared some phenotypic and transcriptional attributes with other previously described vaccine-elicited B cell populations, including the CD27negIgDneg HA-specific newly generated Bmem cells13 and the D14 post-IIV CD27+CD21lo pre-ASCs14. However, transcriptional and epigenetic profiling of the HA-specific FcRL5+ cells revealed that these cells were distinct from the previously described memory populations and share transcriptional attributes also seen in effector and effector memory CD8+ T cells. Whether the phenotypic characteristics of the FcRL5+ cells remain static or change with time, as previously reported for mouse Bmem cells38, is unclear. Regardless, we observed FcRL5+ T-bet+ HA-specific Bmem cells circulating for at least 4 months following vaccination in humans. We also found clonotypes from day 7 FcRL5+ cells recalled to the PB compartment after re-vaccination one year later. Thus, the FcRL5+ Bmem cells were not simply recently activated effectors that rapidly disappeared but instead represented bona fide memory cells.
Effector memory CD8+ T cells are distinguished by changes in cellular metabolism, respiration and mitochondrial dynamics39. Consistent with this, we found FcRL5+ HA-specific Bmem cells also increased expression of genes linked to energy intensive metabolic processes like protein and macromolecule synthesis. Similar metabolic programming changes are seen in ASCs40 and are required for the development of fully functional ASCs31 41. These metabolic changes necessitate adjustment to the ER stress from misfolded proteins in a process referred to as the unfolded protein response or UPR28. In ASCs, the UPR is induced and maintained by the TFs IRE1, XBP1 and ATF628 and is associated with the downregulation of PERK42. Even though the FcRL5+ Bmem cells downregulated PERK (EIF2AK3) and increased expression of UPR and ERAD-associated genes, like OS9, UBA1 and VCP, these cells did not up-regulate XBP1, IRE1 or ATF6, suggesting that FcRL5+ Bmem cells regulate cellular stress responses through an XBP1-independent mechanism. A recent publication35 reported that UPR-associated genes are upregulated following B cell activation and before ASC commitment in an XBP1-independent and mTORC1 dependent manner. Consistent with this publication, we observed that tonsil-derived FcRL5+ Bmem cells showed increased basal mTORC1 activity and that vaccine-elicited FcRL5+ Bmem cells had increased expression of mTORC1 complex genes, including LAMTOR1, LAMTOR2 and LAMTOR5. The modified metabolism of the FcRL5+ Bmem cell subset appeared to support increased protein synthesis and engage the compensatory programs necessary for sustained protein production as we observed that the ratio of intracellular Ig to membrane-associated Ig shifted in favor of intracellular Ig in the HA-specific T-bet+ Bmem cells. Thus, we postulate that the constitutive production of intracellular Ig poises T-bet expressing FcRL5+ cells to rapidly produce secreted Ab once ASC commitment transcription factors, like BLIMP1, are induced following reactivation. Based on these data and analogous to effector memory CD8+ T cells, which are also poised to secrete effector proteins upon reactivation, we argue that the IIV-induced T-bet expressing FcRL5+ Bmem cell population represents an effector Bmem (eBmem) cell subset.
We cannot say from our study whether T-bet controls the development or function of IIV-elicited eBmem. However, PR19, which integrates transcription and chromatin accessibility data, predicted T-bet as an upstream regulator of >900 genes in the FcRL5+ eBmem cell gene network and T-bet was linked to chromatin remodeling in FcRL5+ eBmem cells. Moreover, BACH2, which must be turned off during ASC commitment10,11, showed loss of chromatin accessibility surrounding T-bet binding sites and was downregulated in FcRL5+ Bmem cells. By contrast, chromatin accessibility surrounding T-bet binding sites was increased in the TOX2 and ARID3A loci and expression of these genes was higher in FcRL5+ eBmem cells. Given that TOX2 supports chromatin accessibility43 and ARID3A is a transactivator of IgH locus44 these data suggest that T-bet has the potential to contribute to the epigenetic changes that support fate decisions and effector functions of the FcRL5+ eBmem cell subset.
Finally, our data showed that the size of the D7 post-IIV T-bet+ eBmem cell response positively correlated with the development of a long-lived serum Ab response. This correlation does not imply that T-bet+ Bmem cells are recent GC emigrants or precursors of long-lived ASCs but does suggest that the signals required to elicit the early T-bet+ eBmem cell response may also be involved in the development of a durable ASC response. This finding is important because flow-based assays that can be used early after vaccination to predict long-lived humoral B cell immunity to IIV are lacking45,46. Thus, the IIV-elicited FcRL5+T-bet+ eBmem cell subset represents a pool of memory cells that has the potential to quickly contribute to the rapid burst of secreted Ab following re-exposure to the same or closely related Ags. In addition, the quick induction of the FcRL5+ T-bet expressing Bmem cells following IIV may represent an easily monitored cellular compartment that can be used to predict the development of long-lived Ab responses to IIV.
Limitations of the study.
Our data did not directly test whether T-bet regulates the development or function of HA-specific eBmem cells. Our data did not demonstrate that vaccine-elicited T-bet expressing Bmem cell population can serve as correlate of protection from disease following influenza exposure. Finally, we do not know whether the T-bet+FcRL5+CD27+ Bmem cell subset is induced in response to other vaccines or whether the presence of these eBmem cells can be used to predict the durability of the humoral response to other vaccines.
STAR Methods
RESOURCE AVAILABILITY
LEAD CONTACT
Further information and requests for resources and reagents should be directed to and will be fulfilled by the Lead Contact, Frances E. Lund, flund@uab.edu
MATERIALS AVAILABILITY
Reagents generated in this study include recombinant HA proteins that were tetramerized for flow cytometry analyses, used in ELISA assays and conjugated to beads for cytometric assays. DNA constructs used to generate the recombinant proteins are freely available upon request. Recombinant HA-specific monoclonal Abs were cloned from single Bmem cells. DNA expression constructs for these recombinant Abs are also available upon request.
DATA AND CODE AVAILABILITY
Sequencing data have been deposited in the NCBI Gene Expression Omnibus (GEO) and are publicly available as of the date of publication. Accession numbers are listed in the Key Resources Table.
All original code has been deposited at Zenodo. DOIs are listed in the Key Resource Table.
Any additional information required to reanalyze the data reported in this paper is available from the lead contact upon request.
KEY RESOURCE TABLE.
| REAGENT or RESOURCE | SOURCE | IDENTIFIER |
|---|---|---|
| Antibodies | ||
| Anti-IgD | BD | Cat# 555778 RRID:AB_396113 |
| Anti-IgD | BD | Cat# 561490 RRID:AB_10679356 |
| Anti-IgD | Biolegend | Cat# 348226 RRID:AB_2561619 |
| Anti-CD19 | Biolegend | Cat# 302242 RRID: AB_2561668 |
| Anti-CD19 | Biolegend | Cat# 302234 RRID: AB_11142678 |
| Anti-CD19 | BD | Cat# 560727 RRID: AB_1727437 |
| Anti-CD27 | Biolegend | Cat# 356418 RRID:AB_2562599 |
| Anti-CD3 | Biolegend | Cat# 344808 RRID: AB_10640736 |
| Anti-CD3 | BD | Cat# 560176 RRID: AB_1645475 |
| Anti-CD4 | Biolegend | Cat# 344607 RRID: AB_1953236 |
| Anti-CD4 | BD | Cat# 560158 RRID: AB_1645478 |
| Anti-CD14 | BD | Cat# 561384 RRID: AB_10611720 |
| Anti-FcRL5 | Biolegend | Cat# 340304 RRID: AB_2104588 |
| Anti-CD27 | Biolegend | Cat# 356404 RRID: AB_2561788 |
| Anti-CXCR5 | Biolegend | Cat# 356904 RRID:AB_2561813 |
| Anti-CCR7 | Biolegend | Cat# 353208 RRID:AB_11203894 |
| Anti-CD62L | Biolegend | Cat# 304838 RRID:AB_2562914 |
| Anti-CXCR3 | Biolegend | Cat# 353706 RRID:AB_10962912 |
| Anti-CD38 | Biolegend | Cat# 303516 RRID: AB_2072782 |
| Anti-T-bet | Biolegend | Cat# 644814 RRID:AB_10901173 |
| Anti-T-bet | Biolegend | Cat# 644812 RRID:AB_2200540 |
| Anti-CD21 | Biolegend | Cat# 354908 RRID:AB_2561544 |
| Anti-CD27 | Biolegend | Cat# 356418 RRID:AB_2562599 |
| Anti-CD71 | BD | Cat# 562995 RRID:AB_2737939 |
| Anti phosphoS6 | Cell Signaling Tech | Cat# 2211 RRID:AB_331679 |
| Anti Rabbit IgG (H+L) | ThermoFisher | Cat# A-21245 RRID:AB_2535813 |
| TotalSeq ™-C0829 anti human FcRL5 | Biolegend | Cat# 340309 RRID:AB_2819969 |
| AffiniPure Goat Anti-Human IgG (H+L) | Jackson ImmunoResearch | Cat# 109-005-003 RRID:AB_2337532 |
| Peroxidase Affinipure Goat Anti-Human IgG (H+L) | Jackson ImmunoResearch | Cat# 109-035-088 RRID:AB_2337584 |
| Alkaline Phosphatase AffiniPure Goat Anti-Human IgG (H+L) | Jackson ImmunoResearch | Cat# 109-055-003 RRID:AB_2337599 |
| Bacterial and virus strains | ||
| Biological samples | ||
| PBMCs from flu vaccinated subjects | Alabama Vaccine Research Clinic | N/A |
| Chemicals, peptides, and recombinant proteins | ||
| H2DCFDA | ThermoFisher | Cat# D399 |
| MitoTracker Green FM | ThermoFisher | Cat# M7514 |
| BODIPY500/510 | ThermoFisher | Cat# D3823 |
| Igepal CA-360 | Sigma Aldrich | Cat# 18896 |
| Neuraminidase (C. perfringens) | Sigma Aldrich | Cat# N5631 |
| Imidazole | Sigma Aldrich | Cat# 12399 |
| 7-ADD (7-aminoactinomycin-D) | ThermoFisher | Cat# A1310 |
| Live/Dead Fixable Near-IR Dead Cell Kit | ThermoFisher | Cat# L10119 |
| Live/Dead Fixable Red Dead Cell Kit | ThermoFisher | Cat# L23102 |
| Formalin solution, 10% neutral buffered | Sigma Aldrich | Cat# HT501128 |
| 2-Mercaptoethanol | Thermo Fisher | Cat# BP176-100 |
| Agencourt AMPure XP | Beckman Coulter | Cat# A66514 |
| dNTPs | ThermoFisher | Cat# 18427088 |
| TotalSeq C0952 PE Streptavidin | Biolegend | Cat# 405263 |
| TotalSeq C0953 PE Streptavidin | Biolegend | Cat# 405265 |
| Celltrace Violet | ThermoFisher | Cat# C34557 |
| R848 | InvivoGen | Cat# Tlrl-r848 |
| IL-2 | Peprotech | Cat# AF-200-02 |
| IL-21 | Peprotech | Cat# AF-200-21 |
| IFN-g | R&D | Cat# 285-IF |
| Critical commercial assays | ||
| eBioscience Foxp3 Transcription Factor Kit | ThermoFisher | Cat# 00-5523-00 |
| AviTag Kit | Avidity | Cat# BirA-500 |
| RNAeasy Mini Kit | Qiagen | Cat# 74104 |
| Quick RNA Micro Prep Kit | Zymo Research | Cat# R1051 |
| SMART-seq v4 UltraLow Input RNA Kit for Sequencing | Takara | Cat# 634888 |
| NexteraXT DNA library preparation kit | Illumina | Cat# FC-131-1024 |
| EasySep Human B Cell Negative Selection Kit | Stem Cell Technologies | Cat# 17954 |
| Easy Sep Human Pan B Cell Negative Selection Kit | Stem Cell Technologies | Cat# 19554 |
| HiFi Polymerase Mastermix | KAPA Biosystems | Cat# KK2601 |
| Chromium Next GEM Chip G Single Cell Kit 8 rxns | 10XGenomics | Cat# 1000120 |
| Chromium NextGEM Single Cell 3’ GEM, Library and Gel Bead Kit v 3.1 | 10XGenomics | Cat# 1000268 |
| Chromium 3; 5’ Feature Barcode Kit | 10XGenomics | Cat# 1000256 |
| Library Construction Kit | 10XGenomics | Cat# 1000190 |
| Chemiluminescent Substrate for Alkaline Phosphatase | Moss Inc | ChemiAP-RK100 |
| Deposited data | ||
| Super series of all sequencing data | This paper | Accession# GSE222476 |
| Single Cell sequencing data (RNA-seq and VDJ) | This paper | Accession# GSE222888 |
| RNA-seq | This paper | Accession# GSE163989 |
| ATAC-seq | This paper | Accession# GSE203112 |
| BCR seq | This paper | Accession# GSE222474 |
| Experimental models: Cell lines | ||
| FreeStyle 293F Cells | ThermoFisher | Cat# R79007 RRID:CVCL_D603 |
| Experimental models: Organisms/strains | ||
| Oligonucleotides | ||
| Vh1a 5’-CAGGTKCAGCTGGTGCAG-3’ | Tipton et al. Nat Immunol. 2015. | N/A |
| Vh1b 5’SAGGTCCAGCTGGTACAG-3’ | Tipton et al. Nat Immunol. 2015. | N/A |
| Vh1c 5’ CARATGCAGCTGGTGCAG-3’ | Tipton et al. Nat Immunol. 2015. | N/A |
| Vh2, 5’-CAGGTCACCTTGARGGAG-3’ | Tipton et al. Nat Immunol. 2015. | N/A |
| Vh3, 5’GGTCCCTGAGACTCTCCTGT-3’ | Tipton et al. Nat Immunol. 2015. | N/A |
| Vh4, 5’ACCCTGTCCCTCACCTGC-3’ | Tipton et al. Nat Immunol. 2015. | N/A |
| Vh5, 5’GCAGCTGGTGCAGTCTGGAG-3’ | Tipton et al. Nat Immunol. 2015. | N/A |
| Vh6, 5’CAGGACTGGTGAAGCCCTCG-3’ | Tipton et al. Nat Immunol. 2015. | N/A |
| Vh7, 5’CAGGTGCAGCTGGTGCAA-3’ | Tipton et al. Nat Immunol. 2015. | N/A |
| Cm 5’-CAGGAGACGAGGGGGAAAAGG-3’ | Tipton et al. Nat Immunol. 2015. | N/A |
| Cy 5’ CCGATGGGCCCTTGGTGGA-3’ | Tipton et al. Nat Immunol. 2015. | N/A |
| Ca 5’GAAGACCTTGGGGCTGGTCG-3’ | Tipton et al. Nat Immunol. 2015. | N/A |
| F tag, 5’ TCGTCGGCAGCGTCAGATGTGTATAAGAGACAG-3’ | Tipton et al. Nat Immunol. 2015. | N/A |
| R tag, 5’ GTCTCGTGGGCTCGGGATGTGTATAAGAGACAG-3’ | Tipton et al. Nat Immunol. 2015. | N/A |
| Recombinant DNA | ||
| CA09 Influenza HA (H1) | GeneArt | Protein Sequence Accession: NC_026433.1 |
| SW13 Influenza HA (H3) | GeneArt | Protein Sequence Accession: EPI543739 |
| Michigan 15 Influenza HA (H1) | GeneArt | Protein Sequence Accession: MK622940.1 |
| TX50 Influenza HA (H3) | GeneArt | Protein Sequence Accession: KC892952.1 |
| HK2014 Influenza HA (H3) | GeneArt | Protein Sequence Accession: A0A068IXL |
| Software and algorithms | ||
| Flowjo v.9.9.3/10.2 | FlowJo | N/A |
| PRISM 8/9 | GraphPad | N/A |
| Seurat v. 3.2.2 | Butler et al. Nat. Biotech. 2018. |
https://satijalab.org/seurat RRID:SCR_016341 |
| edgeR v3.24.3 | Robinson et al. Bioinformatics. 2010. | https://bioconductor.org/packages/release/bioc/html/edgeR.html |
| SplicingGraphs | Bindreither D et al Bioconductor. 2022. | https://bioconductor.org/packages/SplicingGraphs |
| Bowtie v1.1.1 | Langmead et al. Genome Biology. 2009. |
http://bowtie-bio.scourceforg.net/index.shtml RRID:SCR_005476 |
| HOMER | Heinz et al. Mol Cell. 2010. |
http://homer.ucsd.edu RRID:SCR_010881 |
| MATLAB | Mathworks | RRID:SCR_001622 |
| IMGT/V-quest v3.5.21 | LeFranc et al. Nucleic Acids Research. 2015. | RRID:SCR_010749 |
| R Project for Statistical Computing | R core team (2018). R: A language and environment for statistical computing. R Foundation for Statistical Computing. Vienna, Austria. |
www.R-project.org RRID:SCR_001905 |
| IDEAS Image Data Exploration and Analysis Software | Amnis | RRID:SCR_020142 |
| GSEA | Subramanian, Tamayo et al. PNAS. 102, 15545-15550. |
http://www.broadinstitute.org/gsea/ RRID:SCR_003199 |
| IPA | Qiagen | RRID:SCR_008653 |
| Code for single cell RNA-seq analysis | This paper | 10.5281/zenodo.7668260 |
| Code for bulk BCR-seq analysis | This paper | 10.5281/zenodo.7668260 |
| Code for bulk RNA-seq analysis | This paper | 10.5281/zenodo.7672023 |
| Code for bulk ATAC-seq analysis | This paper | 10.5281/zenodo.7672023 |
| Other | ||
| 2015-2016 Fluzone | Sanofi-Pasteur | National Drug Code: 49281-0396-15 |
| 2016-2017 Fluvirin | Sequiris | National Drug Code: 3332-0014-02 |
| 2017-2018 Fluzone | Sanofi-Pasteur | National Drug Code: 49281-0417-10 |
| 2018-2019 Fluzone | Sanofi-Pasteur | National Drug Code: 49281-0418-10 |
| 2020-2021 Fluzone | Sanofi-Pasteur | National Drug Code: 49281-0420-50 |
| Lymphocyte Separation Medium | Sigma Aldrich | Cat# C-44010 |
| Ammonium Chloride Solution | Stem Cell Technologies | Cat# 07800 |
| HisTrap HP Column | GE Healthcare | Cat# GE17-5247-01 |
EXPERIMENTAL MODEL AND SUBJECT DETAILS
Experimental models and subject details.
The UAB Institutional Review Board approved all human study protocols. Subjects, who self-identified as healthy, were recruited and provided informed consent through the Alabama Vaccine Research Clinic (AVRC). Twenty-seven subjects were recruited into the study across sequential vaccine seasons (2015–2019). The mean age was 30. Fifty-eight percent of these subjects were male and forty-two percent of these subjects were female. Sixty-three percent of these subjects were Caucasian and thirty-seven percent of these subjects were African-American. Subjects received 2015–2016 Fluzone (Sanofi-Pasteur), 2016–2017 Fluvirin (Sequiris), 2017–2018 Fluzone (Sanofi-Pasteur), 2018–2019 Fluzone (Sanofi-Pasteur) or 2020–2021 Fluzone (Sanofi-Pasteur). Blood was drawn on days 0, 7, 14, 21, 28 and 120 days +/− 1 week. The O’Neal Comprehensive Cancer Center Tissue Procurement Shared Facility provided remnant tonsil tissue samples from de-identified patients undergoing routine tonsillectomies.
METHOD DETAILS
Lymphocyte and plasma isolation.
Peripheral blood from human subjects was drawn into K2-EDTA tubes (BD Bioscience). Peripheral blood mononuclear cells (PBMCs) and plasma were isolated by density gradient centrifugation over Lymphocyte Separation Medium (CellGro). Red blood cells were lysed with ammonium chloride solution (StemCell). Plasma and PBMCs were either used immediately or aliquoted and stored at −80°C.
Flow Cytometry.
Single cell suspensions were blocked with 2% human serum and stained with Ab panels described in Table S5. 7AAD or LIVE/DEAD Fixable Dead Cell Stain Kits (Molecular Probes/ThermoFisher) were used to discriminate live cells. To detect HA-specific B cells, cells were treated at 37°C with 0.5U/ml neuraminidase (C. perfringens, Sigma) to remove sialic acid, and were washed, blocked and stained with HA tetramers. Intracellular proteins were detected by staining with Abs specific for cell surface markers, fixing the cells in 10% neutral buffered formalin solution (Sigma), and then staining the permeabilized cells (0.1% IGEPAL (Sigma)) with Abs or fluorochrome-labeled HA tetramers. Stained cells were analyzed using a FACSCanto II (BD Bioscience) or the Attune NxT flow cytometer (Invitrogen, ThermoFisher). FlowJo v9.9.3 or FlowJo v10.2 were used for analysis.
Cell Sorting.
B cell subsets were sort-purified for BCR-seq, RNA-seq, ATAC-seq, rMAb generation, Mitotracker green assays, mTORC1 pS6 assays and in vitro culture experiments with a FACSAria (BD Biosciences) or Melody (BD Biosciences) in the UAB Comprehensive Flow Cytometry Core. Table S5 shows flow panels used for subset sort-purifications.
BCR repertoire library preparation and informatics.
B cell subsets were sorted directly into RLT buffer and snap frozen in LN2. RNA was extracted using the quick start protocol from QIAGEN RNeasy Mini Kit. First strain cDNA synthesis was performed using iScript cDNA synthesis kit (BioRad) and 8 μl of RNA. First round amplification of IgG, IgA, and IgM was performed in 25 μl reaction volume using 4–8 μl cDNA, Platinum PCR SuperMix High Fidelity (Invitrogen), and 1μl gene specific primers (120 nM) of VH1-VH7 FR1 (forward) and Ca, Cu, Cg (reverse) 16. First round PCR conditions were: 95°C for 3 min, 42 cycles of 30s 95°C, 30s 58°C, 30s 72°C, and 72°C for 3 min. PCR products were verified on 1.2% agarose gels and then indexed in a 2nd round PCR reaction using the Nextera Index kit (Illumina). PCR2 conditions for indexing were: 72°C for 3 min, 98°C for 30s and 5 cycles of 98°C for 10s, 63°C for 30s, and 72°C for 3 min. Indexed PCR products were purified with Agencourt AMPure XP beads (Beckman), quantitated by NanoDrop and then pooled into libraries. Libraries were denatured using 0.2N NaOH and quenched with cold HT1 per manufacturer (Illumina) instructions. Denatured libraries were diluted with 20% PhiX (Illumina) as an internal quality control and loaded onto a 600-cycle V3 MiSEQ cartridge (Illumina) for sequencing.
Ig VH sequencing data were processed as described previously16. Briefly, joined paired-end reads were assembled using Fastq-join (https://github.com/ExpressionAnalysis/ea-utils) and quality filtered. Sequences with ≤ 200bp or with low-quality bases (> 0bp with quality scores < 10, or ≥ 5bp with quality scores < 20, or ≥ 15bp with quality scores of 30) were eliminated from further analysis. Overall quality of sequences was assessed using FastQC (https://www.bioinformatics.babraham.ac.uk/projects/fastqc/). Sequences were annotated for isotype and submitted to IMGT/High V-QUEST50 web portal for VH-, JH-gene annotations, alignments and tabulation of mutations. Sequences annotated as “productive” were considered for further analysis. For each donor, sequences (from all B cell subsets) were clustered into lineages based on shared rearrangements (same VH and JH genes, and same HCDR3 length) as well as pairwise HCDR3 nt sequence similarity ≥ 85% (see16 Supplementary Note 1). Mutation frequencies were determined based on non-gap mismatches of expressed sequences relative to their annotated VH germline sequences. Downstream analysis and visualization were performed in Matlab (R2020a, The Mathworks Inc., Natick MA). BCR Rep-seq data, including both raw and selected IMGT output with lineage assignments, can be accessed SuperSeries accession GSE222476 or directly at accession GSE222474.
RNA-seq library preparation and data analyses.
B cell subsets were sorted directly into RLT buffer (Qiagen) with 1% mercaptoethanol and then snap-frozen in LN2. RNA was extracted using the QuickRNA Micro Prep Kit (Zymo) and cDNA was prepared using SMART-seq v4 cDNA synthesis kit (Takara). Sequencing libraries were constructed using 200 pg cDNA as input for the NexteraXT kit with NexteraXT indexing primers (Illumina). Libraries were quality assessed, pooled and sequenced using 75 bp paired-end chemistry on a NextSeq500 at the UAB Helfin Genomics Core. Sequencing reads were mapped to the hg38 version of the human genome using STAR51 with the default settings and the UCSC KnownGene table as a reference transcriptome. Reads overlapping exons were tabulated using the GenomicRanges52 package in R/Bioconductor. Genes expressed at 3 reads per million or more in all samples from one group were considered detected and used as input for edgeR v3.24.353 to identify DEG. P-values were FDR corrected using the Benjamin-Hochberg method54 with genes of an FDR <0.05 and a FC >1 or <−1 log(2) considered significant. Expression data was normalized to reads per kilobase per million mapped reads (RPKM). Samples included either four (D14 timepoint) or six (D7 timepoint) biological replicates per B cell subset. Principal component analysis was performed using the vegan package v2.5.6. Gene set enrichment analyses (GSEA) were performed by taking the ranked list (ranked by multiplying the −log10 of the P-value from edgeR by the sign of the FC) of detected genes in the RNA-seq datasets and as input in the GSEA55 PreRanked analysis program (http://software.broadinstitute.org/gsea/index.jsp). Gene lists evaluated by GSEA include mSigDB curated Gene Ontogeny (GO) terms26 version 7.0, collection C5 and selected gene sets provided in Table S2. Ig Transcript and Splicing Analysis. The locations of Ig gene segments were downloaded from IMGT for the hg38 genome and reads that overlapped each segment was calculated and RPKM normalized using the GenomicRanges52 package in R v3.6.3. To determine the reads that mapped to the membrane or secretory specific Ig exons, a splice graph was constructed using the Ensemble hg38 transcriptome v105 and the SplicingGraphs (https://bioconductor.org/packages/SplicingGraphs) package in R v4.1.0. For each sample, the reads spanning the exon junctions between common and secreted exons or between common and membrane bound exons for all IGHG isotypes were calculated, normalized to total unique reads, and the ratio of membrane versus secreted was computed. All RNA-seq data is available from the GEO database under the accession GSE163989 and SuperSeries accession GSE222476. See also Table S2.
Identification of signaling and metabolism transcription modules in effector Bmem cells.
GSEA was performed comparing the ranked gene list of D7 post-vaccine IgDneg H1-specific FcRL5+ and FcRL5neg Bmem cell subsets to 3931 GO terms (mSigDB version 7.0, collection C5). Enriched gene sets with an FDR q-value < 0.01 were identified (See Table S2). A distance matrix was constructed based on 1 - Jaccard index of the constituent leading-edge genes of pairs of these enriched terms and was used for classical multidimensional scaling to visualize the terms in three-dimensional space. Terms were grouped in clusters (k-means clustering with n=9 as specified by the gap statistic56) using Matlab’s evalcluster function. Leading-edge genes from the GO lists present in each cluster were compared and 11 prototypic gene lists with the most similarity to other gene lists (i.e. largest number of shared leading-edge genes) within the cluster were selected (Table S2) for further analysis. The known properties of the proteins encoded by the leading-edge genes from each of the 11 prototypic GO lists were manually curated and the genes were grouped into 14 modules (Table S2) based on the reported functional and metabolic properties of proteins encoded by these genes. The module assignments were independently validated using publicly available data sets (Table S2) for the relevant metabolic pathways.
ATAC-seq preparation and analyses.
B cell subsets were enriched from PBMCs (EasySep™ Human B Cell Negative Selection Kit), sort-purified, re-suspended in 25 μl of tagmentation reaction buffer (2.5 μl Tn5, 1xTagment DNA Buffer, 0.02% Digitonin, 0.01% Tween-20) and incubated for 1hr at 37°C. Cells were lysed with 25 μl 2x Lysis Buffer (300 mM NaCl, 100 mM EDTA, 0.6% SDS, 1.6 μg Proteinase-K) for 30 min at 40°C. Low molecular weight DNA was purified by size-selection with SPRI-beads (Agencourt), and PCR amplified using Nextera primers with 2x HiFi Polymerase Master Mix (KAPA Biosystems). Amplified, low molecular weight DNA was isolated using SPRI-bead size selection. Libraries were quality assessed and sequenced using a 75bp paired end run on a NextSeq500 at the UAB Heflin Genomics Center. Raw sequencing reads were mapped to the hg38 version of the human genome using Bowtie57 (v1.1.1) with the default settings. Duplicate reads were annotated using the Picard Tools MarkDuplicates function (http://broadinstitute.github.io/picard/) and eliminated from downstream analysis. Enriched peaks were identified using MACS2 v2.1.0.2014061) with the default settings58. Genomic and motif annotations were determined for ATAC-seq peaks using the HOMER59 (v4.10) annotatePeaks.pl script. Read counts for all peaks were annotated for each sample from the bam file using the GenomicRanges52 R/Bioconductor package and normalized to Reads Per Peak Per Million (RPPM)60. Differential accessible regions/peaks (DAR) were determined using edgeR v3.24.353 and P-values were FDR corrected using the Benjamin-Hochberg method54. Peaks with a >1 or <−1 log(2) FC and FDR < 0.05 between comparisons were termed significant. IRF4 target accessibility was computed by taking the mean peak accessibility for all peaks that mapped to genes derived from the Shaffer IRF4_Up in PCs dataset18.
T-bet Motif and ChIP-seq Analysis.
T-bet motifs in accessible regions were annotated using HOMER and annotatePeaks.pl [DAR peak file] hg38 -size given -noann -m tbx21.motif -mbed [tbx21.motifs.bed]. The resulting bed file was used as input to calculate the RPPM normalized accessibility in the 50bp surrounding each motif for the indicated samples. T-bet ChIP-seq data from GM12878 cells was downloaded from the GEO database under accession GSE9202025. The overlap of chromatin accessibility at T-bet peaks was calculated using the GSE92020_ENCFF971VHK_optimal_idr_thresholded_peaks_GRCh38.bed file as described above. All ATAC-seq data is available from the NCBI Gene Expression Omnibus (GEO) database under the accession GSE203112 and the SuperSeries accession GSE222476. See also Table S3.
PageRank (PR) Analysis.
PR analysis was performed using the D7 or D14 RNA-seq and ATAC-seq data sets from each subset as previously described19. TFs with a PR statistic greater than 0.001 in any cell type were considered for downstream analysis. The log2FC in PR statistic between subsets was calculated for each TF. See also Table S2.
Single Cell RNA-library preparation and sequencing.
Two subjects were enrolled for serial weekly blood draws one week after IIV. B cells were negative selected using column purification (EasySep Pan-B cell purification kit, StemCell Technologies), treated with neuraminidase, stained with HA tetramers, fluorophore-labeled Abs, and anti-FcRL5 Ab conjugated with TotalSeq C oligomer hashtags (Table S4). HA-specific IgDneg CD38lo/med cells were sort-purified as described in Table S5 and bar coded. Single cell suspensions were applied to the 10XGenomics workflow for cell capture, scRNA gene expression (GEX), BCR and Feature Barcoding library preparation using the Chromium Single Cell 5’ Library and Gel Bead Kit (Nest GEM 5’ Kit v 1.1) as well as the Single Cell 5’ Feature Barcode Library Kit (10XGenomics), following manufacturer’s instructions.
Single-cell transcriptome and repertoire profiling.
Raw sequence reads were processed using CellRanger (version 5.0.0 and 5.0.1). The multi pipeline with default parameter settings was used for demultiplexing and quantifying gene expression and assembly of BCR sequences. Reference datasets used for GEX and VDJ annotation included refdata-gex-GRCh38–2020-A and refdata-cellranger-vdj-GRCh38-alts-ensembl-5.0.0 respectively (10x Genomics). Cellranger output was analyzed in R (version 3.6.3) using Seurat61 package (version 3.2.2). Cellranger count data of the two enrolled subjects were normalized, transformed and variable genes were detected with uniform manifold approximation and projection (UMAP) performed in default parameter settings, using SCTransform, RunPCA and RunUMAP with 30 principal components. Transcriptionally similar clusters were identified with shared nearest neighbor (SNN) modularity optimization with a resolution of 0.8. High confidence VH consensus sequences were analyzed using IMGT High-Vquest (version 3.5.21; reference release 202049–2) to retrieve VDJ annotation and nucleotide CDR3 sequence. Corresponding VDJ sequence annotation data was mapped back to known GEX barcode data for further analysis in Seurat. GSEA on single cell data was performed using the parameters 0.1 min pct, padj <0.05. scRNA-seq data can be accessed via SuperSeries accession GSE222476 or directly via accession GSE222888.
B cell in vitro stimulation.
Tonsil B cell subsets were sort-purified as described in Table S5 and stained for 10 min at 37°C with PBS diluted CellTrace™ Violet (Molecular Probes, Thermofisher). Labeled cells (0.5×10⁶ cells/mL) were cultured for 2–3 days with 5 μg/mL R848 (InvivoGen), 50 U/mL IL-2 (Peprotech), 50 ng/mL IL-21 (Peprotech) and 20 ng/ml IFNγ (R&D) and analyzed.
HA ELISAs.
Plasma from vaccinated samples were serially diluted on EIA/RIA ELISA plates (Costar) that were previously coated with recombinant HA. HA-specific IgG Abs from the samples were detected using HRP-conjugated anti-human IgG secondary Abs (Jackson ImmunoResearch) and were developed using ABTS with acid stop. Absorbance was measured at 415nm using a SpectraMaxM2 (Molecular Devices). All samples were tested against the same reference standard and 50% endpoint titers were determined.
Metabolism assays.
Sort-purified B cell subsets (Table S5) were incubated for 15 min at 37°C with 2ng/mL of Mitrotracker Green (Invitrogen), washed in PBS and immediately analyzed or were fixed in 10% neutral buffered formalin (Sigma), permeabilized in 0.1% IGEPAL (Sigma) and stained with anti-pS6 Ab (Cell Signaling Technology). In other experiments cell, tonsil B cells were surface stained, washed and then incubated with either 2 ng/mL of H2DFCDA (Invitrogen) for 20 min at 4°C or with 5 ng/mL of BODIPY 500/510 (Invitrogen). Cells were washed with PBS and immediately analyzed.
ImageStream.
CD19+ cells were enriched (EasySep™ human B cell negative selection kit) from HD PBMCs collected D7 post-IIV. Cells were stained with APC-conjugated H1 tetramer and Abs for IgD, CD38 and CD19 for 20 min at 4°C and then fixed 10% neutral buffered formalin (Sigma). Cells were permeabilized with 0.1% IGEPAL (Sigma) in the presence of PE-conjugated H1 tetramer and anti-T-bet Ab. Cells were analyzed using ImageStreamXMarkII (Luminex) and IDEAS software. Cells were gated on in-focus singlets. The intensity mask feature was used to acquire the intensity of extracelluar H1 tetramer and intracellular H1 tetramer staining in various B cell subsets. Single cell images were exported from IDEAS software as TIFF files with direct import into CANVAS for equivalent and proportional reduction. Final images are presented as 600 dpi.
Recombinant influenza HA protein production.
The coding sequences (amino acids 18–524) of influenza HA ectodomains were synthesized (GeneArt, Regensburg, Germany) from the following influenza virus strains: A/California/VRDL7/2009 (CA09-H1), A/Switzerland/9715293/2013 (SW13-H3), A/Hong Kong/4801/2014 (HK14-H3), and A/Michigan/45/2015 (MI15-H1). As previously described62, HA ectodomains were cloned into the pCXpoly(+) vector that was modified with a 5’ human CD5 signal sequence and a 3’ GCN4 isoleucine zipper trimerization domain (GeneArt) that was followed by either a 6XHIS tag (HA-6XHIS construct) or an AviTag (HA-AviTag construct). The HA–6XHIS and HA–AviTag constructs for each HA were co–transfected using 293Fectin Transfection Reagent into FreeStyle™ 293–F Cells (ThermoFisher Scientific) at a 2:1 ratio, respectively. Transfected cells were cultured in FreeStyle 293 Expression Medium for 3 days and the supernatant was recovered by centrifugation. Recombinant HA molecules were purified by FPLC using a HisTrap HP Column (GE Healthcare) and eluted with 250 mM imidazole.
Generation of HA tetramers and HA cytometric bead arrays.
Recombinant HA trimers were biotinylated by addition of biotin–protein ligase (Avidity). To generate HA tetramers, biotinylated HA trimers were tetramerized with fluorochrome–labeled streptavidin (Prozyme). Labeled tetramers were purified by size exclusion on a HiPrep 16/60 Sephacryl S–300 column (GE Healthcare). To generate cytometric bead arrays (CBA), carboxy functionalized blue particle array beads (Spherotech) were directly conjugated with streptavidin (Southern Biotech) following manufacturer’s protocol. Biotinylated HA tetramers were passively absorbed onto CBA particles by mixing a 5-fold excess of particle binding capacity (100 μg) of biotinylated HA with 2 × 10⁷ Spherotech beads in 400 μl of PBS with 1%BSA. Labeled microparticles were separated by centrifugation at 3000g for 5min. HA-trimer conjugated beads were washed twice in 1ml of 1% BSA, PBS, 0.05% NaN3, resuspended at 1 × 10⁸ beads/mL and stored at 4°C. IgG capture beads were generated by the direct conjugation of goat anti-Human IgG F(ab)2 (Southern Biotech) to array particles (Spherotech) following manufacturer’s protocol for direct labeling. Briefly, 2 × 10⁷ particles were pelleted by centrifugation and resuspended in 200 μl of anti-human IgG. An equal volume of EDC (1-Ethyl-3-(3-dimethylaminopropyl)-carbodiimide), 6mg/mL, in 0.1 M MES (2-(N-morpholino) ethanesulfonic acid) buffer pH 5.0 was added and the mixture was rotated overnight at RT. Beads were washed twice by pelleting by centrifugation and resuspension in PBS. Following washing, beads were resuspended in 1% BSA in PBS with 0.005% NaN3 as a preservative.
BCR Cloning and screening of recombinant Abs.
B cell subsets were index-sorted (Table S5) and deposited as single cells into hypotonic lysis buffer in 384 well plates that were stored at −80°C. cDNA was generated using high-capacity cDNA generation kit (Roche). PCR amplicons, using forward and reverse primers specific for the amino terminus of the mature IGHV, IGKV, and IGLV proteins (Table S1), were cloned into pEGFP expression vectors that were modified to express the constant regions of human IgG1, IgKappa, or IgLambda. Plasmids encoding Ig heavy and light chain pairs were co-transfected using Polyethylenimine into 293FreeStyle cells (Invitrogen). Supernatants were assayed for secreted rAb and for HA reactivity using the HA CBA described above. The MFI of rAb binding to each HA Ag in the bead array was measured by flow cytometry (BD LSRII) and normalized for Ig by dividing the HA binding MFI by the MFI of binding to the anti-IgG capture beads (see Table S5).
Biacore Studies.
The KD of recombinant monoclonal human Abs (rmAbs) specific for HA were determined using a T200 Biacore (GE healthcare) biosensor instrument equipped with a research grade Series S Sensor Chip SA (GE healthcare). Biotinylated recombinant CA09-H1, PR8-H1, and MI15-H1 were immobilized on the sensor following manufacturer’s protocol. Binding kinetics of rmAbs were determined by monitoring association of Abs at concentrations ranging from 31.25nM to 500nM in PBS pH 7.4 for 120s then the dissociation for 600s at a flow rate of 30μl/min at 25°C. Binding surfaces were regenerated by a 60s injection of 3M MgCl. KD values were derived from at least five concentrations in two-fold dilution series, globally fit into a 1:1 Langmuir binding model using Biacore T200 BIA Evaluation Version 1 software.
QUANTIFICATION AND STATISTICAL ANALYSES
Statistical Analyses.
Comparisons between two groups were performed with the Wilcoxson matched pairs signed rank test for non-normally distributed variables. Two-tailed t-testing was used to compare mean RPPM values for cumulative genes in the Shaffer UP in IRF4 gene set and for T-bet ChIP-seq and T-bet motif comparisons. The one-way ANOVA test was used to compare mean values of three or more groups and either the Dunn’s or Tukey’s multiple comparisons test was used to compare medians. Strength and direction of association between two variables measures was performed using the D’Agostino-Pearson normality test followed by or Spearman correlation test. Data were considered significant when P ≤ 0.05. GraphPad Prism version 7.0a or 8.0 software was used for analysis.
Other bioinformatics analyses and visualizations.
Hierarchical clustering, PCA, heatmap plots and other visualizations were created using Matlab (R2020a, The Mathworks Inc., Natick MA) or R v3.5.2.
Supplementary Material
Supplemental Table S1. BCR repertoire data from sorted B cell subsets following vaccination, related to Figures 1, 3, 7, and S1. Tab 1–3 delineates BCR repertoire data acquired from (n=3) IIV immunized HD (Donors 1–3). Tab 1 reports isotype distribution. Tab 2 reports mutation rates. Tab 3 reports BCR lineages from different B cell subsets within each Donor. Tab 4 shows % shared clones (Bmem cell subsets in Y1 to PBs in Y2) from Donors 1–3. The ratio of sharing for each Donor was determined as: the % clones shared between Y1 FcRL5+ Bmem cells and Y2 PB divided by the % clones shared between Y1 FcRL5neg Bmem cells and Y2 PB. Statistical significance was determined using a one-sample t-test (mean of 1) p=0.058. Tab 5 shows the primers used to amplify the heavy and light chain of single sorted cells for recombinant monoclonal Ab generation.
Supplemental Table S2. RNA-seq data set from sort-purified B cell subsets D7 and D14 days after influenza vaccination, related to Figures 2–6, S2–S3 and S5. Tab 1: RNA-seq analysis of sort-purified B cell subsets isolated from the peripheral blood of HD on D7 (n=6 donors) or D14 (n=4 donors) post-IIV. Data reported as RPKM values for each gene. Log(2)FC, p values and FDR values provided for each B cell subset pairwise comparison.
Tab 2: Description of all gene sets used for GSEA including the source of the gene sets and the list of genes in each set.
Tab 3: D7 and D14 RNA-seq (Table S2 Tab 1) and ATAC-seq (Table S3 Tab 1) data derived from D7 PB, and H1+ IgDneg FcRL5+ and FcRL5neg Bmem cell subsets (D7 and D14) were analyzed using the PR algorithm to identify TFs predicted to regulate the transcriptional networks in each B cell subset. Data are reported as PR scores for TFs in each subset and as FClog(2) in PR scores between different B cell subsets.
Tab 4: DEG from D14 H1+ IgDneg FcRL5+ and FcRL5neg Bmem cell RNA-seq datasets (derived from Table S2 Tab 1) and published datasets in Lau et al14 (See Table S2 Tab 2 for lists) are displayed. Genes are reported as significant (1) or not significant (0) in the comparator gene set.
Tab 5: GSEA comparison of the ranked gene list of D7 post-vaccine H1-specific IgDneg FcRL5+ and FcRL5neg Bmem cell subsets to 3931 GO terms. Identification of 185 positively enriched gene sets with an FDR q-value < 0.01. Yellow highlight indicates each of the 11 prototypic gene lists used in the metabolic analyses.
Tabs 6–14: Nine clusters of gene sets with overlapping leading-edge genes were identified. Leading edge-genes for each gene list in each cluster are reported as present (1) or absent (0). Prototypic gene lists for each cluster are highlighted in yellow.
Tab 15: Functional descriptions for proteins encoded by leading-edge genes from 11 prototypic gene sets (see Table S2 Tab 6–15) were curated and each gene was assigned to a functional module (n=14 modules). Table shows gene set origin of each leading-edge gene and assignment of leading-edge genes into the different modules.
Supplemental Table S3. ATAC-seq dataset from sort-purified B cell subsets D7 and D14 after influenza vaccination, related to Figures 2, 4, and S2.
Tab 1: ATAC-seq analysis of sort-purified B cell subsets isolated from the peripheral blood of HD on D7 (n=5 donors) or D14 (n=4 donors) post-IIV. Data reported as RPPM values for each DAR. Log(2)FC, p values, and FDR values provided for each B cell subset pairwise comparison.
Tab 2: Intersection of the DEG (Table S2, Tab 1) and DAR (Table S3, Tab 1) between D7 FcRL5+ and FcRL5neg Bmem cells (111 unique genes assigned to 154 DAR). DAR with consensus T-bet binding motifs or containing known ChIP-seq assigned T-bet binding sites25 are indicated. Gene annotation and putative functions are provided.
Supplemental Table S4. Single cell sequencing data, related to Figure 2.
Transcriptional data from single cell sorted HA-specific B cells within one month of vaccination from N=2 HDs. Table outlining mutation frequencies (Tab 1), cells with TBX21 expression (Tab 2), FcRL5 expression (Tab 3), unique DEGs within clusters (Tab 4), GSEA statistics (Tab 5) and oligomer hashtags (Tab 6) used.
Supplemental Table S5. Sort Panels and BCR reactivity data from D7 IgDneg CA09-H1-specific FcRL5+ and FcRL5neg Bmem cells, related to Star Methods.
Tab 1: Flow panels for various flow sort purifications of B cell subsets outlined.
Tab 2: Single CA09-H1-specific IgDneg B cells from D7 post-IIV (2017) HD were index-sorted and identified as either FcRL5+ (n=202 cells) or FcRL5neg (n=68 cells). Recombinant IgG1 monoclonal Abs (rmAb) from sorted single cells were screened for binding to recombinant H1 Ags arrayed on cytometric beads (CBA assay). Binding reactivities for each rmAb to CA09-H1, MI15-H1, and PR8-H1 Ags reported as normalized gMFI.
Supplemental Figures and Legends
Highlights.
FcRL5+T-bet+ memory B cells are molecularly programmed for effector function
FcRL5+ T-bet+ memory B cells are metabolically poised to form antibody-secreting cells
FcRL5+ T-bet+ memory B cells predict long-lived antibody responses to flu vaccination
Acknowledgements:
We thank the Alabama Vaccine Research Clinic and Pamela Cunningham, Heather Logan, Aeryn Peck, Catrena Johnson and Megan Oelschig for recruiting and consenting subjects. We thank Vidyasagar Hanumanthu, Director of the UAB Flow Core Facility, Dr. Michael Crowley, Director of the UAB Heflin Genomics Core, and Drs. Randall Davis and Edlue Tabengwa, Directors of the UAB Multidisciplinary Molecular Interaction Core for all their assistance with these studies. We are grateful to Dr. Amy S. Weinmann for her thoughtful commentary. Funding for the work was provided by the US National Institutes of Health (NIH): P01 AI125180 (I.S., F.E.L, J.M.B, C.D.S, E.Z.), U19 AI 109962 (F.E.L, T.D.R) and U19AI142737 (F.E.L., T.D.R., A.N., R.D.K., A.R.) A.N. received salary support from R21 AI152006, pilot grant support from the UAB AMC21 Immunology Autoimmunity and Transplantation Strategic Initiative and funding from the UAB CCTS (UL1 TR001417). C.D.S. received salary support from R01 AI148471. NIH P30 AR048311 and P30 AI027767 provided support for the UAB Consolidated Flow Cytometry Core and NIH P30CA13148 provided support for the O’Neal Comprehensive Cancer Center Tissue Procurement Facility.
Footnotes
Declarations of Interest
The authors declare no competing interests.
Inclusion and Diversity
We support inclusive, diverse, and equitable conduct of research.
Publisher's Disclaimer: This is a PDF file of an unedited manuscript that has been accepted for publication. As a service to our customers we are providing this early version of the manuscript. The manuscript will undergo copyediting, typesetting, and review of the resulting proof before it is published in its final form. Please note that during the production process errors may be discovered which could affect the content, and all legal disclaimers that apply to the journal pertain.
References
- 1.Andrews SF, Huang Y, Kaur K, Popova LI, Ho IY, Pauli NT, Henry Dunand CJ, Taylor WM, Lim S, Huang M, et al. (2015). Immune history profoundly affects broadly protective B cell responses to influenza. Sci Transl Med 7, 316ra192. 10.1126/scitranslmed.aad0522. [DOI] [PMC free article] [PubMed] [Google Scholar]
- 2.Turner JS, Zhou JQ, Han J, Schmitz AJ, Rizk AA, Alsoussi WB, Lei T, Amor M, McIntire KM, Meade P, et al. (2020). Human germinal centres engage memory and naive B cells after influenza vaccination. Nature 586, 127–132. 10.1038/s41586-020-2711-0. [DOI] [PMC free article] [PubMed] [Google Scholar]
- 3.Lee FE, Halliley JL, Walsh EE, Moscatiello AP, Kmush BL, Falsey AR, Randall TD, Kaminiski DA, Miller RK, and Sanz I (2011). Circulating human antibody-secreting cells during vaccinations and respiratory viral infections are characterized by high specificity and lack of bystander effect. J Immunol 186, 5514–5521. 10.4049/jimmunol.1002932. [DOI] [PMC free article] [PubMed] [Google Scholar]
- 4.Laidlaw BJ, and Cyster JG (2020). Transcriptional regulation of memory B cell differentiation. Nat Rev Immunol. 10.1038/s41577-020-00446-2. [DOI] [PMC free article] [PubMed] [Google Scholar]
- 5.Yao C, Lou G, Sun HW, Zhu Z, Sun Y, Chen Z, Chauss D, Moseman EA, Cheng J, D’Antonio MA, et al. (2021). BACH2 enforces the transcriptional and epigenetic programs of stem-like CD8(+) T cells. Nat Immunol. 10.1038/s41590-021-00868-7. [DOI] [PMC free article] [PubMed] [Google Scholar]
- 6.Pais Ferreira D, Silva JG, Wyss T, Fuertes Marraco SA, Scarpellino L, Charmoy M, Maas R, Siddiqui I, Tang L, Joyce JA, et al. (2020). Central memory CD8(+) T cells derive from stem-like Tcf7(hi) effector cells in the absence of cytotoxic differentiation. Immunity 53, 985–1000 e1011. 10.1016/j.immuni.2020.09.005. [DOI] [PubMed] [Google Scholar]
- 7.Kurachi M, Barnitz RA, Yosef N, Odorizzi PM, DiIorio MA, Lemieux ME, Yates K, Godec J, Klatt MG, Regev A, et al. (2014). The transcription factor BATF operates as an essential differentiation checkpoint in early effector CD8+ T cells. Nat Immunol 15, 373–383. 10.1038/ni.2834. [DOI] [PMC free article] [PubMed] [Google Scholar]
- 8.Kallies A, and Good-Jacobson KL (2017). Transcription Factor T-bet Orchestrates Lineage Development and Function in the Immune System. Trends Immunol 38, 287–297. 10.1016/j.it.2017.02.003. [DOI] [PubMed] [Google Scholar]
- 9.Shinnakasu R, Inoue T, Kometani K, Moriyama S, Adachi Y, Nakayama M, Takahashi Y, Fukuyama H, Okada T, and Kurosaki T (2016). Regulated selection of germinal-center cells into the memory B cell compartment. Nat Immunol 17, 861–869. 10.1038/ni.3460. [DOI] [PubMed] [Google Scholar]
- 10.Kometani K, Nakagawa R, Shinnakasu R, Kaji T, Rybouchkin A, Moriyama S, Furukawa K, Koseki H, Takemori T, and Kurosaki T (2013). Repression of the transcription factor Bach2 contributes to predisposition of IgG1 memory B cells toward plasma cell differentiation. Immunity 39, 136–147. 10.1016/j.immuni.2013.06.011. [DOI] [PubMed] [Google Scholar]
- 11.Igarashi K, Ochiai K, Itoh-Nakadai A, and Muto A (2014). Orchestration of plasma cell differentiation by Bach2 and its gene regulatory network. Immunol Rev 261, 116–125. 10.1111/imr.12201. [DOI] [PubMed] [Google Scholar]
- 12.Stone SL, Peel JN, Scharer CD, Risley CA, Chisolm DA, Schultz MD, Yu B, Ballesteros-Tato A, Wojciechowski W, Mousseau B, et al. (2019). T-bet Transcription Factor Promotes Antibody-Secreting Cell Differentiation by Limiting the Inflammatory Effects of IFN-gamma on B Cells. Immunity. 10.1016/j.immuni.2019.04.004. [DOI] [PMC free article] [PubMed] [Google Scholar]
- 13.Andrews SF, Chambers MJ, Schramm CA, Plyler J, Raab JE, Kanekiyo M, Gillespie RA, Ransier A, Darko S, Hu J, et al. (2019). Activation Dynamics and Immunoglobulin Evolution of Pre-existing and Newly Generated Human Memory B cell Responses to Influenza Hemagglutinin. Immunity 51, 398–410 e395. 10.1016/j.immuni.2019.06.024. [DOI] [PubMed] [Google Scholar]
- 14.Lau D, Lan LY, Andrews SF, Henry C, Rojas KT, Neu KE, Huang M, Huang Y, DeKosky B, Palm AE, et al. (2017). Low CD21 expression defines a population of recent germinal center graduates primed for plasma cell differentiation. Sci Immunol 2. 10.1126/sciimmunol.aai8153. [DOI] [PMC free article] [PubMed] [Google Scholar]
- 15.Ellebedy AH, Jackson KJ, Kissick HT, Nakaya HI, Davis CW, Roskin KM, McElroy AK, Oshansky CM, Elbein R, Thomas S, et al. (2016). Defining antigen-specific plasmablast and memory B cell subsets in human blood after viral infection or vaccination. Nat Immunol 17, 1226–1234. 10.1038/ni.3533. [DOI] [PMC free article] [PubMed] [Google Scholar]
- 16.Tipton CM, Fucile CF, Darce J, Chida A, Ichikawa T, Gregoretti I, Schieferl S, Hom J, Jenks S, Feldman RJ, et al. (2015). Diversity, cellular origin and autoreactivity of antibody-secreting cell population expansions in acute systemic lupus erythematosus. Nat Immunol 16, 755–765. 10.1038/ni.3175. [DOI] [PMC free article] [PubMed] [Google Scholar]
- 17.Oestreich KJ, and Weinmann AS (2012). T-bet employs diverse regulatory mechanisms to repress transcription. Trends Immunol 33, 78–83. 10.1016/j.it.2011.10.005. [DOI] [PMC free article] [PubMed] [Google Scholar]
- 18.Shaffer AL, Emre NC, Lamy L, Ngo VN, Wright G, Xiao W, Powell J, Dave S, Yu X, Zhao H, et al. (2008). IRF4 addiction in multiple myeloma. Nature 454, 226–231. 10.1038/nature07064. [DOI] [PMC free article] [PubMed] [Google Scholar]
- 19.Yu B, Zhang K, Milner JJ, Toma C, Chen R, Scott-Browne JP, Pereira RM, Crotty S, Chang JT, Pipkin ME, et al. (2017). Epigenetic landscapes reveal transcription factors that regulate CD8(+) T cell differentiation. Nat Immunol 18, 573–582. 10.1038/ni.3706. [DOI] [PMC free article] [PubMed] [Google Scholar]
- 20.Lazarevic V, Glimcher LH, and Lord GM (2013). T-bet: a bridge between innate and adaptive immunity. Nat Rev Immunol 13, 777–789. 10.1038/nri3536. [DOI] [PMC free article] [PubMed] [Google Scholar]
- 21.Omilusik KD, and Goldrath AW (2019). Remembering to remember: T cell memory maintenance and plasticity. Curr Opin Immunol 58, 89–97. 10.1016/j.coi.2019.04.009. [DOI] [PMC free article] [PubMed] [Google Scholar]
- 22.Kaech SM, Hemby S, Kersh E, and Ahmed R (2002). Molecular and functional profiling of memory CD8 T cell differentiation. Cell 111, 837–851. 10.1016/s0092-8674(02)01139-x. [DOI] [PubMed] [Google Scholar]
- 23.Luckey CJ, Bhattacharya D, Goldrath AW, Weissman IL, Benoist C, and Mathis D (2006). Memory T and memory B cells share a transcriptional program of self-renewal with long-term hematopoietic stem cells. Proc Natl Acad Sci U S A 103, 3304–3309. 10.1073/pnas.0511137103. [DOI] [PMC free article] [PubMed] [Google Scholar]
- 24.Zhou X, and Xue HH (2012). Cutting edge: generation of memory precursors and functional memory CD8+ T cells depends on T cell factor-1 and lymphoid enhancer-binding factor-1. J Immunol 189, 2722–2726. 10.4049/jimmunol.1201150. [DOI] [PMC free article] [PubMed] [Google Scholar]
- 25.Consortium EP (2012). An integrated encyclopedia of DNA elements in the human genome. Nature 489, 57–74. 10.1038/nature11247. [DOI] [PMC free article] [PubMed] [Google Scholar]
- 26.Liberzon A, Subramanian A, Pinchback R, Thorvaldsdottir H, Tamayo P, and Mesirov JP (2011). Molecular signatures database (MSigDB) 3.0. Bioinformatics 27, 1739–1740. 10.1093/bioinformatics/btr260. [DOI] [PMC free article] [PubMed] [Google Scholar]
- 27.Bertolotti M, Sitia R, and Rubartelli A (2012). On the redox control of B lymphocyte differentiation and function. Antioxid Redox Signal 16, 1139–1149. 10.1089/ars.2011.4252. [DOI] [PubMed] [Google Scholar]
- 28.Oikonomou C, and Hendershot LM (2020). Disposing of misfolded ER proteins: A troubled substrate’s way out of the ER. Mol Cell Endocrinol 500, 110630. 10.1016/j.mce.2019.110630. [DOI] [PMC free article] [PubMed] [Google Scholar]
- 29.Li H, Borrego F, Nagata S, and Tolnay M (2016). Fc Receptor-like 5 Expression Distinguishes Two Distinct Subsets of Human Circulating Tissue-like Memory B Cells. J Immunol 196, 4064–4074. 10.4049/jimmunol.1501027. [DOI] [PubMed] [Google Scholar]
- 30.van Anken E, Romijn EP, Maggioni C, Mezghrani A, Sitia R, Braakman I, and Heck AJ (2003). Sequential waves of functionally related proteins are expressed when B cells prepare for antibody secretion. Immunity 18, 243–253. 10.1016/s1074-7613(03)00024-4. [DOI] [PubMed] [Google Scholar]
- 31.Price MJ, Patterson DG, Scharer CD, and Boss JM (2018). Progressive Upregulation of Oxidative Metabolism Facilitates Plasmablast Differentiation to a T-Independent Antigen. Cell Rep 23, 3152–3159. 10.1016/j.celrep.2018.05.053. [DOI] [PMC free article] [PubMed] [Google Scholar]
- 32.Benhamron S, Pattanayak SP, Berger M, and Tirosh B (2015). mTOR activation promotes plasma cell differentiation and bypasses XBP-1 for immunoglobulin secretion. Mol Cell Biol 35, 153–166. 10.1128/MCB.01187-14. [DOI] [PMC free article] [PubMed] [Google Scholar]
- 33.Pengo N, Scolari M, Oliva L, Milan E, Mainoldi F, Raimondi A, Fagioli C, Merlini A, Mariani E, Pasqualetto E, et al. (2013). Plasma cells require autophagy for sustainable immunoglobulin production. Nat Immunol 14, 298–305. 10.1038/ni.2524. [DOI] [PubMed] [Google Scholar]
- 34.Jenks SA, Cashman KS, Zumaquero E, Marigorta UM, Patel AV, Wang X, Tomar D, Woodruff MC, Simon Z, Bugrovsky R, et al. (2018). Distinct Effector B Cells Induced by Unregulated Toll-like Receptor 7 Contribute to Pathogenic Responses in Systemic Lupus Erythematosus. Immunity 49, 725–739 e726. 10.1016/j.immuni.2018.08.015. [DOI] [PMC free article] [PubMed] [Google Scholar]
- 35.Gaudette BT, Jones DD, Bortnick A, Argon Y, and Allman D (2020). mTORC1 coordinates an immediate unfolded protein response-related transcriptome in activated B cells preceding antibody secretion. Nat Commun 11, 723. 10.1038/s41467-019-14032-1. [DOI] [PMC free article] [PubMed] [Google Scholar]
- 36.Woodland DL, and Kohlmeier JE (2009). Migration, maintenance and recall of memory T cells in peripheral tissues. Nat Rev Immunol 9, 153–161. 10.1038/nri2496. [DOI] [PubMed] [Google Scholar]
- 37.Wrammert J, Smith K, Miller J, Langley WA, Kokko K, Larsen C, Zheng NY, Mays I, Garman L, Helms C, et al. (2008). Rapid cloning of high-affinity human monoclonal antibodies against influenza virus. Nature 453, 667–671. 10.1038/nature06890. [DOI] [PMC free article] [PubMed] [Google Scholar]
- 38.Kim CC, Baccarella AM, Bayat A, Pepper M, and Fontana MF (2019). FCRL5(+) Memory B Cells Exhibit Robust Recall Responses. Cell Rep 27, 1446–1460 e1444. 10.1016/j.celrep.2019.04.019. [DOI] [PMC free article] [PubMed] [Google Scholar]
- 39.Buck MD, Sowell RT, Kaech SM, and Pearce EL (2017). Metabolic Instruction of Immunity. Cell 169, 570–586. 10.1016/j.cell.2017.04.004. [DOI] [PMC free article] [PubMed] [Google Scholar]
- 40.Lam WY, Jash A, Yao CH, D’Souza L, Wong R, Nunley RM, Meares GP, Patti GJ, and Bhattacharya D (2018). Metabolic and Transcriptional Modules Independently Diversify Plasma Cell Lifespan and Function. Cell Rep 24, 2479–2492 e2476. 10.1016/j.celrep.2018.07.084. [DOI] [PMC free article] [PubMed] [Google Scholar]
- 41.Lam WY, and Bhattacharya D (2018). Metabolic Links between Plasma Cell Survival, Secretion, and Stress. Trends Immunol 39, 19–27. 10.1016/j.it.2017.08.007. [DOI] [PMC free article] [PubMed] [Google Scholar]
- 42.Ma Y, Shimizu Y, Mann MJ, Jin Y, and Hendershot LM (2010). Plasma cell differentiation initiates a limited ER stress response by specifically suppressing the PERK-dependent branch of the unfolded protein response. Cell Stress Chaperones 15, 281–293. 10.1007/s12192-009-0142-9. [DOI] [PMC free article] [PubMed] [Google Scholar]
- 43.Xu W, Zhao X, Wang X, Feng H, Gou M, Jin W, Wang X, Liu X, and Dong C (2019). The Transcription Factor Tox2 Drives T Follicular Helper Cell Development via Regulating Chromatin Accessibility. Immunity 51, 826–839 e825. 10.1016/j.immuni.2019.10.006. [DOI] [PubMed] [Google Scholar]
- 44.Lin D, Ippolito GC, Zong RT, Bryant J, Koslovsky J, and Tucker P (2007). Bright/ARID3A contributes to chromatin accessibility of the immunoglobulin heavy chain enhancer. Mol Cancer 6, 23. 10.1186/1476-4598-6-23. [DOI] [PMC free article] [PubMed] [Google Scholar]
- 45.Bentebibel SE, Lopez S, Obermoser G, Schmitt N, Mueller C, Harrod C, Flano E, Mejias A, Albrecht RA, Blankenship D, et al. (2013). Induction of ICOS+CXCR3+CXCR5+ TH cells correlates with antibody responses to influenza vaccination. Sci Transl Med 5, 176ra132. 10.1126/scitranslmed.3005191. [DOI] [PMC free article] [PubMed] [Google Scholar]
- 46.Nakaya HI, Hagan T, Duraisingham SS, Lee EK, Kwissa M, Rouphael N, Frasca D, Gersten M, Mehta AK, Gaujoux R, et al. (2015). Systems Analysis of Immunity to Influenza Vaccination across Multiple Years and in Diverse Populations Reveals Shared Molecular Signatures. Immunity 43, 1186–1198. 10.1016/j.immuni.2015.11.012. [DOI] [PMC free article] [PubMed] [Google Scholar]
- 47.Hafemeister C, and Satija R (2019). Normalization and variance stabilization of single-cell RNA-seq data using regularized negative binomial regression. Genome Biol 20, 296. 10.1186/s13059-019-1874-1. [DOI] [PMC free article] [PubMed] [Google Scholar]
- 48.Scharer CD, Blalock EL, Mi T, Barwick BG, Jenks SA, Deguchi T, Cashman KS, Neary BE, Patterson DG, Hicks SL, et al. (2019). Epigenetic programming underpins B cell dysfunction in human SLE. Nat Immunol 20, 1071–1082. 10.1038/s41590-019-0419-9. [DOI] [PMC free article] [PubMed] [Google Scholar]
- 49.Hipp N, Symington H, Pastoret C, Caron G, Monvoisin C, Tarte K, Fest T, and Delaloy C (2017). IL-2 imprints human naive B cell fate towards plasma cell through ERK/ELK1-mediated BACH2 repression. Nat Commun 8, 1443. 10.1038/s41467-017-01475-7. [DOI] [PMC free article] [PubMed] [Google Scholar]
- 50.Alamyar E, Duroux P, Lefranc MP, and Giudicelli V (2012). IMGT((R)) tools for the nucleotide analysis of immunoglobulin (IG) and T cell receptor (TR) V-(D)-J repertoires, polymorphisms, and IG mutations: IMGT/V-QUEST and IMGT/HighV-QUEST for NGS. Methods Mol Biol 882, 569–604. 10.1007/978-1-61779-842-9_32. [DOI] [PubMed] [Google Scholar]
- 51.Dobin A, Davis CA, Schlesinger F, Drenkow J, Zaleski C, Jha S, Batut P, Chaisson M, and Gingeras TR (2013). STAR: ultrafast universal RNA-seq aligner. Bioinformatics 29, 15–21. 10.1093/bioinformatics/bts635. [DOI] [PMC free article] [PubMed] [Google Scholar]
- 52.Lawrence M, Huber W, Pages H, Aboyoun P, Carlson M, Gentleman R, Morgan MT, and Carey VJ (2013). Software for computing and annotating genomic ranges. PLoS Comput Biol 9, e1003118. 10.1371/journal.pcbi.1003118. [DOI] [PMC free article] [PubMed] [Google Scholar]
- 53.Robinson MD, McCarthy DJ, and Smyth GK (2010). edgeR: a Bioconductor package for differential expression analysis of digital gene expression data. Bioinformatics 26, 139–140. 10.1093/bioinformatics/btp616. [DOI] [PMC free article] [PubMed] [Google Scholar]
- 54.Benjamini Y, and Hochberg Y (1995). Controlling the fase discovery rate: a practical and powerful approach to multiple testing. Journal of the Royal statistical society: series B (Methodological) 57, 289–300. [Google Scholar]
- 55.Subramanian A, Tamayo P, Mootha VK, Mukherjee S, Ebert BL, Gillette MA, Paulovich A, Pomeroy SL, Golub TR, Lander ES, and Mesirov JP (2005). Gene set enrichment analysis: a knowledge-based approach for interpreting genome-wide expression profiles. Proc Natl Acad Sci U S A 102, 15545–15550. 10.1073/pnas.0506580102. [DOI] [PMC free article] [PubMed] [Google Scholar]
- 56.Tibshirani R WG, Hastie T (2001). Estimating the number of clusters in a data set via the gap statistic. Journal of the Royal statistical society: series B (Methodological) 63, 411–423. [Google Scholar]
- 57.Langmead B (2010). Aligning short sequencing reads with Bowtie. Curr Protoc Bioinformatics Chapter 11, Unit 11 17. 10.1002/0471250953.bi1107s32. [DOI] [PMC free article] [PubMed] [Google Scholar]
- 58.Zhang Y, Liu T, Meyer CA, Eeckhoute J, Johnson DS, Bernstein BE, Nusbaum C, Myers RM, Brown M, Li W, and Liu XS (2008). Model-based analysis of ChIP-Seq (MACS). Genome Biol 9, R137. 10.1186/gb-2008-9-9-r137. [DOI] [PMC free article] [PubMed] [Google Scholar]
- 59.Heinz S, Benner C, Spann N, Bertolino E, Lin YC, Laslo P, Cheng JX, Murre C, Singh H, and Glass CK (2010). Simple combinations of lineage-determining transcription factors prime cis-regulatory elements required for macrophage and B cell identities. Mol Cell 38, 576–589. 10.1016/j.molcel.2010.05.004. [DOI] [PMC free article] [PubMed] [Google Scholar]
- 60.Scharer CD, Blalock EL, Barwick BG, Haines RR, Wei C, Sanz I, and Boss JM (2016). ATAC-seq on biobanked specimens defines a unique chromatin accessibility structure in naive SLE B cells. Sci Rep 6, 27030. 10.1038/srep27030. [DOI] [PMC free article] [PubMed] [Google Scholar]
- 61.Butler A, Hoffman P, Smibert P, Papalexi E, and Satija R (2018). Integrating single-cell transcriptomic data across different conditions, technologies, and species. Nat Biotechnol 36, 411–420. 10.1038/nbt.4096. [DOI] [PMC free article] [PubMed] [Google Scholar]
- 62.Allie SR, Bradley JE, Mudunuru U, Schultz MD, Graf BA, Lund FE, and Randall TD (2019). The establishment of resident memory B cells in the lung requires local antigen encounter. Nat Immunol 20, 97–108. 10.1038/s41590-018-0260-6. [DOI] [PMC free article] [PubMed] [Google Scholar]
Associated Data
This section collects any data citations, data availability statements, or supplementary materials included in this article.
Supplementary Materials
Supplemental Table S1. BCR repertoire data from sorted B cell subsets following vaccination, related to Figures 1, 3, 7, and S1. Tab 1–3 delineates BCR repertoire data acquired from (n=3) IIV immunized HD (Donors 1–3). Tab 1 reports isotype distribution. Tab 2 reports mutation rates. Tab 3 reports BCR lineages from different B cell subsets within each Donor. Tab 4 shows % shared clones (Bmem cell subsets in Y1 to PBs in Y2) from Donors 1–3. The ratio of sharing for each Donor was determined as: the % clones shared between Y1 FcRL5+ Bmem cells and Y2 PB divided by the % clones shared between Y1 FcRL5neg Bmem cells and Y2 PB. Statistical significance was determined using a one-sample t-test (mean of 1) p=0.058. Tab 5 shows the primers used to amplify the heavy and light chain of single sorted cells for recombinant monoclonal Ab generation.
Supplemental Table S2. RNA-seq data set from sort-purified B cell subsets D7 and D14 days after influenza vaccination, related to Figures 2–6, S2–S3 and S5. Tab 1: RNA-seq analysis of sort-purified B cell subsets isolated from the peripheral blood of HD on D7 (n=6 donors) or D14 (n=4 donors) post-IIV. Data reported as RPKM values for each gene. Log(2)FC, p values and FDR values provided for each B cell subset pairwise comparison.
Tab 2: Description of all gene sets used for GSEA including the source of the gene sets and the list of genes in each set.
Tab 3: D7 and D14 RNA-seq (Table S2 Tab 1) and ATAC-seq (Table S3 Tab 1) data derived from D7 PB, and H1+ IgDneg FcRL5+ and FcRL5neg Bmem cell subsets (D7 and D14) were analyzed using the PR algorithm to identify TFs predicted to regulate the transcriptional networks in each B cell subset. Data are reported as PR scores for TFs in each subset and as FClog(2) in PR scores between different B cell subsets.
Tab 4: DEG from D14 H1+ IgDneg FcRL5+ and FcRL5neg Bmem cell RNA-seq datasets (derived from Table S2 Tab 1) and published datasets in Lau et al14 (See Table S2 Tab 2 for lists) are displayed. Genes are reported as significant (1) or not significant (0) in the comparator gene set.
Tab 5: GSEA comparison of the ranked gene list of D7 post-vaccine H1-specific IgDneg FcRL5+ and FcRL5neg Bmem cell subsets to 3931 GO terms. Identification of 185 positively enriched gene sets with an FDR q-value < 0.01. Yellow highlight indicates each of the 11 prototypic gene lists used in the metabolic analyses.
Tabs 6–14: Nine clusters of gene sets with overlapping leading-edge genes were identified. Leading edge-genes for each gene list in each cluster are reported as present (1) or absent (0). Prototypic gene lists for each cluster are highlighted in yellow.
Tab 15: Functional descriptions for proteins encoded by leading-edge genes from 11 prototypic gene sets (see Table S2 Tab 6–15) were curated and each gene was assigned to a functional module (n=14 modules). Table shows gene set origin of each leading-edge gene and assignment of leading-edge genes into the different modules.
Supplemental Table S3. ATAC-seq dataset from sort-purified B cell subsets D7 and D14 after influenza vaccination, related to Figures 2, 4, and S2.
Tab 1: ATAC-seq analysis of sort-purified B cell subsets isolated from the peripheral blood of HD on D7 (n=5 donors) or D14 (n=4 donors) post-IIV. Data reported as RPPM values for each DAR. Log(2)FC, p values, and FDR values provided for each B cell subset pairwise comparison.
Tab 2: Intersection of the DEG (Table S2, Tab 1) and DAR (Table S3, Tab 1) between D7 FcRL5+ and FcRL5neg Bmem cells (111 unique genes assigned to 154 DAR). DAR with consensus T-bet binding motifs or containing known ChIP-seq assigned T-bet binding sites25 are indicated. Gene annotation and putative functions are provided.
Supplemental Table S4. Single cell sequencing data, related to Figure 2.
Transcriptional data from single cell sorted HA-specific B cells within one month of vaccination from N=2 HDs. Table outlining mutation frequencies (Tab 1), cells with TBX21 expression (Tab 2), FcRL5 expression (Tab 3), unique DEGs within clusters (Tab 4), GSEA statistics (Tab 5) and oligomer hashtags (Tab 6) used.
Supplemental Table S5. Sort Panels and BCR reactivity data from D7 IgDneg CA09-H1-specific FcRL5+ and FcRL5neg Bmem cells, related to Star Methods.
Tab 1: Flow panels for various flow sort purifications of B cell subsets outlined.
Tab 2: Single CA09-H1-specific IgDneg B cells from D7 post-IIV (2017) HD were index-sorted and identified as either FcRL5+ (n=202 cells) or FcRL5neg (n=68 cells). Recombinant IgG1 monoclonal Abs (rmAb) from sorted single cells were screened for binding to recombinant H1 Ags arrayed on cytometric beads (CBA assay). Binding reactivities for each rmAb to CA09-H1, MI15-H1, and PR8-H1 Ags reported as normalized gMFI.
Supplemental Figures and Legends
Data Availability Statement
Sequencing data have been deposited in the NCBI Gene Expression Omnibus (GEO) and are publicly available as of the date of publication. Accession numbers are listed in the Key Resources Table.
All original code has been deposited at Zenodo. DOIs are listed in the Key Resource Table.
Any additional information required to reanalyze the data reported in this paper is available from the lead contact upon request.
KEY RESOURCE TABLE.
| REAGENT or RESOURCE | SOURCE | IDENTIFIER |
|---|---|---|
| Antibodies | ||
| Anti-IgD | BD | Cat# 555778 RRID:AB_396113 |
| Anti-IgD | BD | Cat# 561490 RRID:AB_10679356 |
| Anti-IgD | Biolegend | Cat# 348226 RRID:AB_2561619 |
| Anti-CD19 | Biolegend | Cat# 302242 RRID: AB_2561668 |
| Anti-CD19 | Biolegend | Cat# 302234 RRID: AB_11142678 |
| Anti-CD19 | BD | Cat# 560727 RRID: AB_1727437 |
| Anti-CD27 | Biolegend | Cat# 356418 RRID:AB_2562599 |
| Anti-CD3 | Biolegend | Cat# 344808 RRID: AB_10640736 |
| Anti-CD3 | BD | Cat# 560176 RRID: AB_1645475 |
| Anti-CD4 | Biolegend | Cat# 344607 RRID: AB_1953236 |
| Anti-CD4 | BD | Cat# 560158 RRID: AB_1645478 |
| Anti-CD14 | BD | Cat# 561384 RRID: AB_10611720 |
| Anti-FcRL5 | Biolegend | Cat# 340304 RRID: AB_2104588 |
| Anti-CD27 | Biolegend | Cat# 356404 RRID: AB_2561788 |
| Anti-CXCR5 | Biolegend | Cat# 356904 RRID:AB_2561813 |
| Anti-CCR7 | Biolegend | Cat# 353208 RRID:AB_11203894 |
| Anti-CD62L | Biolegend | Cat# 304838 RRID:AB_2562914 |
| Anti-CXCR3 | Biolegend | Cat# 353706 RRID:AB_10962912 |
| Anti-CD38 | Biolegend | Cat# 303516 RRID: AB_2072782 |
| Anti-T-bet | Biolegend | Cat# 644814 RRID:AB_10901173 |
| Anti-T-bet | Biolegend | Cat# 644812 RRID:AB_2200540 |
| Anti-CD21 | Biolegend | Cat# 354908 RRID:AB_2561544 |
| Anti-CD27 | Biolegend | Cat# 356418 RRID:AB_2562599 |
| Anti-CD71 | BD | Cat# 562995 RRID:AB_2737939 |
| Anti phosphoS6 | Cell Signaling Tech | Cat# 2211 RRID:AB_331679 |
| Anti Rabbit IgG (H+L) | ThermoFisher | Cat# A-21245 RRID:AB_2535813 |
| TotalSeq ™-C0829 anti human FcRL5 | Biolegend | Cat# 340309 RRID:AB_2819969 |
| AffiniPure Goat Anti-Human IgG (H+L) | Jackson ImmunoResearch | Cat# 109-005-003 RRID:AB_2337532 |
| Peroxidase Affinipure Goat Anti-Human IgG (H+L) | Jackson ImmunoResearch | Cat# 109-035-088 RRID:AB_2337584 |
| Alkaline Phosphatase AffiniPure Goat Anti-Human IgG (H+L) | Jackson ImmunoResearch | Cat# 109-055-003 RRID:AB_2337599 |
| Bacterial and virus strains | ||
| Biological samples | ||
| PBMCs from flu vaccinated subjects | Alabama Vaccine Research Clinic | N/A |
| Chemicals, peptides, and recombinant proteins | ||
| H2DCFDA | ThermoFisher | Cat# D399 |
| MitoTracker Green FM | ThermoFisher | Cat# M7514 |
| BODIPY500/510 | ThermoFisher | Cat# D3823 |
| Igepal CA-360 | Sigma Aldrich | Cat# 18896 |
| Neuraminidase (C. perfringens) | Sigma Aldrich | Cat# N5631 |
| Imidazole | Sigma Aldrich | Cat# 12399 |
| 7-ADD (7-aminoactinomycin-D) | ThermoFisher | Cat# A1310 |
| Live/Dead Fixable Near-IR Dead Cell Kit | ThermoFisher | Cat# L10119 |
| Live/Dead Fixable Red Dead Cell Kit | ThermoFisher | Cat# L23102 |
| Formalin solution, 10% neutral buffered | Sigma Aldrich | Cat# HT501128 |
| 2-Mercaptoethanol | Thermo Fisher | Cat# BP176-100 |
| Agencourt AMPure XP | Beckman Coulter | Cat# A66514 |
| dNTPs | ThermoFisher | Cat# 18427088 |
| TotalSeq C0952 PE Streptavidin | Biolegend | Cat# 405263 |
| TotalSeq C0953 PE Streptavidin | Biolegend | Cat# 405265 |
| Celltrace Violet | ThermoFisher | Cat# C34557 |
| R848 | InvivoGen | Cat# Tlrl-r848 |
| IL-2 | Peprotech | Cat# AF-200-02 |
| IL-21 | Peprotech | Cat# AF-200-21 |
| IFN-g | R&D | Cat# 285-IF |
| Critical commercial assays | ||
| eBioscience Foxp3 Transcription Factor Kit | ThermoFisher | Cat# 00-5523-00 |
| AviTag Kit | Avidity | Cat# BirA-500 |
| RNAeasy Mini Kit | Qiagen | Cat# 74104 |
| Quick RNA Micro Prep Kit | Zymo Research | Cat# R1051 |
| SMART-seq v4 UltraLow Input RNA Kit for Sequencing | Takara | Cat# 634888 |
| NexteraXT DNA library preparation kit | Illumina | Cat# FC-131-1024 |
| EasySep Human B Cell Negative Selection Kit | Stem Cell Technologies | Cat# 17954 |
| Easy Sep Human Pan B Cell Negative Selection Kit | Stem Cell Technologies | Cat# 19554 |
| HiFi Polymerase Mastermix | KAPA Biosystems | Cat# KK2601 |
| Chromium Next GEM Chip G Single Cell Kit 8 rxns | 10XGenomics | Cat# 1000120 |
| Chromium NextGEM Single Cell 3’ GEM, Library and Gel Bead Kit v 3.1 | 10XGenomics | Cat# 1000268 |
| Chromium 3; 5’ Feature Barcode Kit | 10XGenomics | Cat# 1000256 |
| Library Construction Kit | 10XGenomics | Cat# 1000190 |
| Chemiluminescent Substrate for Alkaline Phosphatase | Moss Inc | ChemiAP-RK100 |
| Deposited data | ||
| Super series of all sequencing data | This paper | Accession# GSE222476 |
| Single Cell sequencing data (RNA-seq and VDJ) | This paper | Accession# GSE222888 |
| RNA-seq | This paper | Accession# GSE163989 |
| ATAC-seq | This paper | Accession# GSE203112 |
| BCR seq | This paper | Accession# GSE222474 |
| Experimental models: Cell lines | ||
| FreeStyle 293F Cells | ThermoFisher | Cat# R79007 RRID:CVCL_D603 |
| Experimental models: Organisms/strains | ||
| Oligonucleotides | ||
| Vh1a 5’-CAGGTKCAGCTGGTGCAG-3’ | Tipton et al. Nat Immunol. 2015. | N/A |
| Vh1b 5’SAGGTCCAGCTGGTACAG-3’ | Tipton et al. Nat Immunol. 2015. | N/A |
| Vh1c 5’ CARATGCAGCTGGTGCAG-3’ | Tipton et al. Nat Immunol. 2015. | N/A |
| Vh2, 5’-CAGGTCACCTTGARGGAG-3’ | Tipton et al. Nat Immunol. 2015. | N/A |
| Vh3, 5’GGTCCCTGAGACTCTCCTGT-3’ | Tipton et al. Nat Immunol. 2015. | N/A |
| Vh4, 5’ACCCTGTCCCTCACCTGC-3’ | Tipton et al. Nat Immunol. 2015. | N/A |
| Vh5, 5’GCAGCTGGTGCAGTCTGGAG-3’ | Tipton et al. Nat Immunol. 2015. | N/A |
| Vh6, 5’CAGGACTGGTGAAGCCCTCG-3’ | Tipton et al. Nat Immunol. 2015. | N/A |
| Vh7, 5’CAGGTGCAGCTGGTGCAA-3’ | Tipton et al. Nat Immunol. 2015. | N/A |
| Cm 5’-CAGGAGACGAGGGGGAAAAGG-3’ | Tipton et al. Nat Immunol. 2015. | N/A |
| Cy 5’ CCGATGGGCCCTTGGTGGA-3’ | Tipton et al. Nat Immunol. 2015. | N/A |
| Ca 5’GAAGACCTTGGGGCTGGTCG-3’ | Tipton et al. Nat Immunol. 2015. | N/A |
| F tag, 5’ TCGTCGGCAGCGTCAGATGTGTATAAGAGACAG-3’ | Tipton et al. Nat Immunol. 2015. | N/A |
| R tag, 5’ GTCTCGTGGGCTCGGGATGTGTATAAGAGACAG-3’ | Tipton et al. Nat Immunol. 2015. | N/A |
| Recombinant DNA | ||
| CA09 Influenza HA (H1) | GeneArt | Protein Sequence Accession: NC_026433.1 |
| SW13 Influenza HA (H3) | GeneArt | Protein Sequence Accession: EPI543739 |
| Michigan 15 Influenza HA (H1) | GeneArt | Protein Sequence Accession: MK622940.1 |
| TX50 Influenza HA (H3) | GeneArt | Protein Sequence Accession: KC892952.1 |
| HK2014 Influenza HA (H3) | GeneArt | Protein Sequence Accession: A0A068IXL |
| Software and algorithms | ||
| Flowjo v.9.9.3/10.2 | FlowJo | N/A |
| PRISM 8/9 | GraphPad | N/A |
| Seurat v. 3.2.2 | Butler et al. Nat. Biotech. 2018. |
https://satijalab.org/seurat RRID:SCR_016341 |
| edgeR v3.24.3 | Robinson et al. Bioinformatics. 2010. | https://bioconductor.org/packages/release/bioc/html/edgeR.html |
| SplicingGraphs | Bindreither D et al Bioconductor. 2022. | https://bioconductor.org/packages/SplicingGraphs |
| Bowtie v1.1.1 | Langmead et al. Genome Biology. 2009. |
http://bowtie-bio.scourceforg.net/index.shtml RRID:SCR_005476 |
| HOMER | Heinz et al. Mol Cell. 2010. |
http://homer.ucsd.edu RRID:SCR_010881 |
| MATLAB | Mathworks | RRID:SCR_001622 |
| IMGT/V-quest v3.5.21 | LeFranc et al. Nucleic Acids Research. 2015. | RRID:SCR_010749 |
| R Project for Statistical Computing | R core team (2018). R: A language and environment for statistical computing. R Foundation for Statistical Computing. Vienna, Austria. |
www.R-project.org RRID:SCR_001905 |
| IDEAS Image Data Exploration and Analysis Software | Amnis | RRID:SCR_020142 |
| GSEA | Subramanian, Tamayo et al. PNAS. 102, 15545-15550. |
http://www.broadinstitute.org/gsea/ RRID:SCR_003199 |
| IPA | Qiagen | RRID:SCR_008653 |
| Code for single cell RNA-seq analysis | This paper | 10.5281/zenodo.7668260 |
| Code for bulk BCR-seq analysis | This paper | 10.5281/zenodo.7668260 |
| Code for bulk RNA-seq analysis | This paper | 10.5281/zenodo.7672023 |
| Code for bulk ATAC-seq analysis | This paper | 10.5281/zenodo.7672023 |
| Other | ||
| 2015-2016 Fluzone | Sanofi-Pasteur | National Drug Code: 49281-0396-15 |
| 2016-2017 Fluvirin | Sequiris | National Drug Code: 3332-0014-02 |
| 2017-2018 Fluzone | Sanofi-Pasteur | National Drug Code: 49281-0417-10 |
| 2018-2019 Fluzone | Sanofi-Pasteur | National Drug Code: 49281-0418-10 |
| 2020-2021 Fluzone | Sanofi-Pasteur | National Drug Code: 49281-0420-50 |
| Lymphocyte Separation Medium | Sigma Aldrich | Cat# C-44010 |
| Ammonium Chloride Solution | Stem Cell Technologies | Cat# 07800 |
| HisTrap HP Column | GE Healthcare | Cat# GE17-5247-01 |