Abstract
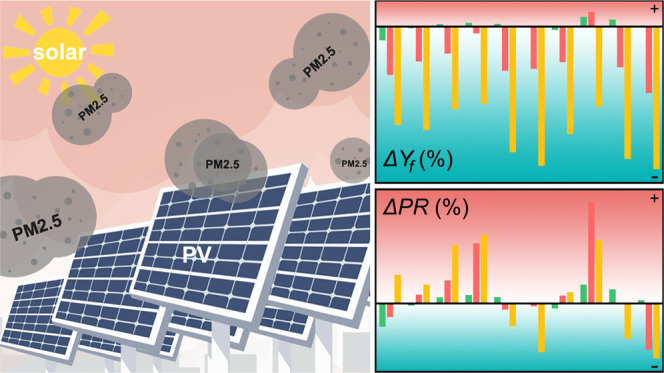
Ambient fine particulate matter (PM2.5) could be a potential environmental risk for decreasing the available solar energy resources and solar photovoltaic (PV) power generation. This study quantifies the attenuation effects of PM2.5 on surface solar irradiance and system performance of different solar PV technologies in Hong Kong. The analysis based on observational irradiation data shows that the global horizontal irradiance decreased by more than 5% in most months under the conditions of PM2.5 concentration exceeding 33.5 μg/m3. During the experiment, the average PM2.5-related losses in the energy output of crystalline silicon and thin-film PV systems could be up to 7.00 and 9.73%, respectively. The measured energy outputs of the experimental PV modules suggest that PM2.5 affects the energy performance of thin-film solar cells with a larger band gap more significantly than that of crystalline silicon PV modules. Moreover, an increasing trend in the performance ratio of monocrystalline silicon, polycrystalline silicon, and copper indium gallium selenide PV systems with the increase of PM2.5 concentration is observed. In contrast, the amorphous silicon and cadmium telluride PV systems with a narrower spectral response range show a decreasing trend in the performance ratio over the experiment. Results indicate that the losses in the available solar energy resources and PV energy potential are expected to increase in areas where heavier PM2.5 pollution exists.
Keywords: air pollution, fine particulate matter, solar irradiation, photovoltaic, solar photovoltaic power generation
1. Introduction
Solar energy has been the fastest growing energy source for application worldwide, enjoying a share of around half of the global investment in renewable energy over the past decade.1 As the simplest and cheapest option, solar photovoltaics (PV) continued to dominate solar investment. In 2020, the cumulative installed solar PV capacity increased an estimated installation of 139 GW worldwide, raising the total global installations to about 760 GW.2 Solar power is expected to make a prominent contribution to power generation in the low-carbon future.
Solar PV power generation depends on various uncertain factors, such as solar irradiation, ambient temperature, humidity, and module temperature.3 Among them, the intensity of solar irradiation reaching the PV modules plays a dominant role in determining the PV energy yield.4 In general, the cloud characteristics are considered the primary factors modifying surface solar irradiation.5−7 However, the impact of increasing air pollution on surface solar irradiation cannot be negligible. High concentrations of atmospheric pollutants could significantly attenuate incoming irradiation by absorbing and scattering the sunlight, especially in heavy polluted areas such as Indo-Gangetic plains and North China.8−10 For instance, Zhang et al.11 found that the annual surface solar irradiation attenuation ranges from 2.69 to 6.56% during 2014–2016 in five cities with high levels of air pollution in China. Over the most polluted northern and eastern China, severe atmospheric aerosol pollution reduces the annual average point-of-array irradiance (IPOA) by 25–35% compared to the conditions without air pollution.12 Similarly, Peters et al.13 found that the IPOA value was reduced by 11.5 ± 1.5% due to air pollution with a 12.5% decrease in the incident solar irradiation for each 100 μg/m3 of fine particulate matter (PM2.5) in Delhi, India. Such implications for solar irradiation cast a shadow on the solar PV sector.
Recently, Li et al.14 provided a global picture of the air pollution implications for solar PV efficiency and power generation. The capacity factors of fixed-panel PV systems decreased by 4–34% in major PV markets due to the atmospheric aerosols resulting from anthropogenic emissions. Focusing on the largest PV market, Sweerts et al.15 reported that air pollution had reduced the PV capacity factors by 11–15% between 1960 and 2015 in China. The estimated annual loss in power generation for the 2016 PV capacity in China was up to 14 TWh, equivalent to a financial loss of $1.9 billion. The Arabian Peninsula features abundant solar resources with sanguine prospects for the solar PV market.2,16 For example, the annual growth of PV capacity in Saudi Arabia and the United Arab Emirates is expected to reach 72 and 34%, respectively, for the coming 5 years.17 However, solar PV power generation is reduced by about 15% due to the atmospheric particulate matter dominated by dust over the Arabian Peninsula.18 In Europe, the coupled aerosol-climate simulations indicated that atmospheric aerosol pollution caused a significant reduction of 4–16% in solar PV power potential, especially in central Europe such as Belgium—The Netherlands.19 Similarly, air pollution-induced losses in solar PV power generation have been a severe challenge for the solar PV sector in many other areas such as India,20 South Korea,21 and Chile.22 However, almost all of these studies rely on simulation results and lack actual experimental data from PV systems due to uncontrollable weather conditions.
Solar PV output potential to the total power consumption in Hong Kong ranges from 5.9 to 35%.23 Solar PV technologies are expected to be one of the ideal options for power generation with large-scale applications in the future. On the other hand, carbon-fuel-based electricity generation, high marine vessels and vehicle emissions, and transboundary air pollution contribute to the deterioration of air quality in Hong Kong.24−26 Air pollution, especially PM2.5 pollution, has become an increasingly severe environmental problem in Hong Kong over the past decades.27,28 In addition to the devastating influence on public health, PM2.5 is also the primary cause of urban haze, decreasing the visibility of the atmosphere and affecting the transition of solar irradiation through the lower atmosphere.13,29 However, the impacts of PM2.5 on solar energy have not been assessed in Hong Kong. Therefore, this study aims to quantify the impacts of PM2.5 on available solar energy resources based on the historical irradiation data and examine the PM2.5 effects on the performance of different solar PV technologies by experiment in Hong Kong.
2. Materials and Methods
The 1min solar radiation data, including global horizontal irradiance (Ig), diffuse horizontal irradiance (Id), and relative humidity data observed from 2016 to 2020 were provided by Hong Kong Observatory. Days of incomplete records were eliminated. All night-time records were excluded based on the relation between solar hour angle (ω) and sunset hour angle (ωs): ω > ωs or ω < −ωs. The historical monitoring 24 h and hourly data of the PM2.5 concentration in μg/m3 between 2016 and 2020 were collected from the Hong Kong Environmental Protection Department (https://cd.epic.epd.gov.hk/). Daily air quality index (AQI) data in the corresponding period were obtained from the Air Quality Historical Data Platform (https://aqicn.org/data-platform/). The AQI used in this study is calculated based on the US EPA standard.30 In order to eliminate the uncertainty caused by atmospheric pollutants other than PM2.5, days with individual pollutant AQI for respirable particulate matter, ozone, nitrogen dioxide, and sulfur dioxide exceeded 50 were not included in this study.
2.1. PM2.5 Pollution Pattern
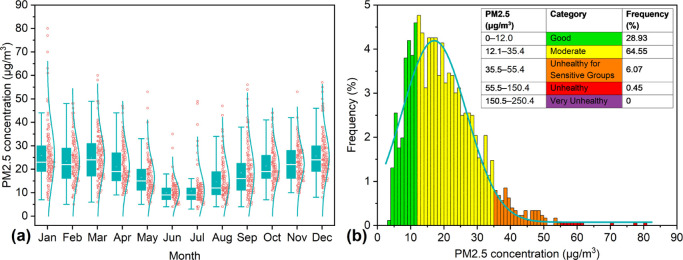
The air quality data recorded at the Sham Shui Po air quality monitoring station, about 2.5 km of airline distance from the solar irradiation measuring station, were adopted in this study to quantitatively analyze the impacts of PM2.5 on the available solar energy resources. Although the distance between the measurement stations adds uncertainties to the correlation between PM2.5 and solar radiation, the Pearson correlation analysis of PM2.5 data from several stations in Hong Kong indicates that the PM2.5 pollution has a significant statistical correlation in an area of tens of square kilometers (see Figure S1). In Hong Kong, PM2.5 has evidently lower concentration in the middle of the year (see Figure 1a). Figure 1b demonstrates the frequency distribution of 24 h average PM2.5 concentration based on the US EPA standard.30 Note that the frequency distribution of the 24 h average concentration of PM2.5 is right-skewed.
Figure 1.
Statistics of PM2.5 pollution from 2016 through 2020 in Sham Shui Po, Hong Kong. (a) Box plots of 24 h average PM2.5 concentration for each month. (b) Frequency distribution histogram of 24 h average PM2.5 concentration.
2.2. Quality Control of Solar Radiation Records
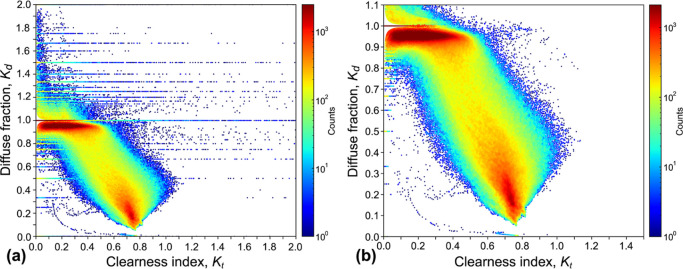
Solar irradiation measurements are more difficult than other meteorological parameters. Any likely sources of operation-related problems and equipment errors and uncertainties can result in the appearance of questionable values.31,32 Therefore, a hybrid quality control procedure for minute time resolution irradiation is implemented to ensure that the data used in this study are reliable. First of all, records with solar altitude angles below 5° were excluded to avoid the errors originating from the cosine response.33 Moreover, other restrictions were considered to examine whether the recorded solar irradiation data were within the physical limits. The intense transient effects of cloud enhancement can increase the ground horizontal solar irradiance for a 1 min time resolution.33,34 As reported by Gueymard and Ruiz-Arias,35 the 1 min Ig could occasionally be 50% larger than the extraterrestrial horizontal irradiance (I0), with the maximum clearness index (Kt) between 1.0 and 1.5. Consequently, the limit of 0–1.5 for Kt was considered in the quality control procedure. The diffuse fraction (Kd) ranges from 0 to 1.1, considering a 10% allowance for shading ring correction.36 Besides, the observations with more than 0.8 ratios between Id and I0 were discarded as the diffuse solar components exceeded the physical limits.37 The Kt and Kd are expressed as eqs 1 and 2, respectively. Figure 2 shows the envelopes of Kt against Kd between 2016 and 2020 in Hong Kong, highlighting the efficiency of the above procedure in eliminating suspicious solar irradiation data.
| 1 |
| 2 |
Figure 2.
Scatter plots of the observed relationship between 1 min Kt and Kd in Hong Kong from 2016 to 2020. (a) Raw data without night-time records within limits of 0–2.0 for Kt and Kd. (b) Valid data after processing the adopted quality control procedure.
2.3. Data Filtering for Clear Sky Irradiance
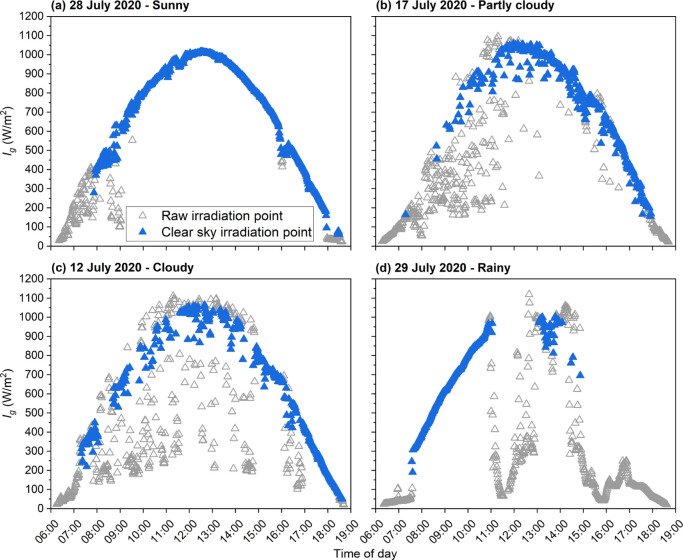
The sky conditions with high Kd accounted for a considerable proportion (see Figure 2b), indicating relatively rare clear skies in subtropical Hong Kong. Thus, the following filtering method proposed by Nobre et al.38 was adopted to remove the cloud and water vapor effects and determine clear sky solar irradiation. First, the records with a relative humidity of above 80% were excluded to eliminate the rainy or pre-/post-rain conditions where clouds are existent. In addition, a larger Kd generally means higher cloud cover. Consequently, data with Kd exceeded 0.5 were removed. Next, a “clear sky irradiance filter” was utilized to evaluate the remaining records within the ±100 W/m2 range of a clear sky irradiance model. In this study, the clear sky irradiance was simulated by the PVLIB-Python model with eq 3 from Ineichen and Perez,39,40 which has been validated with high accuracy by the Sandia National Laboratories.41Figure 3 exemplifies the time series of filtering for clear sky irradiance in typical days consisting of sunny, partly cloudy, cloudy, and rainy weather conditions. Furthermore, 24 h average AQI was used to identify the days without air pollution. According to the US EPA standard,30 a day with an AQI value of or below 50 indicates good air quality without air pollution. Then, the average Ig on a clear sky day without air pollution was set as the baseline reference for each month.
| 3 |
where AM is the air mass, h is the altitude of the site, and TL is the Linke turbidity coefficient.
Figure 3.
Post-filtered Ig time series of 1 min resolution under (a) sunny, (b) partly cloudy, (c) cloudy, and (d) rainy conditions. The blue triangles represent the clear sky irradiance, while the gray ones are eliminated based on the adopted filtering method.
Assuming that the concentrations of PM2.5 are the same at all moments of each hour since the lack of PM2.5 concentration data with 1 min time resolution corresponds to solar irradiation records. The hourly average PM2.5 concentrations were then used to categorize the filtered clear sky irradiation data of each month based on the group shown in Figure 1b. The filtered Ig data within the same category of PM2.5 concentrations in the same month were grouped and averaged for a 1 min time series of Ig under the given PM2.5 pollution conditions. The available solar energy resource considered in this study is the daily cumulative amount of 1 min Ig meeting the clear sky conditions from 8:00 to 17:00 (Hong Kong Time) for each month.
3. Experimental PV Systems Description
3.1. Experimental Setup Details
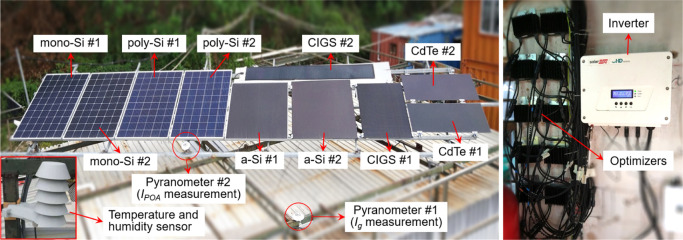
In this study, five different types of PV technologies are adopted to build an on-site experiment from 10 October 2018 to 9 October 2019 in Sheung Shui, Hong Kong (see Figure 4), including monocrystalline silicon (mono-Si), polycrystalline silicon (poly-Si), cadmium telluride (CdTe), copper indium gallium selenide (CIGS), and amorphous silicon (a-Si). Mono-Si and poly-Si belong to the crystalline silicon (c-Si) technology, counting for about 95% of the global solar PV market in 2020.42 CdTe, CIGS, and a-Si belong to the thin-film PV technology, contributing with a share of 2.3, 1.9, and 0.3%, respectively.43 However, CdTe has achieved large-scale production with a competitive unsubsidized levelized cost of electricity.44 Also, CIGS has increasingly been used in building-integrated PV applications as flexible PV modules.45 The two PV modules of each technology are manufactured by different manufacturers. The key technical specifications for each solar PV module are given in Table S1. All PV modules were installed with an inclination of 22° and orientation of 180°. Each PV module was connected to a power optimizer to ensure that all modules could be connected in series and obtain the maximum power outputs (see Figure S2). The power optimizers were connected to an inverter to convert direct current (DC) power into alternating current (AC) power with an hourly recorded power data of each PV module. Ig and IPOA were measured using two EKO MS-802 pyranometers; an outdoor temperature and humidity sensor was installed to measure the ambient temperature and relative humidity. The above environmental data were collected with a data logger every minute. Resistance thermometers were adopted to measure the 1 min backside temperature of each PV module.
Figure 4.
Experimental setup for 10 solar PV modules.
Since the AQI and PM2.5 data were not recorded at the experimental site during the experiment, data from the Tai Po air quality monitoring station was used in this study. A strong positive correlation with a correlation coefficient of more than 0.9 was observed between the available PM2.5 concentration recorded at these two stations (see Figure S3). The data of PM2.5 concentration obtained during the corresponding experimental period is summarized in Figure 5.
Figure 5.
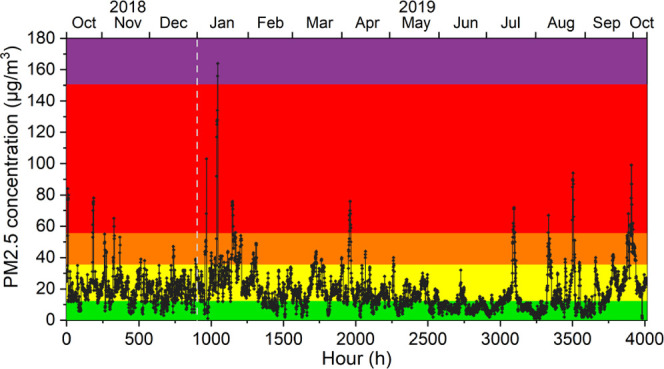
Data of PM2.5 concentration obtained at the Tai Po station for this study. The color code follows the EPA standard.30
3.2. Performance Parameters
In addition to the net AC energy output (EAC), the final yield and performance ratio were adopted to quantify the PM2.5 impacts on the performance of the PV system under clear sky conditions based on the same filtering method described previously. The final yield (Yf) is defined as the ratio of EAC over the installed nominal power (P0), referring to the number of hours that the PV array operates at its nominal power, given as
| 4 |
The performance ratio (PR) is a significant metric in the solar PV industry to evaluate solar PV array performance for operation testing, indicating the relationship between the actual and theoretical output of the PV system. The PR is independent of the conversion efficiency of the PV module, which is defined by the ratio between Yf and the reference yield (Yref) and expressed as
| 5 |
where Iref is the reference irradiance, Iref = 1000 W/m2. Typically, the values of PR for PV systems range from 60 to 90%.46 Besides, the changes in the PV module temperature under different levels of PM2.5 concentration were considered in this study.
4. Results and Discussion
4.1. Observed Impact of PM2.5 on the Available Solar Energy Resource
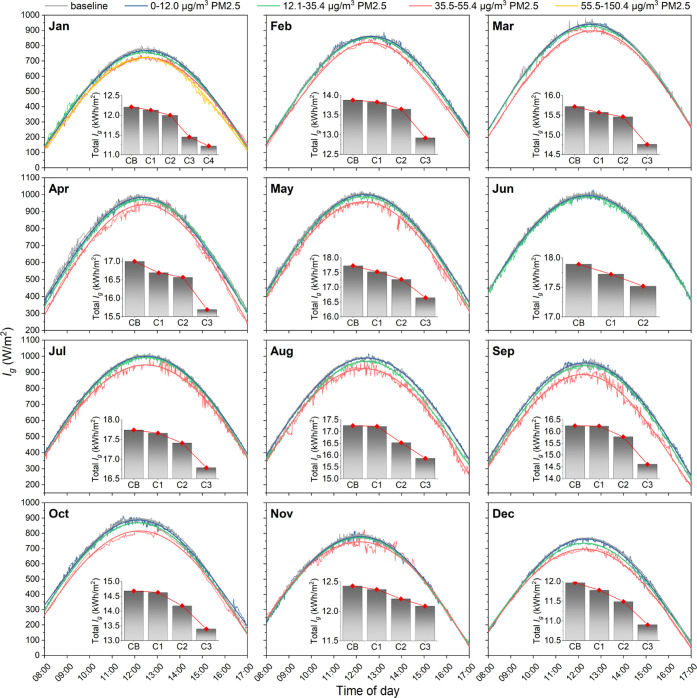
Figure 6 depicts the comparison between the averaged 1 min clear sky irradiance under specific PM2.5 pollution conditions for each month. In order to facilitate comparative analysis, Gaussian curve fitting was adopted to fit the available data. The results show that surface solar irradiation decreases as the PM2.5 concentration increases. The reductions of surface solar irradiation are particularly obvious at noon-time when the high intensity of solar irradiation occurs. Take January as an example; the baseline reference represents the clear sky irradiation without air pollution, indicating a daily total Ig of 12.21 kW h/m2. Under the condition of below 12.0 μg/m3 PM2.5, the total Ig slightly decreased by 0.66% from 12.21 kW h/m2 to 12.13 kW h/m2. In comparison, the higher concentration of PM2.5 over 35.4 μg/m3 induced a significant decrease in Ig, with a reduction of more than 6% compared with the baseline.
Figure 6.
Average 1 min Ig for each month under given conditions of PM2.5 pollution in Hong Kong. The inset bar charts show the daily total Ig, where CB, C1, C2, C3, and C4 refer to the baseline condition, 0–12.0, 12.0–35.4, 35.5–55.4, and 55.5–150.4 μg/m3 of PM2.5 concentration, respectively.
Table 1 summarizes the average daily total Ig and the relative reduction of surface solar irradiation under different levels of PM2.5 concentration for each month in Hong Kong. Compared with the baseline, a reduction of 0.07–10.06% in daily total Ig is observed with the variation of PM2.5 concentrations. The attenuation effects of PM2.5 on surface solar irradiation become more significant as the concentration of PM2.5 increases. Notably, the daily average total Ig at a PM2.5 concentration of 0–12.0 μg/m3 shows a weaker change of below 1% in Ig for most months compared with the baseline. However, the relative reduction in the surface solar irradiation exceeded 5% in all months based on the PM2.5 concentration of 35.5–55.4 μg/m3 with the exception of an outlier in November. The results suggest that the decrease in the available solar energy resources related to PM2.5 is considerable in Hong Kong, indicating a potential risk in solar PV deployment and solar power generation.
Table 1. Average Daily Total Ig of Clear Sky Irradiation Under Baseline and Specific PM2.5 Pollution Conditions as Well as Reduction in Ig Compared with the Baseline for Each Month in Hong Kong.
| PM2.5 concentration range |
|||||||||
|---|---|---|---|---|---|---|---|---|---|
| baseline | 0–12.0 μg/m3 |
12.1–35.4 μg/m3 |
35.5–55.4 μg/m3 |
55.5–150.4 μg/m3 |
|||||
| month | Ig (kW h/m2) | Ig (kW h/m2) | ΔIg (%) | Ig (kW h/m2) | ΔIg (%) | Ig (kW h/m2) | ΔIg (%) | Ig (kW h/m2) | ΔIg (%) |
| Jan | 12.21 | 12.13 | –0.66 | 12.00 | –1.72 | 11.45 | –6.25 | 11.22 | –8.14 |
| Feb | 13.88 | 13.83 | –0.42 | 13.65 | –1.72 | 12.92 | –6.97 | ||
| Mar | 15.72 | 15.57 | –0.96 | 15.46 | –1.63 | 14.76 | –6.08 | ||
| Apr | 17.00 | 16.69 | –1.86 | 16.57 | –2.54 | 15.69 | –7.74 | ||
| May | 17.73 | 17.53 | –1.10 | 17.27 | –2.59 | 16.65 | –6.11 | ||
| Jun | 17.89 | 17.72 | –0.93 | 17.52 | –2.05 | ||||
| Jul | 17.74 | 17.66 | –0.43 | 17.41 | –1.84 | 16.78 | –5.37 | ||
| Aug | 17.25 | 17.22 | –0.14 | 16.53 | –4.16 | 15.87 | –8.00 | ||
| Sep | 16.24 | 16.23 | –0.07 | 15.77 | –2.89 | 14.61 | –10.06 | ||
| Oct | 14.68 | 14.63 | –0.31 | 14.18 | –3.44 | 13.39 | –8.81 | ||
| Nov | 12.43 | 12.37 | –0.49 | 12.21 | –1.78 | 12.09 | –2.72 | ||
| Dec | 11.97 | 11.78 | –1.61 | 11.49 | –3.98 | 10.90 | –8.95 | ||
4.2. Observed Impact of PM2.5 on Solar PV System
Although the experiment lasted a whole year from October 2018 to October 2019, the valid data of post-filtered solar irradiation and PV power generation were incomplete in most months of the experimental period due to the overcast and humid characteristics of the subtropical climate in Hong Kong. Thus, the following analysis and discussion take into account the results in September 2019 only, considering the data integrity of post-filtered solar irradiation and PV power generation and PM2.5 pollution levels during the experiment.
4.2.1. Changes in Point-of-Array Irradiance and PV Module Temperature
Solar irradiance and PV module temperature are suggested to be the dominant factors affecting the energy yield of solar PV modules. The density of IPOA incident on the PV module is critical for the performance of a PV system, which is a combination of several components, including the POA beam irradiance, the POA sky-diffuse irradiance, and the POA ground-reflected irradiance. Generally, a low level of IPOA results in a low output in the PV modules, while a high PV module temperature leads to a reduction in solar PV output.
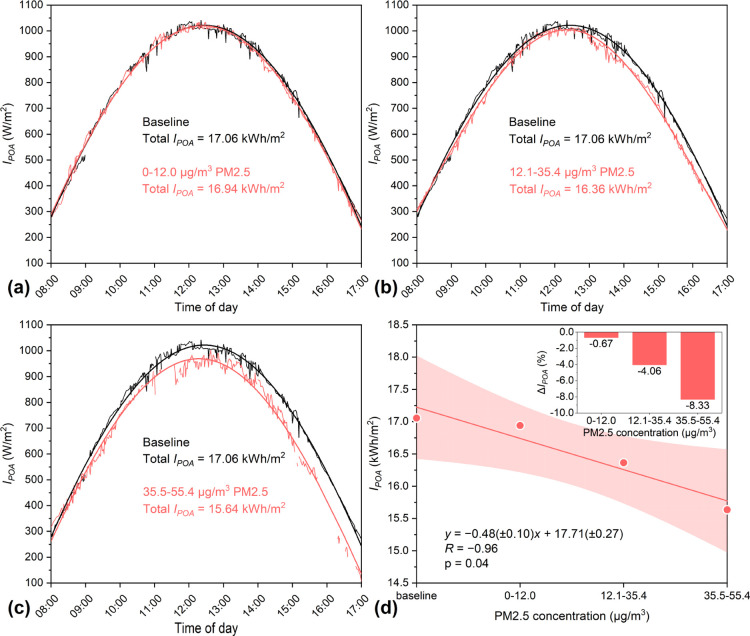
The comparison of IPOA time series under the conditions of baseline and 0–12.0, 12.1–35.4, and 35.5–55.4 μg/m3 for PM2.5 concentrations are provided in Figure 7a–c. The areas under the Gaussian fit curves indicate the daily total IPOA for the clear sky conditions with specific PM2.5 pollution. For the baseline of the clear sky without air pollution condition, the Gaussian fit curve indicated a daily total IPOA of 17.06 kW h/m2. The reduction relative to the baseline and the correlation between PM2.5 concentration and daily total IPOA are shown in Figure 7d. Similar trends with a correlation coefficient (R) of −0.96 for attenuation of IPOA as Ig were observed. The amount of solar irradiation incident on the PV module surface decreases significantly with the increase of PM2.5 concentration. Compared with the baseline, the low concentration of PM2.5 below 12.0 μg/m3 reduced the IPOA value by 0.67% with a weaker reduction of 0.11 kW h/m2. However, the reduction rate of IPOA from the baseline level according to PM2.5 reaches 4.06 and 8.33% under 12.1–35.4 and 35.5–55.4 μg/m3 of PM2.5 concentration, respectively, which could be more considerable for a condition with heavier PM2.5 pollution.
Figure 7.
Comparison of daily total IPOA under given conditions of PM2.5 pollution in Hong Kong. (a–c) Estimated averages and optimized Gaussian fitting curves of post-filtered IPOA under PM2.5 concentrations of 0–12.0, 12.1–35.4, and 35.5–55.4 μg/m3, respectively. (d) Daily total IPOA for given conditions with a significant negative trend (p < 0.05). The inset bar chart provides the reduction in IPOA (ΔIPOA) relative to the baseline.
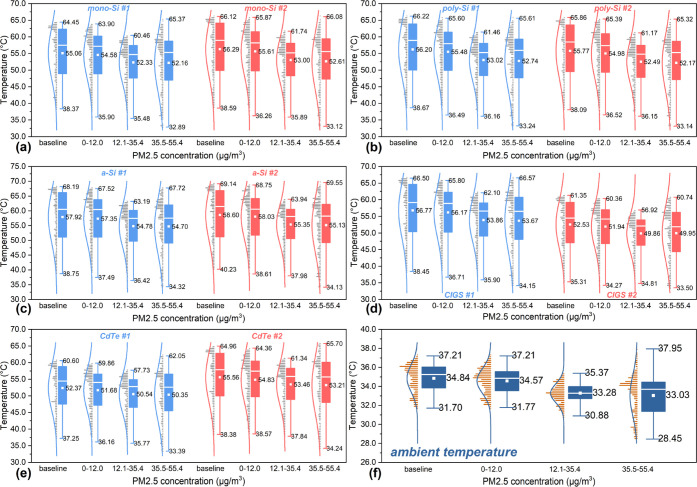
Figure 8 compares the temperature of the 10 PV modules under the given conditions of PM2.5 pollution, as well as the ambient temperature. Compared with baseline means, a weaker decrease in the average temperature of all PV modules is observed for the conditions with relatively heavy PM2.5 pollution (see Figure 8a–e). This change could be mainly caused by the reduction in the IPOA incident on the PV modules. Meanwhile, the lower average ambient temperature recorded during the polluted period with a pattern similar to the PV modules, as shown in Figure 8f, may also partly decrease the PV module temperature. In addition, the measured maximum and minimum PV module temperature decrease with heavier PM2.5 pollution, with the exception of the maximum values recorded under the condition of 35.5–55.4 μg/m3 PM2.5 for all PV modules. It is likely caused by the frequent high ambient temperature during the corresponding period.
Figure 8.
Comparison of measured PV module temperature of (a) mono-Si, (b) poly-Si, (c) a-Si, (d) CIGS, (e) CdTe technologies, and (f) ambient temperature under given conditions of PM2.5 pollution.
4.2.2. Changes in the Energy Performance of PV Systems
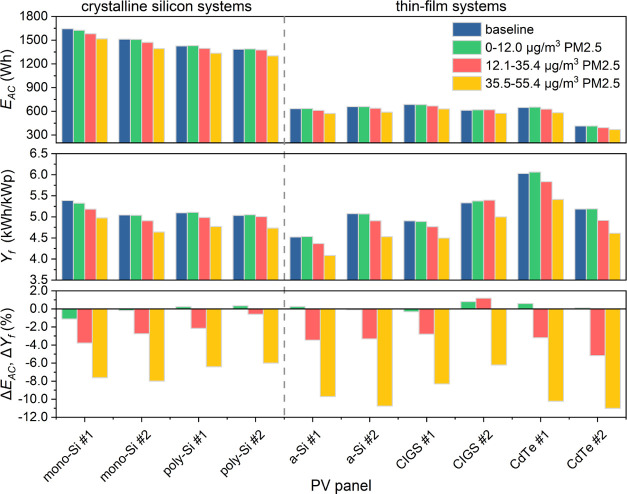
The adverse impacts of PM2.5 on IPOA will further affect the energy performance of PV since solar irradiation is critically involved in determining solar PV power generation. Figure 9 compares the energy performance of experimental PV systems at baseline and different PM2.5 concentrations. The quantitative results of the PM2.5-related impacts on the energy performance of 10 PV systems representing five types of solar PV technologies are summarized in Table S2, including the absolute and relative reductions in PV power generation. With the increase of PM2.5 concentration, the EAC value of mono-Si, poly-Si, a-Si, CIGS, and CdTe ranges between 1624.75 and 1392.80, 1430.42 and 1301.30, 659.31 and 571.71, 684.48 and 575.12, and 651.83 and 369.13 W h, respectively, corresponding to Yf values of 5.33 and 4.64, 5.11 and 4.73, 5.07 and 4.08, 5.38 and 4.50, and 6.06 and 4.61 kW h/kW p. Generally, the energy performance of PV systems decreased with the increase of PM2.5 concentration, although a slight increase was observed in several systems when at a low concentration of PM2.5. Comparing the baseline and the condition of PM2.5 concentration below 12.0 μg/m3, a weaker change in the daily total EAC and Yf is estimated at the range from −1.11 to +0.80%. However, for the scenario of 35.5–55.4 μg/m3 for PM2.5, a significant change is observed in all PV systems, with a great reduction between −6.00 and −11.01%. It is expected that the availability of solar PV power generation will be potentially jeopardized by more heavy PM2.5 pollution, thereby reducing the profitability of investors.
Figure 9.
Comparison of measured EAC and Yf of 10 solar PV systems for given ranges of PM2.5 concentration in Hong Kong, as well as relative changes in EAC and Yf (ΔEAC and ΔYf). The values of ΔEAC and ΔYf are equal.
As demonstrated in Figure 9, there were significant differences in the relative reduction of energy performance related to PM2.5 between different PV technologies based on the experimental results. Almost all thin-film PV systems show higher Yf compared with crystalline silicon PV technologies; however, with the increase of PM2.5 concentration, the energy performance of thin-film PV technologies decreases more significantly. Specifically, the estimated relative reduction of the daily total EAC and Yf for the scenario with a high PM2.5 concentration of 35.5–55.4 μg/m3 shows an average of −7.00% for crystalline silicon PV systems, while the average relative reduction increased to −9.37% for thin-film PV systems. These results suggest that the heavy PM2.5 pollution can cause a much more significant adverse effect on the thin-film PV technologies than crystalline silicon PV technologies in Hong Kong, consistent with the findings in tropical Singapore.38
In addition, the most significant reduction in the energy performance of the PV system is observed in the CdTe systems, with a maximum value of more than −10% (−10.21% for CdTe #1 and −11.01% for CdTe #2), followed by the a-Si systems with the relative reductions of −9.71 and −10.75% for a-Si #1 and a-Si #2, respectively. In contrast, the energy performance of poly-Si systems was reduced by around 6% relative to baseline, with maximum reductions of −6.41 and −6.00% for poly #1 and poly #2, respectively. The mean maximum reductions for mono-Si and CIGS systems are 7.80 and 7.26%, respectively, compared with baseline. Moreover, there is an acceptable agreement when comparing the relative changes of the two systems for each PV technology, except for CIGS systems with absolute relative differences of 3.99 and 2.09% under the conditions of 12.1–35.4 and 35.5–55.4 μg/m3 PM2.5, respectively.
With the decrease of the PV module temperature, as discussed previously, the PV output does not increase as expected but decreases. Consequently, the reduction in IPOA leads to the change in the energy performance of the PV systems. Specifically, the likely cause for the difference between changes in the energy performance of different PV technologies can be attributed to the changes in the solar spectrum. The simulated and measured evidence accumulated to date has demonstrated that PM2.5 in the air caused additional absorption and scattering, showing stronger effects at short wavelengths, leading to a red-shift in the solar spectrum.13 Therefore, thin-film PV technologies with a larger band gap material (see Table 2) will be more significantly affected than crystalline silicon PV technologies, such as a-Si (1.8 eV) and CdTe (1.45–1.5 eV) are among the systems showing the largest relative reductions in the energy performance. Besides, the inconsistent changes in the energy performance of the CIGS systems could be due to the different characteristics of CIGS modules since the band gap of CIGS depends on the ratio of Ga/(Ga + In).47
Table 2. Band Gaps of Different Solar PV Materials.
4.2.3. Changes in the Performance Ratio
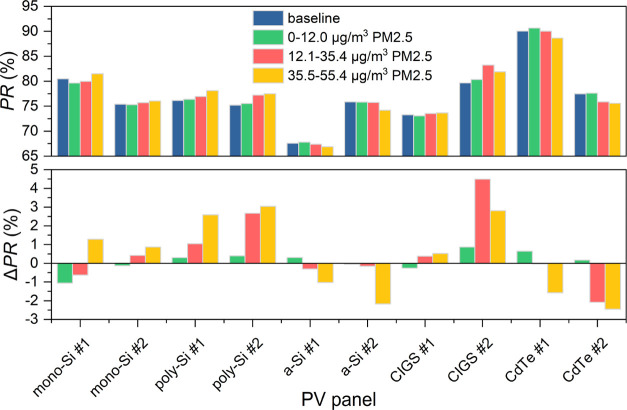
The PR represents the overall effect of losses on the PV output, including the system, array, and optical losses. Figure 10 compares the impact of ambient PM2.5 on the measured daily average PR of each PV system relative to baseline. The overall PR evolution of the PV systems for the given conditions is different from the change of energy output with PM2.5 concentration. The PR of almost all PV systems for the given conditions remained relatively constant compared with the baseline over the considered period of the experiment, with percentage changes between −0.13 and 3.04% for crystalline silicon PV technologies and a slightly greater range of −0.05 to 4.49% for the thin-film PV technologies. Interestingly, the PR of CIGS #1 was kept at the baseline level of about 73%, with a minor fluctuation ranging from −0.26 to 0.52%. In comparison, CIGS #2 undergoes the most significant fluctuation in PR from 79.67 to 83.25%, with a relative change between 0.86 and 4.49%. Additionally, CdTe #1 has the highest PR of about 90% for all given conditions, followed by CIGS #2 and mono-Si #1 with a PR of approximately 80%. In contrast, a-Si #1 performs a low PR of below 70%.
Figure 10.
Percentage changes in daily average PR of 10 solar PV systems between baseline and three given conditions for PM2.5 pollution in Hong Kong.
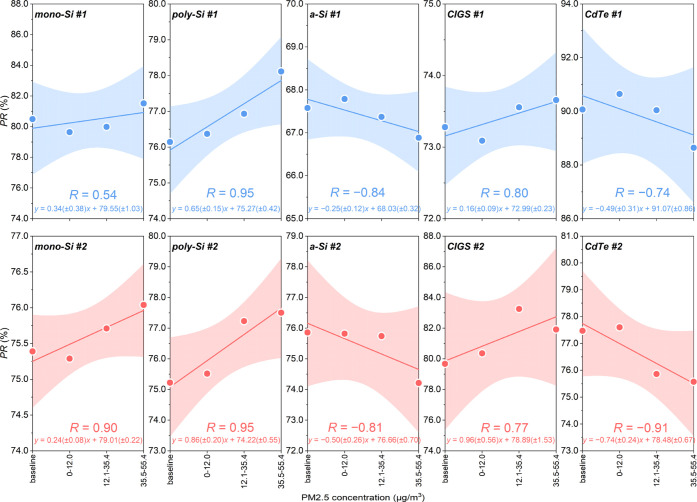
Furthermore, the linear regression trends for each PV system are shown in Figure 11. Positive trends are shown in all mono-Si, poly-Si, and CIGS systems with average R of 0.72, 0.95, and 0.79, respectively, demonstrating that the PR can be improved during the period with heavy PM2.5 pollution. However, PM2.5 leads to adverse effects on the PR of a-Si and CdTe systems since a negative trend with an average R of 0.83 is observed throughout the considered experimental period. The primary cause for the variation trends in the PR of the PV modules is the difference in solar cell spectral response. In general, the c-Si PV module has a wide range of spectral response from 300 to 1150 nm, and the corresponding range of the CIGS PV module is rather similar to c-Si. In contrast, the a-Si and CdTe PV modules are characteristic with a narrow spectral response range between around 300 and 900 nm,49 indicating that the a-Si and CdTe PV modules are more sensitive to the red-shifted solar spectrum caused by PM2.5. Besides, Liu et al.50 considered the output current to be a dominant cause for the changes in the PR of PV systems. Meanwhile, it is worth pointing out that all PV systems show trends not significantly different from 0 (p > 0.05), which may be due to the limited levels of PM2.5 pollution conditions acquired in Hong Kong during the experiment. Thus, further studies are necessary to be conducted in areas where a wider range of pollution conditions can be obtained.
Figure 11.
Daily average PR of mono-Si, poly-Si, a-Si, CIGS, and CdTe PV technologies with linear regression trends for the given PM2.5 pollution conditions. The least-square linear regression function and R are provided in each plot. Shaded areas indicate 95% confidence intervals.
5. Conclusions
In this study, the reduction of the available solar energy resources in Hong Kong induced by PM2.5 was assessed. Furthermore, quantitative impact of PM2.5 on the energy performance of different solar PV technologies was provided based on an on-site experiment. The main conclusions are summarized as follows:
-
(1)
The attenuation effect of PM2.5 on the available solar energy resource becomes more significant as the concentration of PM2.5 increases. In most months, the maximum PM2.5-related reduction in the average daily global horizontal irradiance exceeded 5% relative to the condition under the clear sky without air pollution.
-
(2)
The changes in the daily point-of-array irradiance range from −0.67 to −8.33% compared with the baseline, with a significant decreasing trend. Meanwhile, the reduction in solar irradiance incident on the PV surface results in a slight drop in the temperature of all PV modules. Also, the decrease in ambient temperature partly contributed to the cooler PV modules.
-
(3)
The adverse impact of PM2.5 on the energy performance of PV modules is more significant for the thin-film solar cells with a large band gap (such as a-Si and CdTe solar cells) than crystalline silicon technologies. The measured average maximum relative reduction in the net AC energy output and the final yield of crystalline silicon PV modules was 7.00%, while the value was up to 9.73% for thin-film PV modules. Poly-Si systems experienced minor losses with a relative reduction of around 6% under the condition with a heavy PM2.5 pollution of 35.5–55.4 μg/m3. In contrast, the energy output of CdTe and a-Si PV systems decreased on average by approximately 10% under such conditions.
-
(4)
The performance ratio of mono-Si, poly-Si, and CIGS PV systems with a wide range of spectral response showed a positive trend with the increase of PM2.5 concentration. In contrast, a negative trend was observed in the performance ratio of a-Si and CdTe PV systems with a narrower spectral response range. However, all PV systems show trends not significantly different from 0.
Acknowledgments
The work described in this paper was primarily supported by the Ph.D. studentship of The Hong Kong Polytechnic University. We appreciate the financial support provided by the Hong Kong Electrical and Mechanical Services Department for completing the experiments. We also wish to express our deep gratitude to the Hong Kong Observatory, the Hong Kong Environmental Protection Department, and the Air Quality Historical Data Platform for providing the historical solar irradiation records, meteorological data, and air quality data.
Supporting Information Available
The Supporting Information is available free of charge at https://pubs.acs.org/doi/10.1021/acsenvironau.1c00048.
Details on PV module specifications, additional quantitative results of PV energy performance, calibration of PV power output from optimizers, correlation analysis of PM2.5 concentration measurements, and all symbols (PDF)
Author Contributions
Z.S. contributed to conceptualization, methodology, software, validation, formal analysis, investigation, data curation, writing—original draft, writing—review & editing, and visualization. M.W. contributed conceptualization, methodology, formal analysis, investigation, and writing—review & editing. H.Y. contributed to Writing—review and editing, supervision, and project administration. The manuscript was written through contributions of all authors. All authors have given approval to the final version of the manuscript.
The authors declare no competing financial interest.
Supplementary Material
References
- Frankfurt School-UNEP Centre/BNEF . Global Trends in Renewable Energy Investment 2020: Frankfurt am Main, 2020.
- REN21. Renewables . 2021 Global Status Report: Paris, 2021.
- Das U. K.; Tey K. S.; Seyedmahmoudian M.; Mekhilef S.; Idris M. Y. I.; Van Deventer W.; Horan B.; Stojcevski A. Forecasting of Photovoltaic Power Generation and Model Optimization: A Review. Renewable Sustainable Energy Rev. 2018, 81, 912–928. 10.1016/j.rser.2017.08.017. [DOI] [Google Scholar]
- Lave M.; Hayes W.; Pohl A.; Hansen C. W. Evaluation of Global Horizontal Irradiance to Plane-of-Array Irradiance Models at Locations Across the United States. IEEE J. Photovol. 2015, 5, 597–606. 10.1109/JPHOTOV.2015.2392938. [DOI] [Google Scholar]
- Wang P.; van Westrhenen R.; Meirink J. F.; van der Veen S.; Knap W. Surface Solar Radiation Forecasts by Advecting Cloud Physical Properties Derived from Meteosat Second Generation Observations. Sol. Energy 2019, 177, 47–58. 10.1016/j.solener.2018.10.073. [DOI] [Google Scholar]
- Gutiérrez C.; Somot S.; Nabat P.; Mallet M.; Corre L.; Meijgaard E. v.; Perpiñán O.; Gaertner M. Á. Future evolution of surface solar radiation and photovoltaic potential in Europe: investigating the role of aerosols. Environ. Res. Lett. 2020, 15, 034035. 10.1088/1748-9326/ab6666. [DOI] [Google Scholar]
- Ajith M.; Martínez-Ramón M. Deep Learning Based Solar Radiation Micro Forecast by Fusion of Infrared Cloud Images and Radiation Data. Appl. Energy 2021, 294, 117014. 10.1016/j.apenergy.2021.117014. [DOI] [Google Scholar]
- Eltbaakh Y. A.; Ruslan M. H.; Alghoul M. A.; Othman M. Y.; Sopian K.; Razykov T. M. Solar Attenuation by Aerosols: An Overview. Renewable Sustainable Energy Rev. 2012, 16, 4264–4276. 10.1016/j.rser.2012.03.053. [DOI] [Google Scholar]
- Khalil S. A.; Shaffie A. M. Attenuation of the Solar Energy by Aerosol Particles: A Review and Case Study. Renewable Sustainable Energy Rev. 2016, 54, 363–375. 10.1016/j.rser.2015.09.085. [DOI] [Google Scholar]
- Song Z.; Liu J.; Yang H. Air Pollution and Soiling Implications for Solar Photovoltaic Power Generation: A Comprehensive Review. Appl. Energy 2021, 298, 117247. 10.1016/j.apenergy.2021.117247. [DOI] [Google Scholar]
- Zhang C.; Shen C.; Yang Q.; Wei S.; Lv G.; Sun C. An Investigation on the Attenuation Effect of Air Pollution on Regional Solar Radiation. Renewable Energy 2020, 161, 570–578. 10.1016/j.renene.2020.07.146. [DOI] [Google Scholar]
- Li X.; Wagner F.; Peng W.; Yang J.; Mauzerall D. L. Reduction of Solar Photovoltaic Resources Due to Air Pollution in China. Proc. Natl. Acad. Sci. 2017, 114, 11867–11872. 10.1073/pnas.1711462114. [DOI] [PMC free article] [PubMed] [Google Scholar]
- Peters I. M.; Karthik S.; Liu H.; Buonassisi T.; Nobre A. Urban Haze and Photovoltaics. Energy Environ. Sci. 2018, 11, 3043–3054. 10.1039/c8ee01100a. [DOI] [Google Scholar]
- Li X.; Mauzerall D. L.; Bergin M. H. Global Reduction of Solar Power Generation Efficiency Due to Aerosols and Panel Soiling. Nat. Sustainable 2020, 3, 720–727. 10.1038/s41893-020-0553-2. [DOI] [Google Scholar]
- Sweerts B.; Pfenninger S.; Yang S.; Folini D.; van der Zwaan B.; Wild M. Estimation of Losses in Solar Energy Production from Air Pollution in China since 1960 Using Surface Radiation Data. Nat. Energy 2019, 4, 657–663. 10.1038/s41560-019-0412-4. [DOI] [Google Scholar]
- Dasari H. P.; Desamsetti S.; Langodan S.; Attada R.; Kunchala R. K.; Viswanadhapalli Y.; Knio O.; Hoteit I. High-Resolution Assessment of Solar Energy Resources over the Arabian Peninsula. Appl. Energy 2019, 248, 354–371. 10.1016/j.apenergy.2019.04.105. [DOI] [Google Scholar]
- SolarPower Europe . Global Market Outlook 2020–2024, 2020.
- Bergin M. H.; Ghoroi C.; Dixit D.; Schauer J. J.; Shindell D. T. Large Reductions in Solar Energy Production Due to Dust and Particulate Air Pollution. Environ. Sci. Technol. Lett. 2017, 4, 339–344. 10.1021/acs.estlett.7b00197. [DOI] [Google Scholar]
- Gutiérrez C.; Somot S.; Nabat P.; Mallet M.; Gaertner M. Á.; Perpiñán O. Impact of Aerosols on the Spatiotemporal Variability of Photovoltaic Energy Production in the Euro-Mediterranean Area. Sol. Energy 2018, 174, 1142–1152. 10.1016/j.solener.2018.09.085. [DOI] [Google Scholar]
- Peters I. M.; Karthik S.; Buonassisi T.; Nobre A.. The Impact of Fine Particular Matter (PM2.5) on Photovoltaic Energy Yield - A Study on the Example of New Delhi. In 7th IEEE World Conference on Photovoltaic Energy Conversion (WCPEC)/A Joint Conference of 45th IEEE PVSC/28th PVSEC/34th EU PVSEC; IEEE: Waikoloa, HI, 2018; pp 2581–2583.
- Son J.; Jeong S.; Park H.; Park C.-E. The Effect of Particulate Matter on Solar Photovoltaic Power Generation over the Republic of Korea. Environ. Res. Lett. 2020, 15, 84004. 10.1088/1748-9326/ab905b. [DOI] [Google Scholar]
- Del Hoyo M.; Rondanelli R.; Escobar R. Significant Decrease of Photovoltaic Power Production by Aerosols. The Case of Santiago de Chile. Renew. Energy 2020, 148, 1137–1149. 10.1016/j.renene.2019.10.005. [DOI] [Google Scholar]
- Mah D. N.-y.; Wang G.; Lo K.; Leung M. K. H.; Hills P.; Lo A. Y. Barriers and Policy Enablers for Solar Photovoltaics (PV) in Cities: Perspectives of Potential Adopters in Hong Kong. Renewable Sustainable Energy Rev. 2018, 92, 921–936. 10.1016/j.rser.2018.04.041. [DOI] [Google Scholar]
- Lam J. C. K.; Cheung L. Y. L.; Wang S.; Li V. O. K. Stakeholder Concerns of Air Pollution in Hong Kong and Policy Implications: A Big-Data Computational Text Analysis Approach. Environ. Sci. Policy 2019, 101, 374–382. 10.1016/j.envsci.2019.07.007. [DOI] [Google Scholar]
- Cheung C. W.; He G.; Pan Y. Mitigating the Air Pollution Effect? The Remarkable Decline in the Pollution-Mortality Relationship in Hong Kong. J. Environ. Econ. Manage. 2020, 101, 102316. 10.1016/j.jeem.2020.102316. [DOI] [PMC free article] [PubMed] [Google Scholar]
- Li Y.; Lin C.; Lau A. K. H.; Liao C.; Zhang Y.; Zeng W.; Li C.; Fung J. C. H.; Tse T. K. T. Assessing Long-Term Trend of Particulate Matter Pollution in the Pearl River Delta Region Using Satellite Remote Sensing. Environ. Sci. Technol. 2015, 49, 11670–11678. 10.1021/acs.est.5b02776. [DOI] [PubMed] [Google Scholar]
- Lin C.; Lau A. K. H.; Fung J. C. H.; Lao X. Q.; Li Y.; Li C. Assessing the Effect of the Long-Term Variations in Aerosol Characteristics on Satellite Remote Sensing of PM2.5 Using an Observation-Based Model. Environ. Sci. Technol. 2019, 53, 2990–3000. 10.1021/acs.est.8b06358. [DOI] [PubMed] [Google Scholar]
- Sun S.; Cao W.; Pun V. C.; Qiu H.; Ge Y.; Tian L. Respirable Particulate Constituents and Risk of Cause-Specific Mortality in the Hong Kong Population. Environ. Sci. Technol. 2019, 53, 9810–9817. 10.1021/acs.est.9b01635. [DOI] [PubMed] [Google Scholar]
- Pang H.; Close J.; Lam K.. Study on Effect of Urban Pollution to Performance of Commercial Copper Indium Diselenide Modules. In 2006 IEEE 4th World Conference on Photovoltaic Energy Conference, 2006; Vol. 2, pp 2195–2198.
- U.S. Environmental Protection Agency . Air Quality Index (AQI) Basics. https://www.airnow.gov/aqi/aqi-basics/ (accessed Aug 28, 2021).
- Younes S.; Claywell R.; Muneer T. Quality Control of Solar Radiation Data: Present Status and Proposed New Approaches. Energy 2005, 30, 1533–1549. 10.1016/j.energy.2004.04.031. [DOI] [Google Scholar]
- Song Z.; Ren Z.; Deng Q.; Kang X.; Zhou M.; Liu D.; Chen X. General Models for Estimating Daily and Monthly Mean Daily Diffuse Solar Radiation in China’s Subtropical Monsoon Climatic Zone. Renew. Energy 2020, 145, 318–332. 10.1016/j.renene.2019.06.019. [DOI] [Google Scholar]
- Hassan M. A.; Akoush B. M.; Abubakr M.; Campana P. E.; Khalil A. High-Resolution Estimates of Diffuse Fraction Based on Dynamic Definitions of Sky Conditions. Renew. Energy 2021, 169, 641–659. 10.1016/j.renene.2021.01.066. [DOI] [Google Scholar]
- Paulescu E.; Blaga R. A Simple and Reliable Empirical Model with Two Predictors for Estimating 1-Minute Diffuse Fraction. Sol. Energy 2019, 180, 75–84. 10.1016/j.solener.2019.01.029. [DOI] [Google Scholar]
- Gueymard C. A.; Ruiz-Arias J. A. Extensive Worldwide Validation and Climate Sensitivity Analysis of Direct Irradiance Predictions from 1-Min Global Irradiance. Sol. Energy 2016, 128, 1–30. 10.1016/j.solener.2015.10.010. [DOI] [Google Scholar]
- Hassan M. A.; Khalil A.; Kaseb S.; Kassem M. A. Independent Models for Estimation of Daily Global Solar Radiation: A Review and a Case Study. Renewable Sustainable Energy Rev. 2018, 82, 1565–1575. 10.1016/j.rser.2017.07.002. [DOI] [Google Scholar]
- Hassan M. A.; Khalil A.; Kaseb S.; Kassem M. A. Exploring the Potential of Tree-Based Ensemble Methods in Solar Radiation Modeling. Appl. Energy 2017, 203, 897–916. 10.1016/j.apenergy.2017.06.104. [DOI] [Google Scholar]
- Nobre A. M.; Karthik S.; Liu H.; Yang D.; Martins F. R.; Pereira E. B.; Rüther R.; Reindl T.; Peters I. M. On the Impact of Haze on the Yield of Photovoltaic Systems in Singapore. Renewable Energy 2016, 89, 389–400. 10.1016/j.renene.2015.11.079. [DOI] [Google Scholar]
- Ineichen P.; Perez R. A New Airmass Independent Formulation for the Linke Turbidity Coefficient. Sol. Energy 2002, 73, 151–157. 10.1016/S0038-092X(02)00045-2. [DOI] [Google Scholar]
- Holmgren W. F.; Hansen C. W.; Mikofski M. A. Pvlib Python: A Python Package for Modeling Solar Energy Systems. J. Open Source Softw. 2018, 3, 884. 10.21105/joss.00884. [DOI] [Google Scholar]
- Reno M. J.; Hansen C. W.; Stein J. S.. Global Horizontal Irradiance Clear Sky Models: Implementation and Analysis: Albuquerque, New Mexico and Livermore, California, 2012.
- ISE . Photovoltaics Report: Freiburg, 2021.
- Mateo C.; Hernández-Fenollosa M. A.; Montero Á.; Seguí-Chilet S. Ageing and Seasonal Effects on Amorphous Silicon Photovoltaic Modules in a Mediterranean Climate. Renew. Energy 2022, 186, 74–88. 10.1016/j.renene.2021.12.086. [DOI] [Google Scholar]
- Wilson G. M.; Al-Jassim M.; Metzger W. K.; Glunz S. W.; Verlinden P.; Xiong G.; Mansfield L. M.; Stanbery B. J.; Zhu K.; Yan Y.; Berry J. J.; Ptak A. J.; Dimroth F.; Kayes B. M.; Tamboli A. C.; Peibst R.; Catchpole K.; Reese M. O.; Klinga C. S.; Denholm P.; Morjaria M.; Deceglie M. G.; Freeman J. M.; Mikofski M. A.; Jordan D. C.; TamizhMani G.; Sulas-Kern D. B. The 2020 Photovoltaic Technologies Roadmap. J. Phys. D: Appl. Phys. 2020, 53, 493001. 10.1088/1361-6463/ab9c6a. [DOI] [Google Scholar]
- Benda V.; Černá L. PV Cells and Modules—State of the Art, Limits and Trends. Heliyon 2020, 6, e05666 10.1016/j.heliyon.2020.e05666. [DOI] [PMC free article] [PubMed] [Google Scholar]
- Dierauf T.; Growitz A.; Kurtz S.; Becerra Cruz J. L.; Riley E.; Hansen C.. Weather-Corrected Performance Ratio: Golden, Colorado, 2013.
- Yan L.; Bai Y.; Yang B.; Chen N.; Tan Z. a.; Hayat T.; Alsaedi A. Extending Absorption of Near-Infrared Wavelength Range for High Efficiency CIGS Solar Cell via Adjusting Energy Band. Curr. Appl. Phys. 2018, 18, 484–490. 10.1016/j.cap.2017.12.015. [DOI] [Google Scholar]
- Dirnberger D.Uncertainties in Energy Rating for Thin-Film PV Modules; Fraunhofer Institute for Solar Energy Systems, 2015. [Google Scholar]
- Dirnberger D.; Blackburn G.; Müller B.; Reise C. On the Impact of Solar Spectral Irradiance on the Yield of Different PV Technologies. Sol. Energy Mater. Sol. Cells 2015, 132, 431–442. 10.1016/j.solmat.2014.09.034. [DOI] [Google Scholar]
- Liu H.; Nobre A. M.; Yang D.; Ye J. Y.; Martins F. R.; Ruther R.; Reindl T.; Aberle A. G.; Peters I. M. The Impact of Haze on Performance Ratio and Short-Circuit Current of PV Systems in Singapore. IEEE J. Photovolt. 2014, 4, 1585–1592. 10.1109/JPHOTOV.2014.2346429. [DOI] [Google Scholar]
Associated Data
This section collects any data citations, data availability statements, or supplementary materials included in this article.


