

Abstract
Background:
Evidence suggests that depression may be a risk factor for dementia in older adults, but the link between depressive symptoms and brain health earlier in life is less understood. Our aim was to investigate the association between long-term depressive symptoms in young to mid-adulthood and a measure of brain age derived from structural MRI.
Methods:
From the Coronary Artery Risk Development in Young Adults study, we identified 649 participants (age 23–36 at baseline) with brain MRI and cognitive testing. Long-term depressive symptoms were measured with the Center for Epidemiological Studies Depression scale (CES–D) six times across 25 years and analyzed as time-weighted averages (TWA). Brain age was derived using previously validated high dimensional neuroimaging pattern analysis, quantifying individual differences in age-related atrophy. Elevated depressive symptoms were defined as CES-D ≥16. Linear regression was used to test the association between TWA depressive symptoms, brain aging, and cognition.
Results:
Each standard deviation (5-points) increment in TWA depression symptoms over 25 years was associated with one-year greater brain age (β: 1.14, 95 % confidence interval [CI]: 0.57 to 1.71). Participants with elevated TWA depressive symptoms had on average a 3-year greater brain age (β: 2.75, 95 % CI: 0.43 to 5.08). Moreover, elevated depressive symptoms were associated with higher odds of poor cognitive function in midlife (OR: 3.30, 95 % CI: 1.37 to 7.97).
Limitations:
Brain age was assessed at one time, limiting our ability to evaluate the temporality of depressive symptoms and brain aging.
Conclusions:
Elevated depressive symptoms in early adulthood may have implications for brain health as early as in midlife.
Keywords: Depression, Midlife, Neuroimaging, Brain age, Cohort study, Longitudinal study
1. Introduction
Evidence suggests that depression is linked to a higher risk of dementia and cognitive decline. People with a history of depression are more likely to exhibit cognitive impairment, and among older persons with dementia, the presence of depression is associated with faster cognitive decline (Barnes et al., 2012; de Nooij et al., 2020; Rapp et al., 2011; Yang et al., 2021). Neuroimaging studies have also elucidated brain abnormalities prevalent in patients with depression, the most prominent being reduced hippocampal volume (Bremner et al., 2000; Gray et al., 2020). Additionally, studies have found a significant overlap between the biological pathways related to depression and those that accompany the aging process, suggesting that depressive disorders likely contribute to accelerated brain aging (Geerlings et al., 2013; Han et al., 2021b; Wolkowitz et al., 2010). However, it still remains unclear how depressive symptoms are related cognitive decline and brain aging across the lifespan, especially from early adulthood to mid-life.
Less is known about the relationship between depressive symptoms, especially early adulthood symptoms, and neurocognitive outcomes in midlife. In a small neuroimaging study in men, depressive symptoms at age 51 were associated with a reduced volume of the hippocampus at age 59 (Osler et al., 2018). More studies are needed to understand the relationship between depressive symptoms across early to mid-adulthood and brain aging in midlife, as this period in life is where divergence between healthy aging and non-healthy aging may begin, as well as being characterized by sizeable variation across individuals (Raz et al., 2005), making it a window of opportunity for treatment.
Aging-related brain differences in midlife may be subtle and more difficult to detect; however, structural MRI data allows for examination of brain markers of advanced aging, such as the level of atrophy expected for a particular age (Habes et al., 2016). One approach utilizes a machine-learning technique for identifying individual-level variability in brain aging. This “brain age” is a marker of how much “older” or “younger” a given brain appears relative to the individual’s chronological age. Such machine learning approaches are more sensitive than traditional neuroimaging techniques in detecting subtle differences, which is particularly useful when studying a younger population (Habes et al., 2021).
This study aims to investigate whether depressive symptoms from young to mid-adulthood are associated with brain age by following a large cohort of participants with repeated depressive symptom assessments from early adulthood to middle age across 25 years. This insight will be pivotal in understanding the role of depression in age-related brain differences.
2. Methods
2.1. Study population
The Coronary Artery Risk Development in Young Adults (CARDIA) study is a prospective cohort study investigating the development of and risk factors for cardiovascular disease (Friedman et al., 1988). Briefly, starting in 1985, 5115 Black and White adults between 18 and 30 years of age were recruited from population-based samples of 4 US cities (Birmingham, AL; Chicago, IL; Minneapolis, MN; and Oakland, CA). Within each center, recruitment was balanced by sex, age, and educational level. Participants completed follow-up examinations every 2 to 5 years for 30 years: 1987 to 1988 (Year 2), 1990 to 1991 (Year 5), 1992 to 1993 (Year 7), 1995 to 1996 (Year 10), 2000 to 2001 (Year 15), 2005 to 2006 (Year 20), 2010 to 2011 (Year 25), and 2015–2016 (Year 30). Depressive symptoms were assessed starting Year 5, which is the baseline for this study. At each examination, participants provided written informed consent, and study protocols were approved by institutional review boards at each study site and the CARDIA Coordinating Center. Further details regarding the design and recruitment of CARDIA have been previously reported (Friedman et al., 1988).
Brain magnetic resonance imaging (MRI) was conducted at 3 out of the 4 CARDIA sites (Birmingham, Minneapolis, and Oakland) at Year 30 (2015–2016). Our sample consists of the 662 CARDIA participants who underwent MRI scanning. Further inclusion criteria were assessment for depressive symptoms at least at 3 time points, including at Year 30, resulting in our analytic cohort of 649 adults.
2.2. Assessment of depressive symptoms
The participants underwent repeated assessments for depressive symptoms in the past week measured with the Center for Epidemiological Studies Depression scale (CES–D) (Radloff, 1977) during each follow up visit every 5 years between 1990 and 2016. The CES-D range is 0–60, and a score of 16 points or more is considered dysthymic. Questionnaire data on antidepressant medication use were collected during the four latest visits.
2.3. Neuroimaging protocol
The MRI scans were acquired on 3 T scanners located at each CARDIA study sites: Siemens 3 T Tim Trio/VB15 platform in Minneapolis and in Oakland and Philips 3 T Achieva/2.6.3.6 platform in Birmingham. Standard quality assurance protocols using phantoms previously developed for the Functional Bioinformatics Research Network and the Alzheimer’s disease Neuroimaging Initiative were used. Structural images used for this study were acquired with 1 mm isotropic 3D T1 and T2 sequences. Scan acquisition parameters have been previously described (Launer et al., 2015), and were processed using previously described methods (Dinggang Shen and Davatzikos, 2002; Goldszal et al., 1998; Zacharaki et al., 2008). In brief, structural images were processed using an automated multispectral computer algorithm which classified all supratentorial brain tissue into gray matter, white matter, and cerebral spinal fluid and identifies anatomic regions of interest (ROI). After correction of intensity inhomogeneities (Tustison et al., 2010), a multi-atlas skull stripping algorithm was applied for the removal of extra-cerebral tissues (Doshi et al., 2013). Each T1-weighted scan was then automatically segmented into a set of anatomical gray matter ROIs using a multi-atlas label fusion method (Doshi et al., 2016). The images were visually checked for incidental findings, motion artefacts, and other quality issues.
2.4. Calculation of brain age
We used a previously validated high dimensional neuroimaging pattern analysis, based on machine learning algorithms, that quantifies individual differences in age-related atrophy using MRI-derived structural brain characteristics, called Spatial Pattern of Atrophy for Recognition of Brain Aging (SPARE-BA) (Eavani et al., 2018; Habes et al., 2016; Habes et al., 2021). This method has been validated in several cohort studies including CARDIA (Eavani et al., 2018; Habes et al., 2016; Habes et al., 2018, 2021). Briefly, SPARE-BA was derived using 10,216 participants from the Imaging-based coordinate SysTem for AGing and NeurodeGenerative diseases (iSTAGING) consortium encompassing a wide age range (22 to 90 years), with cognitively healthy individuals (n = 8284). The iSTAGING consortium included data from 11 cohorts including CARDIA. The machine learning model predicts brain age based on a comparison against age-expected atrophy. Higher SPARE-BA values indicate greater age-related atrophy based upon normative trends of age-related changes in brain structure (Habes et al., 2016; Habes et al., 2021).
2.5. Cognitive function assessment
CARDIA technicians who underwent formal training and certification administered a battery of cognitive tests at the Year 30 examination that included the Digit Symbol Substitution Test (DSST), the Stroop Test, the Rey Auditory Verbal Learning Test (RAVLT), and Verbal Fluency (category and letter fluency) (Reis et al., 2013). Each test score was converted into z-scores, which were then added into a “global” cognitive composite score. Poor cognitive function was defined as cognitive composite ≥1 SD below the mean at Year 30, as previously used in CARDIA (Hoang et al., 2016) and other population-based studies (McEvoy et al., 2017).
2.6. Covariates
Demographic characteristics, cigarette smoking (in years), and alcohol consumption (ml/day) were based on self-report. Self-reported annual family income was measured on a 9-point scale ranging from less than $5000 (1) to $100,000 or more (9), dichotomized as income above or below the median income category ($50,000 through $74,999). Body mass index (BMI) was calculated as weight in kilograms divided by height in meters squared. Physical activity was measured with the CARDIA Physical Activity History questionnaire which queries the amount of time per week spent in 13 categories of leisure, occupational, and household physical activities over the past 12 months (Reis et al., 2013). Physical activity level was summarized as units of total activity incorporating moderate and high intensity activities.
2.7. Statistical analysis
Our primary predictor was a long-term measure of depressive symptoms over the 25 years of follow-up. This was done by first estimating the mean curve for depressive symptoms using linear mixed modeling of the repeated CES-D measurements obtained at all available visits, for each race and sex group. We used linear splines in age with knots at 35 and 45 years of age, for face validity and to ensure adequate numbers of observations in each of the 3 age ranges defined by the knots. The models also included 4 random effects, one corresponding to each of the fixed effects (including the intercept), with an unstructured covariance matrix. We then calculated participant-specific depressive symptom curves as the best linear unbiased predictions based on the mixed models. Next, we calculated areas under the curve (AUCs) over the interval from baseline to the Year 30 visit. Time-weighted averages (TWAs) of depressive symptoms were calculated as the AUC divided by the total time interval (time of last observation minus time of first observation).
We then used linear regression to assess the independent associations of TWA depressive symptoms and brain age at Year 30. In Model 1, we estimated the association adjusted chronological age, race, sex, education, intracranial volume (ICV), and scanning site. In Model 2, we further adjusted for antidepressant medication use. In Model 3, we further adjusted for smoking, alcohol consumption, BMI, diabetes, income, and physical exercise. To distinguish whether any association with predicted brain age was attributable to elevated depressive symptoms, we dichotomized the TWAs above and below a score of 16.
We also assessed interactions between depressive symptoms, sex, and race, respectively, on the association with brain age.
We used linear regression to assess the associations of TWA depressive symptoms with the composite cognitive measure at Year 30. Logistic regression was used to test the association between depressive symptoms and the odds of poor cognition at Year 30 (cognitive composite ≥1 SD below mean).
All analyses were completed with STATA version 15.1, and R 4.0.4. Significance testing was 2-sided with the significance level set at p < 0.05.
3. Results
At baseline, the mean CES-D score was 9.9 (SD 7.5) and at Year 30, the mean was 8.1 (SD 7.3) with mean TWA over the 25 years of 7.4 (SD 4.4). At Year 30, the mean brain age was 54.3 (SD 7.3) compared to chronological age; 55.3 (SD 3.5) (Table 1). Compared to participants in the lowest tertile of TWA CES–D, those in the second and third tertiles were more likely to be Black, have fewer years of education, more likely to have income below the median, more likely to be a current or former smoker at baseline, and exercised less.
Table 1.
Characteristics of the 649 CARDIA participants with brain MRI by depression symptoms.
| Variable mean (sd), n (%) | Time-weighted average depressive symptoms (CES-D) | p | ||
|---|---|---|---|---|
| Tertile 1 (0.6 to 5.1) | Tertile 2 (5.1 to 8.9) | Tertile 3 (8.9 to 25.6) | ||
| Age at baseline | 30.3 (3.5) | 30.4 (3.4) | 30 (3.4) | 0.959 |
| Age at Year 30 | 55.4 (3.5) | 55.2 (3.5) | 55.2 (3.5) | 0.777 |
| Brain age at Year 30 | 53.3 (6.5) | 53.6 (7.4) | 56.0 (7.7) | <0.001 |
| Female | 122 (53.0) | 118 (55.9) | 101 (48.6) | 0.314 |
| Black | 80 (34.8) | 76 (36.2) | 111 (53.1) | 0.020 |
| Education (years) | 14.7 (2.2) | 14.2 (2.2) | 13.5 (2.1) | <0.001 |
| Income <median | 66 (28.7) | 92 (43.6) | 131 (63.0) | <0.001 |
| Current/Former Smoker | 61 (26.5) | 71 (34.0) | 85 (41.7) | 0.004 |
| Alcohol consumption (ml/day) | 11.3 (16.2) | 11.4 (17.0) | 15.4 (25.9) | 0.059 |
| Body mass index | 28.1 (4.8) | 27.9 (4.9) | 28.2 (4.6) | 0.863 |
| Diabetes | 20 (8.8) | 17 (8.1) | 25 (12.2) | 0.315 |
| Physical exercise, exercise units | 391.9 (281.0) | 357.8 (268.2) | 285.8 (247.3) | <0.001 |
| Depressive symptoms (CES-D) | ||||
| Baseline | 5.3 (4.4) | 9.7 (6.1) | 15.5 (7.8) | <0.001 |
| Year 30 | 2.9 (2.7) | 7.0 (4.2) | 15.0 (7.9) | <0.001 |
| Time-weighted average | 3.2 (1.3) | 6.9 (1.1) | 12.9 (3.4) | <0.001 |
| Anti-depressant use | 15 (6.8) | 39 (20.1) | 71 (38.2) | <0.001 |
CARDIA, Coronary Artery Risk Development in Young Adults; CES–D, Center for Epidemiological Studies Depression scale.
Every standard deviation (5-points) higher TWA depressive symptoms over the 25 years was associated with approximately one-year greater brain age (Table 2). Participants with elevated average TWA depressive symptoms (n = 34, 5.2 %), had an almost 3-year greater brain age (β: 2.75, 95 % CI: 0.43 to 5.08), adjusting for chronological age, sex, education, race, scanning site and ICV (Fig. 1). Adjusting for antidepressant medication use at any time during the follow-up attenuated the association (β: 2.32, 95 % CI: −0.16 to 4.79). Additional adjustment for smoking, alcohol consumption, income, BMI, diabetes, and physical exercise further attenuated the association (β: 1.64, 95 % CI: −0.88 to 4.15). We also investigated if the age period of elevated depressive symptoms were differentially associated with brain age. Elevated TWA CES-D between ages 30–39 (n = 46) was associated with a 2.43 year older brain age compared to low depressive symptoms (95 % CI: 0.40 to 4.46); elevated TWA CES-D between ages 40–49 (n = 27) was associated with a 3.19 years older brain age compared to low depressive symptoms (95 % CI: 0.60 to 5.78); and elevated TWA CES-D between ages 50–59 (n = 85) was associated with a 1.82 years older brain age compared to low depressive symptoms (95 % CI: 0.12 to 3.52).
Table 2.
Association of time-weighted average depressive symptoms and brain age at midlife among 649 CARDIA participants.
| TWA Depressive symptoms | β-coefficient (95 % CI) Brain age | ||
|---|---|---|---|
| Model 1a | Model 2b | Model 3c | |
| Per 1-point increment | 0.26 (0.14 to 0.38) | 0.26 (0.13 to 0.39) | 0.19 (0.05 to 0.33) |
| Per 5-point increment | 1.14 (0.57 to 1.71) | 1.05 (0.42 to 1.67) | 0.65 (−0.01 to 1.31) |
CARDIA, Coronary Artery Risk Development in Young Adults; CI, confidence interval.
Adjusted for chronological age, sex, education, race, intracranial volume, and scanning site.
Additionally adjusted for anti-depressive medication use.
Additionally adjusted for income, alcohol consumption, smoking, BMI, diabetes, and physical exercise.
Fig. 1.
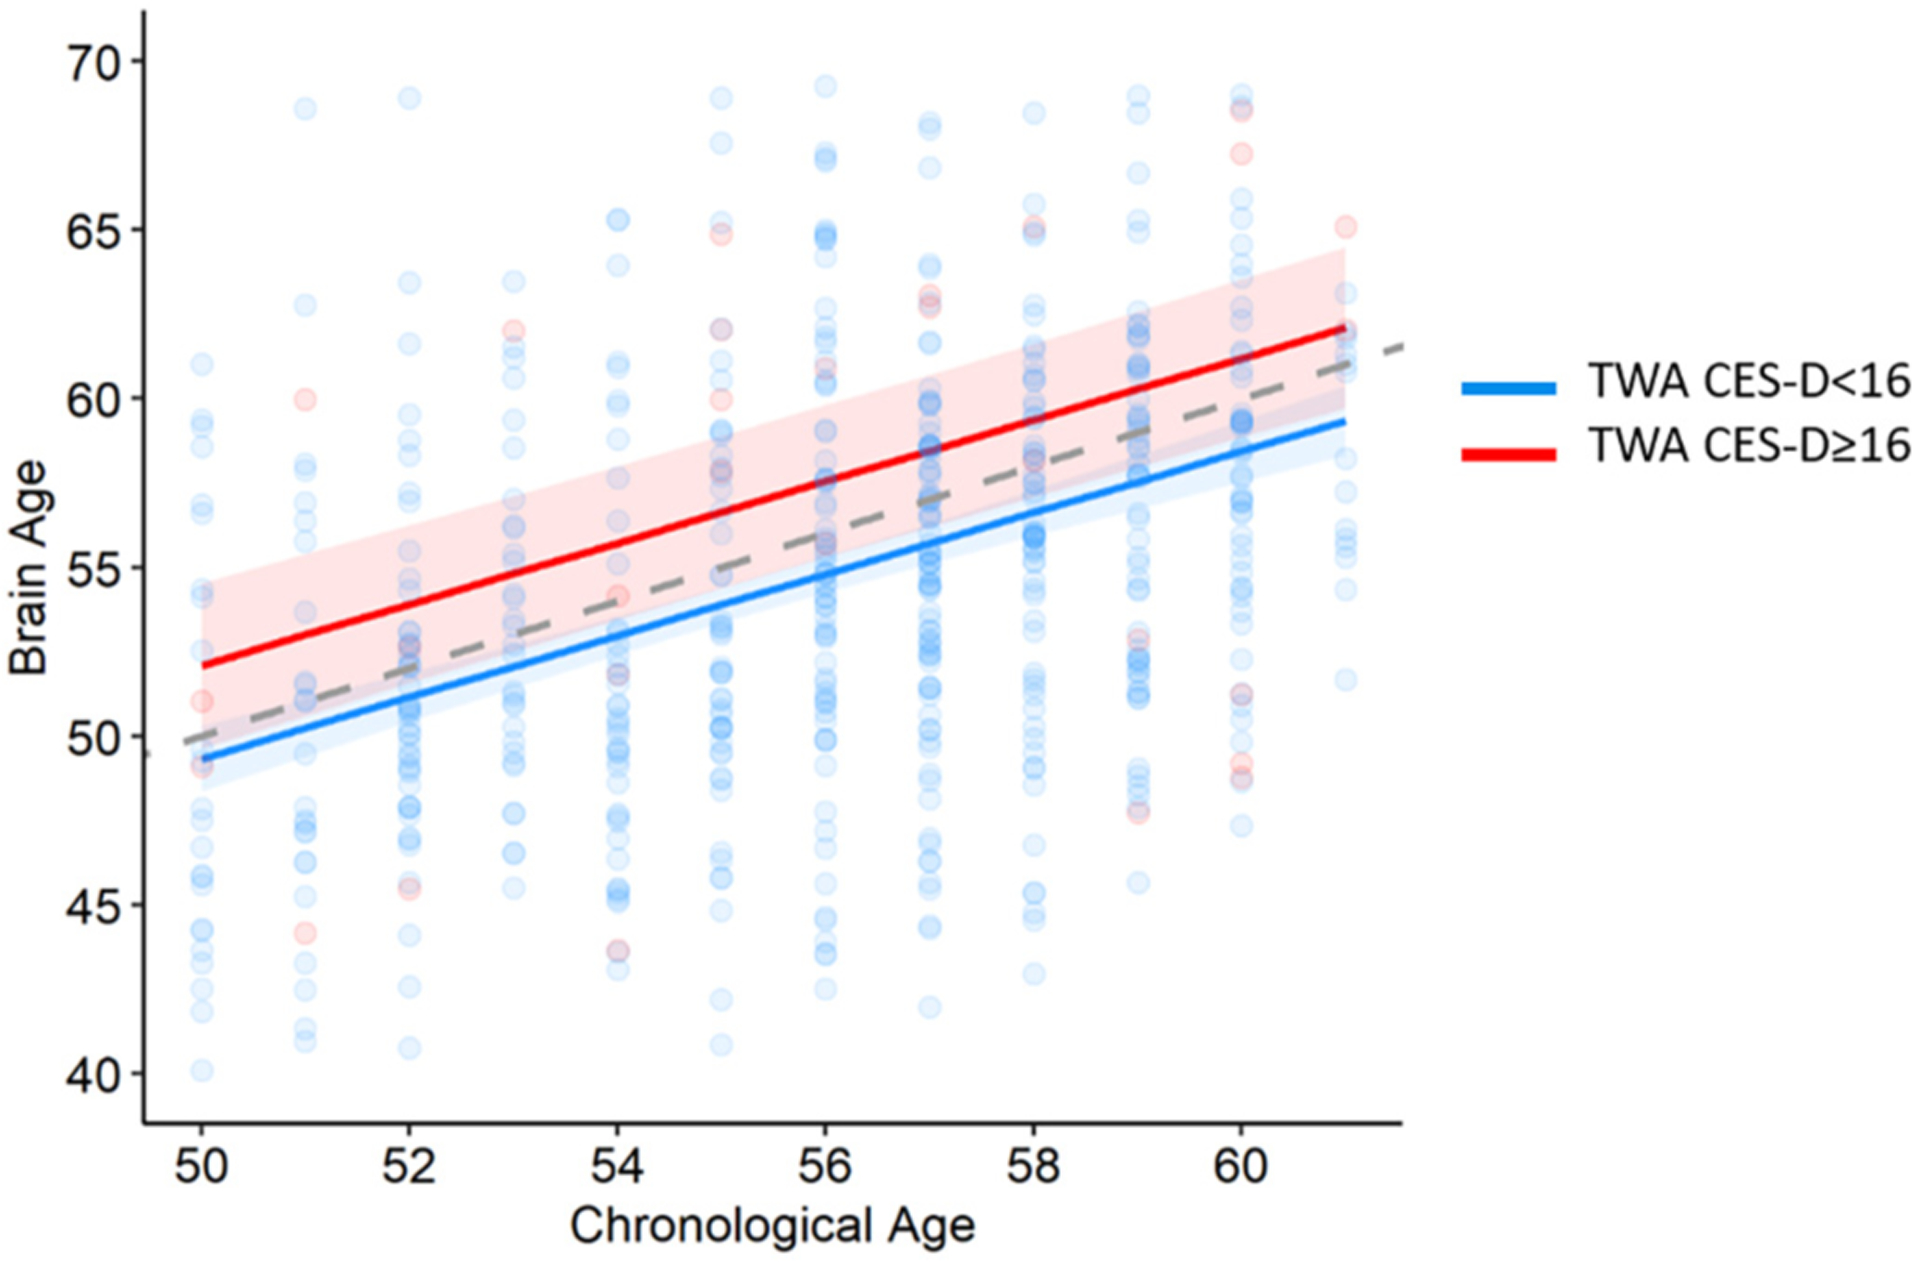
The association between elevated time-weighted depressive symptoms and brain aging.
Adjusted for sex, education, race, ICV, and scanning center. Elevated CES-D ≥16. Gray dashed line represents chronological age = Brain age.
In order to see if the participants with elevated depressive symptoms were driving the association between depressive symptoms and brain age, we re-ran the regression model excluding those with TWA CES-D scores over 16; every standard deviation (3.5-points) higher average TWA depressive symptoms was still associated with a one-year greater brain age (β: 1.02, 95 % CI: 0.33 to 1.71), adjusted for chronological age, race, sex, education, intracranial volume (ICV), and scanning site.
There were no significant interactions between depressive symptom TWA and sex and race respectively with brain age (p > 0.05).
Moreover, every standard deviation (5-points) higher average depressive symptoms over the 25 years was associated with a lower cognitive composite score (β: −0.13, 95 % CI: −0.18 to −0.08), adjusted for chronological age, sex, education, and race. Compared to participants with TWA depressive symptoms below 16, those with a TWA over 16 had 3 times higher odds of poor cognitive function in midlife (OR: 3.30, 95 % CI: 1.37 to 7.97). The odds were reduced when adjusting for antidepressant medication use (OR: 1.47, 95 % CI: 0.54 to 4.0). There was no interaction between TWA depressive symptoms and sex and race, respectively on odds of poor cognitive function (p > 0.05).
4. Discussion
In this biracial cohort of community-dwelling adults followed from early adulthood to midlife, we found that a) higher depressive symptoms across young to mid-adulthood are associated with greater brain age at midlife, and elevated depressive symptoms were associated with nearly a 3-year greater brain age, and b) higher depressive symptoms were associated with higher odds of poor cognitive function in midlife. These findings suggest that monitoring and treating depressive symptoms may be an important target for early intervention to mitigate the long-term adverse association of depression on brain health across the life course.
Several population-based studies in older adults have found depression to increase the risk of dementia and cognitive impairment (Kaup et al., 2016; Zeki Al Hazzouri et al., 2014; Zeki Al Hazzouri et al., 2018). However, in studies with older adults, when the risk factor being examined is influenced by early subclinical stages of dementia, there is a strong concern for reverse causality. Therefore, studies such as ours that focus on midlife outcomes are essential to reduce this bias. Previous studies using brain age estimation techniques examining adult depression have so far been inconclusive, with some studies reporting signs of accelerated aging in clinical depression and others indicating the opposite (Besteher et al., 2019; Christman et al., 2020; Han et al., 2021a; Schmaal et al., 2017). Most of these studies have wide age ranges, making it difficult to ascertain the relationship between depressive symptoms and brain aging in midlife. In the present study, we found that every standard deviation higher average CES-D score was associated with approximately 1 additional year of brain age in midlife. In addition, having an elevated average CES-D score, was associated with a brain age 3 years older than participants below the cut-off. These results suggest that elevated depressive symptoms across young to mid-adulthood may make the brain vulnerable to premature aging, even after adjusting for antidepressants and other confounders. Importantly, we found that even when the average depressive symptoms were under what is considered elevated, higher depressive symptoms were still associated with higher brain age. From a public health perspective, the findings of this study suggest that subclinical depressive symptoms may be an important target for early intervention in order to prevent progression to clinical depression and potential neurocognitive adverse outcomes. Subclinical depressive symptoms are often underdiagnosed and therefore under-treated (Cuijpers et al., 2013; Kumar et al., 1998), thus posing a significant public health concern. We also found that the period of life where depressive symptoms are elevated may be of importance; specifically, we found that elevated depressive symptoms during the 40s were associated with the highest brain age relative to chronological age a decade later. It may be that this period is particularly sensitive, however, this needs to be investigated further in future longitudinal studies.
Several mechanisms have been proposed for depression accelerating brain aging. Studies over the last 20 years have demonstrated that increased inflammation and hyperactivity of the hypothalamic–pituitary–adrenal (HPA) axis are two of the most consistent biological findings in major depression, which have been linked to premature aging (Fonken et al., 2018). Furthermore, over the past two decades, studies have highlighted a potential role for neurotrophic factors, in particular brain-derived neurotrophic factor (BDNF), in contributing to the pathophysiology and treatment of depression. Stress-evoked reduction of BDNF is implicated in dendritic atrophy, decline in hippocampal neurogenesis, and enhanced depressive-like behavior in animal models (Jaggar et al., 2019). In contrast, antidepressant-induction of BDNF expression is implicated in reversing neuronal atrophy, neurogenic decline, and enhanced despair in animal models of depression (Castŕen and Rantamäki, 2010). The vascular hypothesis, states that depression is associated with worse brain health through small vessel changes in mood-regulating areas such as the limbic system (Korgaonkar et al., 2011) resulting from or contributing to depression. Indeed, recurrent depression starting in midlife has been suggested to be etiologically associated with increased risk of vascular dementia (Barnes et al., 2012). Alternative explanations for the link between depression and adverse brain health could be underlying factors that explain both outcomes rather independently, such as low socio-economic status, childhood maltreatment or shared genetic effects (Penninx et al., 2013; Rutten-Jacobs et al., 2018).
Interestingly, adjusting for antidepressant use during the follow-up did not have much influence on the association between depressive symptoms and brain age. Studies on the effect of antidepressants on brain correlates have been inconsistent. One study examined the difference in brain age in medication-free individuals with clinical depression and its association with subsequent antidepressant treatment response. There was no difference in brain age between responders and non-responders after 16 weeks (Ballester et al., 2021). Findings from randomized control trials indicate that frontal lobe structural alterations in the first week of treatment with selective cortical thickness abnormalities may be responsive to treatment with serotonin reuptake inhibitors (SSRIs), which is one of the most common classes of antidepressant drugs (Bartlett et al., 2018; Nemati and Abdallah, 2020). In order to fully understand the effects of pharmacological treatments for depression on brain health, well-designed intervention trials with longer follow-up from young adulthood to midlife are warranted.
The strengths of this study include the diverse cohort of young Black and White individuals at enrolment, long duration of follow-up and assessment of depressive symptoms over 25 years, and use of the high dimensional neuroimaging pattern analysis that increases the statistical power to detect brain aging-related differences. Limitations of this study include that the brain age measures, while sensitive to volumetric changes of normal aging, could be affected by the presence of other, unmeasured neuropathology. Furthermore, brain age was assessed at one time, which limits our ability to evaluate the temporality of depressive symptoms and brain aging. Moreover, the CARDIA MRI sample, compared to the main CARDIA cohort, was more likely to be White, have more years of education, have lower depressive symptoms, and were generally in better health. Therefore, the selectivity of the study sample may limit the generalizability of the findings and bias the results towards an underestimation. Longitudinal studies are essential to understanding the mechanisms underpinning the relationship between depressive symptoms and brain aging and to assess the potential long-term benefits of antidepressant treatment, ideally through long-term, large trials or from longer-term follow-up of previously established trials and large cohorts.
In the present study, elevated depressive symptoms levels across young and mid-adulthood, even when below clinical significance, were associated with an advanced brain age of 1 year, whereas having elevated depressive symptoms over 25 years was associated with an advanced brain age of almost 3 years, as well as lower cognitive performance in midlife. Monitoring and treating depressive symptoms in young adulthood, could be an important target for maintaining a healthy brain in midlife and beyond.
Acknowledgements
The Coronary Artery Risk Development in Young Adults Study (CARDIA) is supported by contracts HHSN268201800003I, HHSN268201800004I, HHSN268201800005I, HHSN268201800006I, and HHSN268201800007I from the National Heart, Lung, and Blood Institute (NHLBI), and National Institute on Aging (NIA) R01 AG063887.
CARDIA was also partially supported by the Intramural Research Program of the NIA and an intra-agency agreement between NIA and NHLBI (AG0005). This work was also supported by NIA R35AG071916 (Yaffe) and an Alzheimer’s Association grant AARF-21-851960 (Dintica).
Footnotes
CRediT authorship contribution statement
CD is responsible for study conceptualization, data analysis, and drafting of the manuscript. MH and GE are responsible for processing and analyses of the neuroimaging data. TS is responsible for intellectual input and revision of the manuscript. PS and KY are responsible for data acquisition and revision of the manuscript. All authors contributed to the article and approved the submitted version.
The funding sources had no involvement in the study design; in the collection, analysis and interpretation of data; in the writing of the report; and in the decision to submit the article for publication.
Conflict of interest
None.
References
- Ballester PL, Suh JS, Nogovitsyn N, Hassel S, Strother SC, Arnott SR, Frey BN, 2021. Accelerated brain aging in major depressive disorder and antidepressant treatment response: a CAN-BIND report. NeuroImageClin. 32 10.1016/j.nicl.2021.102864. [DOI] [PMC free article] [PubMed] [Google Scholar]
- Barnes DE, Yaffe K, Byers AL, McCormick M, Schaefer C, Whitmer RA, 2012. Midlife vs late-life depressive symptoms and risk of dementia: differential effects for Alzheimer disease and vascular dementia. Arch. Gen. Psychiatry 69 (5), 493–498. 10.1001/archgenpsychiatry.2011.1481. [DOI] [PMC free article] [PubMed] [Google Scholar]
- Bartlett EA, DeLorenzo C, Sharma P, Yang J, Zhang M, Petkova E, Parsey RV, 2018. Pretreatment and early-treatment cortical thickness is associated with SSRI treatment response in major depressive disorder. Neuropsychopharmacology 43 (11), 2221–2230. 10.1038/s41386-018-0122-9. [DOI] [PMC free article] [PubMed] [Google Scholar]
- Besteher B, Gaser C, Nenadíc I, 2019. Machine-learning based brain age estimation in major depression showing no evidence of accelerated aging. Psychiatry Res. Neuroimaging 290, 1–4. 10.1016/j.pscychresns.2019.06.001. [DOI] [PubMed] [Google Scholar]
- Bremner JD, Narayan M, Anderson ER, Staib LH, Miller HL, Charney DS, 2000. Hippocampal volume reduction in major depression. Am. J. Psychiatr 157 (1), 115–118. 10.1176/ajp.157.1.115. [DOI] [PubMed] [Google Scholar]
- Castrén E, Rantamäki T, 2010. The role of BDNF and its receptors in depression and antidepressant drug action: reactivation of developmental plasticity. Dev.Neurobiol 70 (5), 289–297. 10.1002/dneu.20758. [DOI] [PubMed] [Google Scholar]
- Christman S, Bermudez C, Hao L, Landman BA, Boyd B, Albert K, Taylor WD, 2020. Accelerated brain aging predicts impaired cognitive performance and greater disability in geriatric but not midlife adult depression. Transl. Psychiatry 10 (1), 317. 10.1038/s41398-020-01004-z. [DOI] [PMC free article] [PubMed] [Google Scholar]
- Cuijpers P, Vogelzangs N, Twisk J, Kleiboer A, Li J, Penninx BW, 2013. Differential mortality rates in major and subthreshold depression: meta-analysis of studies that measured both. Br. J. Psychiatry 202 (1), 22–27. 10.1192/bjp.bp.112.112169. [DOI] [PubMed] [Google Scholar]
- de Nooij L, Harris MA, Adams MJ, Clarke T-K, Shen X, Cox SR, Whalley HC, 2020. Cognitive functioning and lifetime major depressive disorder in UK biobank. EurPsychiatry 63 (1). 10.1192/j.eurpsy.2020.24. [DOI] [PMC free article] [PubMed] [Google Scholar]
- Doshi J, Erus G, Ou Y, Gaonkar B, Davatzikos C, 2013. Multi-atlas skull-stripping. Acad. Radiol 20 (12), 1566–1576. 10.1016/j.acra.2013.09.010. [DOI] [PMC free article] [PubMed] [Google Scholar]
- Doshi J, Erus G, Ou Y, Resnick SM, Gur RC, Gur RE, Davatzikos C, 2016. MUSE: MUlti-atlas region Segmentation utilizing Ensembles of registration algorithms and parameters, and locally optimal atlas selection. NeuroImage 127, 186–195. 10.1016/j.neuroimage.2015.11.073. [DOI] [PMC free article] [PubMed] [Google Scholar]
- Eavani H, Habes M, Satterthwaite TD, An Y, Hsieh M-K, Honnorat N, Davatzikos C, 2018. Heterogeneity of structural and functional imaging patterns of advanced brain aging revealed via machine learning methods. Neurobiol. Aging 71, 41–50. 10.1016/j.neurobiolaging.2018.06.013. [DOI] [PMC free article] [PubMed] [Google Scholar]
- Fonken LK, Frank MG, Gaudet AD, Maier SF, 2018. Stress and aging act through common mechanisms to elicit neuroinflammatory priming. Brain Behav. Immun 73, 133–148. 10.1016/j.bbi.2018.07.012. [DOI] [PMC free article] [PubMed] [Google Scholar]
- Friedman GD, Cutter GR, Donahue RP, Hughes GH, Hulley SB, Jacobs DR, Savage PJ, 1988. Cardia: study design, recruitment, and some characteristics of the examined subjects. J. Clin. Epidemiol 41 (11), 1105–1116. 10.1016/0895-4356(88)90080-7. [DOI] [PubMed] [Google Scholar]
- Geerlings MI, Sigurdsson S, Eiriksdottir G, Garcia ME, Harris TB, Sigurdsson T, Launer LJ, 2013. Associations of current and remitted major depressive disorder with brain atrophy: the AGES–Reykjavik study. Psychol. Med 43 (2), 317–328. 10.1017/S0033291712001110. [DOI] [PMC free article] [PubMed] [Google Scholar]
- Goldszal AF, Davatzikos C, Pham DL, Yan MXH, Bryan RN, Resnick SM, 1998. An image-processing system for qualitative and quantitative volumetric analysis of brain images. J. Comput. Assist. Tomogr 22 (5), 827–837. 10.1097/00004728-199809000-00030. [DOI] [PubMed] [Google Scholar]
- Gray JP, Müller VI, Eickhoff SB, Fox PT, 2020. Multimodal abnormalities of brain structure and function in major depressive disorder: a meta-analysis of neuroimaging studies. Am. J. Psychiatr 177 (5), 422–434. 10.1176/appi.ajp.2019.19050560. [DOI] [PMC free article] [PubMed] [Google Scholar]
- Habes M, Janowitz D, Erus G, Toledo JB, Resnick SM, Doshi J, Davatzikos C, 2016. Advanced brain aging: relationship with epidemiologic and genetic risk factors, and overlap with Alzheimer disease atrophy patterns. Transl. Psychiatry 6 (4). 10.1038/tp.2016.39e775-e775. [DOI] [PMC free article] [PubMed] [Google Scholar]
- Habes Mohamad, Erus G, Toledo JB, Bryan N, Janowitz D, Doshi J, Davatzikos C, 2018. Regional tract-specific white matter hyperintensities are associated with patterns of aging-related brain atrophy via vascular risk factors, but also independently. AlzheimersDement. 10 (1), 278–284. 10.1016/j.dadm.2018.02.002. [DOI] [PMC free article] [PubMed] [Google Scholar]
- Habes Mohamad, Pomponio R, Shou H, Doshi J, Mamourian E, Erus G, Davatzikos C, 2021. The Brain Chart of Aging: machine-learning analytics reveals links between brain aging, white matter disease, amyloid burden, and cognition in the iSTAGING consortium of 10,216 harmonized MR scans. Alzheimers Dement. 17 (1), 89–102. 10.1002/alz.12178. [DOI] [PMC free article] [PubMed] [Google Scholar]
- Han LKM, Dinga R, Hahn T, Ching CRK, Eyler LT, Aftanas L, Schmaal L, 2021. Brain aging in major depressive disorder: results from the ENIGMA major depressive disorder working group. Mol. Psychiatry 26 (9), 5124–5139. 10.1038/s41380-020-0754-0. [DOI] [PMC free article] [PubMed] [Google Scholar]
- Han LKM, Schnack HG, Brouwer RM, Veltman DJ, van der Wee NJA, van Tol M-J, Penninx BWJH, 2021. Contributing factors to advanced brain aging in depression and anxiety disorders. Transl. Psychiatry 11 (1), 402. 10.1038/s41398-021-01524-2. [DOI] [PMC free article] [PubMed] [Google Scholar]
- Hoang TD, Reis J, Zhu N, Jacobs DR, Launer LJ, Whitmer RA, Yaffe K, 2016. Effect of early adult patterns of physical activity and television viewing on midlife cognitive function. JAMA Psychiatry 73 (1), 73. 10.1001/jamapsychiatry.2015.2468. [DOI] [PMC free article] [PubMed] [Google Scholar]
- Jaggar M, Fanibunda SE, Ghosh S, Duman RS, Vaidya VA, 2019. The neurotrophic hypothesis of depression revisited: new insights and therapeutic implications. In: Neurobiology of Depression. Elsevier, pp. 43–62. 10.1016/B978-0-12-813333-0.00006-8. [DOI] [Google Scholar]
- Kaup AR, Byers AL, Falvey C, Simonsick EM, Satterfield S, Ayonayon HN, Yaffe K, 2016. Trajectories of depressive symptoms in older adults and risk of dementia. JAMA Psychiatry 73 (5), 525–531. 10.1001/jamapsychiatry.2016.0004. [DOI] [PMC free article] [PubMed] [Google Scholar]
- Korgaonkar MS, Grieve SM, Koslow SH, Gabrieli JDE, Gordon E, Williams LM, 2011. Loss of white matter integrity in major depressive disorder: evidence using tract-based spatial statistical analysis of diffusion tensor imaging. Hum. Brain Mapp 32 (12), 2161–2171. 10.1002/hbm.21178. [DOI] [PMC free article] [PubMed] [Google Scholar]
- Kumar A, Jin Z, Bilker W, Udupa J, Gottlieb G, 1998. Late-onset minor and major depression: early evidence for common neuroanatomical substrates detected by using MRI. Proc. Natl. Acad. Sci. U. S. A 95 (13), 7654–7658. 10.1073/pnas.95.13.7654. [DOI] [PMC free article] [PubMed] [Google Scholar]
- Launer LJ, Lewis CE, Schreiner PJ, Sidney S, Battapady H, Jacobs DR, Bryan RN, 2015. Vascular factors and multiple measures of early brain health: CARDIA brain MRI study. PLOS ONE 10 (3), e0122138. 10.1371/journal.pone.0122138. [DOI] [PMC free article] [PubMed] [Google Scholar]
- McEvoy CT, Guyer H, Langa KM, Yaffe K, 2017. Neuroprotective diets are associated with better cognitive function: the health and retirement study. J. Am. Geriatr. Soc 65 (8), 1857–1862. 10.1111/jgs.14922. [DOI] [PMC free article] [PubMed] [Google Scholar]
- Nemati S, Abdallah CG, 2020. Increased cortical thickness in patients with major depressive disorder following antidepressant treatment. Chronic Stress 4, 1–6. 10.1177/2470547019899962. [DOI] [PMC free article] [PubMed] [Google Scholar]
- Osler M, Sørensen L, Rozing M, Calvo OP, Nielsen M, Rostrup E, 2018. Subclinical depressive symptoms during late midlife and structural brain alterations: a longitudinal study of Danish men born in 1953. Hum. Brain Mapp 39 (4), 1789–1795. 10.1002/hbm.23954. [DOI] [PMC free article] [PubMed] [Google Scholar]
- Penninx BW, Milaneschi Y, Lamers F, Vogelzangs N, 2013. Understanding the somatic consequences of depression: biological mechanisms and the role of depression symptom profile. BMC Med. 11 (1), 129. 10.1186/1741-7015-11-129. [DOI] [PMC free article] [PubMed] [Google Scholar]
- Radloff LS, 1977. The CES-D scale. Appl. Psychol. Meas 1 (3), 385–401. 10.1177/014662167700100306. [DOI] [Google Scholar]
- Rapp MA, Schnaider-Beeri M, Wysocki M, Guerrero-Berroa E, Grossman HT, Heinz A, Haroutunian V, 2011. Cognitive decline in patients with dementia as a function of depression. Am. J. Geriatr. Psychiatry 19 (4), 357–363. 10.1097/JGP.0b013e3181e898d0. [DOI] [PMC free article] [PubMed] [Google Scholar]
- Raz N, Lindenberger U, Rodrigue KM, Kennedy KM, Head D, Williamson A, Acker JD, 2005. Regional brain changes in aging healthy adults: general trends, individual differences and modifiers. Cereb. Cortex 15 (11), 1676–1689. 10.1093/cercor/bhi044. [DOI] [PubMed] [Google Scholar]
- Reis JP, Loria CM, Launer LJ, Sidney S, Liu K, Jacobs DR, Yaffe K, 2013. Cardiovascular health through young adulthood and cognitive functioning in midlife. Ann. Neurol 73 (2), 170–179. 10.1002/ana.23836. [DOI] [PMC free article] [PubMed] [Google Scholar]
- Rutten-Jacobs LCA, Tozer DJ, Duering M, Malik R, Dichgans M, Markus HS, Traylor M, 2018. Genetic study of white matter integrity in UK Biobank (N=8448) and the overlap with stroke, depression, and dementia. Stroke 49 (6), 1340–1347. 10.1161/STROKEAHA.118.020811. [DOI] [PMC free article] [PubMed] [Google Scholar]
- Schmaal L, Hibar DP, Sämann PG, Hall GB, Baune BT, Jahanshad N, Veltman DJ, 2017. Cortical abnormalities in adults and adolescents with major depression based on brain scans from 20 cohorts worldwide in the ENIGMA Major Depressive Disorder Working Group. Mol. Psychiatry 22 (6), 900–909. 10.1038/mp.2016.60. [DOI] [PMC free article] [PubMed] [Google Scholar]
- Shen Dinggang, Davatzikos C, 2002. HAMMER: hierarchical attribute matching mechanism for elastic registration. IEEE Trans. Med. Imaging 21 (11), 1421–1439. 10.1109/TMI.2002.803111. [DOI] [PubMed] [Google Scholar]
- Tustison NJ, Avants BB, Cook PA, Zheng Yuanjie, Egan A, Yushkevich PA, Gee JC, 2010. N4ITK: improved N3 bias correction. IEEE Trans. Med. Imaging 29 (6), 1310–1320. 10.1109/TMI.2010.2046908. [DOI] [PMC free article] [PubMed] [Google Scholar]
- Wolkowitz OM, Epel ES, Reus VI, Mellon SH, 2010. Depression gets old fast: do stress and depression accelerate cell aging? Depress.Anxiety 27 (4), 327–338. 10.1002/da.20686. [DOI] [PubMed] [Google Scholar]
- Yang W, Li X, Pan K, Yang R, Song R, Qi X, Xu W, 2021. Association of life-course depression with the risk of dementia in late life: a nationwide twin study. Alzheimers Dement. 17 (8), 1383–1390. 10.1002/alz.12303. [DOI] [PubMed] [Google Scholar]
- Zacharaki EI, Kanterakis S, Bryan RN, Davatzikos C, 2008. In: Measuring brain lesion progression with a supervised tissue classification system, pp. 620–627. 10.1007/978-3-540-85988-8_74. [DOI] [PubMed] [Google Scholar]
- Zeki Al Hazzouri A, Vittinghoff E, Byers A, Covinsky K, Blazer D, Diem S, Yaffe K, 2014. Long-term cumulative depressive symptom burden and risk of cognitive decline and dementia among very old women. J. Gerontol. A Biol. Sci. Med. Sci 69 (5), 595–601. 10.1093/gerona/glt139. [DOI] [PMC free article] [PubMed] [Google Scholar]
- Zeki Al Hazzouri Adina, Caunca MR, Nobrega JC, Elfassy T, Cheung YK, Alperin N, Wright CB, 2018. Greater depressive symptoms, cognition, and markers of brain aging: Northern Manhattan Study. Neurology 90 (23), e2077–e2085. 10.1212/WNL.0000000000005639. [DOI] [PMC free article] [PubMed] [Google Scholar]