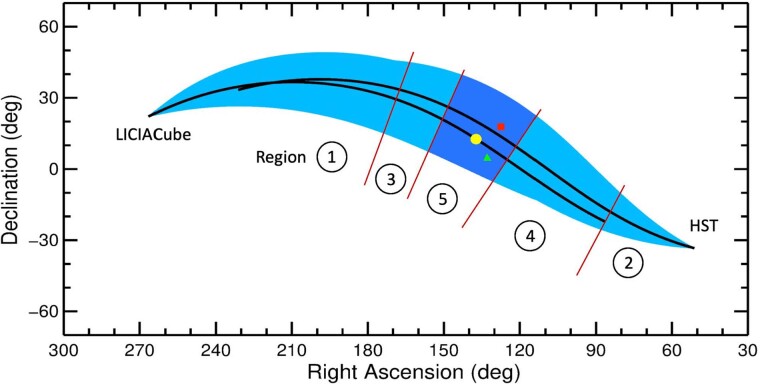
Extended Data Fig. 2. Ejecta cone orientation lies in the swaths of sky (black lines) defined by HST and LICIACube observations.
The light-blue envelope outlines the axis position uncertainty in the direction measured in the sky plane. Red lines divide the along-plane swaths into regions that are excluded based on cone morphology in LICIACube images: 1) and 2) are excluded because the ejecta cone would point in the opposite direction from what is observed; 3) is excluded because the axis would lie too close to the sky plane; 4) is excluded because the axis would lie too close to the line-of-sight; and 5) is the expected region for the axis orientation. The yellow dot denotes the best solution (RA,Dec) = [138°,+13°] with the dark-blue envelope showing the extent of possible solutions. The red square is the direction of the incoming DART trajectory [128°,+18°] and the green triangle shows Dimorphos’s velocity vector [134°,+5°]. The LICIACube swath is defined for the +175 s image shown in Extended Data Fig. 3.

