Abstract
Leucocyte immunoglobulin‐like receptors (LILRs) are closely related to tumourigenesis, but their clinical value in early‐stage pancreatic ductal adenocarcinoma (PDAC) after pancreaticoduodenectomy remains unknown. Kaplan–Meier and Cox proportional hazards regression models is used to investigate the association between LILR expression and prognosis in tumour biopsies and peripheral blood mononuclear cells. Risk score was calculated for each patient based on the prognostic model. DAVID, STRING, GeneMANIA, and GSEA were used to conduct pathway and functional analyses. The CIBERSORT algorithm is used to analyse tumour‐infiltrating immune cells. Survival analysis showed that high levels of LILRA4 (p = 0.006) and LILRB4 (p = 0.04) were significantly associated with better overall survival. High levels of LILRA2 (p = 0.008) and LILRB4 (p = 0.038) were significantly associated with better relapse‐free survival. JAK‐STAT signalling pathway, regulation of T cell activation, regulation of the immune effector process, and tumour necrosis factor superfamily cytokine production were involved in molecular mechanisms that affected poor prognoses in the high‐risk group in GSEA. CIBERSORT demonstrated that the high‐risk group had significantly higher infiltrating fraction of memory‐activated CD4 T cells and activated NK cells and lower fraction of resting dendritic cells and neutrophils. LILRB4 plays crucial roles in affecting the clinical outcomes of early‐stage PDAC.
Keywords: bioinformatics, cancer, surgery
LILRB4 play crucial roles in affecting the clinical outcomes of early‐stage PDAC through JAK‐STAT signalling pathway, immune‐related signalling pathways, and tumour‐infiltrating immune cells.
Abbreviations
- DCs
dendritic cells
- FDR
false discovery rate
- GEO
gene expression omnibus
- GO
gene ontology
- GSEA
gene set enriched analysis
- HLA‐G
human Leucocyte Antigen‐G
- HR
hazard ratios
- KEGG
Kyoto Encyclopaedia of Genes and Genomes
- KIR
killer cell inhibitory receptor
- KM
Kaplan‐Meier
- LILRs
Leucocyte immunoglobulin‐like receptors
- MSigDB
Molecular Signatures database
- NK
natural killer
- OS
Overall survival
- PBMCs
peripheral blood mononuclear cells
- PDAC
pancreatic ductal adenocarcinoma
- RFS
relapse‐free survival
- ROC
receiver operating characteristic
- TCGA
The Cancer Genome Atlas
- TIICs
tumour‐infiltrating immune cells
1. BACKGROUND
According to global cancer statistics, in 2018, about 458,918 new cases of pancreatic cancer occurred, and the number of deaths was about 432,242 worldwide, indicating similar morbidity and mortality rates [1]. Pancreatic ductal adenocarcinoma (PDAC) is the main pathological type of pancreatic cancer. It has the characteristics of high malignancy and rapid progression, resulting in poor clinical prognosis [2]. In recent years, with the improvement of PDAC treatment strategies and the emergence of new treatment methods, such as immunotherapy and neoadjuvant chemotherapy, the clinical outcomes of PDAC have improved to some extent, but the challenge is that the 5‐year overall survival (OS) rate is still less than 10% in all stages of PDAC and it still has the worst prognosis among all cancers [3, 4]. Although the 5‐year OS of patients with pancreatic cancer has risen from 2.5% in 1970 to 9% in 2019, there is still a large gap in the improvement of the clinical outcomes of other tumour types, such as breast and colorectal cancers [3, 4, 5]. Lack of biological indicators for early effective screening strategies and novel therapies in PDAC are the main reasons for this discrepancy [6, 7]. Current studies have shown that tumour markers, such as various commonly used carcinoembryonic antigens and carbohydrate antigen 199, are not effective in diagnosing early PDAC due to their low sensitivity [7]. However, early detection strategies involving endoscopic ultrasound and magnetic resonance imaging have not been validated in randomised trials in high‐risk PDAC patients [4]. Therefore, identifying effective screening indicators and treatment‐related targets is crucial to improve the prognosis of pancreatic cancer.
PDAC is similar to most adenocarcinomas, with a massive fibrotic stroma, which plays an important role in the local inflammatory microenvironment of tumours [8, 9, 10]. The microenvironment of PDAC consists of abundant deposition of the extracellular matrix, low vessel density, cancer‐associated fibroblasts, and immune/inflammatory cells, which are closely related to tumour growth and progression and the infiltration of immune cells, similar to other tumours [2, 11, 12, 13, 14, 15]. Immune cells may be found in solid tumours, and different types of immune cells have different effects on the clinical prognosis of tumours [16, 17]. In particular, increased number of dendritic cells (DCs) is associated with improved prognosis in various types of human cancers. DC maturation is a prognostic indicator; moreover, chronic inflammation and presence of M2 macrophages facilitate tumour growth and spread [18, 19].
Leucocyte immunoglobulin‐like receptors (LILRs) are a family of receptors with extracellular immunoglobulin domains; the gene coding region is located on the chromosome region 19q13.4, also known as CD85, ILT, and LIR, which have immunomodulatory effects on a variety of immune cells [20, 21]. LILRs include subfamily A and subfamily B (LILRA1–6 and LIRB1–5, respectively). The LILR receptor in the A subfamily is an activation receptor that contains tyrosine‐based immune receptor activation motifs (ITAMs), while the LIR receptor in the B subfamily contains multiple tyrosine‐based cytoplasmic immune receptor inhibition motifs (ITIMs) [22, 23]. LILRs are related to the human killer cell inhibitory receptor (KIR) family. Both have similar Ig‐like structures and cytoplasmic signal domains. Although the expression of KIR is limited to natural killer (NK) cells, LILRs are found in a variety of cells, including NK, T lymphocytes, B lymphocytes, and myeloid cells (monocytes, macrophages, dendritic cells, and granulocytes [24]). The transmembrane domain of the LILRA receptor contains a charged arginine or lysine residue associated with the FcR ligand containing (ITAXI/Lx 6–12 YxxI/L) ITAM [25]). ITAM activation recruits Syk/ZAP70 family kinases to drive downstream activation pathways, which are important for immunity [26]. By contrast, the LILRB receptor contains the cytoplasmic (S/I/V/LxYxxI/V/L) ITIM domain, which recruits the phosphatase SHP1/SHP2/SHIP containing the Src homology 2 domains, thereby inhibiting the immune signalling cascade. SHP/SHIP phosphatase activity is essential to maintain immune homoeostasis [27].
LILRAs and LILRBs belong to the LILRs group, and the main function of LILRAs involves immune activation, while the role of LILRBs is immune suppression [28, 29, 30]. A study on oestrogen receptor‐positive breast cancer reported that after receiving neoadjuvant endocrine therapy, compared with patients with low expression of the LILRA2 gene in the tumour biopsies, patients with high LILRA2 expression showed significant tumour shrinkage, which was beneficial to breast‐conserving surgery [31]. Lu et al. found that the Semaphorin‐4A gene stimulated the CD4+ T cells and regulated Th2 T cell differentiation by binding to LILRA2, thereby initiating an immune response [32]. A previous study reported that LILRA4 was also expressed in cancer cells, which was associated with impairment of plasmacytoid dendritic cells (pDCs) in the microenvironment of cancers [33]. A genome‐wide analysis of copy number variations in ovarian cancer has shown that duplicate mutations in LILRA6 were associated with susceptibility to high‐grade serous ovarian cancer [34].
Human Leucocyte Antigen‐G (HLA‐G) positive expression in gastric cancer patients indicated a poor prognosis, and its possible mechanism may be that HLA‐G combined with LILRB1 inhibited NK cell proliferation and function [35]. A series of studies have shown that in a variety of tumours, such as colon cancer, non‐small cell lung cancer, and hepatocellular carcinoma, overexpressed LILRB2 was associated with a poor prognosis [36, 37, 38, 39, 40, 41]. LILRB4, which is also an immunosuppressive receptor, is similar to LILRB3, so it can interact with HLA‐G to inhibit the activation of immune cells, which mainly include NK and T cells [42, 43]. High LILRB4 expression has also been reported to be associated with tumour progression and poor prognosis. LILRB4 was associated with impaired T cell responses in pancreatic cancer, and antagonistic LILRB4 was the key to successful immunotherapy [44, 45]. In leukaemia, tumour cells disable immune checkpoint blockade therapy through the LILRB4 signalling, and blocking LILRB4 can prevent the development and metastasis of tumour cells. The potential mechanism is that LILRB4 changes the tumour microenvironment, resulting in immune suppression [46, 47]. In colorectal cancer, the LILRB4 gene was found to be highly expressed in cancer tissue, and the expression level of the LILRB4 gene was negatively correlated with the density of CD45RO + T cells in the cancer tissue, and high LILRB4 gene expression was a biomarker of poor clinical prognosis for colorectal cancer [48]. Moreover, in gastric cancer, LILRB4 was significantly related to the pathological grade [49]. Therefore, we know that LILR family genes play an important role in tumourigenesis, development, and clinical prognosis.
However, the effect of LILRs on clinical outcomes in patients with PDAC remains unknown. This study aimed to investigate the association between LILRs gene expression and prognosis and reveal possible mechanisms in pathway enrichment and tumour immune cell infiltration in early‐stage PDAC.
2. MATERIALS AND METHODS
2.1. Data mining and processing
The gene expression profiles and clinical information of PDAC were obtained from The Cancer Genome Atlas (TCGA, data release 21.0, December 10, 2019) and normalised by the ‘DESeq’ and ‘Limma’ package in R (version 3.6.1; www‐project.org) [50]. The inclusion criteria for cases in this study were as follows: (i) patients with pancreaticoduodenectomy and pathologically confirmed as PDAC, (ii) according to the Seventh American Joint Committee on Cancer, patients with postoperative specimen pathological stage were stage I or II, and pathology stages I and II were defined as early‐stage PDAC, and (iii) patients with complete clinical prognosis data. To further characterise the expression levels of LILRs between PDAC patients and healthy control patients in the peripheral blood mononuclear cells (PBMCs), GSE74629 and GSE49641 were obtained from the gene expression omnibus (GEO; http://www.ncbi.nlm.nih.gov/geo) database. GSE55643 was used to verify differences in gene expression levels. Data from the GEO database were normalised by the ‘normalizeBetweenArrays’ function of ‘Limma’ package in R.
2.2. Bioinformatics and correlation analysis of LILR genes
First, we analysed the differences in LILR gene expression between pancreatic cancer and adjacent tissues and constructed violin plots using the ‘wilcox.test’ function of ‘vioplot’ package in R. We then used the ‘corrplot’ package in R to conduct Pearson's correlation analyses between LILR genes and then constructed corresponding correlation plots. We used the online tool DAVID Bioinformatics Resources (version 6.8, https://david.ncifcrf.gov) to conduct functional annotation of gene ontology (GO) terms and enrichment of the Kyoto Encyclopaedia of Genes and Genomes (KEGG) for all LILR genes. All 10 genes from the LILR gene family were included in this analysis. [51, 52]. Finally, we analysed the interrelationships of gene–gene and protein–protein interactions between LILRs genes using online analysis tools: GeneMANIA([53]) (http://genemania.org) and STRING (https://string‐db.org) [54].
2.3. Survival analysis and prognostic model construction
Using the median expression of each LILR gene as the cut‐off point, we defined the high‐ and low‐expression groups. Kaplan–Meier analysis with the log‐rank test was used as a univariate analysis to assess the association between clinical factors, gene expression, and clinical outcomes, including OS and relapse‐free survival (RFS). Clinical factors with p‐values of the log‐rank test less than 0.05 were used as corrective factors when constructing the Cox proportional hazards regression model of each LILR gene. Then, the genes that were significantly associated with clinical outcomes were recruited to construct a prognostic model. The formula of risk scores was as follows:
where β is the regression coefficient from the multivariate Cox proportional regression model of individual genes. We used median risk scores as the cut‐off point and divided the patients with PDAC into higher and lower risk groups. A receiver operating characteristic (ROC) curve was used to evaluate the predictive power of the prognostic model, which was conducted using the ‘roc’ function of ‘ROC’ package in R [55]. Subsequently, we combined the risk score with clinical factors of p‐values less than 0.05 for a nomogram analysis, which was also completed using the ‘rms’ and ‘survival’ packages of R[56]. Afterwards, we analysed differences in expressions of prognosis‐related genes between PDAC patients and healthy control patients in the peripheral blood and PBMCs and visualised the results using the ‘ggplot’ function and t‐test of ‘ggplot2’ package in R. ROC curves were constructed to show the diagnostic efficiency of prognosis‐related genes in the diagnosis of PDAC by using the ‘pROC’ package in R.
To verify the stability of the model, we used the k‐fold method that was used for cross‐validation of the model, ‘caret’ package to create cross‐validation data set, and ‘survivalROC’ package to calculate AUC values.
2.4. GSEA
After constructing the prognostic model, we found that compared with the lower risk group, the higher risk group had a worse clinical prognosis. To investigate the potential molecular mechanism of adverse prognosis in the higher risk group, we performed GSEA between both groups [57]. The Molecular Signatures database (MSigDB) C2 and C5 gene sets were used in the GSEA. The C2 gene set mainly included KEGG and related signalling pathway analysis, while the C5 gene set mainly included GO enrichment analysis. The selection criteria for statistically significant gene sets were a false discovery rate (FDR) less than 0.25 and a p‐value less than 0.05.
2.5. Analysis of tumour‐infiltrating immune cells
LILR genes were closely related to the regulation of immune cells, so we performed a tumour‐infiltrating immune cell (TIIC) analysis between the higher risk group and lower risk group. The CIBERSORT algorithm was used to perform tumour‐infiltrating immune cell analysis, which is a gene expression‐based deconvolution algorithm, which can measure 22 types of characteristic immune cell compositions in RNA mixtures from many tissues, including solid tumours [58]. The algorithm based on the mRNA expression sequence was conducted using R, and the set parameter was 1000 permutations.
2.6. Statistical analyses
All statistical analyses and plots were performed using SPSS 23.0 and R (version 3.6.1). A p‐value of less than 0.05 was considered statistically significant. Association analyses between clinical factors and gene expression and clinical outcomes were tested using Kaplan–Meier analysis and a Cox proportional hazard regression model, and hazard ratios (HRs) with 95% confidence intervals were used to describe the relative risks. A two‐sided t‐test was used to evaluate the differential expression analysis of LILR gene expression and the percentage of tumour‐infiltrating cells between the two groups. In GSEA, the Benjamini–Hochberg method was used to adjust multiple tests, which defined the meaning of FDR; in our study, FDR <0.25 was considered statistically significant.
3. RESULTS
3.1. Data processing
After standardised processing, 112 patients with PDAC and 31,777 genes who met the inclusion criteria from TCGA were enroled in our study. Clinical factors included age, sex, history of chronic pancreatitis and alcohol, tumour size, pathological stage, neoplasm histological grade, targeted molecular therapy, radiation therapy, residual resection, and information of clinical outcomes (Table S1). Overall survival data were available for all samples in the 112 PDAC patients, but 19 cases were missing in the relapse‐free survival data.
3.2. Bioinformatics and correlation analysis of LILR genes
We obtained 10 LILR gene expressions from the pancreatic cancer expression profile of TCGA. These included LILRA1, LILRA2, LILRA4, LILRA5, LILRA6, LILRB1, LILRB2, LILRB3, LILRB4, and LILRB5 (Table S3). We performed a differential expression analysis of those genes between pancreatic cancer tissues and adjacent tissues. The results showed that compared with adjacent tissues, LILRA1, LILRA2, LILRA4, LILRA6, LILRB1, LILRB2, LILRB3, and LILRB4 had a statistically significant lower expression in cancer tissues (p < 0.05; Figure 1a). We then performed correlation analyses on these 10 LILR genes and visualised the results with correlation diagrams as shown in Figure 1b. The results showed that they were all positive correlations, and most of them were strong correlations (correlation coefficient ≥0.6). Some of them were very strong correlations (correlation coefficient ≥0.8), such as LILRB1 and LILRB4, LILRB2, and LILRB3.
FIGURE 1.
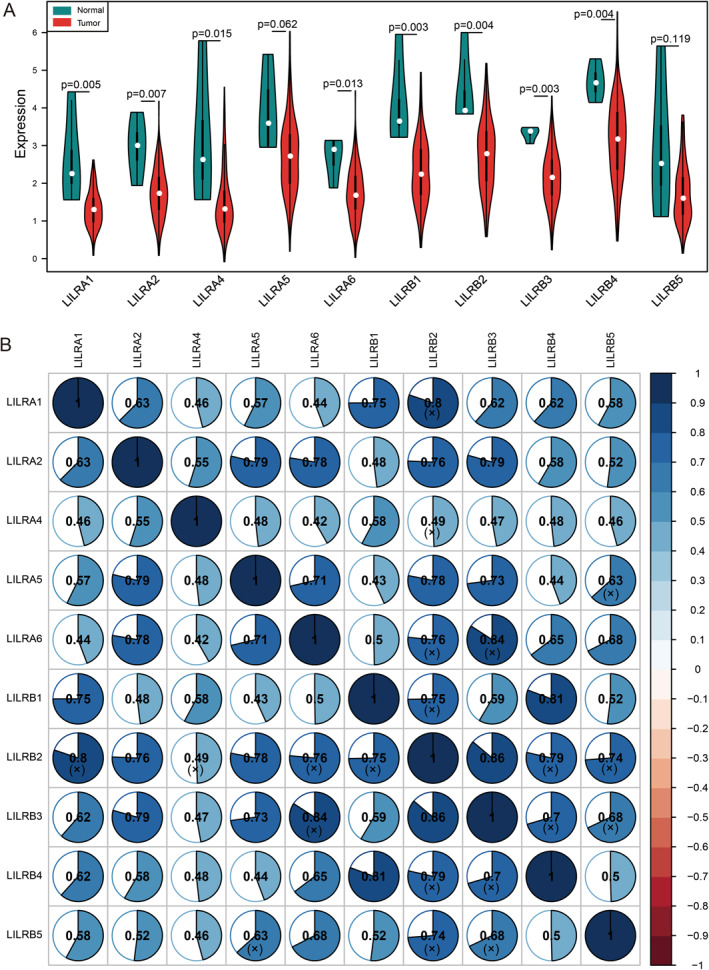
(a) Violin diagram of differential expression analysis and (b) correlation graph of Pearson's correlation analysis of LILRs genes; blue denotes a positive correlation, red denotes a negative correlation, and the shade of colour represents the size of the correlation coefficient. The (x) means that the results were not statistically significant.
Furthermore, we conducted functional annotation and pathway enrichment for the LILR genes. As shown in the results of Figure 2a and Table S2, the LILR genes were mainly involved in the adaptive immune response, the regulation of immune response, the immune system process, leucocyte differentiation, MHC class I protein binding, transmembrane signalling receptor activity, and inhibitory MHC class I receptor activity. Notably, the Fc receptor‐mediated inhibitory signalling pathway, immune response‐regulating cell surface receptor signalling pathway, regulation of immune response, regulation of immune system process, and immune response were in the same regulatory network, which suggested that the LILRs genes played an important role in the immune response and regulation. The results of protein‐protein interaction (PPI) analysis showed that LILR genes were closely associated with each other, and they were related to the HLA family and integrin family genes (Figure 2b). The results from GeneMANIA were similar, showing a close relationship between LILR genes (Figure 2c).
FIGURE 2.
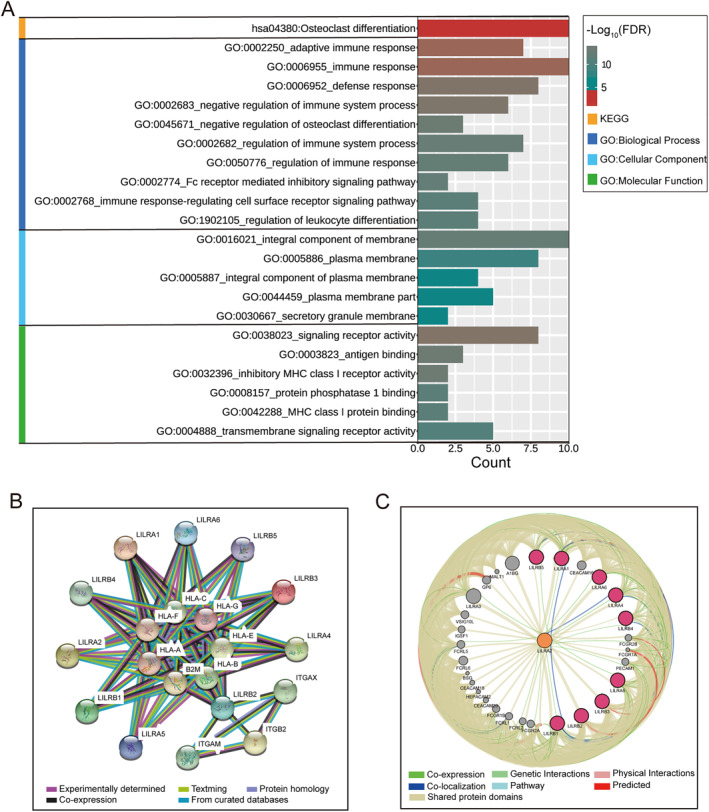
The analysis of the Kyoto Encyclopaedia of Genes and Genomes (KEGG) pathway, Gene Ontology (GO), and gene/protein interaction for LILR genes. (a) Visualisation of the KEGG pathway and GO analysis results. (b) The protein–protein interaction networks of LILR genes, which were derived from STRING. (c) The gene–gene interaction networks of LILR genes, which were derived from GeneMANIA.
3.3. Survival analysis and prognostic model construction
In the analysis of the association between the above clinical factors and clinical outcomes, we found that four variables (neoplasm histological grade, targeted molecular therapy, radiation therapy, and residual resection) were significantly associated with OS, and two factors (neoplasm histological grade and residual resection) were significantly associated with RFS as shown in Table S1. Clinical factors of appeal were included in the Cox proportional hazard regression model as corrective factors. Other factors were not significantly associated with clinical outcomes.
The Kaplan–Meier analyses showed a significant association between LILRA2, LILRA4, LILRA6, LILRB1, LILRB3, LILRB4, and LILRB5 and OS in early‐stage PDAC patients with pancreaticoduodenectomy (Figure 3; Figure S1A in Supporting Information). Multivariate analysis results of Cox proportional hazard regression models after received clinical factor adjustment showed that the high expression of LILRA4 (p = 0.006, HR = 0.46, 95% CI: 0.27–0.80) and LILRB4 (p = 0.04, HR = 0.57, 95% CI: 0.33–097) were still significantly associated with a better OS (Table 1 and Figure 3a,b). In a univariate analysis of RFS of Kaplan–Meier analyses, we found that LILRA2, LILRA4, and LILRB4 were significantly associated with RFS (Figure S1B Supporting Information). In the multivariate Cox proportional hazard regression model, there were significant associations between the high expression of LILRA2 (p = 0.008, HR = 0.35, 95% CI: 0.16–0.76) and LILRB4 (p = 0.038, HR = 0.46, 95% CI: 0.22–0.96) with a better RFS (Table 1 and Figure 3c,d).
FIGURE 3.
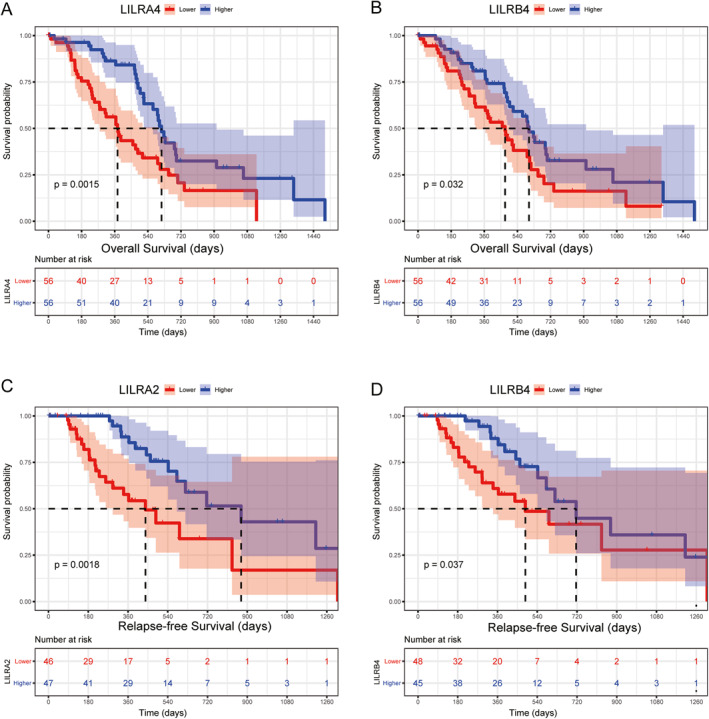
A Kaplan–Meier plot of the association between LILR gene expressions and clinical outcomes in early‐stage PDAC. OS for LILRA4 (a) and LILRB4 (b); RFS for LILRA2 (c), and LILRB4 (d).
TABLE 1.
Analysis of the association between LILRs gene expression and clinical outcomes.
| Gene | Overall survival | Relapse‐free survival | ||||||
|---|---|---|---|---|---|---|---|---|
| Patients | MST (days) | HR (95% CI) | p # | Patients | MST (days) | HR (95% CI) | p* | |
| LILRA1 | ||||||||
| Lower | 56 | 473 | Reference | 46 | 486 | Reference | ||
| Higher | 56 | 596 | 0.60 (0.35–1.03) | 0.064 | 47 | 716 | 0.66 (0.31–1.40) | 0.281 |
| LILRA2 | ||||||||
| Lower | 56 | 473 | Reference | 46 | 439 | Reference | ||
| Higher | 56 | 596 | 0.58 (0.33–1.02) | 0.058 | 47 | 872 | 0.35 (0.16–0.76) | 0.008 |
| LILRA4 | ||||||||
| Lower | 56 | 375 | Reference | 46 | 593 | Reference | ||
| Higher | 56 | 614 | 0.46 (0.27–0.80) | 0.006 | 47 | 716 | 0.50 (0.23–1.04) | 0.065 |
| LILRA5 | ||||||||
| Lower | 56 | 485 | Reference | 48 | 542 | Reference | ||
| Higher | 56 | 568 | 0.82 (0.49–1.38) | 0.454 | 45 | 831 | 0.80 (0.39–1.63) | 0.537 |
| LILRA6 | ||||||||
| Lower | 56 | 481 | Reference | 45 | 593 | Reference | ||
| Higher | 56 | 614 | 0.91 (0.52–1.60) | 0.735 | 48 | 620 | 0.75 (0.37–1.50) | 0.411 |
| LILRB1 | ||||||||
| Lower | 56 | 498 | Reference | 45 | 486 | Reference | ||
| Higher | 56 | 592 | 0.68 (0.40–1.17) | 0.164 | 48 | 716 | 0.59 (0.27–1.27) | 0.178 |
| LILRB2 | ||||||||
| Lower | 56 | 485 | Reference | 46 | 486 | Reference | ||
| Higher | 56 | 592 | 0.85 (0.50–1.45) | 0.552 | 47 | 831 | 0.61 (0.30–1.28) | 0.193 |
| LILRB3 | ||||||||
| Lower | 56 | 458 | Reference | 46 | 593 | Reference | ||
| Higher | 56 | 614 | 0.59 (0.34–1.04) | 0.066 | 47 | 716 | 0.60 (0.29–1.23) | 0.162 |
| LILRB4 | ||||||||
| Lower | 56 | 473 | Reference | 48 | 486 | Reference | ||
| Higher | 56 | 603 | 0.57 (0.33–097) | 0.040 | 45 | 716 | 0.46 (0.22–0.96) | 0.038 |
| LILRB5 | ||||||||
| Lower | 56 | 476 | Reference | 44 | 593 | Reference | ||
| Higher | 56 | 596 | 0.75 (0.43–1.31) | 0.318 | 49 | 716 | 0.80 (0.38–1.66) | 0.545 |
Note: Multivariate cox proportional hazards regression model was #adjusted by neoplasm histological grade, targeted molecular therapy, radiation therapy, residual resection in overall survival and *adjusted by Neoplasm histological grade, residual resection in relapse‐free survival.
Abbreviations: CI, confidence interval; HR, hazard ratio; LILRs, leukocyte immunoglobulin‐like receptors; MST, median, survival time.
We then conducted a joint analysis of genes that were significantly associated with clinical outcomes based on gene expressions. According to the level of LILRA4 and LILRB4 expressions, we divided PDAC patients into three subgroups: group A (both LILRA4 and LILRB4 had low expressions), group B (a combination of high and low expressions), and group C (both LILRA4 and LILRB4 had high expressions). The results are shown in Table 2 and Figure 4a. Compared with group A, Group C was significantly associated with better OS (p = 0.007, HR = 0.42, 95% CI: 0.23–0.79). A similar result was found in the combination of LILRA2 and LILRB4: there was a significant association between group C and better RFS (p = 0.012, HR = 0.35, 95%CI: 0.16–0.79) (Table 3 and Figure 4b).
TABLE 2.
Combined survival analysis of LILRA4 and LILRB4 gene expression with overall survival in early‐stage PDAC.
| Groups | Overall survival | ||||
|---|---|---|---|---|---|
| Patients (n = 112) | MST | Events | HR (95% CI) | p* | |
| LILRA4&LILRB4 | |||||
| A | 39 | 378 | 30 | Reference | 0.023 |
| B | 34 | 614 | 16 | 0.84 (0.42–1.69) | 0.631 |
| C | 39 | 603 | 23 | 0.42 (0.23–0.79) | 0.007 |
Note: Multivariate cox proportional hazards regression model was *adjusted by neoplasm histological grade, targeted molecular therapy, radiation therapy, and residual resection in overall survival (bold means p‐value < 0.05).
Abbreviations: CI, confidence interval; HR, hazard ratio; LILR, Leucocyte immunoglobulin‐like receptor; MST, median survival time.
FIGURE 4.
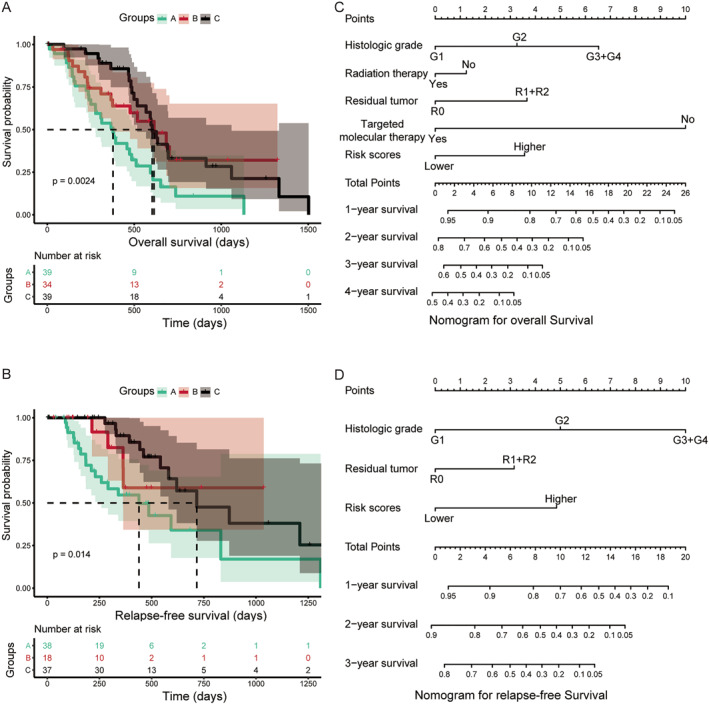
Combined survival analysis of LILRs gene expressions with prognoses for early‐stage PDAC, and a nomogram plot for early‐stage PDAC. (a) Kaplan–Meier plot for LILRA4 and LILRB4, n = 112 (b) LILRA2 and LILRB4, n = 93, Kaplan–Meier analysis. A nomogram plot for OS (c), RFS (d).
TABLE 3.
Combined survival analysis of LILRA2 and LILRB4 gene expressions with relapse‐free survival in early‐stage PDAC.
| Groups | Relapse‐free survival | ||||
|---|---|---|---|---|---|
| Patients (n = 93) | MST (days) | Events | HR (95% CI) | p | |
| LILRA2 and LILRB4 | |||||
| A | 38 | 439 | 19 | Reference | 0.038 |
| B | 18 | NA | 4 | 0.54 (0.18–1.65) | 0.281 |
| C | 37 | 716 | 12 | 0.35 (0.16–0.79) | 0.012 |
Note: *adjusted by neoplasm histological grade and residual resection (bold means p‐value < 0.05).
Abbreviations: CI, confidence interval; HR, hazard ratio; MST, median survival time; PDAC, pancreatic ductal adenocarcinoma; TCGA, The Cancer Genome Atlas.
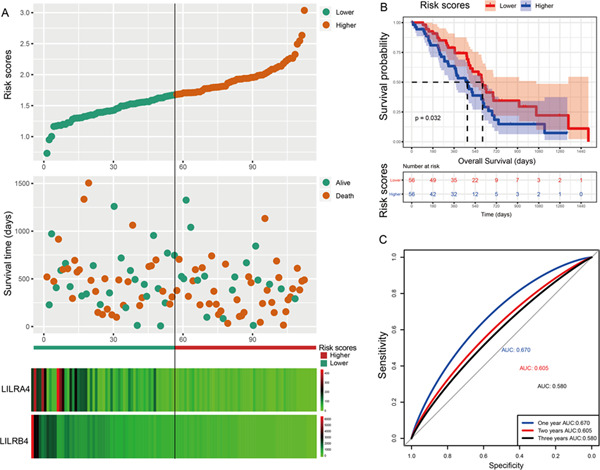
Subsequently, we constructed a prognostic model for OS based on LILRA4 and LILRB4, and a prognostic model for RFS was based on LILRA2 and LILRB4. In this study, the β value of the Cox proportional hazard regression model was negative; so to facilitate analysis and graph display, we performed a logarithmic transformation of raw risk scores. The specific formula of the prognostic model was as follows: risk scores (OS) = ( −log10(LILRA4 expression × −0.673 + LILRB4 × −0.26)))+ 4, risk scores (RFS) = (‐log10‐(LILRA2 expression × −0.123 + LILRB4 × −0.095)])) + 4. Here, the constant 4 was used to make the final risk scores a positive number. Based on median risk scores as the cut‐off point, patients were divided into higher risk and lower risk groups. From the results of Table 4 and Figure 5a,b, we found that the higher risk score group was significantly associated with poor OS compared to the lower risk score group (p = 0.039, HR = 1.75, 95% CI: 1.03–3.00). In the prognostic model of RFS, the result showed that patients with PDAC after pancreaticoduodenectomy with higher risk scores suggested a poor RFS (p = 0.007, HR = 2.90, 95% CI: 1.33–6.15) (Table 5; Figure 6a,b). ROC curve analysis was used to evaluate the predictive effectiveness for both prognostic models. The area under the curve (AUC) of the prognostic model of OS for 1‐year, 2‐year, and 3‐year were 0.670, 0.605, and 0.580, respectively (Figure 5c), and the AUC of RFS was 0.672, 0.571, and 0.567, respectively (Figure 6c). After 5‐fold cross‐validation, the results showed that the mean AUCs of 1‐year, 2‐year and 3‐year OS predicted by the model were 0.68, 0.62, and 0.60, respectively. The mean AUCs of 1‐year, 2‐year and 3‐year RFS predicted by the model were 0.58, 0.66, and 0.62, respectively. Moreover, the nomogram results also suggested that patients with higher risk scores had a worse prognosis (Figure 4c,d) and the C‐index of OS and RFS models was 0.76 and 0.74, respectively.
TABLE 4.
The association analysis between risk scores and overall survival in early‐stage PDAC.
| Groups | Overall survival | ||||
|---|---|---|---|---|---|
| Patients (n = 112) | MST | Events | HR (95% CI) | p* | |
| Risk scores | |||||
| Lower | 56 | 603 | 31 | Reference | 0.039 |
| Higher | 56 | 473 | 38 | 1.75 (1.03–3.00) | |
Note: *adjusted by neoplasm histological grade, targeted molecular therapy, radiation therapy, and residual resection (bold means p‐value < 0.05).
Abbreviations: CI, confidence interval; HR, hazard ratio; MST, median survival time; PDAC, pancreatic ductal adenocarcinoma; TCGA, The Cancer Genome Atlas.
FIGURE 5.
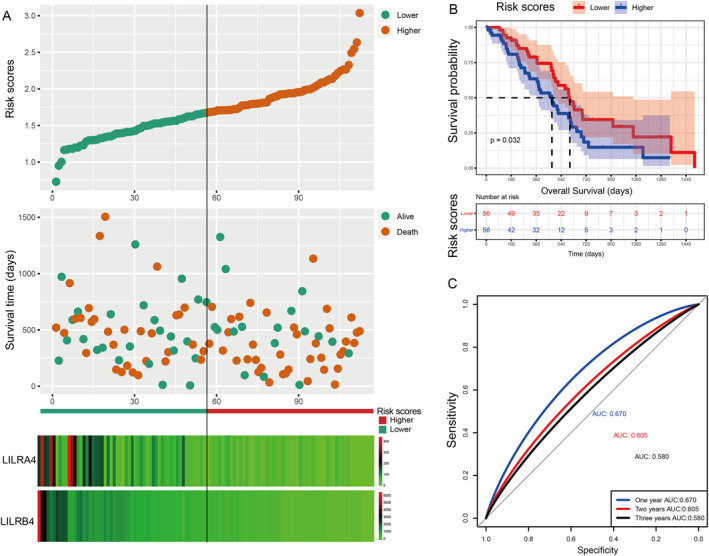
Visualisation for a prognostic model, Kaplan–Meier plot for the risk scores group, and an ROC curve for the effective power of the OS prognostic model. (a) From top to bottom: risk scores map, survival scatterplot, the heat map of the expression of LILRA4 and LILRB4 lower and higher groups; red represents upregulation; blue represents downregulation. (b) A Kaplan–Meier plot for the risk score group. (c) The ROC curve for the OS prognostic model.
TABLE 5.
The association analysis between risk scores and relapse‐free survival in early‐stage PDAC.
| Groups | Relapse‐free survival | ||||
|---|---|---|---|---|---|
| Patients (n = 93) | MST | Events | HR (95% CI) | p* | |
| Risk scores | |||||
| Lower | 47 | 14 | 872 | Reference | 0.007 |
| Higher | 46 | 21 | 493 | 2.90 (1.33–6.15) | |
Note: *adjusted by neoplasm histological grade and residual resection.
Abbreviations: CI, confidence interval; HR, hazard ratio; MST, median survival time; PDAC, pancreatic ductal adenocarcinoma; TCGA, The Cancer Genome Atlas.
FIGURE 6.
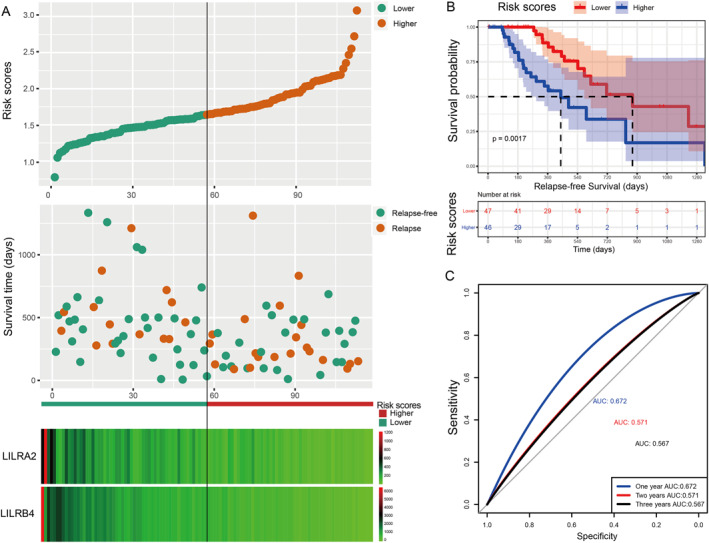
Visualisation of the prognostic model, a Kaplan–Meier plot for the risk scores group, and an ROC curve for the effective power of the RFS prognostic model. Using the median expression of each LILR gene as the cut‐off point, we defined the higher and lower risk groups for PDAC. (a) From top to bottom: risk scores map, survival scatterplot, the heat map of expression of LILRA2 and LILRB4 lower and higher groups; red represents upregulation; blue represents downregulation. (b) Kaplan–Meier plot for the risk score group. (c) The ROC curve for the RFS prognostic model.
Analysis of the tumour biopsies revealed that LILRA2, LILRA4, and LILRB4 were associated with the prognosis of PDAC patients. To test if these genes had prognostic potential in PBMCs as well, GSE49641 and GSE74629 datasets were analysed. We found that the difference in the expression of these genes in cancer patients and the healthy controls was not statistically significant in GSE49641 (Figure S2A‐C Supporting Information), but LILRA2 and LILRB4 were significantly higher in the peripheral blood of cancer patients in GSE74629 (Figure S2D‐F Supporting Information). Due to significant differences in the expression of LILRA2 and LILRB4 in GSE74629 in peripheral blood of PDAC patients, we decided to construct an AUC curve to evaluate the diagnostic efficacy of LILRA2 and LILRB4 in the diagnosis of PDAC. The AUCs of LILRA2 and LILRB4 were 0.853 and 0.896, respectively (Figure S2G in Supporting Information), which showed the strong ability of LILRA2 and LILRB4 in diagnosing PDAC by detecting the expression levels in peripheral blood. Then, we set to confirm whether the lower expression of these genes is in the tumour tissue compared to the normal peri‐tumoral pancreatic tissues holds in a validation dataset, namely GSE55643. LILRA2, LILRA4, and LILRB4 showed low expressions in tumour tissues, in which LILRB4 was significantly lowly expressed (p < 0.001; Figure S3A in Supporting Information).
3.4. GSEA
GSEA was used to determine the potential molecular mechanisms that affected poor prognoses in the higher risk score groups. Our results indicated that has04650 (natural killer cell‐mediated cytotoxicity), hsa04062 (chemokine signalling), and hsa04630 (JAK‐STAT signalling pathway) were enriched in the C2 gene set, which may be involved in affecting OS and RFS (Figure 7a). In the C5 gene set, GO 0050863 (regulation of T cell activation), GO 0002697 (regulation of immune effector process), and GO 0071706 (tumour necrosis factor superfamily cytokine production) were enriched and significantly correlated with OS and RFS (Figure 7b).
FIGURE 7.
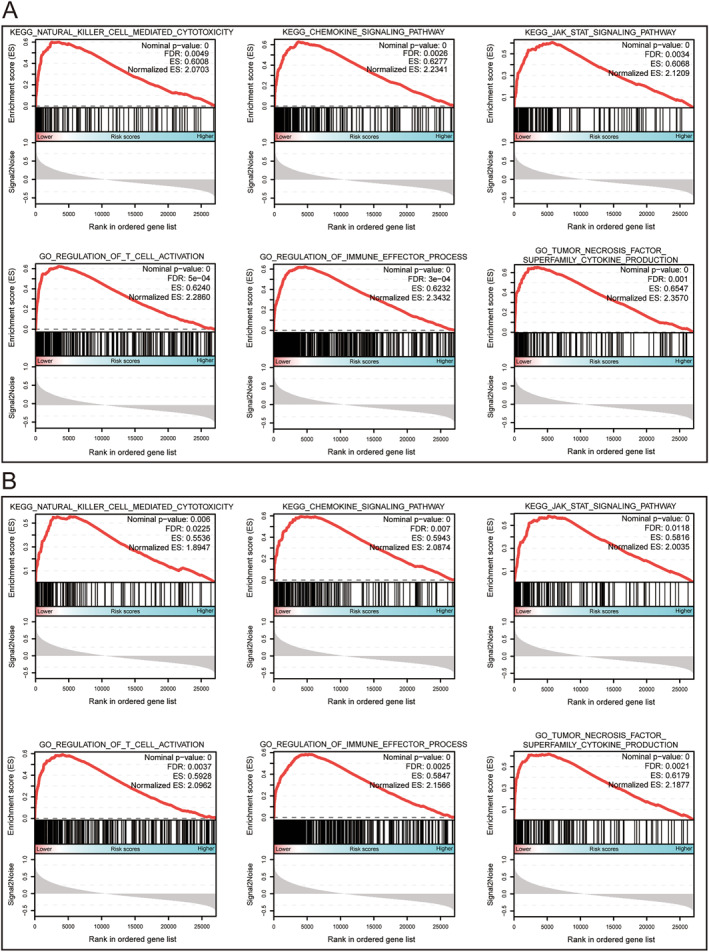
The results of GSEA for the OS (a) and RFS (b) prognostic model. The median expression of each LILR gene was used as the cut‐off point, which defined the higher and lower risk groups for the early‐stage PDAC.
3.5. Analysis of TIICs
According to the previous analysis from the TCGA database, LILRs may influence postoperative clinical outcomes of patients with PDAC by participating in the regulation of the immune response and the function of immune cells, but whether the immune infiltration contributed to it was unknown. Hence, we used CIBERSORT to evaluate the differential percentages of TIICs between the higher and lower risk score groups. CIBERSORT is a deconvolution algorithm based on gene expression; it is combined with 22 leucocyte gene signature matrices, which are a defined ‘barcode’ with 547 gene expression signatures to distinguish the subgroups of 22 type immune cells. Figure 8a,b shows the landscape of tumour‐infiltrating immune cells for 112 early‐stage PDAC cases. Tumour‐infiltrating immune cell populations for each immune cell type are shown in Figure 8c. We then performed correlation analyses on the relative percentages of these 22 immune cells. The result showed that there was a strong correlation between naïve CD4 T cells and memory B cells (correlation coefficient = 0.73) (Figure 9). Furthermore, the results of differential percentages of the tumour‐infiltrating immune cells showed that there was a difference in T cell CD8 (p = 0.02), memory‐activated CD4 T cells (p = 0.001), activated NK cells (p = 0.011), M1 macrophages (p = 0.025), resting dendritic cells (p = 0.024), eosinophils (p = 0.02), and neutrophils (p = 0.018) between both groups using the OS prognostic model (Figure 10a). In addition, the percentages of tumour‐infiltrating cells in the RFS prognostic model, including plasma cells (p = 0.038), memory‐activated CD4 T cells (p = 0.008), gamma delta T cells (p = 0.023), activated NK cells (p = 0.008), M2 macrophages (p = 0.039), resting dendritic cells (p = 0.004), and neutrophils (p = 0.002), were statistically significant between the two groups (Figure 10b). In addition, in order to understand the TIICs in PMBCs and solid tumour tissues, we analysed GSE74629 and found that the results were inconsistent with the analysis results in TCGA, possibly because the cell types of the components were different (Figure S3D in Supporting Information).
FIGURE 8.
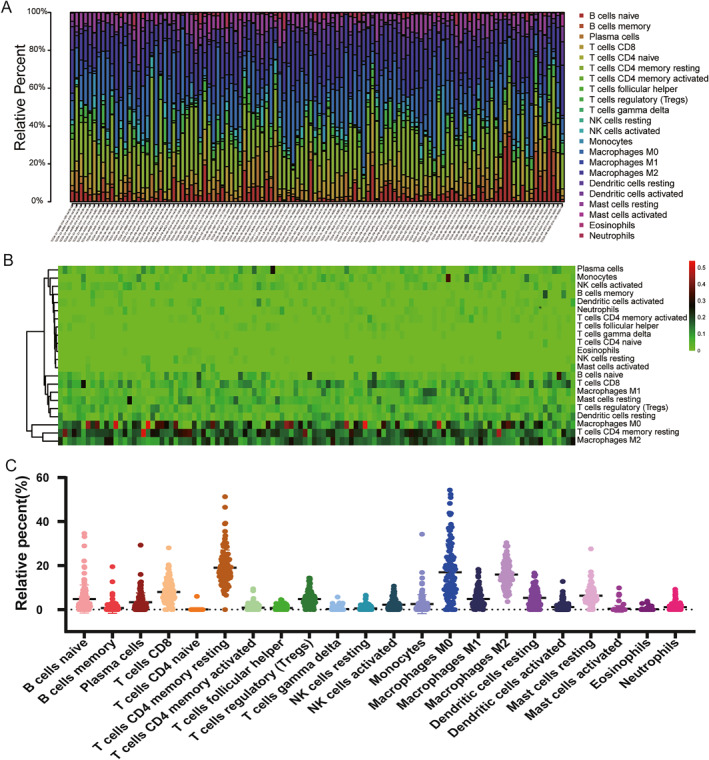
The landscape of tumour‐infiltrating immune cells for 112 early‐stage PDAC cases. (a) A histogram for infraction of 22 types of tumour‐infiltrating immune cells in each case. (b) A heat map for the fraction of 22 types of tumour‐infiltrating immune cells in each case; red represents upregulation; blue represents downregulation. (c) Tumour‐infiltrating immune cell populations for each immune cell type.
FIGURE 9.
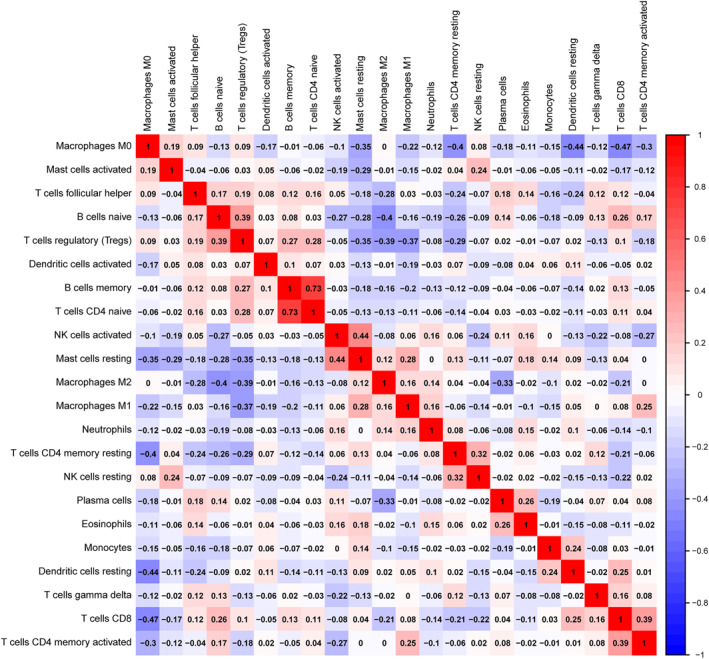
Correlogram of Pearson's correlation analysis of tumour‐infiltrating immune cells; red denotes a positive correlation, blue denotes a negative correlation, and the shade of colour represents the size of the correlation coefficient.
FIGURE 10.
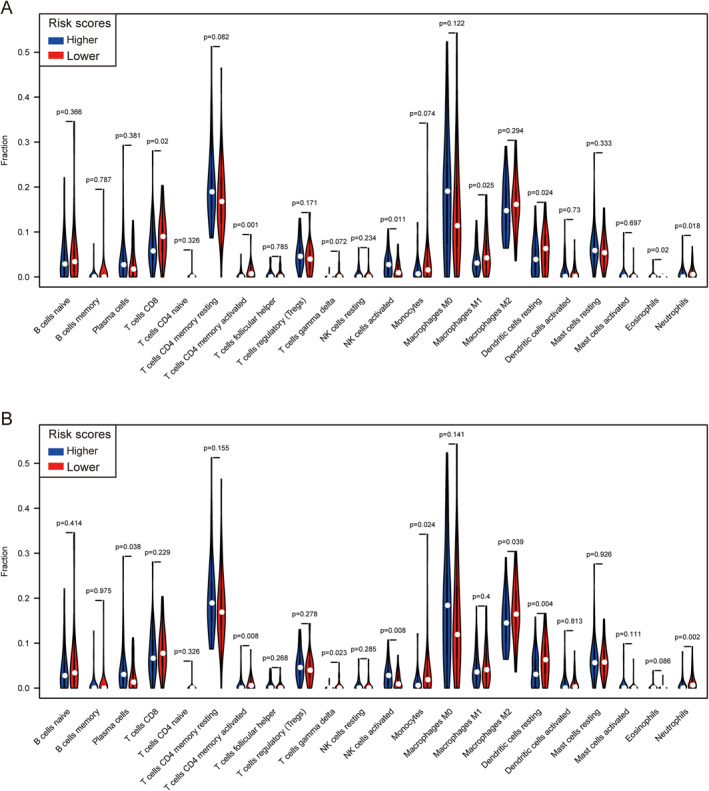
A violin diagram of differential infiltrating infraction analysis for the OS prognostic model (a) and RFS prognostic model (b).
4. DISCUSSION
In this study, we investigated the association between LILR genes and clinical prognosis and diagnosis in early‐stage PDAC. Our results suggested that compared with adjacent tissues, LILRA1, LILRA2, LILRA4, LILRA6, LILRB1, LILRB2, LILRB3, and LILRB4 were significantly overexpressed in cancer tissues. Multivariate analyses of the Cox proportional hazard regression model showed that higher expressions of LILRA4 and LILRB4 were significantly associated with better OS, and there was a significant association between lower expression of LILRA2 and LILRB4 and a worse RFS. However, inconsistent with the results of other tumours, high expressions of LILRB2 and LILRB4 were associated with better clinical outcomes in our study, while other studies showed that patients with high expressions of LILRB2 and LILRB4 predicted worse clinical outcomes [45, 46, 47, 48, 49, 50, 51, 52]. The inconsistency of the results was confusing and interesting for further study. Tumours are involved in an abnormally complex process, and the entire process cannot be explained by individual gene events. Therefore, we conducted a joint analysis and constructed a prognostic model based on gene expressions significantly associated with clinical outcomes. The joint effect of clinical variables and LILR expression indicated that patients with two risk factors had higher hazard ratios than those with only one risk factor. Our findings suggested that the risk score can be used to evaluate the clinical outcomes of patients with early‐stage PDAC. The AUC on the ROC curves was slightly smaller than some well‐known prognostic scores, such as the Glasgow prognostic score, or the modified Glasgow prognostic score. However, the HR value was similar [59, 60]. The difference was that the prognostic score of this study was also effective in the evaluation of RFS. Moreover, based on the prognostic model, tumour‐infiltrating immune cells were investigated. Our findings can therefore help assess the RFS for PDAC patients and identify immunotherapeutic targets.
The prognostic model included LILRA and LILRB genes, consistent with real‐world studies, and were grouped according to the level of risk score to investigate the possible mechanism of risk score influencing clinical prognosis using GSEA analysis, which may make the results more reliable. GSEA results revealed that the following pathways may be involved in regulating the potential molecular mechanisms that affect clinical prognosis; the JAK‐STAT signalling pathway, regulation of T cell activation, regulation of immune effector processes, and tumour necrosis factor superfamily cytokine production were enriched and significantly correlated with the OS and RFS. Numerous studies have shown that the activation of the JAK‐STAT signalling pathway promotes the development and progression of tumours, including pancreatic cancer [61, 62, 63, 64]. Therefore, we have a reason to speculate that in the low‐risk group, activation of the JAK‐STAT signalling pathway played an important role in affecting the OS and RFS. At the same time, many studies have reported that the JAK‐STAT signalling pathway is closely related to immune evasion, immune regulation, immune cell differentiation, and drug resistance [64, 65, 66].
The results of GSEA also showed enrichment of the immune‐related signalling pathway, which suggested that the JAK‐STAT signalling pathway seems to have some association. Hence, we investigated the differential percentages of TIICs between the higher and lower risk score groups. Our results found that in a prognostic model of OS and RFS, there were significantly different percentages in memory‐activated CD4 T cells, activated NK cells, resting dendritic cells, and neutrophils between the two groups. A series of studies have shown that TIICs are closely related to tumour development, drug response, and clinical prognoses in a variety of tumours [67, 68, 69, 70, 71, 72]. In these studies, a high fraction of infiltrating and activated CD4 memory T cells, resting dendritic cells, and neutrophils indicated a good clinical prognosis, which is consistent with previous studies. However, in contrast to previous studies, the high‐risk group had high percentages of activated NK cells, while the low‐risk group had lower fractions of activated NK cells, which was similar to the relationship between the expression of LILRB4 and clinical prognosis in early‐stage PDAC. In general, NK cells play an anti‐tumour role and are regarded as prognostic factors for a good prognosis in some tumours, but tumour‐infiltrating NK cells may also play a role in promoting tumours [73]. NK cells are divided into two subtypes according to the cell surface antigens CD56 and CD16; namely CD56dim/CD16+ and CD56bright/CD16‐. CD56dim/CD16+ NK cells have a high cytotoxic potential, while the CD56bright/CD16‐subtype has a low cytotoxic potential but can secrete cytokines that promote angiogenesis. The vast majority of tumour‐infiltrating NK cells are the CD56bright/CD16‐subtype and have been reported to have impaired cytotoxicity and cytokine‐producing functions and promote angiogenesis, thus playing a role in promoting tumours [74, 75]. Therefore, it is possible that in the high‐risk group, a high fraction of tumour‐infiltrating NK cells plays a role in promoting tumours, which is a reasonable explanation. The infiltrating immune cells are part of the tumour microenvironment. In the prognosis model, the combined effect of the infiltrating immune cells indicates the possible mechanism of poor prognosis in the high‐risk group. The bioinformatics analysis in solid tissues was based on a complex statistical method and was calculated using a formula. CIBERSORT was verified in lung specimens obtained during surgical resection of early‐stage non‐small‐cell lung carcinomas and disaggregated lymph node biopsies from follicular lymphoma by flow cytometry. The results of CIBERSORT were significantly correlated with flow cytometry measurements ([76]), but the real correlation in PDAC needs to be verified by additional studies.
5. CONCLUSION
In this study, we investigated the associations between LILRs genes and clinical prognosis in early‐stage PDAC. The results revealed that LILRA4 and LILRB4 were significantly associated with OS, and LILRA2 and LILRB4 were associated with the RFS. LILRB4 was significantly related to the prognosis of PDAC patients, but the prognostic values of LILRA2 and LILRA4 need further validation. The prognostic model suggested that patients with early‐stage PDAC with higher risk scores had worse clinical outcomes. The results of potential molecular mechanistic analyses suggested that in the prognostic model, the JAK‐STAT signalling pathway, immune‐related signalling pathways, and tumour‐infiltrating immune cells may play a crucial role in affecting the clinical outcomes, but further functional experiments are needed for confirmation.
AUTHOR CONTRIBUTION
Qiang Gao: Conceptualisation, Data curation, Writing – original draft; Shutian Mo: Formal analysis, Methodology; Chuangye Han: Formal analysis, Methodology; Xiwen Liao: Formal analysis, Methodology; Chengkun Yang: Formal analysis, Resources; Xiangkun Wang: Formal analysis; Tianyi Liang: Formal analysis; Yongfei He: Formal analysis; Zijun Chen: Formal analysis; Guangzhi Zhu: Formal analysis; Hao Su: Formal analysis; Xinping Ye: Formal analysis; Tao Peng: Conceptualisation, Funding acquisition, Project administration; Writing – review and editing.
CONFLICT OF INTEREST STATEMENT
No potential conflict of interest was reported by the authors.
Supporting information
Supporting Information S1
Table S1
Table S2
Table S3
ACKNOWLEDGEMENTS
The authors thank the contributors of the TCGA (https://tcga‐data.nci.nih.gov/) database and GEO (http://www.ncbi.nlm.nih.gov/geo/) database for sharing their data of pancreatic cancer on open access. This work was supported by the Key Laboratory of High‐Incidence‐Tumor Prevention and Treatment (Guangxi Medical University), Ministry of Education (grant nos. GKE 2018‐01, GKE 2019‐11, and GKE‐ZZ202009), the Guangxi Key Laboratory for the Prevention and Control of Viral Hepatitis (No. GXCDCKL201902), the Natural Science Foundation of Guangxi Province of China (grant no. 2020GXNSFAA159127), and Guangxi Medical and Health Appropriate Technology Development and Application Project (No. S2021100).
Gao, Q. , et al.: Comprehensive analysis of LILR family genes expression and tumour‐infiltrating immune cells in early‐stage pancreatic ductal adenocarcinoma. IET Syst. Biol. 17(2), 39–57 (2023). 10.1049/syb2.12058
DATA AVAILABILITY STATEMENT
The raw data supporting the conclusion of this article will be made available by the authors, without undue reservation.
REFERENCES
- 1. Bray, F. , et al.: Global cancer statistics 2018: GLOBOCAN estimates of incidence and mortality worldwide for 36 cancers in 185 countries. CA A Cancer J. Clin. 68(6), 394–424 (2018). 10.3322/caac.21492 [DOI] [PubMed] [Google Scholar]
- 2. Tjomsland, V. , et al.: The desmoplastic stroma plays an essential role in the accumulation and modulation of infiltrated immune cells in pancreatic adenocarcinoma. Clin. Dev. Immunol. 2011, 212810 (2011). 10.1155/2011/212810 [DOI] [PMC free article] [PubMed] [Google Scholar]
- 3. Siegel, R.L. , Miller, K.D. , Jemal, A. : Cancer statistics, 2019. CA A Cancer J. Clin. 69(1), 7–34 (2019). 10.3322/caac.21551 [DOI] [PubMed] [Google Scholar]
- 4. Nevala‐Plagemann, C. , Hidalgo, M. , Garrido‐Laguna, I. : From state‐of‐the‐art treatments to novel therapies for advanced‐stage pancreatic cancer. Nat. Rev. Clin. Oncol. 17(2), 108–123 (2019). 10.1038/s41571-019-0281-6 [DOI] [PubMed] [Google Scholar]
- 5. Kalager, M. , et al.: Effect of screening mammography on breast‐cancer mortality in Norway. N. Engl. J. Med. 363(13), 1203–1210 (2010). 10.1056/NEJMoa1000727 [DOI] [PubMed] [Google Scholar]
- 6. Lauby‐Secretan, B. , et al.: International Agency for Research on Cancer Handbook Working: the IARC perspective on colorectal cancer screening. N. Engl. J. Med. 378(18), 1734–1740 (2018). 10.1056/NEJMsr1714643 [DOI] [PMC free article] [PubMed] [Google Scholar]
- 7. Kamisawa, T. , et al.: Pancreatic cancer. Lancet 388(10039), 73–85 (2016). 10.1016/S0140-6736(16)00141-0 [DOI] [PubMed] [Google Scholar]
- 8. Korc, M : Pancreatic cancer‐associated stroma production. Am. J. Surg. 194(4 Suppl), S84–S86 (2007). 10.1016/j.amjsurg.2007.05.004 [DOI] [PMC free article] [PubMed] [Google Scholar]
- 9. Bhagat, T.D. , et al.: Lactate‐mediated epigenetic reprogramming regulates formation of human pancreatic cancer‐associated fibroblasts. Elife 8 (2019). 10.7554/eLife.50663 [DOI] [PMC free article] [PubMed] [Google Scholar]
- 10. Feig, C. , et al.: The pancreas cancer microenvironment. Clin. Cancer Res. 18(16), 4266–4276 (2012). 10.1158/1078-0432.CCR-11-3114 [DOI] [PMC free article] [PubMed] [Google Scholar]
- 11. Ryan, D.P. , Hong, T.S. , Bardeesy, N. : Pancreatic adenocarcinoma. N. Engl. J. Med. 371(11), 1039–1049 (2014). 10.1056/NEJMra1404198 [DOI] [PubMed] [Google Scholar]
- 12. Esposito, I. , et al.: Inflammatory cells contribute to the generation of an angiogenic phenotype in pancreatic ductal adenocarcinoma. J. Clin. Pathol. (Lond.) 57(6), 630–636 (2004). 10.1136/jcp.2003.014498 [DOI] [PMC free article] [PubMed] [Google Scholar]
- 13. Fukunaga, A. , et al.: CD8+ tumor‐infiltrating lymphocytes together with CD4+ tumor‐infiltrating lymphocytes and dendritic cells improve the prognosis of patients with pancreatic adenocarcinoma. Pancreas 28(1), e26–e31 (2004). 10.1097/00006676-200401000-00023 [DOI] [PubMed] [Google Scholar]
- 14. Preynat‐Seauve, O. , et al.: Tumor‐infiltrating dendritic cells are potent antigen‐presenting cells able to activate T cells and mediate tumor rejection. J. Immunol. 176(1), 61–67 (2006). 10.4049/jimmunol.176.1.61 [DOI] [PubMed] [Google Scholar]
- 15. Nagorsen, D. , et al.: Tumor‐infiltrating macrophages and dendritic cells in human colorectal cancer: relation to local regulatory T cells, systemic T‐cell response against tumor‐associated antigens and survival. J. Transl. Med. 5(1), 62 (2007). 10.1186/1479-5876-5-62 [DOI] [PMC free article] [PubMed] [Google Scholar]
- 16. Fridman, W.H. , et al.: The immune contexture in human tumours: impact on clinical outcome. Nat. Rev. Cancer 12(4), 298–306 (2012). 10.1038/nrc3245 [DOI] [PubMed] [Google Scholar]
- 17. Giraldo, N.A. , et al.: The clinical role of the TME in solid cancer. Br. J. Cancer 120(1), 45–53 (2019). 10.1038/s41416-018-0327-z [DOI] [PMC free article] [PubMed] [Google Scholar]
- 18. Talmadge, J.E. , Donkor, M. , Scholar, E. : Inflammatory cell infiltration of tumors: jekyll or Hyde. Cancer Metastasis Rev. 26(3‐4), 373–400 (2007). 10.1007/s10555-007-9072-0 [DOI] [PubMed] [Google Scholar]
- 19. Mantovani, A. , et al.: Cancer‐related inflammation. Nature 454(7203), 436–444 (2008). 10.1038/nature07205 [DOI] [PubMed] [Google Scholar]
- 20. Brown, D. , Trowsdale, J. , Allen, R. : The LILR family: modulators of innate and adaptive immune pathways in health and disease. Tissue Antigens 64(3), 215–225 (2004). 10.1111/j.0001-2815.2004.00290.x [DOI] [PubMed] [Google Scholar]
- 21. Sloane, D.E. , et al.: Leukocyte immunoglobulin‐like receptors: novel innate receptors for human basophil activation and inhibition. Blood 104(9), 2832–2839 (2004). 10.1182/blood-2004-01-0268 [DOI] [PubMed] [Google Scholar]
- 22. van der Touw, W. , et al.: LILRB receptor‐mediated regulation of myeloid cell maturation and function. Cancer Immunol. Immunother. 66(8), 1079–1087 (2017). 10.1007/s00262-017-2023-x [DOI] [PMC free article] [PubMed] [Google Scholar]
- 23. Zhao, J. , et al.: The MHC class I‐LILRB1 signalling axis as a promising target in cancer therapy. Scand. J. Immunol. 90(5), e12804 (2019). 10.1111/sji.12804 [DOI] [PubMed] [Google Scholar]
- 24. Katz, H.R. : Inhibition of inflammatory responses by leukocyte Ig‐like receptors. Adv. Immunol. 91, 251–272 (2006). 10.1016/S0065-2776(06)91007-4 [DOI] [PubMed] [Google Scholar]
- 25. Nakajima, H. , et al.: Human myeloid cells express an activating ILT receptor (ILT1) that associates with Fc receptor gamma‐chain. J. Immunol. 162(1), 5–8 (1999). 10.4049/jimmunol.162.1.5 [DOI] [PubMed] [Google Scholar]
- 26. Mocsai, A. , Ruland, J. , Tybulewicz, V.L. : The SYK tyrosine kinase: a crucial player in diverse biological functions. Nat. Rev. Immunol. 10(6), 387–402 (2010). 10.1038/nri2765 [DOI] [PMC free article] [PubMed] [Google Scholar]
- 27. Ravetch, J.V. , Lanier, L.L. : Immune inhibitory receptors. Science 290(5489), 84–89 (2000). 10.1126/science.290.5489.84 [DOI] [PubMed] [Google Scholar]
- 28. Martin, A.M. , et al.: Leukocyte Ig‐like receptor complex (LRC) in mice and men. Trends Immunol. 23(2), 81–88 (2002). 10.1016/s1471-4906(01)02155-x [DOI] [PubMed] [Google Scholar]
- 29. Ivashkiv, L.B. : Cross‐regulation of signaling by ITAM‐associated receptors. Nat. Immunol. 10(4), 340–347 (2009). 10.1038/ni.1706 [DOI] [PMC free article] [PubMed] [Google Scholar]
- 30. Kang, X. , et al.: Inhibitory leukocyte immunoglobulin‐like receptors: immune checkpoint proteins and tumor sustaining factors. Cell Cycle 15(1), 25–40 (2016). 10.1080/15384101.2015.1121324 [DOI] [PMC free article] [PubMed] [Google Scholar]
- 31. Goto‐Yamaguchi, L. , et al.: Therapeutic predictors of neoadjuvant endocrine therapy response in estrogen receptor‐positive breast cancer with reference to optimal gene expression profiling. Breast Cancer Res. Treat. 172(2), 353–362 (2018). 10.1007/s10549-018-4933-5 [DOI] [PubMed] [Google Scholar]
- 32. Lu, N. , et al.: Human Semaphorin‐4A drives Th2 responses by binding to receptor ILT‐4. Nat. Commun. 9(1), 742 (2018). 10.1038/s41467-018-03128-9 [DOI] [PMC free article] [PubMed] [Google Scholar]
- 33. Tsukamoto, N. , et al.: Impairment of plasmacytoid dendritic cells for IFN production by the ligand for immunoglobulin‐like transcript 7 expressed on human cancer cells. Clin. Cancer Res. 15(18), 5733–5743 (2009). 10.1158/1078-0432.CCR-09-0171 [DOI] [PubMed] [Google Scholar]
- 34. Reid, B.M. , et al.: Genome‐wide analysis of common copy number variation and epithelial ovarian cancer risk. Cancer epidemiology, biomarkers & prevention: a publication of the American association for cancer research, cosponsored by the. Am. Soc. Prev. Oncol. 28(7), 1117–1126 (2019). 10.1158/1055-9965.EPI-18-0833 [DOI] [PMC free article] [PubMed] [Google Scholar]
- 35. Wan, R. , et al.: Human leukocyte antigen‐G inhibits the anti‐tumor effect of natural killer cells via immunoglobulin‐like transcript 2 in gastric cancer. Cell. Physiol. Biochem. 44(5), 1828–1841 (2017). 10.1159/000485819 [DOI] [PubMed] [Google Scholar]
- 36. Cai, Z. , et al.: Immunoglobulinlike transcript 4 and human leukocyte antigenG interaction promotes the progression of human colorectal cancer. Int. J. Oncol. 54(6), 1943–1954 (2019). 10.3892/ijo.2019.4761 [DOI] [PMC free article] [PubMed] [Google Scholar]
- 37. Liu, X. , et al.: ANGPTL2/LILRB2 signaling promotes the propagation of lung cancer cells. Oncotarget 6(25), 21004–21015 (2015). 10.18632/oncotarget.4217 [DOI] [PMC free article] [PubMed] [Google Scholar]
- 38. Zhang, P. , et al.: Immunoglobulin‐like transcript 4 promotes tumor progression and metastasis and up‐regulates VEGF‐C expression via ERK signaling pathway in non‐small cell lung cancer. Oncotarget 6(15), 13550–13563 (2015). 10.18632/oncotarget.3624 [DOI] [PMC free article] [PubMed] [Google Scholar]
- 39. Wang, L. , et al.: Co‐expression of immunoglobulin‐like transcript 4 and angiopoietin‐like proteins in human non‐small cell lung cancer. Mol. Med. Rep. 11(4), 2789–2796 (2015). 10.3892/mmr.2014.3029 [DOI] [PubMed] [Google Scholar]
- 40. Sun, Y. , et al.: Expression of Ig‐like transcript 4 inhibitory receptor in human non‐small cell lung cancer. Chest 134(4), 783–788 (2008). 10.1378/chest.07-1100 [DOI] [PubMed] [Google Scholar]
- 41. Li, X. , et al.: Expression of leukocyte immunoglobulin‐like receptor B2 in hepatocellular carcinoma and its clinical significance. J. Cancer Res. Therapeut. 14(7), 1655–1659 (2018). 10.4103/jcrt.JCRT_542_18 [DOI] [PubMed] [Google Scholar]
- 42. Monsivais‐Urenda, A. , et al.: Analysis of expression and function of the inhibitory receptor ILT2 (CD85j/LILRB1/LIR‐1) in peripheral blood mononuclear cells from patients with systemic lupus erythematosus (SLE). J. Autoimmun. 29(2‐3), 97–105 (2007). 10.1016/j.jaut.2007.05.003 [DOI] [PubMed] [Google Scholar]
- 43. Hofmeister, V. , Weiss, E.H. : HLA‐G modulates immune responses by diverse receptor interactions. Semin. Cancer Biol. 13(5), 317–323 (2003). 10.1016/s1044-579x(03)00022-1 [DOI] [PubMed] [Google Scholar]
- 44. Cortesini, R. : Pancreas cancer and the role of soluble immunoglobulin‐like transcript 3 (ILT3). JOP J. Pancreas 8(6), 697–703 (2007). [PubMed] [Google Scholar]
- 45. Suciu‐Foca, N. , et al.: Soluble Ig‐like transcript 3 inhibits tumor allograft rejection in humanized SCID mice and T cell responses in cancer patients. J. Immunol. 178(11), 7432–7441 (2007). 10.4049/jimmunol.178.11.7432 [DOI] [PubMed] [Google Scholar]
- 46. Xu, Z. , et al.: ILT3.Fc‐CD166 interaction induces inactivation of p70 S6 kinase and inhibits tumor cell growth. J. Immunol. 200(3), 1207–1219 (2018). 10.4049/jimmunol.1700553 [DOI] [PubMed] [Google Scholar]
- 47. Deng, M. , et al.: LILRB4 signalling in leukaemia cells mediates T cell suppression and tumour infiltration. Nature 562(7728), 605–609 (2018). 10.1038/s41586-018-0615-z [DOI] [PMC free article] [PubMed] [Google Scholar]
- 48. Liu, J. , et al.: Expression of ILT3 predicts poor prognosis and is inversely associated with infiltration of CD45RO+ T cells in patients with colorectal cancer. Pathol. Res. Pract. 214(10), 1621–1625 (2018). 10.1016/j.prp.2018.07.026 [DOI] [PubMed] [Google Scholar]
- 49. Zhang, Y. , et al.: Expression of immunoglobulin‐like transcript (ILT)2 and ILT3 in human gastric cancer and its clinical significance. Mol. Med. Rep. 5(4), 910–916 (2012). 10.3892/mmr.2012.744 [DOI] [PMC free article] [PubMed] [Google Scholar]
- 50. Wei, L. , et al.: TCGA‐assembler 2: software pipeline for retrieval and processing of TCGA/CPTAC data. Bioinformatics 34(9), 1615–1617 (2018). 10.1093/bioinformatics/btx812 [DOI] [PMC free article] [PubMed] [Google Scholar]
- 51. da Huang , W. , Sherman, B.T. , Lempicki, R.A. : Systematic and integrative analysis of large gene lists using DAVID bioinformatics resources. Nat. Protoc. 4(1), 44–57 (2009). 10.1038/nprot.2008.211 [DOI] [PubMed] [Google Scholar]
- 52. Kanehisa, M. , Goto, S. : KEGG: kyoto encyclopedia of genes and genomes. Nucleic Acids Res. 28(1), 27–30 (2000). 10.1093/nar/28.1.27 [DOI] [PMC free article] [PubMed] [Google Scholar]
- 53. Warde‐Farley, D. , et al.: The GeneMANIA prediction server: biological network integration for gene prioritization and predicting gene function. Nucleic Acids Res. 38(Web Server issue), W214–W220 (2010). 10.1093/nar/gkq537 [DOI] [PMC free article] [PubMed] [Google Scholar]
- 54. Szklarczyk, D. , et al.: STRING v11: protein‐protein association networks with increased coverage, supporting functional discovery in genome‐wide experimental datasets. Nucleic Acids Res. 47(D1), D607–D613 (2019). 10.1093/nar/gky1131 [DOI] [PMC free article] [PubMed] [Google Scholar]
- 55. Heagerty, P.J. , Zheng, Y. : Survival model predictive accuracy and ROC curves. Biometrics 61(1), 92–105 (2005). 10.1111/j.0006-341X.2005.030814.x [DOI] [PubMed] [Google Scholar]
- 56. B, O.H. , et al.: Development and validation of a simple‐to‐use nomogram for predicting 5‐, 10‐, and 15‐year survival in asymptomatic adults undergoing coronary artery calcium scoring. JACC Cardiovasc Imaging 11(3), 450–458 (2018). 10.1016/j.jcmg.2017.03.018 [DOI] [PMC free article] [PubMed] [Google Scholar]
- 57. Subramanian, A. , et al.: Gene set enrichment analysis: a knowledge‐based approach for interpreting genome‐wide expression profiles. Proc. Natl. Acad. Sci. U. S. A. 102(43), 15545–15550 (2005). 10.1073/pnas.0506580102 [DOI] [PMC free article] [PubMed] [Google Scholar]
- 58. Newman, A.M. , et al.: Robust enumeration of cell subsets from tissue expression profiles. Nat. Methods 12(5), 453–457 (2015). 10.1038/nmeth.3337 [DOI] [PMC free article] [PubMed] [Google Scholar]
- 59. Jamieson, N.B. , et al.: The relationship between tumor inflammatory cell infiltrate and outcome in patients with pancreatic ductal adenocarcinoma. Ann. Surg Oncol. 19(11), 3581–3590 (2012). 10.1245/s10434-012-2370-y [DOI] [PubMed] [Google Scholar]
- 60. La Torre, M. , et al.: The glasgow prognostic score as a predictor of survival in patients with potentially resectable pancreatic adenocarcinoma. Ann. Surg Oncol. 19(9), 2917–2923 (2012). 10.1245/s10434-012-2348-9 [DOI] [PubMed] [Google Scholar]
- 61. Lanfranca, M.P. , et al.: Interleukin 22 signaling regulates acinar cell plasticity to promote pancreatic tumor development in mice. Gastroenterology 158(5), 1417–1432.e11 (2019). 10.1053/j.gastro.2019.12.010 [DOI] [PMC free article] [PubMed] [Google Scholar]
- 62. Chan, M.P. , et al.: Next‐generation sequencing implicates oncogenic roles for p53 and JAK/STAT signaling in microcystic adnexal carcinomas. Mod. Pathol. 33(6), 1092–1103 (2019). 10.1038/s41379-019-0424-4 [DOI] [PubMed] [Google Scholar]
- 63. Nigri, J. , et al.: PAP/REG3A favors perineural invasion in pancreatic adenocarcinoma and serves as a prognostic marker. Cell. Mol. Life Sci. CM 74(22), 4231–4243 (2017). 10.1007/s00018-017-2579-9 [DOI] [PMC free article] [PubMed] [Google Scholar]
- 64. Owen, K.L. , Brockwell, N.K. , Parker, B.S. : JAK‐STAT signaling: a double‐edged sword of immune regulation and cancer progression. Cancers 11(12), 2002 (2019). 10.3390/cancers11122002 [DOI] [PMC free article] [PubMed] [Google Scholar]
- 65. Kobayashi, Y. , Lim, S.O. , Yamaguchi, H. : Oncogenic signaling pathways associated with immune evasion and resistance to immune checkpoint inhibitors in cancer. Semin. Cancer Biol. 65, 51–64 (2019). 10.1016/j.semcancer.2019.11.011 [DOI] [PubMed] [Google Scholar]
- 66. Gotthardt, D. , et al.: JAK/STAT cytokine signaling at the crossroad of NK cell development and maturation. Front. Immunol. 10, 2590 (2019). 10.3389/fimmu.2019.02590 [DOI] [PMC free article] [PubMed] [Google Scholar]
- 67. Shibutani, M. , et al.: Tumor‐infiltrating lymphocytes predict the chemotherapeutic outcomes in patients with stage IV colorectal cancer. In Vivo 32(1), 151–158 (2018). 10.21873/invivo.11218 [DOI] [PMC free article] [PubMed] [Google Scholar]
- 68. Brockhoff, G. , et al.: The presence of PD‐1 positive tumor‐infiltrating lymphocytes in triple negative breast cancers is associated with a favorable outcome of disease. Oncotarget 9(5), 6201–6212 (2018). 10.18632/oncotarget.23717 [DOI] [PMC free article] [PubMed] [Google Scholar]
- 69. Ascierto, P.A. , et al.: Prognostic impact of baseline tumour immune infiltrate on disease‐free survival in patients with completely resected, BRAF(v600) mutation‐positive melanoma receiving adjuvant vemurafenib. Ann. Oncol. 31(1), 153–159 (2020). 10.1016/j.annonc.2019.10.002 [DOI] [PubMed] [Google Scholar]
- 70. Liu, R. , et al.: Tumour immune cell infiltration and survival after platinum‐based chemotherapy in high‐grade serous ovarian cancer subtypes: a gene expression‐based computational study. EBioMedicine 51, 102602 (2020). 10.1016/j.ebiom.2019.102602 [DOI] [PMC free article] [PubMed] [Google Scholar]
- 71. Li, J. , et al.: Tumor cell‐intrinsic USP22 suppresses antitumor immunity in pancreatic cancer. Cancer Immunol. Res. 8(3), 282–291 (2019). 10.1158/2326-6066.CIR-19-0661 [DOI] [PMC free article] [PubMed] [Google Scholar]
- 72. Tang, X. , et al.: Clinical significance of the immune cell landscape in hepatocellular carcinoma patients with different degrees of fibrosis. Ann. Transl. Med. 7(20), 528 (2019). 10.21037/atm.2019.09.122 [DOI] [PMC free article] [PubMed] [Google Scholar]
- 73. Baxevanis, C.N. , Fortis, S.P. , Perez, S.A. : The balance between breast cancer and the immune system: challenges for prognosis and clinical benefit from immunotherapies. Semin. Cancer Biol. 72, 76–89 (2019). 10.1016/j.semcancer.2019.12.018 [DOI] [PubMed] [Google Scholar]
- 74. Bassani, B. , et al.: Natural killer cells as key players of tumor progression and angiogenesis: old and novel tools to divert their pro‐tumor activities into potent anti‐tumor effects. Cancers 11(4), 461 (2019). 10.3390/cancers11040461 [DOI] [PMC free article] [PubMed] [Google Scholar]
- 75. Bruno, A. , et al.: A think tank of TINK/TANKs: tumor‐infiltrating/tumor‐associated natural killer cells in tumor progression and angiogenesis. J. Natl. Cancer Inst. 106(8), dju200 (2014). 10.1093/jnci/dju200 [DOI] [PMC free article] [PubMed] [Google Scholar]
- 76. Newman, A.M. , et al.: Robust enumeration of cell subsets from tissue expression profiles. Nat. Methods 12(5), 453–457 (2015). 10.1038/nmeth.3337 [DOI] [PMC free article] [PubMed] [Google Scholar]
Associated Data
This section collects any data citations, data availability statements, or supplementary materials included in this article.
Supplementary Materials
Supporting Information S1
Table S1
Table S2
Table S3
Data Availability Statement
The raw data supporting the conclusion of this article will be made available by the authors, without undue reservation.


