Directed evolution is a powerful tool for improving existing properties and imparting completely new functionalities onto proteins.1–4 Nonetheless, even in small proteins its potential is inherently limited by the astronomical number of possible amino acid sequences. Sampling the complete sequence space of a 100-residue protein would require testing of 20100 combinations, which is currently beyond any existing experimental approach. Fortunately, in practice, selective modification of relatively few residues is sufficient for efficient improvement, functional enhancement and repurposing of existing proteins.5 Moreover, computational methods have been developed to predict the location, and, in certain cases, identities of potentially productive mutations.6–9 Importantly, all current approaches for prediction of hot spots and productive mutations rely heavily on structural information and/or bioinformatics, which is not always available for proteins of interest. Moreover, they offer limited ability to identify beneficial mutations far from the active site, even though such changes may dramatically improve the catalytic properties of an enzyme.10 Machine learning methods have recently showed promise in predicting productive mutations,11 yet they often require large high quality training data sets which are hard to obtain in directed evolution experiments. Here we show that mutagenic hot spots in enzymes can be identified using Nuclear Magnetic Resonance (NMR) spectroscopy. In a proof-of-concept study, we converted myoglobin, a non-enzymatic oxygen storage protein, into a highly efficient Kemp eliminase using only three mutations. The observed levels of catalytic efficiency (kcat/KM of 1.6 × 10⁷ M−1s−1 and kcat/kuncat > 108) are the highest reported for any designed protein and are on par with the levels shown by natural enzymes for the reactions they are evolved to catalyze. Given the simplicity of this experimental approach, which requires no a priori structural or bioinformatic knowledge, we expect it to be widely applicable and to unleash the full potential of directed enzyme evolution.
Recent paradigm shifting advances in understanding the fundamental principles that drive enzyme evolution point to a major role of global conformational selection for productive arrangements of functional groups to perfect transition state stabilization, as well as steric and electrostatic interactions12–16. Here we seek to build on this recent work to predict experimentally the locations of the productive mutations that can minimize non-essential protein dynamics to achieve high catalytic efficiency. Efficient catalysis relies on tight and specific association of the substrate with the enzyme, placing it in a unique anisotropic environment (often with a high dipole moment, considered to be important for activity17). Experimentally, such an environment can be evaluated using NMR, which provides residue-level information under catalytic conditions without the need for full structural characterization. In a conformational ensemble, residues that require substantial reorganization to adopt or to increase the population of a specific rotamer to support the transition state should experience a large change in their NMR chemical shift upon addition of the corresponding transition state analog (usually a competitive inhibitor). Thus, analysis of the chemical shift perturbation (CSP) upon inhibitor addition may help identify mutagenic hot spots in the protein structure, both near and far from the active site.
Kemp elimination (Fig. 1) is a well-established and benchmarked model reaction for testing protein design and evolution methodologies18–26. Inspired by the recent discovery of redox-mediated Kemp elimination promoted by cytochrome P45027 and aldoxime dehydratases28, we set out to explore whether an NMR-guided approach can be successfully used to evolve a novel Kemp eliminase from a non-enzymatic heme protein. For an unbiased test of the approach, we chose not to perform any computational pre-selection of possible candidates, but rather focused on the simplest proteins. Myoglobin (Mb), arguably the most well-characterized heme protein, adopts catalytic functionalities upon replacement of distal histidine His6429, which in the native protein controls oxygen binding and slows heme oxidation. Mb-H64V has been extensively studied before30, so we experimentally tested this mutant for the ability to promote Kemp elimination. In the reduced form, Mb-H64V demonstrated catalytic efficiency of 255 M−1s−1 at pH 8.0 presenting itself as a promising candidate for NMR-guided directed evolution (Table 1). Even with paramagnetism and high helical content of the reduced protein, a nearly full backbone assignment was possible, which enabled us to perform a CSP study using 6-nitrobenzotriazole (6-NBT), an inhibitor of Kemp elimination (Fig. 1). The data show 15 hot spots, defined as regions with residue CSP Z-scores of above ca. 1, dispersed around the protein, both near to and away from the heme cofactor (Fig. 2a,d). Next, we prepared saturation mutagenesis libraries in all positions with Z≳1 and their immediate neighbors (except for the proximal His93 that was not considered as it is required for the heme cofactor binding). Crude lysate screening of the saturation mutagenesis libraries showed hits in all hot spots. Purification of the identified proteins confirmed the screening results in all cases (with increases in catalytic efficiencies ranging from 2-fold to 72-fold, with an average of 20-fold) except in one instance (Mb-H64V/Q152M), where we were unable to produce enough soluble protein for kinetic characterization. Nine of the 19 identified productive mutations were located away from the active site (Fig. 2d).
Fig. 1 |. Kemp elimination promoted by acid-base or redox mechanisms.
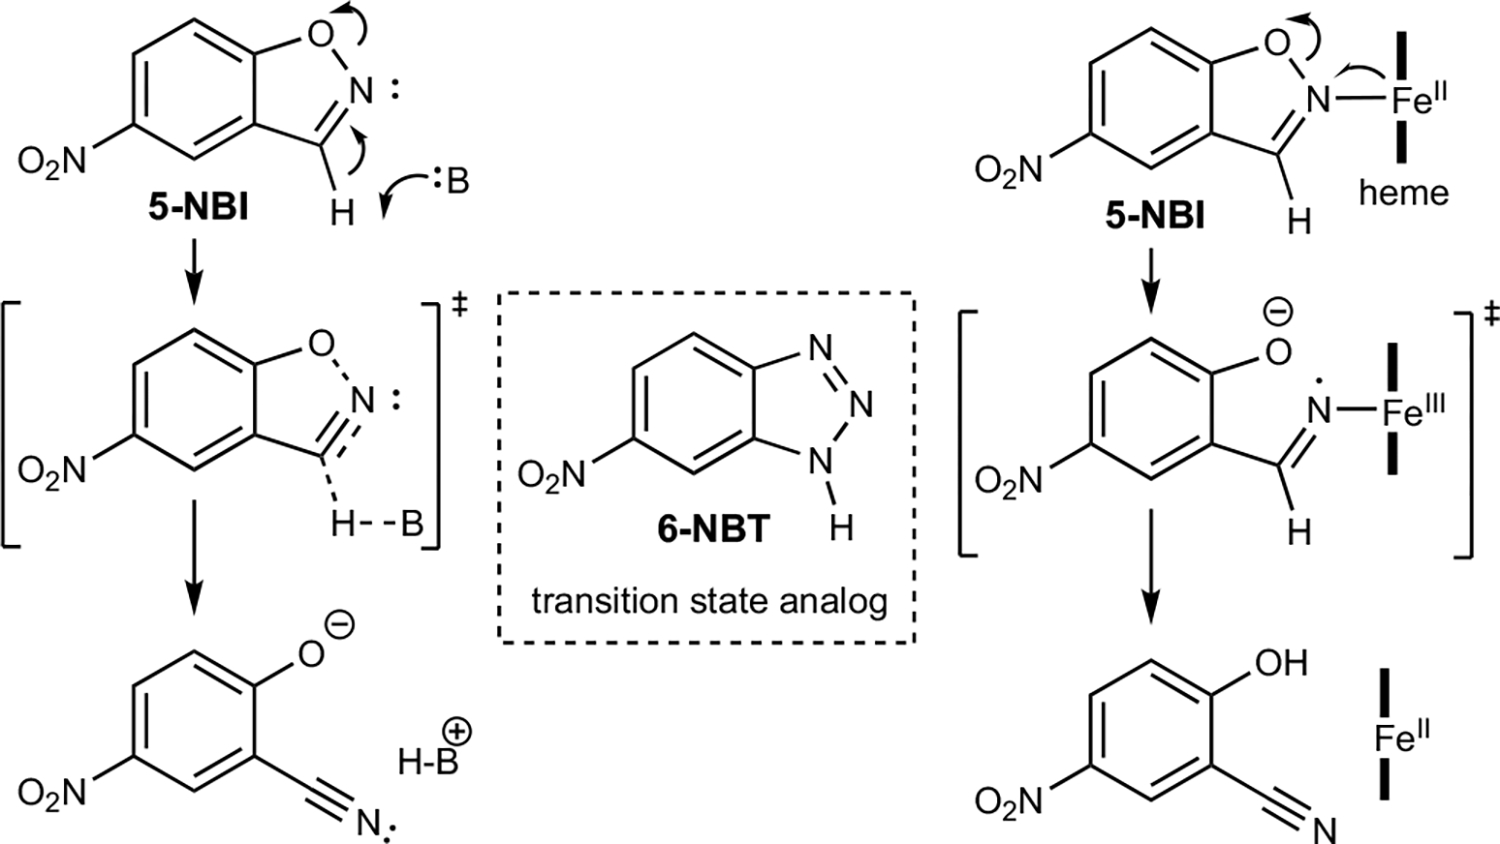
Table 1 |.
Kinetic parameters for Kemp elimination promoted by selected Kemp eliminases at pH 8.0. The myoglobin mutants were reduced unless stated otherwise.
| Protein | kcat, s−1 | KM, mM | kcat/KM, M−1s−1 |
|---|---|---|---|
| Mb-H64Va | − | − | 7 ± 1b |
| Mb-H64V | − | − | 255 ± 8b |
| Mb-H64V/F43L | 26.10 ± 3.85 | 1.94 ± 0.38 | 13,458 ± 670 |
| Mb-H64V/V68A | − | − | 12,939 ± 622b |
| Mb-H64V/L29I | − | − | 1,550 ± 55b |
| Mb-H64G | − | − | 18,152 ± 519b |
| Mb-H64G/V68A | 2,557 ± 372 | 1.28 ± 0.28 | 1,992,300 ± 143,420 |
| FerrElCat (Mb-L29I/H64G/V68A) |
3,656 ± 667 | 0.23 ± 0.13 | 15,721,000 ± 6,035,800 |
| AlleyCat | − | − | 5.8 ± 0.3b,c |
| AlleyCat7 | 3.2 ± 0.2c | 2.4 ± 0.2c | 1283 ± 13c |
| AlleyCat8 | 10.1 ± 1.5 | 4.1 ± 0.7 | 2451 ± 15 2369 ± 99d |
| AlleyCat8-T146R | 5.8 ± 0.7 | 1.6 ± 0.3 | 3563 ± 39 |
| AlleyCat9 | 18.9 ± 3.9 | 4.9 ± 1.2 | 3857 ± 27 3894 ± 61d |
| AlleyCat10 | 21.2 ± 2.8 | 4.8 ± 0.7 | 4378 ± 20 4392 ± 83d |
Oxidized form.
Individual kcat and KM values could not be determined due to substrate solubility.
from ref.31.
(kcat/KM)max values were obtained from the pH activity profiles.
Fig. 2 |. NMR-guided evolution of myoglobin.
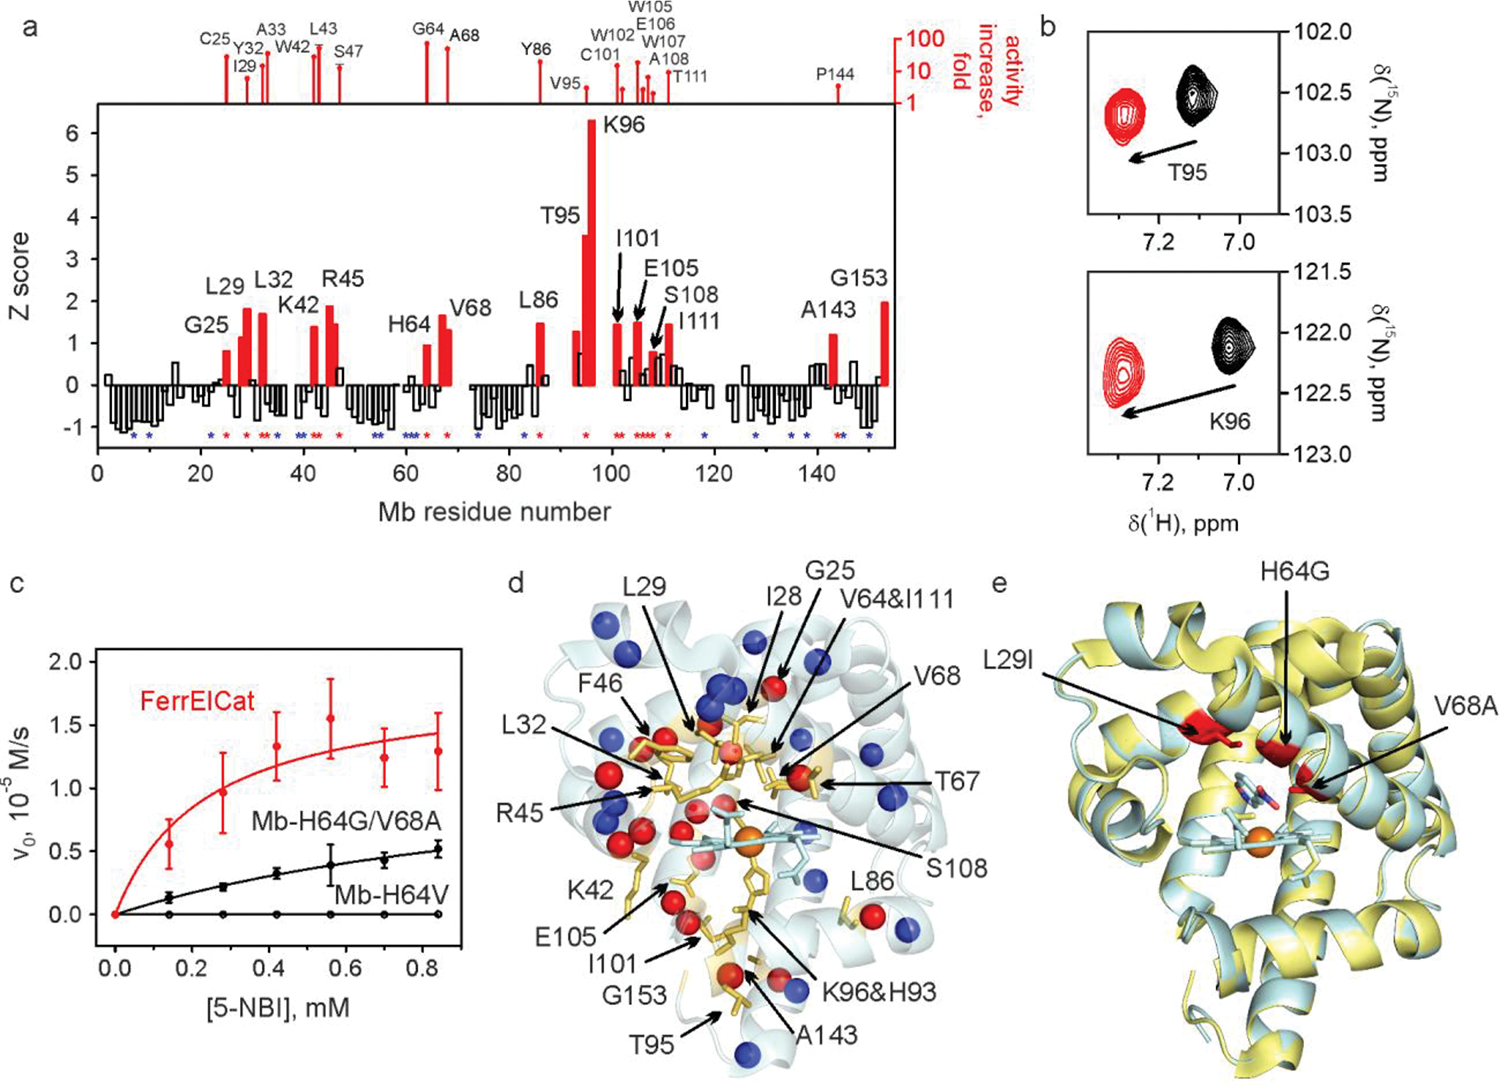
a, Backbone amide CSP of Mb-H64V upon addition of 2 molar equivalents of 6-NBT. The red bars indicate the protein regions experiencing large chemical shift perturbation (Z≳1). No bars are provided where no backbone resonance assignment could be made. The positions where productive mutations were found are marked by red asterisks (along with the corresponding increase in kcat/KM relative to Mb-H64V, top). Positions where screening identified no productive mutations are marked by blue asterisks. The corresponding representative 1H-15N HSQC spectral regions are shown in panel b. c, Michaelis-Menten plots for representative proteins. d, NMR CSP data mapped on the X-ray crystal structure of Mb-H64V (PDB 6cf0) showing the residues with prominent changes (Z≳1) as yellow sticks. The spheres show backbone nitrogen atoms of the residues with identified productive mutations (red) or those for which no productive mutations could be found (blue). e, Overlay of the crystal structures of Mb-H64V (yellow) and FerrElCat with the docked inhibitor (cyan). The newly introduced mutations are shown in red.
Saturation mutagenesis performed in 18 randomly selected positions with small CSP yielded no hits (Fig. 2a, blue asterisks). Since the probability of finding productive mutations is highest close to the active site, we have sampled all cold spots in the immediate vicinity of the active site and tried to provide a representative sampling of the positions located further away (Extended Data Fig. 1). In a subsequent non-exhaustive gene shuffling experiment, we found that L29I, H64G and V68A can be productively combined with positive synergy (the triple mutant is 3-fold more active than predicted from the three individual mutations), a trait quite uncommon in traditional directed evolution experiments. The resulting enzyme Mb-L29I/H64G/V68A, named FerrElCat for FERRous Kemp ELimination CATalyst, showed a remarkable Kemp elimination activity with catalytic efficiency of 15,721,000 M−1s−1 at pH 8 (Table 1). This level of catalytic efficiency is almost two orders of magnitude higher than that of the most active reported Kemp eliminase HG3.17, evolved in 17 rounds of directed evolution20, and is on par with the levels shown by natural enzymes for the reactions they have evolved to catalyze, being just 1–2 orders of magnitude from the diffusion limit. Importantly, the NMR-guided approach yields mutants with high kcat values (3,656 s−1 for FerrElCat), a trait that is often hard to achieve in traditional approaches to directed evolution, where high levels of catalytic efficiency are often achieved by lowering the KM. FerrElCat is capable of at least 10,000 turnovers before showing signs of product inhibition (Extended Data Fig. 2). The unprecedented, experimentally guided ca. 62,000-fold improvement in catalytic efficiency (Extended Data Fig. 3) over the starting design was obtained with only three mutations in a non-enzymatic protein (Fig. 2c). The crystal structure of FerrElCat shows remarkable similarity to the starting point of the evolution31 (backbone RMSD of 0.16 Å, Fig. 2e) and the newly introduced mutations had only minor effect on the cofactor redox potential (Extended Data Fig. 4). While we were unable to obtain a crystal structure of FerrElCat with an inhibitor, docking studies (Fig. 2e) show that directed evolution results in the creation of a tight binding pocket bringing the substrate into proximity to the heme iron. Strikingly, we were unable to dock either 5-NBI or 6-NBT into the crystal structure of Mb-H64V, since computationally predicted binding pocket is too small (Fig. 2d). Yet, CSP analysis clearly shows association of the inhibitor with the protein, highlighting the power of NMR to readily identify productive arrangements of molecules that may not be apparent in modelling based on static crystal structures.
To test the general applicability of the NMR-guided directed evolution we applied it to the Kemp eliminases of the AlleyCat family that promote benzisoxazole ring opening using base-facilitated catalysis.18–24 AlleyCat was designed using a minimalist approach by introducing a single glutamate residue into the 74-residue C-terminal domain of calmodulin (cCaM), a non-enzymatic protein32. Subsequently, in seven rounds of directed evolution using saturation mutagenesis, error-prone PCR (epPCR) and gene shuffling, we evolved AlleyCat into AlleyCat7, which showed turnover numbers on par with some of the best examples of Kemp eliminases.33 Due to its small size, diamagnetism, extensive previous characterization, and a wealth of functional data obtained through traditional approaches to directed evolution, the AlleyCat proteins provide an excellent and unbiased test-bed for the NMR-guided directed evolution both retrospectively, to evaluate the performance of CSP based approaches, and prospectively to test the limits of the method. CSP maxima observed upon titrating 6-NBT into the C-terminal domain of calmodulin that was used as a starting point of the design (Fig. 3a) are in excellent agreement with the first three mutations introduced into the protein during the design and subsequent directed evolution33: F92E, M144R and H107I. Residue 107 is notably not part of the substrate binding pocket. Upon introduction of the F92E mutation, a new hot spot consistent with the previously found productive A88Q mutation in AlleyCat appears (Fig. 3a). Interestingly, we observed a drop in CSP Z-values in the C-terminal region of the protein, where beneficial mutations in positions 144 and 145 were found in AlleyCat, potentially related to a more than 3-fold drop in affinity for the inhibitor (Kd of 3.3 mM for AlleyCat vs. 1.0 mM for cCaM). Encouraged by the similarity between the traditional and NMR-guided evolution trajectories, we undertook a prospective study to determine whether CSP analysis could be used to improve the catalytic efficiency of AlleyCat7. The CSP data for AlleyCat7 (Fig. 3b) are quite different from those of cCaM and AlleyCat both in terms of positions of the major peaks as well as their relative magnitude. We chose not to pursue residues in the calcium-binding EF-hand domains that are essential for both the fold and allosteric regulation. Since we have already introduced mutations at positions 124, 128 and 144, we performed saturation mutagenesis at position 125. AlleyCat7-I125H (named AlleyCat8) identified in the screening showed a 3-fold increase in kcat (Table 1). No beneficial mutations were found by saturation mutagenesis studies of any positions that did not show significant CSP (Fig. 3b, blue asterisks). The CSP graph for AlleyCat8 again shows significant changes (Fig. 3c). The most prominent shifts for AlleyCat8 are observed for residues 114–116, which were little affected in previous generations of the protein, as well as residues 143 and 146. Saturation mutagenesis in positions 114, 115, 116 and 146 (position 143 is next to the previously mutated Met144) yielded productive mutations K115P (a variant subsequently called AlleyCat9) and T146R, showing significant improvements in kcat/KM, driven by the increase in kcat for the former and the decrease in KM for the latter. The effect of these two mutations is additive, so that the resulting protein AlleyCat10 shows kcat/KM of 4,378 M−1s−1, and kcat of 21.0 s−1. This represents a 750-fold improvement in catalytic efficiency over the starting design (a value second only to that shown by FerrElCat, Extended Data Fig. 3) that was achieved almost exclusively by improving kcat.
Fig. 3 |. NMR-guided evolution of calmodulin.
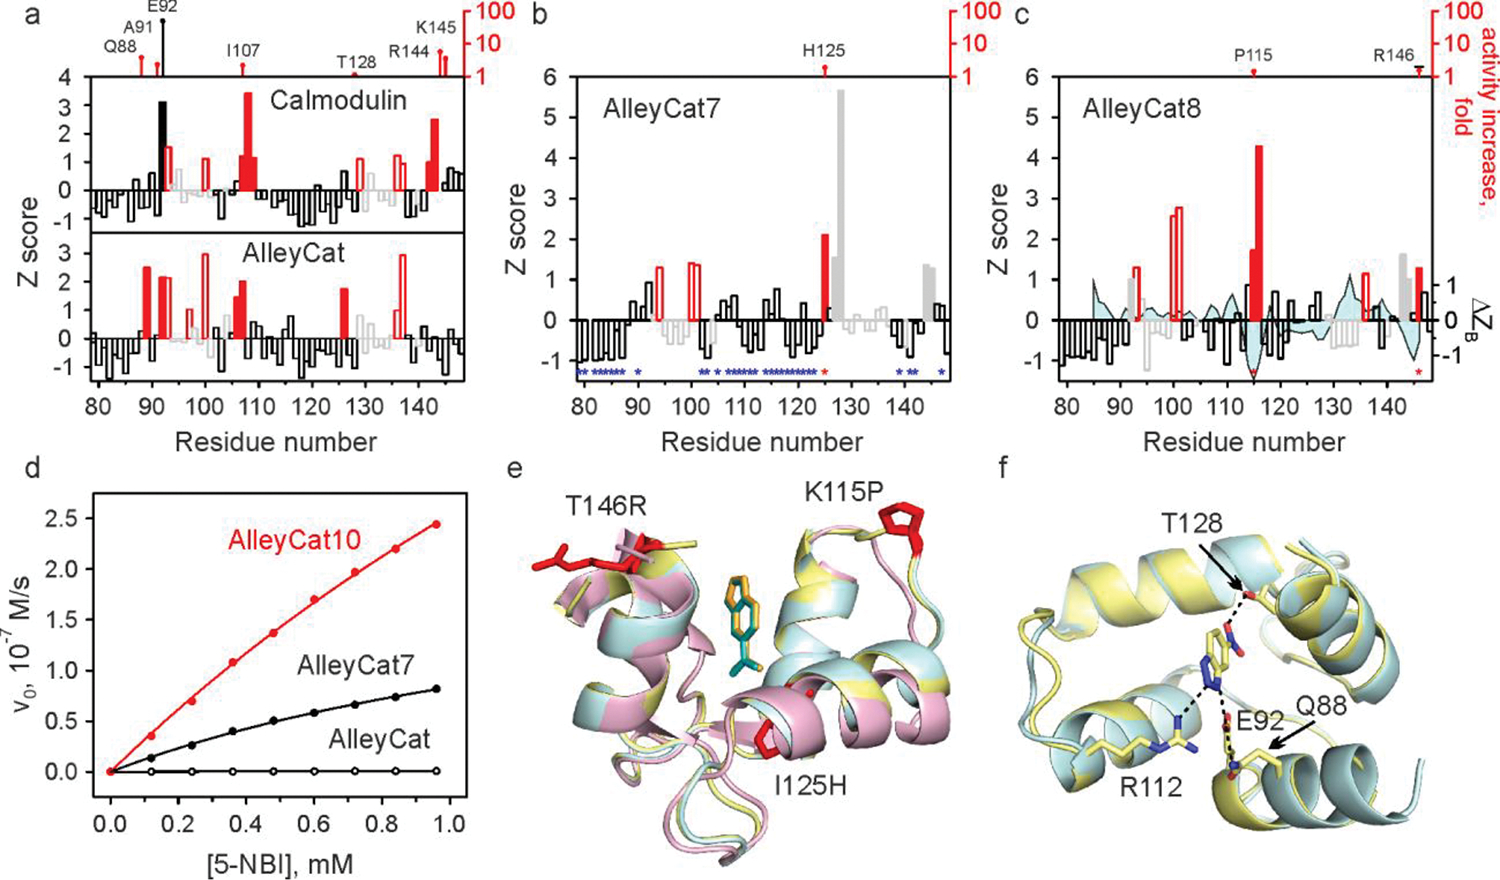
a-c, Backbone amide CSP of cCaM/AlleyCat (a), AlleyCat7 (b) and AlleyCat8 (c) upon addition of 2 molar equivalents of 6-NBT. The red bars indicate the protein regions experiencing large chemical shift perturbation (Z≳1). The open red and grey bars identify EF hand residues. The catalytic F92E mutation is shown with a solid black bar. The positions where productive mutations were found are marked by red asterisks in b and c (along with the corresponding increase in kcat/KM relative to the previous round of design, top). Positions where screening identified no productive mutations are marked by blue asterisks in b. The solid grey bars in b and c refer to residues already mutated in previous rounds. The difference in Z-score of crystallographic B-factors (Cα) for the inhibitor bound and free AlleyCat9 is mapped onto the CSP data on AlleyCat8 (ΔZB trace in c). d Michaelis-Menten plots for representative proteins. e Overlay of the crystal structures of C-terminal domain of calmodulin (magenta), AlleyCat9 with the inhibitor (cyan) and AlleyCat10 with the inhibitor (yellow). The residues identified in CSP analysis are shown in red. f Overlay of the crystal structures of apo (cyan) and the inhibitor bound (yellow) in AlleyCat10.
The new members of the AlleyCat family fully preserve allosteric regulation by calcium (Extended Data Fig. 5). Crystallographic characterization of AlleyCat9 and AlleyCat10 both in the absence and in the presence of the inhibitor shows that these highly evolved variants, having more than 10% of their sequence mutated, remain structurally very similar (backbone RMSD 0.6–0.9 Å) to the C-terminal domain of calmodulin that served as a basis for the design (Fig. 3e,f).34 Two of the three newly introduced productive mutations, Pro115 and Arg146, are located away from the active site (> 10 Å from the inhibitor), showing the practical utility of CSP patterns to identify effectively mutagenic hot spots across the whole protein. Analysis of the difference in crystallographic B-factors in the crystal structures of the apo and the inhibitor bound AlleyCat9 (Fig. 3c) shows significant rigidification of the protein structure upon binding of the transition state analog, consistent with the contribution of protein dynamics to the observed CSP patterns.
In conclusion, we have discovered a strong correlation between the degree of NMR CSP of backbone amide resonances in 15N-1H HSQC spectra of enzymes by an inhibitor and the probability of finding a beneficial mutation in the vicinity of that residue. The chemical shift perturbation maps are highly sensitive to minor changes in protein sequences and pinpoint areas likely to affect catalytic activity, even if located far from the active site. In a proof-of-concept study, we converted myoglobin, a non-enzymatic oxygen storage protein, into a highly efficient Kemp eliminase using only three mutations. To our knowledge, this represents the first example of an experimental approach to guide directed evolution that does not rely on a priori structural or bioinformatic analyses, and only requires reliable backbone amide assignments and an appropriate inhibitor. Such NMR data can usually be easily obtained for soluble, folded proteins with fewer than about 300 residues, a criterion that is true for many enzymes selected for directed evolution. Given the simplicity of this experimental approach, which we applied successfully to two unrelated proteins that utilize different mechanisms, we expect the CSP-guided methodology to be widely applicable to other proteins and unleash the full potential of directed evolution to rapidly create new enzymes for practically important chemical transformations. These results also highlight the power of the minimalist approach to design of protein catalysts35, which allows for quick and inexpensive identification of starting points for subsequent directed evolution without detailed consideration of the reaction mechanism as well as extensive computation, and instead exploits the incredible plasticity of proteins to adopt new functions. Last but not least, our results contribute to the ongoing debate about the role of dynamics in enzymatic catalysis12–16 by prospectively validating the importance of conformational flexibility in protein evolution. This opens the path to new fundamental studies of enzymatic function and evolution.
Methods
Chemicals and reagents
Reagents and buffers were purchased from Biobasic, Inc. and Santa Cruz Biotechnology, Inc. Buffers were made using MilliQ water (Millipore Elix 3 instrument). DNA oligonucleotides were purchased from Integrated DNA technologies (IDT). All enzymes for cloning and mutagenesis were obtained from Thermo Fischer Scientific. E. coli BL21 (DE3), BL21 (DE3) pLysS, and NEB5α cells were purchased from Promega and New England Biolabs (NEB). 5-nitrobenzisoxazole (5-NBI) was prepared according to the literature procedure36 while 6-nitrobenzotriazole (6-NBT) was purchased from AK scientific. pET28a(+) vector was obtained from Novagen. (L)-Ascorbic acid, superoxide dismutase and catalase (from bovine liver) were obtained from Sigma Aldrich. Labeled 15NH4Cl and 13C6-D-glucose were purchased from Cambridge Isotope Laboratories.
Protein expression and purification
Myoglobin variants.
His64 was mutated to valine (H64V) using splicing by overlap extension (SOE) PCR. At the first PCR, the combination of mutagenic primers targeting the desired site and primer pair overlapping the 5’ and 3’ termini of the gene generated two mutant fragments (primer sequences for two pairs of primers are shown in Supplementary Table 1: NcoI_XhoI_F + H64V_R and NcoI_XhoI_R + H64V_F) which served as templates for the second PCR. Product of the second PCR was cloned into pET28a vector using NcoI and XhoI restriction sites. Mutations were introduced as needed using SOE protocol instead of site-directed mutagenesis. Myoglobin proteins contain many histidine residues (Mb-H64V has 11 His residues) and bind to the Ni-NTA column without any additional His-tag. Plasmids encoding the appropriate genes in pET28a vector were transformed into E. coli BL21 (DE3) and plated on LB agar with 50 μg/mL kanamycin (Kan). This concentration of antibiotic was used in all experiments. Single colonies were inoculated into LB media containing Kan and grown at 37 °C for 5–6 h. Starter culture (10 mL) was inoculated into LB (1 L) with Kan and allowed to grow at 37 °C until OD600 reached 0.6–0.8. Next, δ-aminolevulinic acid (Tokyo Chemical Industry, 0.3 mM) was added and the culture was induced by the addition of 0.25 mM isopropyl-β-D-1-thiogalactopyranoside (IPTG) and grown at 25 °C for 20 h. Cells were harvested by centrifugation at 4 °C, 4,000 g, flash frozen in liquid nitrogen and stored at −80 °C. For protein purification, cells were resuspended in buffer A (25 mM TRIS, pH 8.0), lysed by sonication, and centrifuged to isolate the soluble fraction. The lysate was loaded onto a Ni-NTA column (Clontech) pre-equilibrated with buffer A, washed and eluted using a gradient of 20–250 mM imidazole in buffer A. Protein fractions were exchanged into buffer B (20 mM HEPES, pH 7.0) using desalting column. Further purification was performed on cation exchange column (HiTrap SP HP, GE Healthcare) and FPLC in buffer B using NaCl gradient of 0–600 mM (this step is absolutely critical). Eluted protein fractions were analyzed by UV-vis spectroscopy and only the fractions with the appropriate Soret band maxima (Supplementary Table 2) were exchanged into buffer B. Protein concentrations were determined from Soret band maxima using extinction coefficient of 157,000 M−1cm−1 or coefficients experimentally determined using pyridine hemochromagen assay37. For the expression of the isotopically labelled proteins the plasmid was transformed into E. coli BL21 (DE3) cells and plated on LB agar containing Kan. Individual colonies were inoculated into LB (20 mL) with Kan and then the culture was incubated at 37 °C for 5–6 h shaking at 200 rpm. This culture was diluted with Terrific Broth (TB, 2 L) and Kan and grown at 37 °C until OD600 reached 0.6–0.8. Cells were collected by centrifugation, resuspended in unlabeled M9 minimal media (18 mL) and transferred to labelled M9 minimal media (1 L) prepared with 15NH4Cl and dextrose (or 13C6-glucose) containing Kan and then the culture was grown at 37 °C for 3–4 h. Next, δ-aminolevulinic acid (0.3 mM) was added as heme precursor and the culture was induced by adding IPTG (0.25 mM). The culture was further grown at 25 °C for 20 h. Cells were collected by centrifugation and preserved at −80 °C. Purification was performed following the same protocol as for unlabeled protein. AlleyCat variants. Plasmids encoding SUMO-AlleyCat variants were transformed into E. coli BL21 (DE3) cells and plated on LB agar plate containing Kan. An individual colony was inoculated in LB containing Kan and grown at 37 °C for 5–6 h. 10 mL of starter culture was diluted with 1 L LB media supplemented with Kan and grown at 37 °C until OD600 reached to ~ 0.6–0.8. The culture was induced by 0.5 mM IPTG and grown at 18 °C for 20 h. Cells were collected by centrifugation and resuspended in resuspension buffer (25 mM TRIS, pH 8.0, 20 mM imidazole, 10 mM CaCl2, 300 mM NaCl) with 0.5 mM phenylmethylsulfonyl fluoride. Cells were lysed by sonication (Microson) and the soluble fraction was loaded on a Ni-NTA sepharose column (HisTrap, GE Healthcare). The proteins were eluted with the buffer containing 25 mM TRIS, pH 8.0, 20 mM imidazole, 10 mM CaCl2, 300 mM NaCl and 20–500 mM imidazole applied in a gradient fashion on a FPLC system (NGC, BioRad). After buffer exchange on a desalting column (BioRad, 10 DG) into a cleavage buffer (50 mM TRIS, pH 8.0, 75 mM NaCl), SUMO protease (at protein-to-protease absorbance (A280) ratio of 200:1) along with EDTA (Invitrogen, 0.5 mM) and DTT (Sigma, 1 mM) was added to cleave the SUMO fusion tag. After incubation at 30 °C for 3–4 h, the protein was exchanged into storage buffer (20 mM HEPES, pH 7.0, 10 mM CaCl2, 100 mM NaCl). Protein was further purified by anion exchange chromatography (Q HP FF, GE Healthcare) in storage buffer with elution gradient of 100–800 mM NaCl. Protein fractions were exchanged into storage buffer, concentrated using 5K MWCO spin concentrator (Corning). Protein concentrations were determined by measuring the absorbance at 280 nm using a calculated extinction coefficient of 2980 M−1cm−1. For the expression of isotopically labelled AlleyCat variants the plasmid was transformed into E. coli BL21 (DE3) cells and plated on LB agar plate containing Kan. Single colony was inoculated with 2 mL of LB media containing Kan and grown at 37 °C for 5–6 h, then 18 mL of unlabeled M9 minimal media with Kan was added and the culture was grown at 37 °C for an additional 5–6 h. The resulting 20 mL starter culture was diluted with 1 L of M9 media made with 15NH4Cl as 15N and 13C6-glucose, supplemented with Kan, and grown at 37 °C until OD600 reached to ~ 0.6–0.8. The culture was then induced by 0.5 mM IPTG and grown at 18 °C for 20 h. The cells were then harvested by centrifugation and the isotopically labeled protein was purified as discussed above. SDS-PAGE gels for all proteins used in this study are shown in Supplementary Fig. 1.
Reduction and concentration determination of myoglobin variants
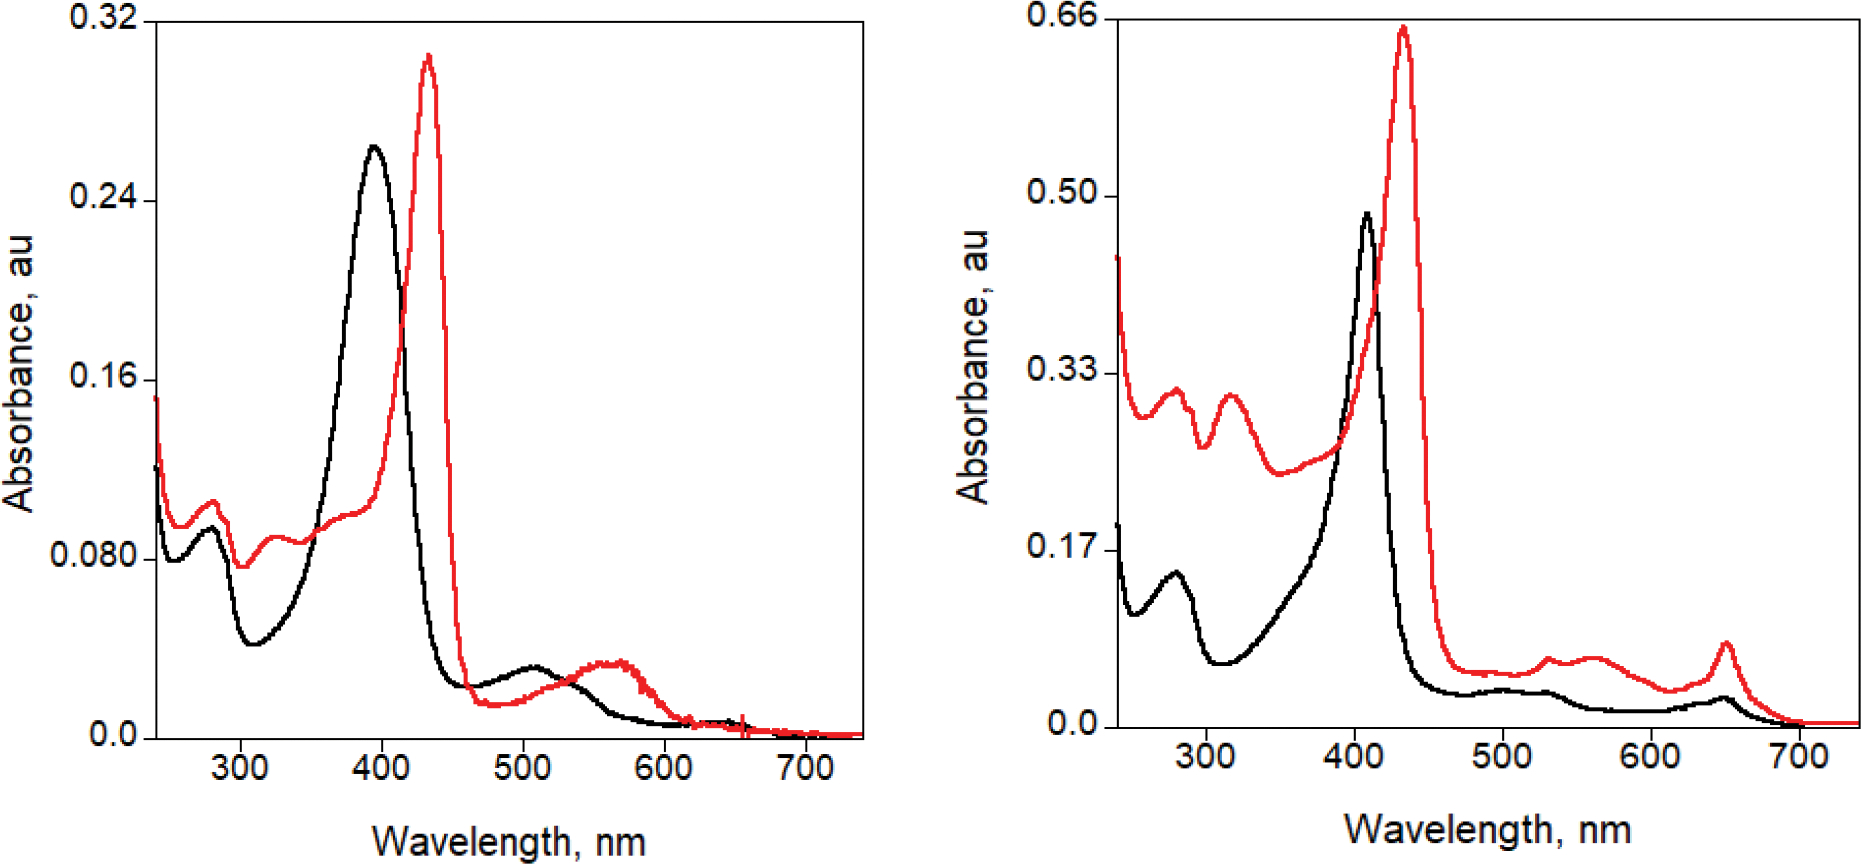
For standardization of dithionite, 20–30 mg of solid dithionite (Riedel-de Haen, Germany) as well as potassium ferricyanide (Sigma) were brought into the glovebox with a dinitrogen atmosphere (keeping oxygen under 2 ppm at all times). Both the solid reagents were dissolved in 1 mL of degassed MilliQ water to prepare stock solutions. Dithionite stock was further diluted by 20-fold. Next, two 1 mL solutions were prepared where in the first one, potassium ferricyanide stock was diluted by 100-fold while in the second one, a 1:1 mixture of ferricyanide stock and 20-fold diluted dithionite solution was prepared with subsequent dilution of each of them by 100-fold. Absorbances of both the solutions were measured at λmax = 420 nm using UV-vis diode array spectrophotometer (Agilent 8453). The reducing equivalence of 20-fold diluted dithionite solution was calculated from the difference in absorbances of the solutions using extinction coefficient of 1,020 M−1cm−1 at 420 nm. Protein concentrations were determined using the extinction coefficient of 157,000 M−1cm−1 at absorption maxima at 434 nm for reduced species. Absorbance spectra of Mb-H64V and Mb-L29I/H64G/V68A (FerrElCat) in the oxidized and reduced forms are shown in Extended Data Fig. 6. It is very important to ensure that the reduced protein has a sharp peak at ~434 nm without any pronounced shoulders (both in the reduced and oxidized forms) that could be indicative of multiple protein species present.
Kinetic characterization
In all cases the rates are corrected for the background rates in the appropriate buffers without the enzymes. Extinction coefficients of 15,800 M−1cm−1 at 380 nm was used for the product of Kemp elimination, 2-hydroxybenzonitrile. Catalytic efficiency (kcat/KM) as well as individual kinetic parameters (kcat and KM, where possible), were determined by fitting the dependence of initial rates on substrate concentration (final concentration of 140–840 μM) to the Michaelis-Menten equation v0 = kcat[E][S]/(KM+[S]). For proteins with high KM values, where substrate saturation could not be achieved due to solubility limits, kcat/KM was determined by fitting data to v0 = (kcat/KM)[E][S]. Myoglobin mutants. The substrate, 5-nitrobenzisoxazole, was prepared as 100 mM stock in acetonitrile inside the glovebox (MBRAUN). Degassed protein samples were reduced by adding ca. 10 equivalents of sodium dithionite (Riedel-de Haen, Germany) inside a glovebox. Concentrations of reduced proteins were determined using the extinction coefficient of 157,000 M−1cm−1 for the Soret band. The quality of the reduced protein was assessed by examining the position and shape of Soret and Q-bands. Protein solutions containing reduced myoglobin mutants (10 – 200 nM) in 40 mM TRIS, pH 8.0 with ascorbate (2 mM), SOD (0.2 μM), catalase (40 nM) introduced to suppress side reactions stemming from any dioxygen present during the measurements, were prepared inside the glovebox in glass vials. To achieve best reproducibility, it is critical to prepare the solution containing ascorbate, SOD, catalase and the reduced protein prior to each kinetic measurement. Ascorbate, SOD and catalase were added as separate drops to the walls of the vials, the protein was added to the buffer inside the vials, then the reagents were mixed by swirling and immediately transferred to gas-tight syringes for kinetic measurements. All measurements were done at least in triplicate, and multiple independently prepared protein batches were characterized for key mutants (FerrElCat, Mb-64V, Mb-64G, Mb-64G/68A). The substrate was prepared in the glove box as 2x solution in water containing 3% acetonitrile (created using appropriate volumes of 100 mM stock solution of 5-NBI in acetonitrile, water and acetonitrile to maintain the constant final concentration of co-solvent) and transferred in gas-tight syringes. Reactions were initiated by mixing reduced enzyme in buffer and solutions of 5-nitrobenzisoxazole in water in 1:1 ratio on the Applied Photophysics SX20 stopped-flow spectrometer; the lines prior to the introduction of the reactants were equilibrated using deoxygenated water for the substrate channel and deoxygenated buffer in the protein channel. The final reaction mixtures contained reduced protein (5 – 100 nM) in 20 mM TRIS, pH 8.0 with ascorbate (1 mM), SOD (0.1 μM), catalase (20 nM), 1.5 % acetonitrile and variable concentrations of the substrate. Product formation was monitored at 25 °C for the time interval of 0.1–10 s. The corresponding kinetic parameters are given in Extended Data Table 1. The pH dependence of FerrElCat enzymatic activity was assessed using the protocol described above, except different buffers were used (all at 20 mM; MES at pH 6.5, HEPES at pH 7.0 and 7.5, TRIS at pH 8.0 and pH 8.5, Supplementary Fig. 3). AlleyCat proteins. The product formation was monitored on a BioTek Eon3 platereader in 20 mM HEPES, pH 7.0 buffer containing 10 mM CaCl2, 100 mM NaCl and acetonitrile (1.5% constant final concentration) at 22 °C in a 96-well plate (Greiner Cellstar). The final enzyme concentration was 100 nM. The Michaelis-Menten plots for all proteins are given in Extended Data Fig. 7. The maximum kcat/KM as well as effective pKa of the active site residue in the pH studies of AlleyCat proteins were obtained by using the equation: kcat/KM = (kcat/KM)0+(kcat/KM)max×(10−pKa/(10−pKa+10−pH)) (Supplementary Fig. 4 and Supplementary Table 3).
Library design
The plasmids encoding the genes of the proteins of the AlleyCat family have been constructed as reported before.33 The gene encoding sperm whale myoglobin was cloned into pET-28a(+) (Novagen) with simultaneous introduction of the H64V mutation using standard protocols. Site-specific saturation mutagenesis targeting defined site was achieved using megaprimer PCR protocol38 with primer sets (Integrated DNA Technologies) which overlapped on the 5’ terminus of the randomized position, together with flanking primer (T7 forward or T7 reverse), as appropriate. Saturation mutagenesis was performed using NNK codons (where N can be any base and K represents a mixture of G and T nucleotides) that cover the 20 genetically encoded amino acids (primer sequences are shown in Supplementary Table 1). The size of PCR product was verified using agarose gel electrophoresis. DNA sample was digested with DpnI (New England Biolabs) at 37 °C for 10–12 h to eliminate parental clone. The digested sample was transformed into E. coli NEB5α cells (New England Biolabs) and subsequently plated on LB agar plate containing kanamycin (50 μg/mL). After incubation at 37 °C for 10–12 h, colonies obtained from the plate were allowed to grow in LB with Kan at 37 °C for 5–6 h. Cells were harvested, and plasmids were extracted using DNA extraction kit (Monarch, New England Biolabs). Library quality was confirmed by Sanger sequencing analysis (Genewiz, Inc.) (Supplementary Fig. 5 and Supplementary Fig. 6).
Library screening
At least 160 independent colonies were screened for each library. Myoglobin NNK libraries were transformed into E. coli BL21 (DE3) pLysS cells and plated on LB agar with Kan and chloramphenicol (CHL, 34 μg/mL). Individual colonies were inoculated into LB (200 μL) containing Kan and CHL in 96-well plate. Cultures were incubated at 37 °C until OD600 0.6–0.8 and replica plate was generated where cultures were inoculated into LB with Kan and CHL. δ-aminolevulinic acid (0.3 mM) as heme precursor and 0.25 mM IPTG for induction were added to the cultures and grown at 25 °C for 20 h. Cells were harvested by centrifugation. Pellets were resuspended in buffer (25 mM TRIS, pH 8.0), centrifuged again, and the supernatant was discarded. A buffer containing 25 mM TRIS, pH 8.0, 0.5% triton X was used to lyse the cells and supernatant was separated by centrifugation. Activity of the clones was tested using 96-well plates in the buffer (20 mM TRIS, pH 8.0, 1 mM ascorbate, 0.1 μM superoxide dismutase and 20 nM catalase) by measuring absorbance at 380 nm at 22 °C on a plate reader (BioTek Eon3). The activities of clones showing large increase over the starting templates were confirmed by rescreening them in triplicate. Plasmids extracted from the colonies demonstrating improved activity were sequenced (Genewiz, Inc.) to determine the identities of beneficial mutations.
Calmodulin gene libraries were transformed into E. coli BL21 (DE3) pLysS cells and plated on LB agar plates containing 100 μg/mL ampicillin and 34 μg/mL chloramphenicol (Amp and CHL at these concentrations were used in experiments with calmodulin libraries). Single colonies were inoculated with 200 μL of LB containing Amp and CHL in 96-well plate. After incubation for 5–6 h at 37 °C, replica plates were generated. Cultures were used to inoculate 400 μL of Zym-5052 as autoinduction media supplemented with Amp and CHL and allowed to grow at 37 °C for 12–16 h. The cells were collected by centrifugation and the supernatant was discarded. The cells were resuspended with 25 mM TRIS, pH 8.0, 20 mM imidazole, 10 mM CaCl2, 300 mM NaCl. After clearing the lysates, pellets were lysed with a buffer containing 20 mM TRIS, pH 8.0, 10 mM CaCl2, 100 mM NaCl, 0.2% Triton X and centrifuged to separate the lysate. Kemp elimination activity was monitored at 380 nm in the buffer containing 20 mM TRIS, pH 8.0, 10 mM CaCl2 and 100 mM NaCl in 96-well plates on a BioTek Eon3 platereader at 22 °C for 10 min. The activities of clones showing large increase over the starting templates were confirmed by rescreening in them triplicate. Plasmids extracted from the colonies demonstrating improved activity were sequenced (Genewiz, Inc.) to determine the identities of beneficial mutations. The C-terminal domains of the improved variants were cloned into pET-SUMO champion vector (Invitrogen) using standard protocols for detailed protein characterization. Sequences of all newly evolved proteins are given in Extended Data Table 2.
Gene shuffling
To quickly identify the most active variant we took the most active mutant identified in the first round of screening (H64G) and tested its performance together with the other mutations found in the first round. The same procedure was repeated on the most active double mutant (Mb-H64G/V68A) to yield FerrElCat.
NMR spectroscopy
All NMR spectra were acquired at 298 K on a Bruker Avance III HD 800 MHz spectrometer equipped with a TCI cryoprobe. The Mb-H64V samples were prepared in 20 mM HEPES pH 7.0, the AlleyCat samples were prepared in 20 mM HEPES, pH 6.9, 10 mM CaCl2, 100 mM NaCl with 2.5 mM NaN3. All samples contained 5–10 % D2O for the lock. The assignments of backbone amide resonances were obtained from 0.7–1.0 mM U-[13C,15N] protein samples using a standard set of 3D BEST HNCACB, HN(CO)CACB, HNCO and HN(CA)CO experiments. All myoglobin samples were reduced with sodium dithionite under a nitrogen atmosphere, and the NMR tubes were flame sealed. The NMR data were processed in NMRPipe39 and analyzed in CCPNMR40. The CSP experiments were performed by stepwise addition of a concentrated stock solution of 6-NBT in CH3CN to U-[15N] or U-[13C,15N] protein samples at the initial concentration of 0.2 mM. At each increment, changes in chemical shifts of the protein resonances were monitored in 2D [1H,15N] HSQC spectra. The average amide CSPs (Δδavg) were obtained at two-fold molar excess of 6-NBT as Δδavg = (ΔδN2/50+ΔδH2/2)0.5, where ΔδN and ΔδH are the chemical shift perturbations of the amide nitrogen and proton, respectively (Supplementary Data). For each observed resonance, the Z score was calculated as Z = (Δδavg − μ)/σ, where μ and σ are, respectively, the average and the standard deviation of Δδavg values for a given CSP experiment.
The NMR titration to determine Kd values for AlleyCat and cCaM protein were performed by incremental addition of a freshly-prepared 5 mM 6-NBT solution in CH3CN to a 0.2 mM [13C,15N] protein sample. At each increment, changes in chemical shifts of the protein resonances were monitored in 1H-15N HSQC spectra. The binding curves were analyzed with a two-parameter nonlinear least-squares fit using a one-site binding model corrected for the dilution effect41: Δδbinding=0.5Δδ0(A−(A2−4R)0.5), where A = 1+ R+Kd(([NBT]0+R[protein]0)/([NBT]0[protein]0)) where Δδbinding is the chemical shift perturbation at a given [6-NBT]/[protein] ratio; Δδ0 is the chemical shift perturbation at 100 % 6-NBT bound; R is the [6-NBT]/[protein] ratio at a given titration point; [protein]0 and [NBT]0 are the initial concentrations of the protein sample and the 6-NBT titrant stock solution, respectively; and Kd is the equilibrium dissociation constant (Supplementary Fig. 7).
Crystallographic methods
Crystals of FerrElCat were grown by hanging drop vapor diffusion method at 20 °C upon mixing protein solution and reservoir solution (100 mM TRIS, pH 8.0, 2.4 M ammonium sulfate). Crystal screening for AlleyCat9 as well as AlleyCat10 (~ 15 mg/mL in storage buffer) were performed in 96-well plate (Violamo) using sitting drop vapor diffusion method. Crystals were further grown at 293 K using hanging drop vapor diffusion method by 1:1 mixing of protein sample and reservoir buffer containing (4S)-2-methyl-2,4-pentanediol (MPD) (47%) and TBU (2%) for AlleyCat9 while 50% MPD was used for AlleyCat10. Protein samples were mixed with 6-NBT (5–10 mM), incubated on ice for 30 min and grown further following the same condition as mentioned above for co-crystallization. X-ray diffraction data were collected using a Pilatus-200 K detector on a Rigaku Micromax-007 rotating anode X-ray generator. The protein was crystallized in hexagonal space group (P6). Diffraction data were processed with the CrysAlisPro software suite (Rigaku). All structures were determined by molecular replacement using PHASER42 starting with the deposited model of myoglobin (PDB code 1mbn) or AlleyCat (PDB code 2kz2). Refinement was performed by COOT43 and PHENIX44, and the final structures were validated with MolProbity45. Crystallographic data and refinement statistics are given in Extended Data Table 3.
Computational docking
5-NBI was docked into FerrElCat with AutoDock Vina46 with previously described protocol47. The imidazole molecule coordinated to the iron in the crystal structure was removed prior to docking.
Circular dichroism (CD) spectroscopy
All CD spectra of myoglobin variants were recorded using Jasco J-715 CD spectrometer in continuous mode with 1 nm bandwidth, 2 nm data pitch, scan rate of 50 nm/min with 8 s averaging time. The final spectra represent a buffer-subtracted average of three runs. The CD spectra of non-reduced proteins in the far-UV region (200–260 nm) were collected using quartz cuvette with 1 mm pathlength while for the Soret band region (390–470 nm) quartz cuvette of 1 cm pathlength was used. The spectra at Soret band region (390–470 nm) were obtained to determine mean residue ellipticity values (MRE) assuming protein binds heme in a 1:1 ratio. Protein stocks were diluted in 2 mM TRIS (pH 8.0) to 5 μM and the spectra were recorded for oxidized protein. For the analysis of the reduced protein, the stock was diluted in the same way as for the oxidized sample and ten equivalents of sodium dithionite were added to the protein inside the glovebox. The concentration of the reduced protein was calculated based on the Soret band maxima using the corresponding extinction coefficients. Sample absorbance never exceeded 2 at all wavelengths. The mean residue ellipticity (MRE, deg*cm2*dmol−1) values were calculated using the following equation (MRE = θ/(10*c*l*N)), where θ (mdeg) is ellipticity, l (cm) is the pathlength of the cuvette, c (M) is the protein concentration and N is the number of residues (Supplementary Fig. 8). Chemical denaturation studies on AlleyCat proteins were performed by monitoring sample monitoring sample absorbance at 222 nm in presence of varying concentration of guanidine hydrochloride (0–6 M) as the denaturant (Supplementary Fig. 9) and thermodynamic parameters for protein unfolding were determined (Supplementary Table 4).
Spectroelectrochemical determination of redox potential of myoglobin mutants
The redox potentials of myoglobin variants were measured using a platinum honeycomb spectrochemical electrode (0.17 cm) with a Ag/AgCl reference electrode connected to the WaveNow potentiostat (Pine Research Instrumentation). All redox potential were determined against Ag/AgCl reference electrode (reported as +199 mV vs NHE by manufacturer). The redox titration was performed using 1.2 mL of working solution containing ~ 20 μM protein and 100 μM phenazine methosulfate (Sigma) as a redox mediator in 20 mM HEPES (pH 7.0) or 20 mM TRIS (pH 8.0). A highly positive potential of +100 mV vs Ag/AgCl reference electrode was initially applied to ensure complete oxidation of protein. Next, the potential was applied with an increment of 25 mV from +25 mV to −500 mV (vs Ag/AgCl) with the equilibration time of 5 min at 20 °C for each step. The absorbance spectra of the protein containing mixtures at each potential were recorded using UV-vis spectrophotometer (Agilent 8453). The absorbance of the protein solution was corrected for the contribution of the mediator. The absorbance at 434 nm was normalized to 800 nm and used to determine the fraction of reduced protein in the sample using the equation (Fraction reduced = (A434 − A434, min)/(A434, max − A434, min)). Fraction reduced was plotted as a function of the applied potential and the midpoint reduction potential (Em) was determined using the following equation: Fraction reduced = (A + g*x)/(1 + (x/Em)b), where A is fraction reduced at complete reduction, x is applied potential, Em is midpoint reduction potential, b is a slope of the liner portion of a sigmoidal curve and g is the slope of the top linear portion of the curve. The midpoint reduction potentials obtained from the fits (Extended Data Fig. 4) are summarized in Supplementary Table 5.
Determination of the dissociation constants for AlleyCats and 6-nitrobenzotriazole (inhibitor).
The thermodynamic parameters of 6-nitrobenzotriazole (6-NBT) binding to AlleyCat proteins were measured using a MicroCal PEAQ-ITC instrument (Malvern Panalytical). Proteins were dialyzed against buffer (20 mM HEPES, 100 mM NaCl, 10 mM CaCl2, pH 7.0) containing 2% acetonitrile, filtered using 0.22 μm low protein binding PES filter (Santa Cruz Biotechnology, Inc.) and the concentration of each sample was determined by UV–vis spectroscopy using extinction coefficients of 2,980 M−1cm−1 at 280 nm. 6-NBT was prepared by dissolving the powder in the protein dialysis buffer to obtain 1 mM solution. All titrations were performed at 25 °C in the high feedback mode with 750 rpm stir speed and an appropriate equilibration time between injections (150 s). The protein sample (~100 μM) was placed in the calorimeter cell and 1 mM solution of 6-NBT (in the syringe) was added to the protein in eighteen 2 μL aliquots. As a control, 1 mM 6-NBT solution was titrated into the dialysis buffer.
The analysis, including baseline correction, peak integration and correction for heat of dilution observed at the protein saturation with inhibitor, was performed using the MicroCal PEAQ-ITC analysis software provided by the manufacturer. To obtain binding parameters for each reaction, the data were fitted to the one set of sites model (Supplementary Fig. 10). Each titration was repeated at least two times. The thermodynamic parameters are summarized in Supplementary Table 6.
Data availability
The crystallographic data and refinement statistics were deposited in the Worldwide Protein Data Bank (wwPDB) with the entry code 7vuc (FerrElCat), 7vur (AlleyCat9), 7vus (AlleyCat9 with 6-NBT), 7vut (AlleyCat10), 7vuu (AlleyCat10 with 6-NBT).
Extended Data
Extended Data Fig. 1 |. Selection of negative controls for screening.
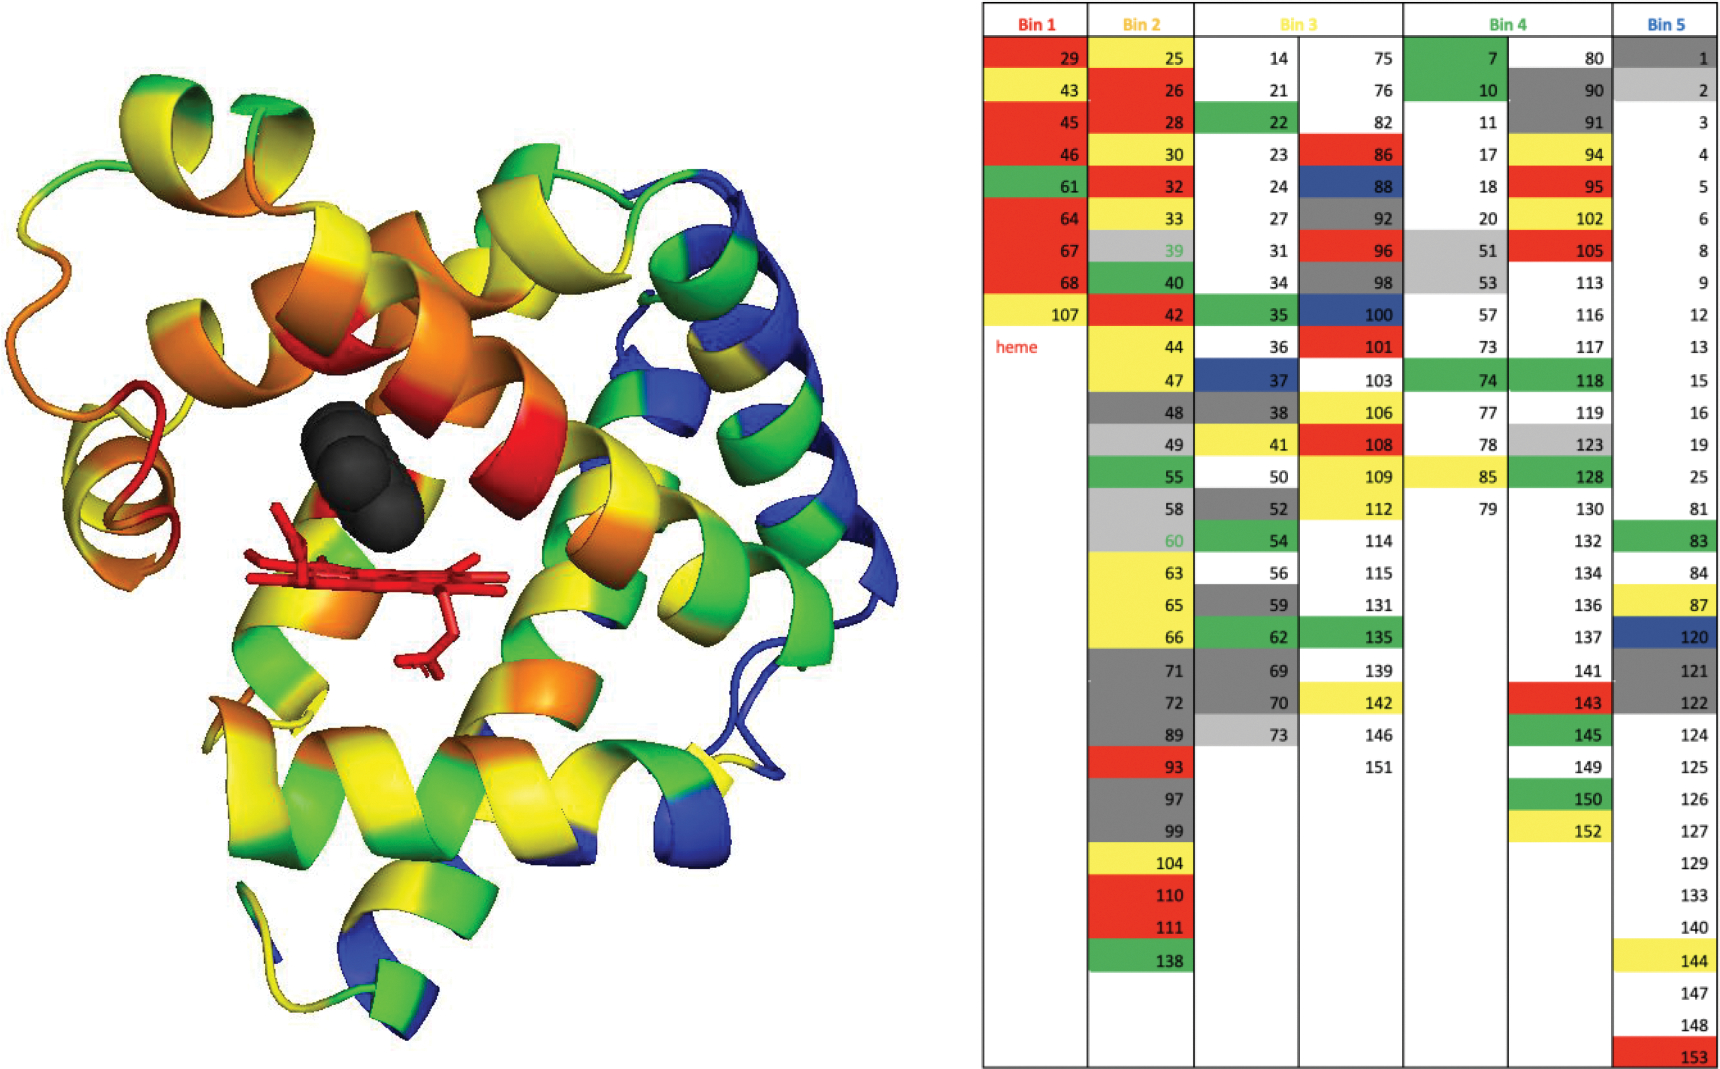
Left. We have sorted all residues in myoglobin in bins based on their distance to the docked inhibitor (black) in FerrElCat. The residues in the van der Waals contact with the docked inhibitor were placed in bin 1 (red), the residues in direct contact with the residues in bin 1 were placed in bin 2 (yellow), etc. A total of five bins were devised: red, yellow, orange, green and blue. Right. The list of the residues sorted in the five bins. Residues showing large backbone CSP and their immediate neighbors are highlighted in red and yellow, respectively. Unassigned positions and residues immediately next to unassigned stretches are shown in dark grey and light grey, respectively. Prolines are highlighted in blue. Residues showing small CSP that were selected as controls are either highlighted in green or labeled in green font (when located next to unassigned residues).
Extended Data Fig. 2 |. Substrate turnover by reduced Mb-L29I/H64G/V68A (FerrElCat).
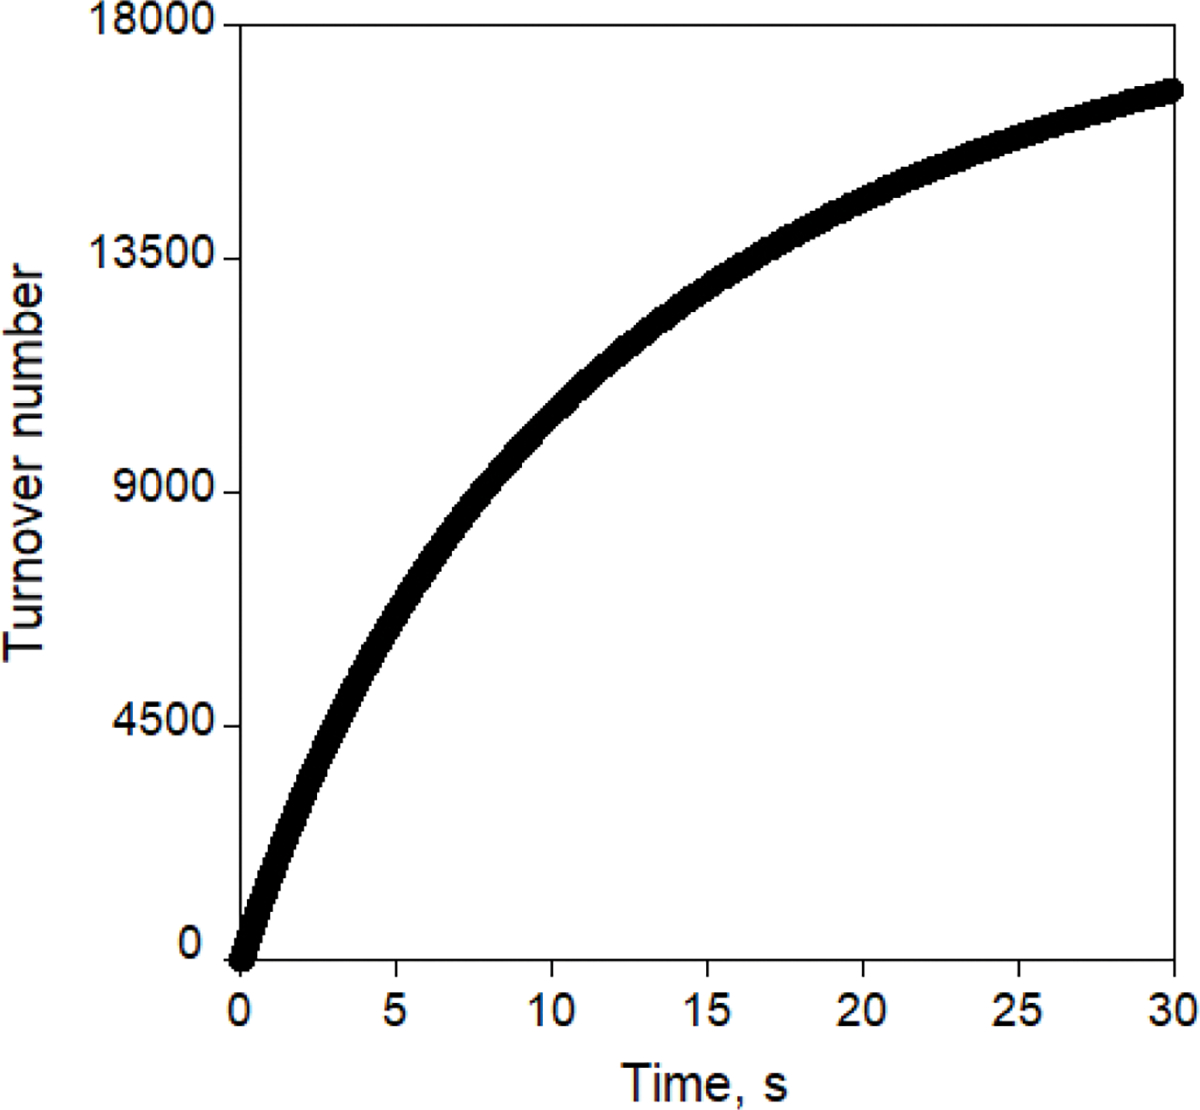
Reaction was monitored using stopped-flow at pH 8.0 for 30 s at 25 °C with 140 μM of 5-NBI and 5 nM of FerrElCat.
Extended Data Fig. 3 |. Catalytic parameters of Kemp eliminases evolved using directed evolution:
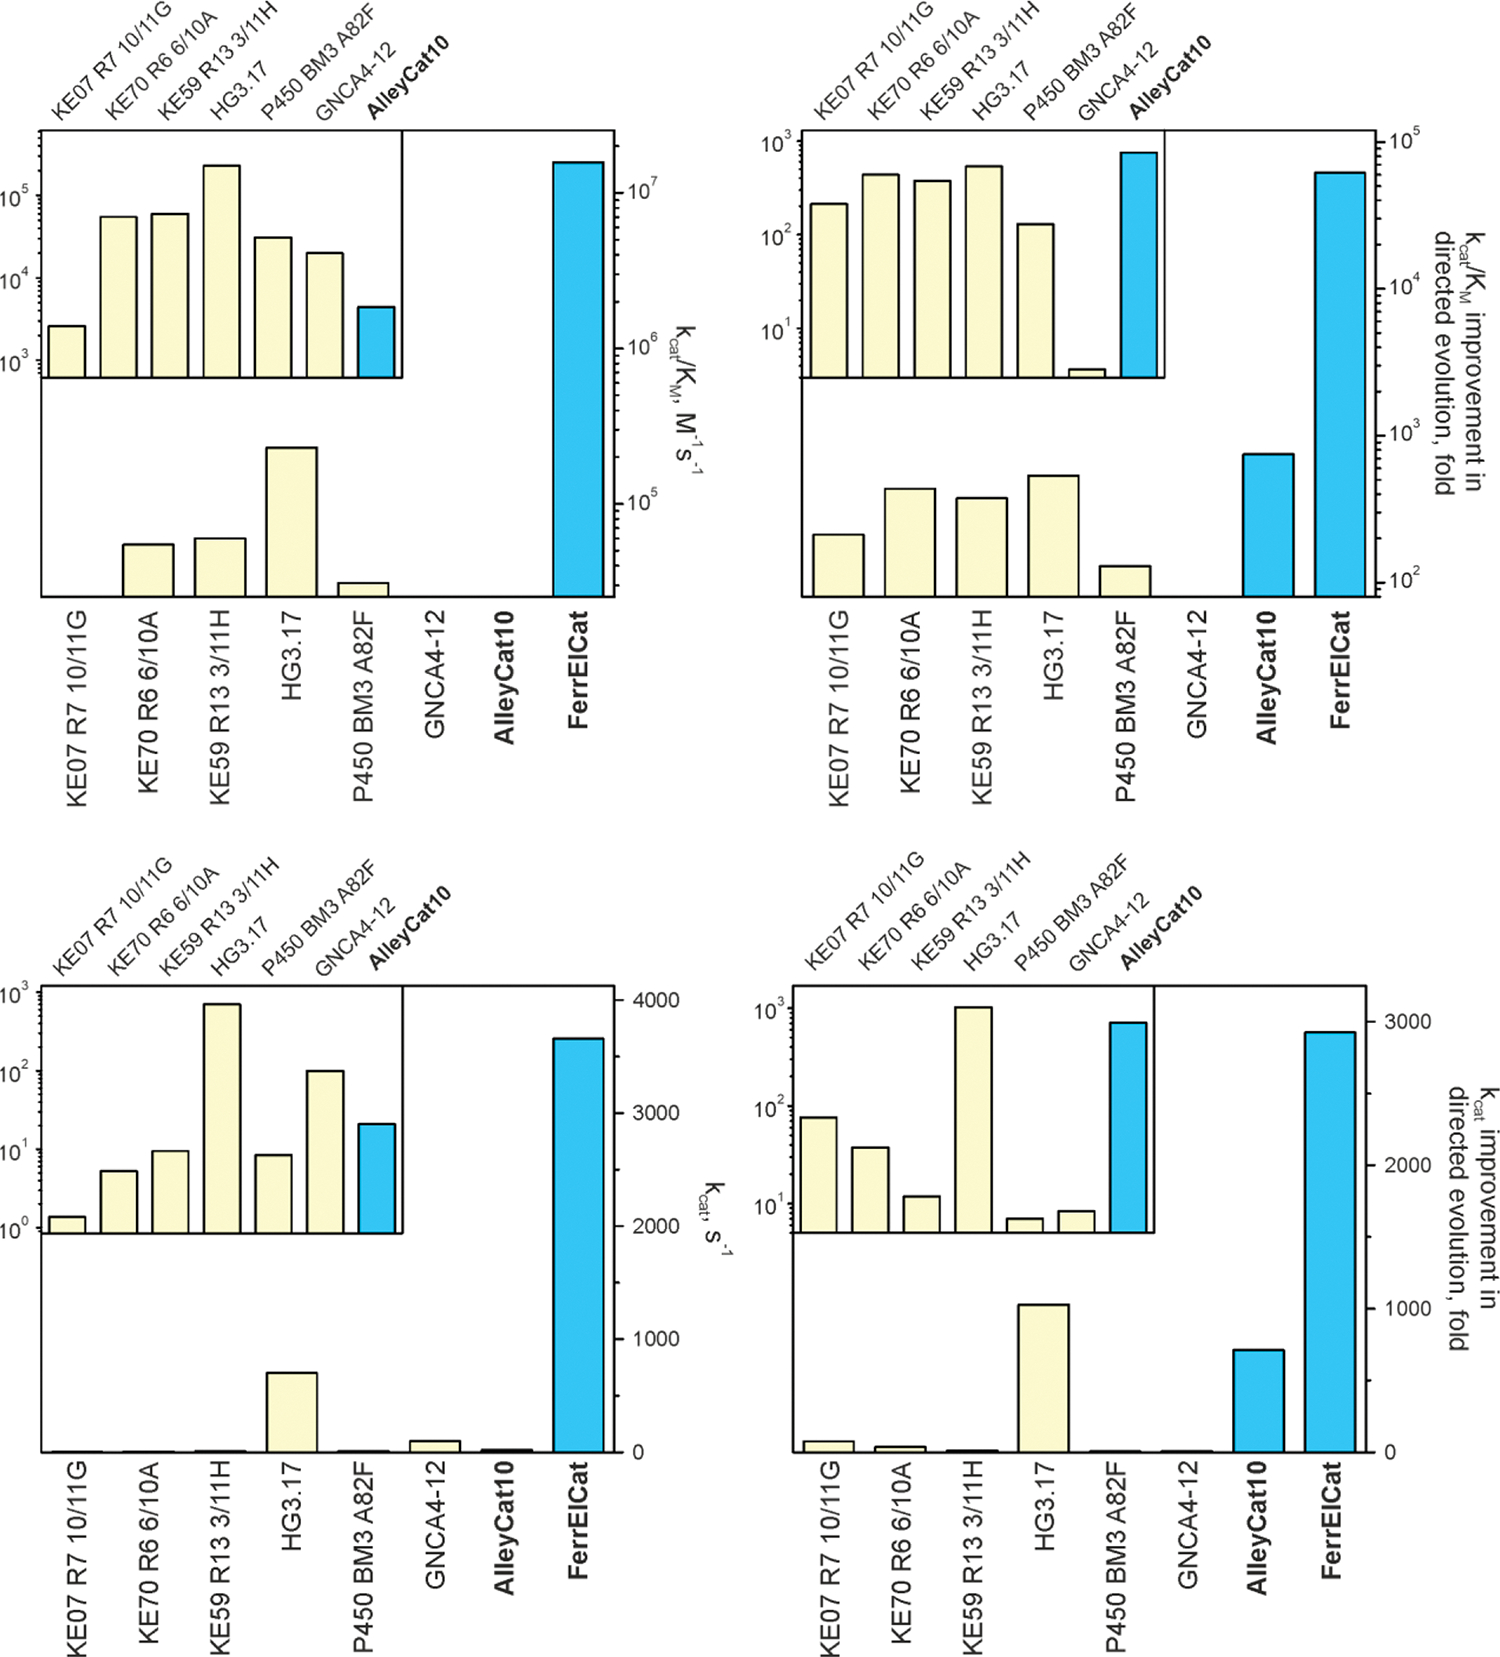
kcat/KM and kcat values for the evolved enzymes (left) and improvement in kcat/KM and kcat achieved by directed evolution (right). In cases where only kcat/KM was reported, we used 5 mM for KM, to obtain low estimate of the kcat.
Extended Data Fig. 4 |. Spectroelectrochemical determination of redox potentials of selected myoglobin mutants.

The proteins were analyzed in 20 mM TRIS-HCl (pH 8.0) at 20 °C in presence of the mediator (100 μM phenazine sulfate). The redox potentials (vs Ag/AgCl) are summarized in Supplementary Table 5.
Extended Data Fig. 5 |. Kemp elimination catalyzed by AlleyCat10 in presence of Ca2+ (black) and in absence of Ca2+ (red).
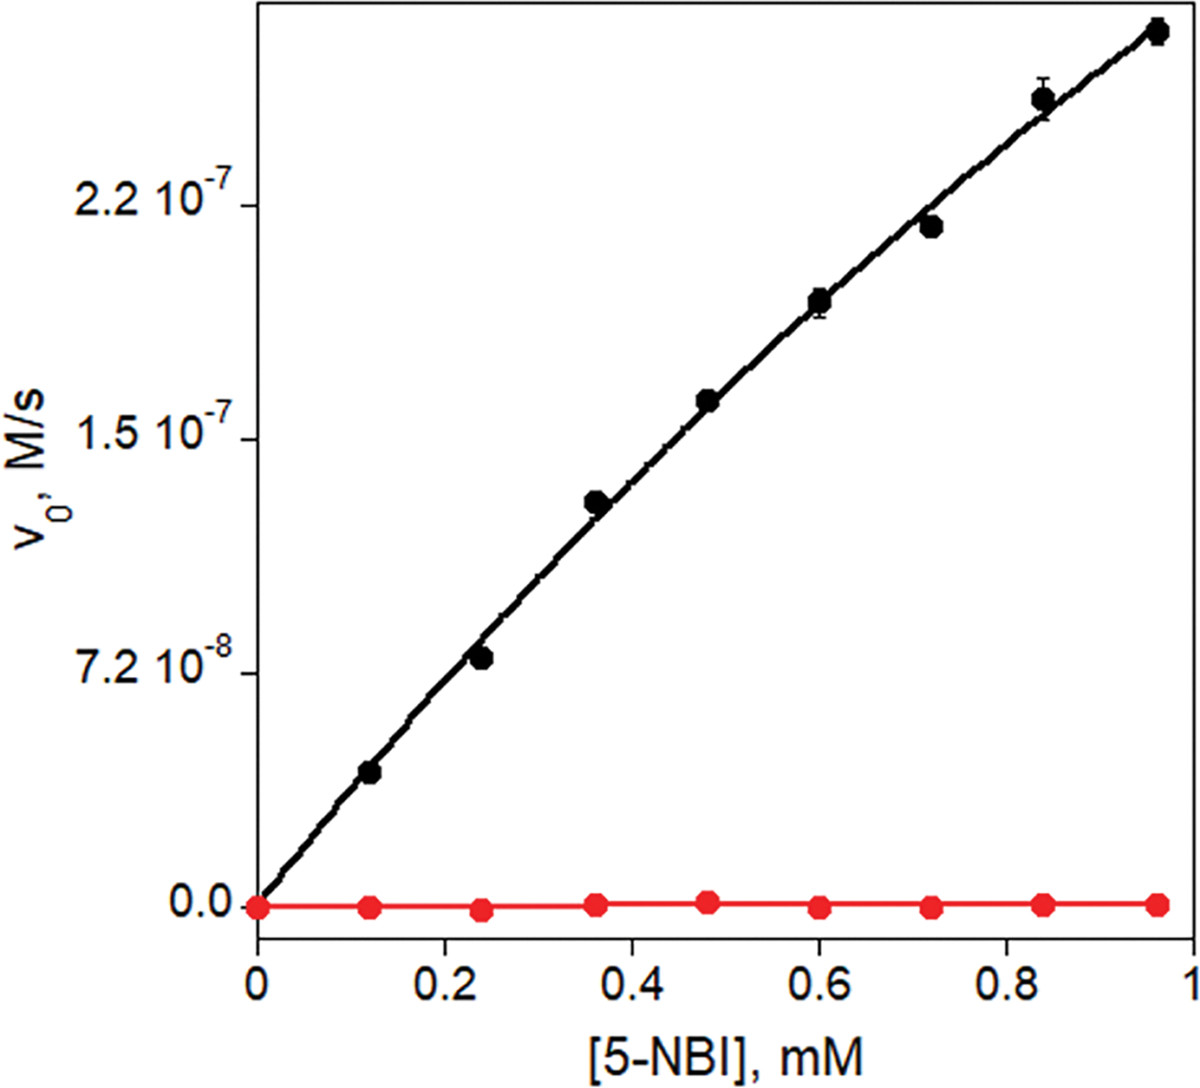
The activity of 0.1 μM AlleyCat10 was tested with 0.12–0.96 mM substrate in 20 mM HEPES, 100 mM NaCl (pH 7.0) at 22°C with 10 mM CaCl2 (black) or 100 μM EDTA (red).
Extended Data Fig. 6 |. Absorbance spectra of Mb-H64V (left) and Mb-L29I/H64G/V68A (FerrElCat) (right) in the oxidized (black) and reduced (red) forms.
Extended Data Fig. 7 |. Michaelis-Menten plots of Kemp elimination catalyzed by reduced (unless otherwise stated) myoglobin mutants and by AlleyCat proteins.
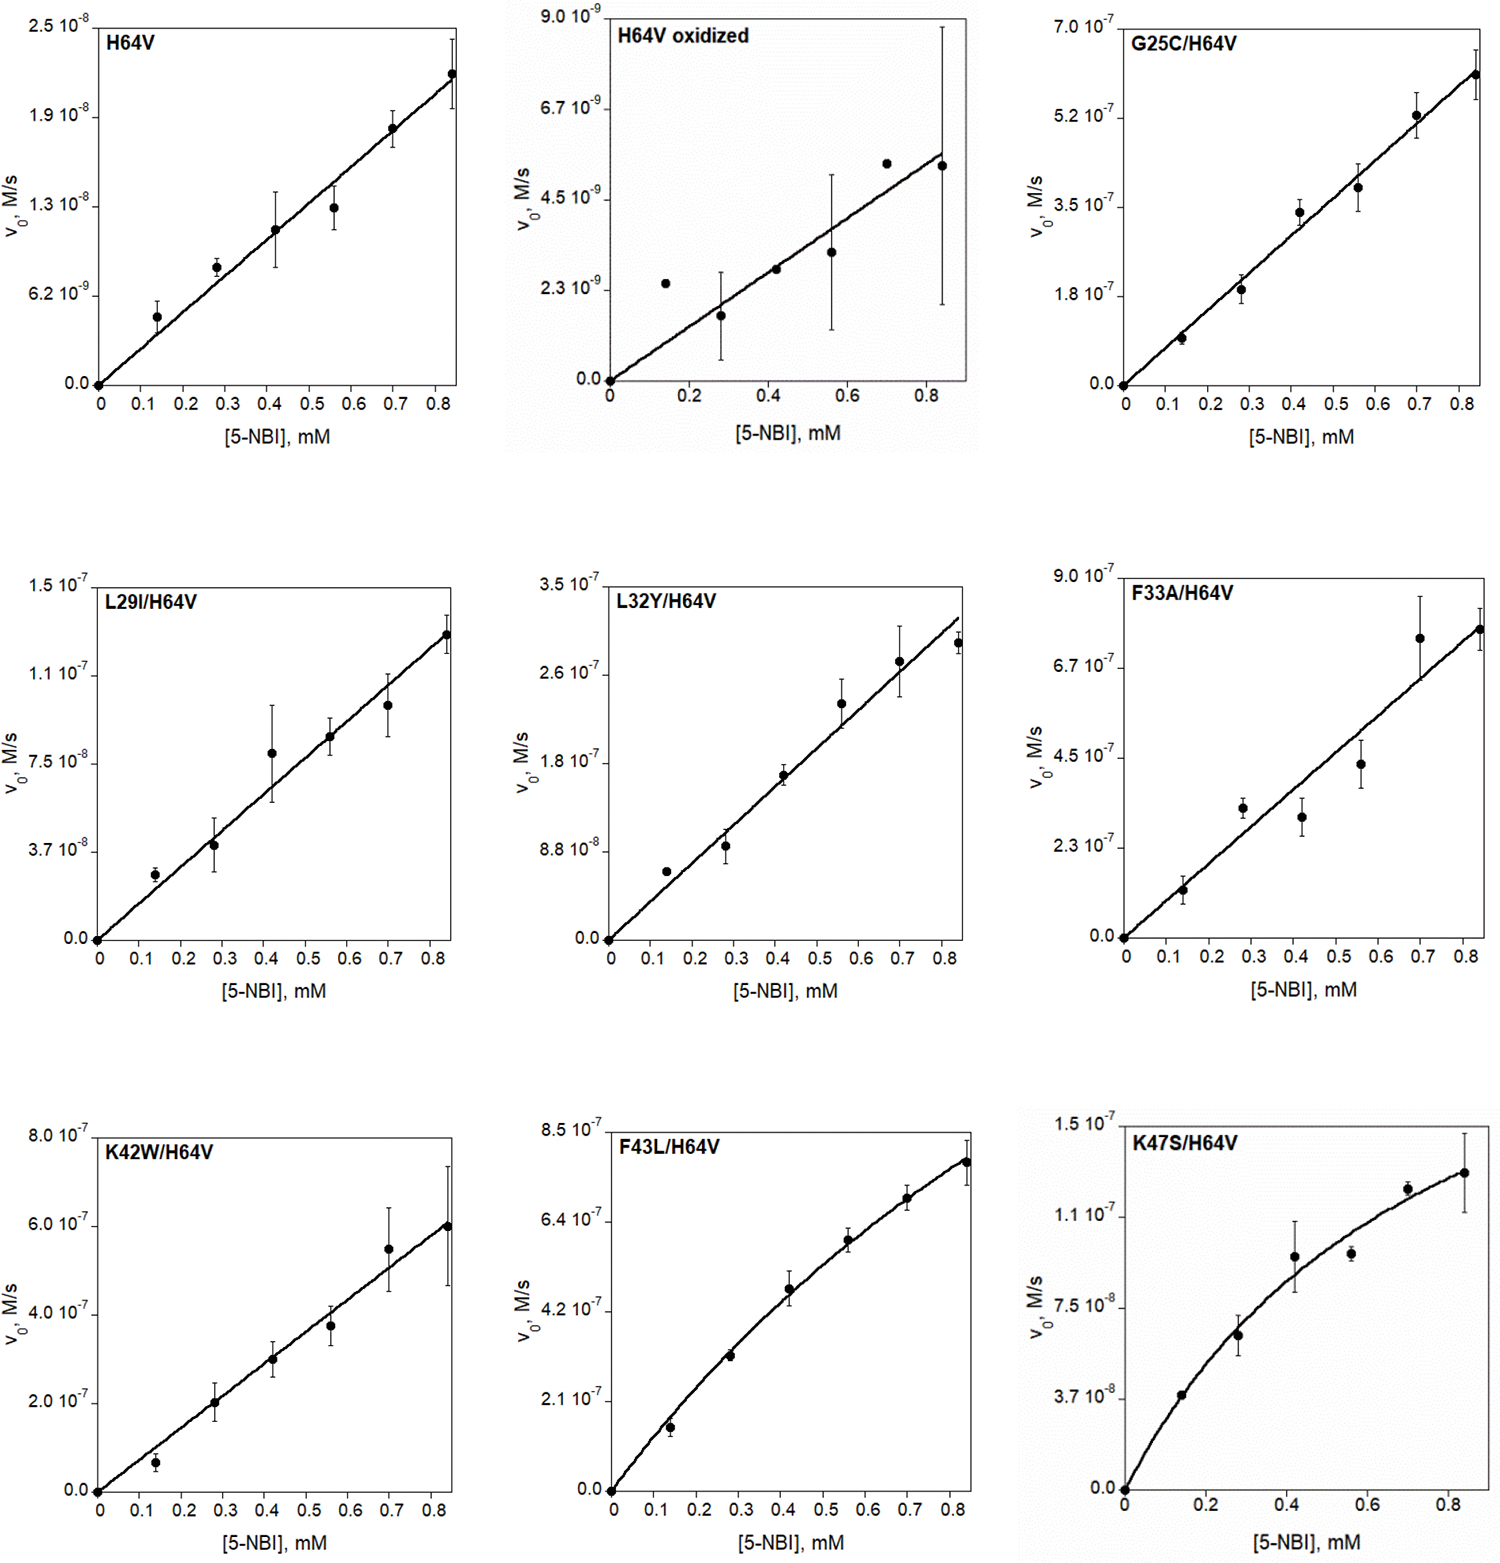
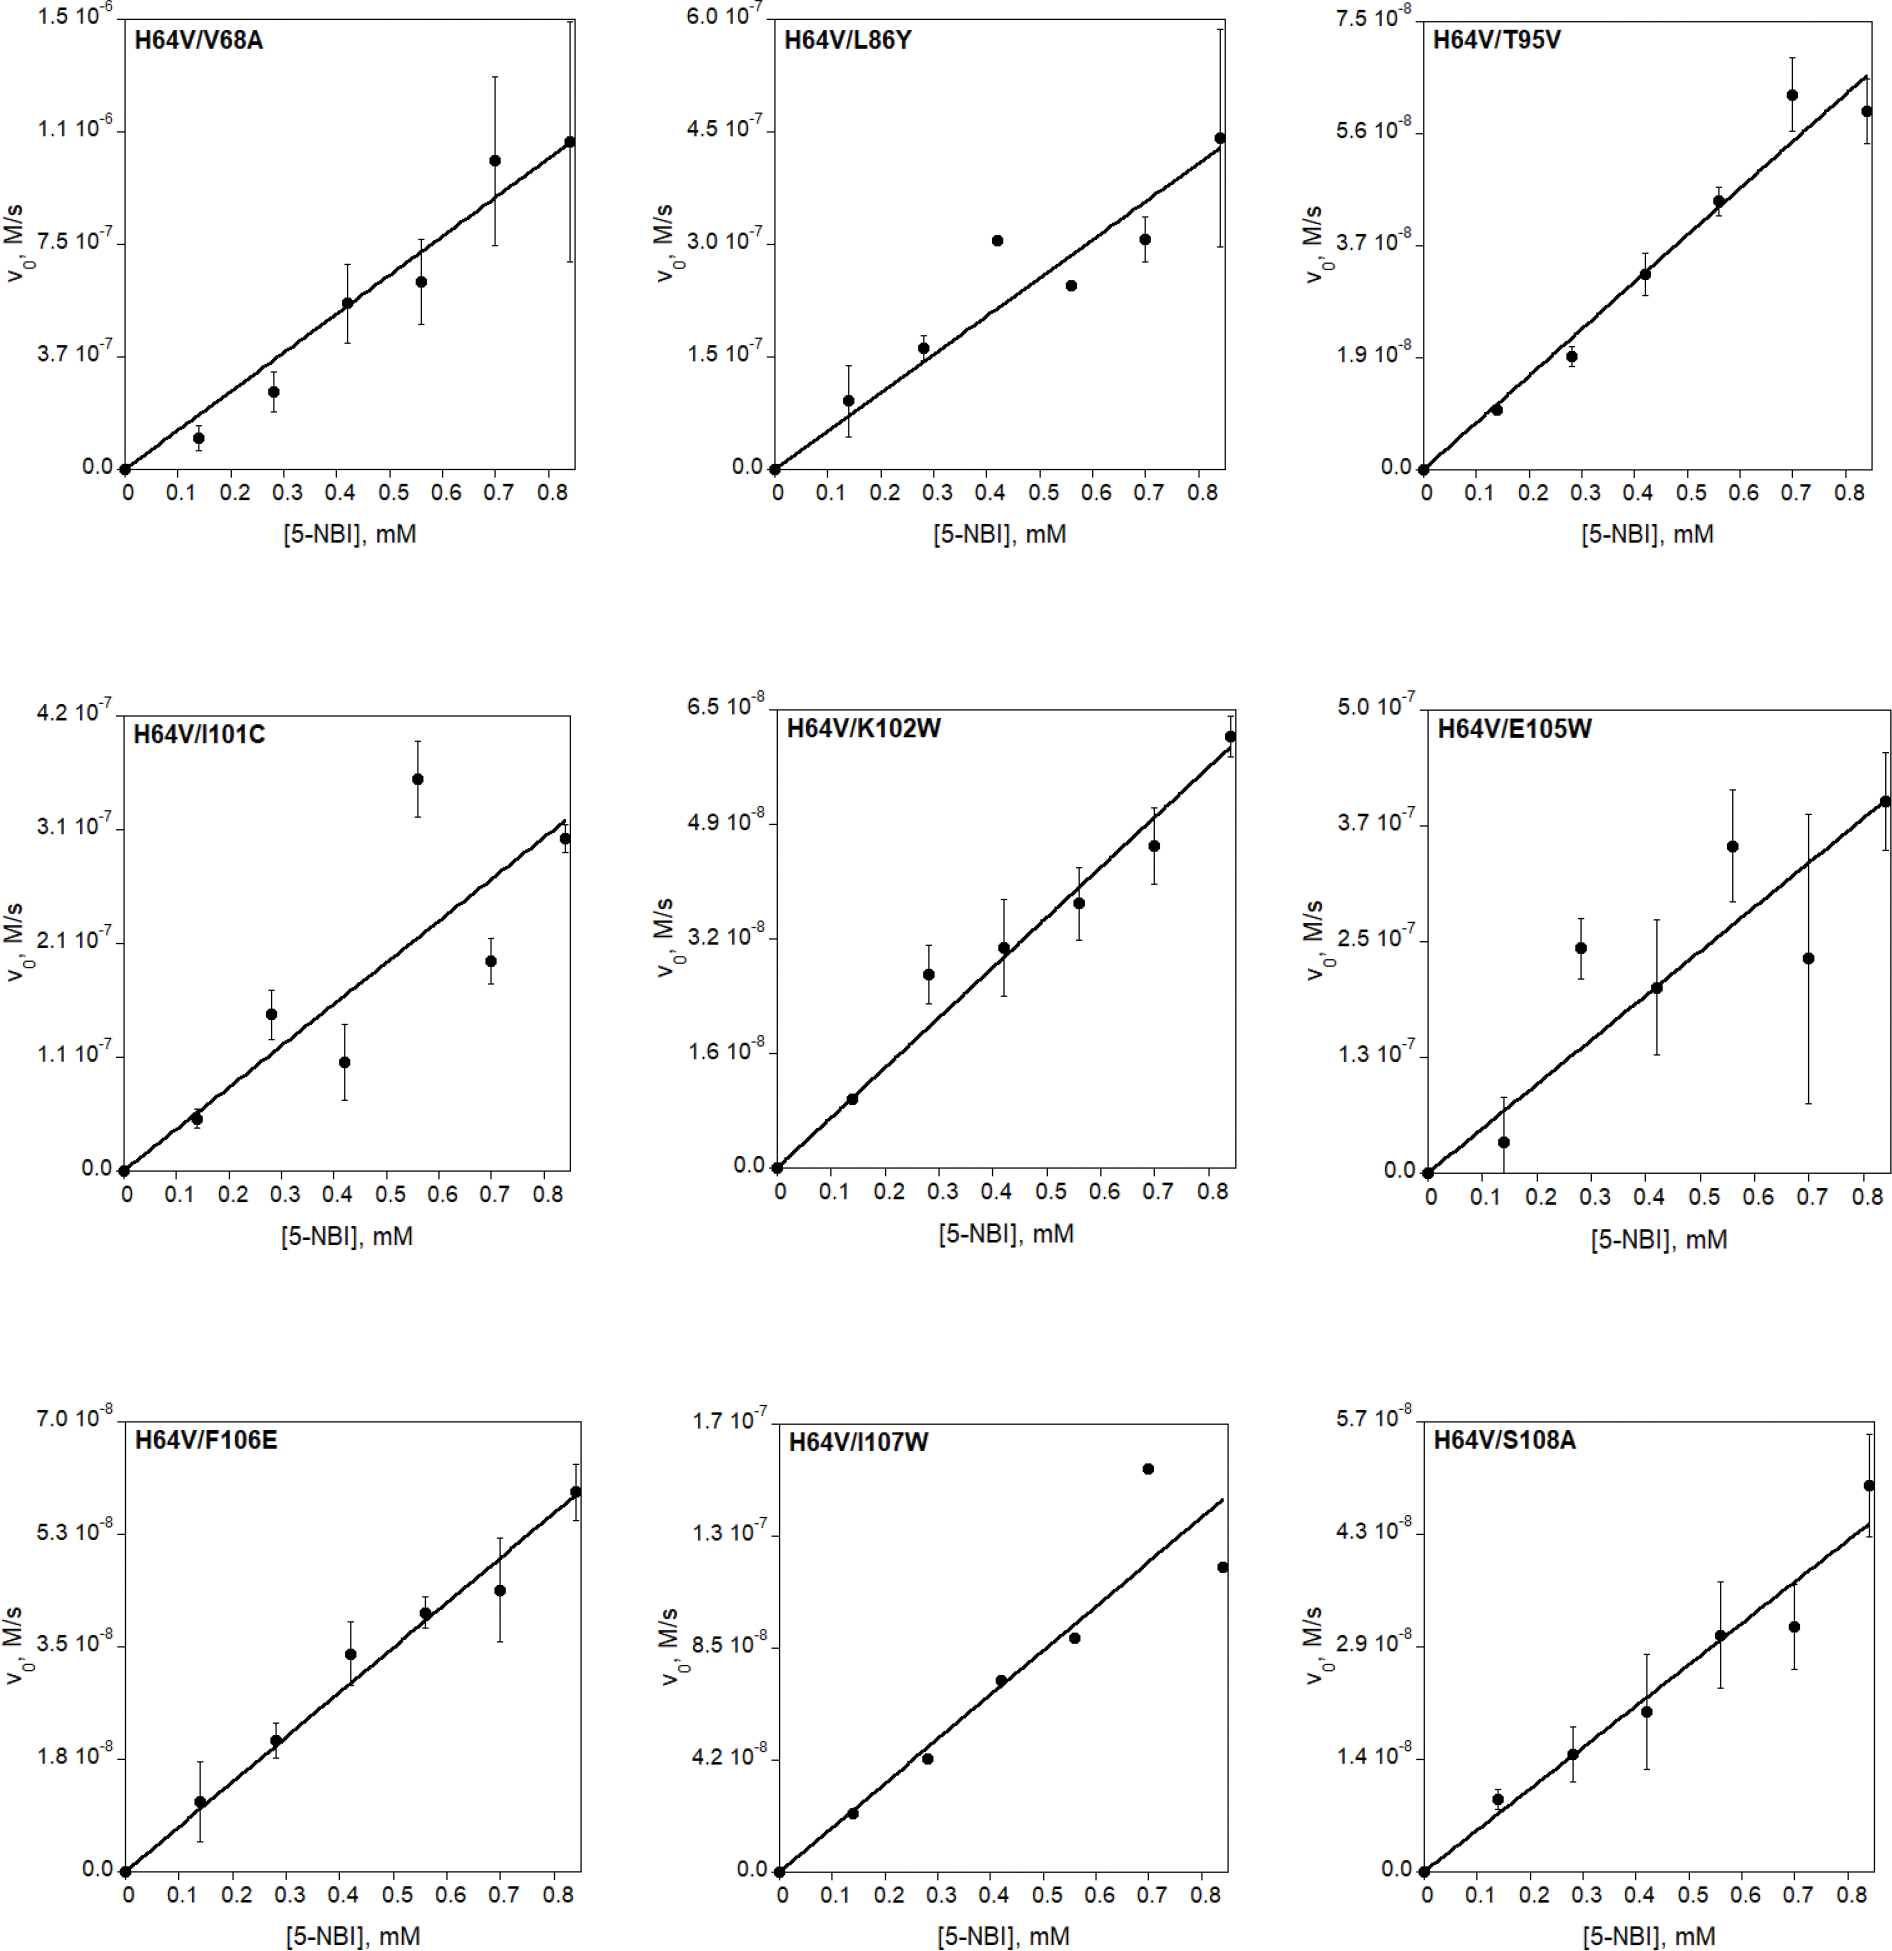
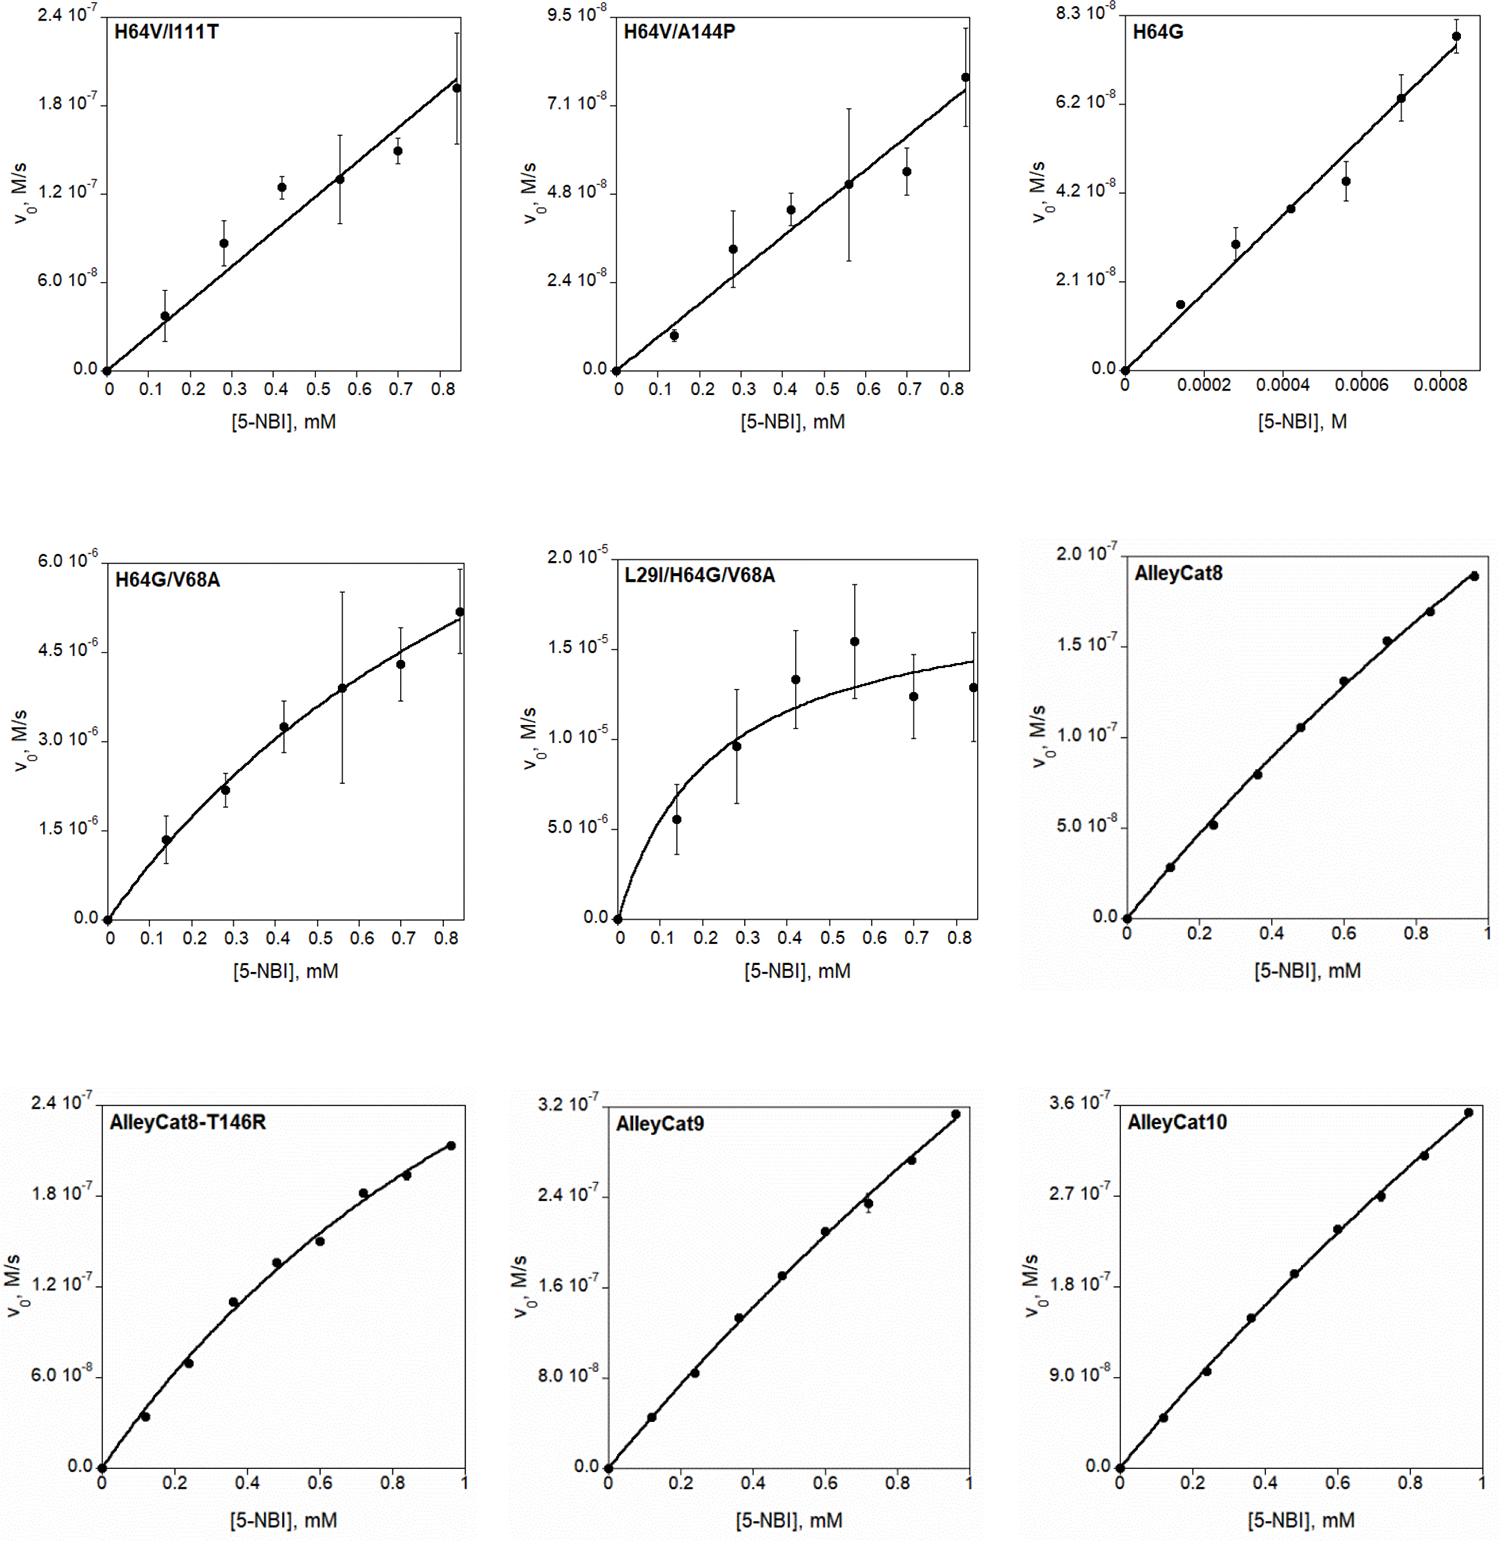
Final reaction mixtures for myoglobin mutant analyses contained 1 mM L-ascorbic acid, 0.1 μM SOD, 20 nM catalase, 140–840 μM substrate, 1.5% acetonitrile in 20 mM TRIS (pH 8.0). The protein concentration was 1 μM for Mb-H64V, 0.1 or 0.25 μM for Mb-H64V-based double variants, 5 nM for Mb-H64G or Mb-H64G-based double or triple variants. AlleyCat reaction mixtures contained 0.1 μM proteins with 0.12–0.96 mM substrate in 1.5% acetonitrile, 20 mM TRIS (pH 8.0), 10 mM CaCl2, 100 mM NaCl. Kinetic parameters are summarized in Table 1 and Extended Data Table 1.
Extended Data Table 1 |.
Kinetic parameters for the Kemp elimination reaction catalyzed by myoglobin variants in the reduced state (unless otherwise stated).
| Protein | kcat, s−1 | KM, mM | kcat/KM, M−1s−1 |
|---|---|---|---|
|
| |||
| H64V | − | − | 255 ± 8 |
| H64V (oxidized) | − | − | 7 ± 1 |
| G25C/H64V | − | − | 7,354 ± 143 |
| L29I/H64V | − | − | 1,550 ± 55 |
| L32Y/H64V | − | − | 3,795 ± 122 |
| F33A/H64V | − | − | 9,270 ± 523 |
| K42W/H64V | − | − | 7,237 ± 192 |
| F43L/H64V | 26.10 ± 3.85 | 1.94 ± 0.38 | 13,458 ± 670 |
| K47S/H64V | 2.55 ± 0.39 | 0.79 ± 0.21 | 3,240 ± 994 |
| H64V/V68A | − | − | 12,939 ± 622 |
| H64V/L86Y | − | − | 5,097 ± 355 |
| H64V/T95V | − | − | 785 ± 32 |
| H64V/I101C | − | − | 3,844± 551 |
| H64V/K102W | − | − | 710 ± 28 |
| H64V/E105W | − | − | 4,786 ± 538 |
| H64V/F106E | − | − | 697 ± 22 |
| H64V/I107W | − | − | 1,680 ± 135 |
| H64V/S108A | − | − | 524 + 24 |
| H64V/I111T | − | − | 2,356 ± 114 |
| H64V/A144P | − | − | 900 ± 43 |
| H64G | − | − | 18,152 ± 519 |
| H64G/V68A | 2,557 ± 372 | 1.28 ± 0.28 | 1,992,300 ± 143,420 |
| L29I/H64G/V68A | 3,656 ± 667 | 0.23 ± 0.13 | 15,721,000 ± 6,035,800 |
Extended Data Table 2 |.
Sequences of the proteins used in this study.
| Protein | Sequence | |||
|---|---|---|---|---|
|
| ||||
| MVLSEGEWQL | VLHVWAKVEA | DVAGHGQDIL | IRLFKSHPET | |
| Mb-H64V | LEKFDRFKHL | KTEAEMKASE | DLKKVGVTVL | TALGAILKKK |
| GHHEAELKPL | AQSHATKHKI | PIKYLEFISE | AIIHVLHSRH | |
| PGNFGADAQG | AMNKALELFR | KDIAAKYKEL | GYQG | |
| MVLSEGEWQL | VLHVWAKVEA | DVAGHGQDII | IRLFKSHPET | |
| FerrEICat | LEKFDRFKHL | KTEAEMKASE | DLKKGGVTAL | TALGAILKKK |
| GHHEAELKPL | AQSHATKHKI | PIKYLEFISE | AIIHVLHSRH | |
| PGNFGADAQG | AMNKALELFR | KDIAAKYKEL | GYQG | |
| AlleyCat | MKDTDSEEEI | REAFRVEDKD | GNGYISAAEL | RHVMTNLGEK |
| LTDEEVDEMI | READIDGDGQ | VNYEEFVQMM | TAK | |
| AlleyCat7 | MKDTDSEEEL | REQFRVEDKD | GNGYISAAEL | RIVMTNRGEK |
| LTDEEVDELI | RETDIDGDGQ | VNYEEFVQRM | TAK | |
| AlleyCat8 | MKDTDSEEEL | REQFRVEDKD | GNGYISAAEL | RIVMTNRGEK |
| LTDEEVDELH | RETDIDGDGQ | VNYEEFVQRM | TAK | |
| AlleyCat8-T146R | MKDTDSEEEL | REQFRVEDKD | GNGYISAAEL | RIVMTNRGEK |
| LTDEEVDELH | RETDIDGDGQ | VNYEEFVQRM | RAK | |
| AlleyCat9 | MKDTDSEEEL | REQFRVEDKD | GNGYISAAEL | RIVMTNRGEP |
| LTDEEVDELH | RETDIDGDGQ | VNYEEFVQRM | TAK | |
| AlleyCat10 | MKDTDSEEEL | REQFRVEDKD | GNGYISAAEL | RIVMTNRGEP |
| LTDEEVDELH | RETDIDGDGQ | VNYEEFVQRM | PAK | |
Extended Data Table 3 |.
Crystallographic data collection and refinement statistics.
| FerrElCat | AC9 | AC9_6-NBT | AC10 | AC10_6-NBT | |
|---|---|---|---|---|---|
|
| |||||
| Data collection | |||||
| Space group | P6 | P212121 | P43212 | P212121 | P43212 |
| Cell dimensions | |||||
| a, b, c (Å) | 90.02, 90.02,45.37 | 27.38, 58.71, 87.51 | 82.97,82.97, 104.07 | 27.31,50.50, 88.25 | 82.92, 82.92,104.95 |
| α, β, γ ° | 90.00, 90.00, 120.00 | 90.00, 90,00,120.00 | 90.00,90.00,90.00 | 90.00,90.00, 90.00 | 90.00,90.00,90.00 |
| Resolution (Å) | 22.68–1.40(1.42–1.40) | 12.75–1.70(1.73–1.70)* | 12.98–1.70(1.73–1.70)* | 12.50–1.70(1.73–1.70)* | 13.19–1.95 (2.02–1.95)* |
| Rsym or Rmerge | 0.072 | 0.095 | 0.081 | 0.153 | |
| I / σI | 15.5 | 13.6 | 15.8 | 10.0 | 11.2 |
| Completeness (%) | 99.8 | 99.3 | 99.7 | 99.5 | 99.7 |
| Redundancy | 6.9 | 4.9 | 9.8 | 4.5 | 10.6 |
| Refinement | |||||
| Resolution (Å) | 22.68–1.40 | 12.75–1.70 | 12.98–1.70 | 12.75–1.70 | 13.19–1.95 |
| No. reflections | 286602 | 16079 | 40502 | 13978 | 27277 |
| Rwork / Rfree | 17.7/19.5 | 17.9/21.4 | 21.4/25.2 | 19.7/24.5 | 24.9 / 27.8 |
| No. atoms | 1501 | 1181 | 4288 | 1221 | 2261 |
| Protein | 1218 | 1068 | 4030 | 1084 | 2114 |
| Ligand/ion | 5 | 64/15 | 6 | 48/17 | |
| Water | 231 | 92 | 135 | 131 | 82 |
| B-factors | 12.0 | 12.0 | 20.3 | 12.0 | 16.0 |
| Protein | 10.7 | ||||
| Ligand/ion | |||||
| Water | 22.0 | ||||
| R.m.s. deviations | |||||
| Bond lengths (Å) | 0.005 | 0.006 | 0.009 | 0.006 | 0.006 |
| Bond angles (°) | 0.772 | 0.819 | 0.819 | 0.741 | 0.763 |
Values in parentheses are for highest-resolution shell.
Supplementary Material
Acknowledgments
This work was supported by the National Institutes of Health grant (grant no. GM119634) and the Alexander von Humboldt Foundation. The authors thank Prof. Rudi Fasan for the gift of the plasmid containing the Mb gene. J.R.H.T. thanks OpenEye Scientific Software.
Footnotes
Competing interests The authors declare that they have no competing interests.
Additional information
Supplementary information The online version contains supplementary material available at https://doi.org/
References
- 1.Bornscheuer UT et al. Engineering the third wave of biocatalysis. Nature 485, 185–194 (2012). [DOI] [PubMed] [Google Scholar]
- 2.Reetz MT Laboratory evolution of stereoselective enzymes: a prolific source of catalysts for asymmetric reactions. Angew. Chem. Int. Ed. Engl. 50, 138–174 (2011). [DOI] [PubMed] [Google Scholar]
- 3.Denard CA, Ren H & Zhao H Improving and repurposing biocatalysts via directed evolution. Curr. Opin. Chem. Biol. 25, 55–64 (2015). [DOI] [PubMed] [Google Scholar]
- 4.Chen K & Arnold FH Engineering new catalytic activities in enzymes. Nat. Catal 3, 203–213 (2020). [Google Scholar]
- 5.Reetz MT, Wilensek S, Zha D & Jaeger KE Directed evolution of an enantioselective enzyme through combinatorial multiple-cassette mutagenesis. Angew. Chem. Int. Ed. Engl. 40, 3589–3591 (2001). [DOI] [PubMed] [Google Scholar]
- 6.Wijma HJ, Floor RJ & Janssen DB Structure- and sequence-analysis inspired engineering of proteins for enhanced thermostability. Curr. Opin. Struct. Biol. 23, 588–594 (2013). [DOI] [PubMed] [Google Scholar]
- 7.Planas-Iglesias J et al. Computational design of enzymes for biotechnological applications. Biotechnol. Adv. 47, 107696 (2021). [DOI] [PubMed] [Google Scholar]
- 8.Verma R, Schwaneberg U & Roccatano D Computer-aided protein directed evolution: a review of web servers, databases and other computational tools for protein engineering. Comput. Struct. Biotechnol. J. 2, e201209008 (2012). [DOI] [PMC free article] [PubMed] [Google Scholar]
- 9.Ebert MC & Pelletier JN Computational tools for enzyme improvement: why everyone can - and should - use them. Curr. Opin. Chem. Biol. 37, 89–96 (2017). [DOI] [PubMed] [Google Scholar]
- 10.Osuna S The challenge of predicting distal active site mutations in computational enzyme design. WIREs Comput. Mol. Sci. 11, e1502 (2021). [Google Scholar]
- 11.Wu Z, Kan SBJ, Lewis RD, Wittmann BJ & Arnold FH Machine learning-assisted directed protein evolution with combinatorial libraries. Proc. Natl. Acad. Sci. U.S.A. 116, 8852–8858 (2019). [DOI] [PMC free article] [PubMed] [Google Scholar]
- 12.Acevedo-Rocha CG et al. Pervasive cooperative mutational effects on multiple catalytic enzyme traits emerge via long-range conformational dynamics. Nat. Commun. 12, 1621 (2021). [DOI] [PMC free article] [PubMed] [Google Scholar]
- 13.Otten R et al. How directed evolution reshapes the energy landscape in an enzyme to boost catalysis. Science 370, 1442–1446 (2020). [DOI] [PMC free article] [PubMed] [Google Scholar]
- 14.Campbell E et al. The role of protein dynamics in the evolution of new enzyme function. Nat. Chem. Biol. 12, 944–950 (2016). [DOI] [PubMed] [Google Scholar]
- 15.Hong NS et al. The evolution of multiple active site configurations in a designed enzyme. Nat. Commun. 9, 3900 (2018). [DOI] [PMC free article] [PubMed] [Google Scholar]
- 16.Broom A et al. Ensemble-based enzyme design can recapitulate the effects of laboratory directed evolution in silico. Nat. Commun. 11, 4808 (2020). [DOI] [PMC free article] [PubMed] [Google Scholar]
- 17.Warshel A et al. Electrostatic basis for enzyme catalysis. Chem. Rev. 106, 3210–3235 (2006). [DOI] [PubMed] [Google Scholar]
- 18.Kemp DS & Casey ML Physical organic chemistry of benzisoxazoles. II. Linearity of the Bronsted free energy relationship for the base-catalyzed decomposition of benzisoxazoles. J. Am. Chem. Soc. 95, 6670–6680 (1973). [Google Scholar]
- 19.Rothlisberger D et al. Kemp elimination catalysts by computational enzyme design. Nature 453, 190–195 (2008). [DOI] [PubMed] [Google Scholar]
- 20.Blomberg R et al. Precision is essential for efficient catalysis in an evolved Kemp eliminase. Nature 503, 418–421 (2013). [DOI] [PubMed] [Google Scholar]
- 21.Risso VA et al. De novo active sites for resurrected Precambrian enzymes. Nat. Commun. 8, 16113 (2017). [DOI] [PMC free article] [PubMed] [Google Scholar]
- 22.Merski M & Shoichet BK Engineering a model protein cavity to catalyze the Kemp elimination. Proc. Natl. Acad. Sci. U.S.A. 109, 16179–16183 (2012). [DOI] [PMC free article] [PubMed] [Google Scholar]
- 23.Debler EW, Muller R, Hilvert D & Wilson IA An aspartate and a water molecule mediate efficient acid-base catalysis in a tailored antibody pocket. Proc. Natl. Acad. Sci. U.S.A. 106, 18539–18544 (2009). [DOI] [PMC free article] [PubMed] [Google Scholar]
- 24.Vaissier V, Sharma SC, Schaettle K, Zhang T & Head-Gordon T Computational optimization of electric fields for improving catalysis of a designed Kemp eliminase. ACS Catal. 8, 219–227 (2018). [Google Scholar]
- 25.Lamba V et al. Kemp eliminase activity of ketosteroid isomerase. Biochemistry 56, 582–591 (2017). [DOI] [PMC free article] [PubMed] [Google Scholar]
- 26.Risso VA et al. Enhancing a de novo enzyme activity by computationally-focused ultra-low-throughput screening. Chem. Sci. 11, 6134–6148 (2020). [DOI] [PMC free article] [PubMed] [Google Scholar]
- 27.Li A et al. A redox-mediated Kemp eliminase. Nat. Commun. 8, 14876 (2017). [DOI] [PMC free article] [PubMed] [Google Scholar]
- 28.Miao Y, Metzner R & Asano Y Kemp elimination catalyzed by naturally occurring aldoxime dehydratases. ChemBioChem 18, 451–454 (2017). [DOI] [PubMed] [Google Scholar]
- 29.Bordeaux M, Tyagi V & Fasan R Highly diastereoselective and enantioselective olefin cyclopropanation using engineered myoglobin-based catalysts. Angew. Chem. Int. Ed. Engl. 54, 1744–1748 (2015). [DOI] [PMC free article] [PubMed] [Google Scholar]
- 30.Yi J, Heinecke J, Tan H, Ford PC & Richter-Addo GB The distal pocket histidine residue in horse heart myoglobin directs the O-binding mode of nitrite to the heme iron. J. Am. Chem. Soc. 131, 18119–18128 (2009). [DOI] [PMC free article] [PubMed] [Google Scholar]
- 31.Wang B et al. Nitrosyl myoglobins and their nitrite precursors: crystal structural and quantum mechanics and molecular mechanics theoretical investigations of preferred Fe-NO ligand orientations in myoglobin distal pockets. Biochemistry 57, 4788–4802 (2018). [DOI] [PMC free article] [PubMed] [Google Scholar]
- 32.Korendovych IV et al. Design of a switchable eliminase. Proc. Natl. Acad. Sci. U.S.A. 108, 6823–6827 (2011). [DOI] [PMC free article] [PubMed] [Google Scholar]
- 33.Moroz OV et al. A single mutation in a regulatory protein produces evolvable allosterically regulated catalyst of nonnatural reaction. Angew. Chem. Int. Ed. Engl. 52, 6246–6249 (2013). [DOI] [PMC free article] [PubMed] [Google Scholar]
- 34.Chattopadhyaya R, Meador WE, Means AR & Quiocho FA Calmodulin structure refined at 1.7 A resolution. J. Mol. Biol. 228, 1177–1192 (1992). [DOI] [PubMed] [Google Scholar]
- 35.Marshall LR, Zozulia O, Lengyel-Zhand Z & Korendovych IV Minimalist de novo design of protein catalysts. ACS Catal. 9, 9265–9275 (2019). [DOI] [PMC free article] [PubMed] [Google Scholar]
Methods references
- 36.Casey ML, Kemp DS, Paul KG & Cox DD Physical organic chemistry of benzisoxazoles. I. Mechanism of base-catalyzed decomposition of benzisoxazoles. J. Org. Chem. 38, 2294–2301 (1973). [Google Scholar]
- 37.Berry EA & Trumpower BL Simultaneous determination of hemes a, hemes b, and hemes c from pyridine hemochrome spectra. Anal. Biochem. 161, 1–15 (1987). [DOI] [PubMed] [Google Scholar]
- 38.Barik S Megaprimer PCR. in PCR Cloning Protocols (eds. Chen B-Y & Janes H) 189–196 (Humana Press, Totowa, 2002). [Google Scholar]
- 39.Delaglio F et al. NMRPipe - a multidimensional spectral processing system based on UNIX Pipes. J. Biomol. NMR 6, 277–293 (1995). [DOI] [PubMed] [Google Scholar]
- 40.Vranken WF et al. The CCPN data model for NMR spectroscopy: development of a software pipeline. Proteins 59, 687–696 (2005). [DOI] [PubMed] [Google Scholar]
- 41.Kannt A, Young S & Bendall DS The role of acidic residues of plastocyanin in its interaction with cytochrome f. Biochim. Biophys. Acta - Bioenerg. 1277, 115–126 (1996). [PubMed] [Google Scholar]
- 42.Storoni LC, McCoy AJ & Read RJ Likelihood-enhanced fast rotation functions. Acta Crystallogr. D: Struct. Biol. 60, 432–438 (2004). [DOI] [PubMed] [Google Scholar]
- 43.Emsley P, Lohkamp B, Scott WG & Cowtan K Features and development of Coot. Acta Crystallogr. D: Biol. Crystallogr 66, 486–501 (2010). [DOI] [PMC free article] [PubMed] [Google Scholar]
- 44.Adams PD et al. PHENIX: a comprehensive Python-based system for macromolecular structure solution. Acta Crystallogr. D: Biol. Crystallogr 66, 213–221 (2010). [DOI] [PMC free article] [PubMed] [Google Scholar]
- 45.Chen VB et al. MolProbity: all-atom structure validation for macromolecular crystallography. Acta Crystallogr. D: Biol. Crystallogr 66, 12–21, (2010). [DOI] [PMC free article] [PubMed] [Google Scholar]
- 46.Trott O & Olson AJ AutoDock Vina: improving the speed and accuracy of docking with a new scoring function, efficient optimization and multithreading. J. Comput. Chem. 31, 455–461 (2010). [DOI] [PMC free article] [PubMed] [Google Scholar]
- 47.Makhlynets OV & Korendovych IV Minimalist design of allosterically regulated protein catalysts. Meth. Enzymol. 580, 191–202 (2016). [DOI] [PubMed] [Google Scholar]
Associated Data
This section collects any data citations, data availability statements, or supplementary materials included in this article.
Supplementary Materials
Data Availability Statement
The crystallographic data and refinement statistics were deposited in the Worldwide Protein Data Bank (wwPDB) with the entry code 7vuc (FerrElCat), 7vur (AlleyCat9), 7vus (AlleyCat9 with 6-NBT), 7vut (AlleyCat10), 7vuu (AlleyCat10 with 6-NBT).


