Abstract
Objectives:
Ultrasound users are advised to observe the ALARA (As Low As Reasonably Achievable) principle, but studies have shown that most do not monitor acoustic output metrics. We developed an adaptive ultrasound method that could suggest acoustic output levels based on real-time image quality feedback based on lag-one coherence (LOC).
Methods:
LOC as a function of Mechanical Index (MI) was assessed in thirty-five healthy volunteers in their second trimester of pregnancy. While imaging the placenta or the fetal abdomen, the system swept through 16 MIs ranging from 0.15 to 1.20. The LOC v. MI data was fit with a sigmoid curve and the ALARA MI was selected as the point at which the fit reached 98% of its maximum.
Results:
In this study, the ALARA MI values were between 0.35 and 1.03, depending on the acoustic window. Compared to a default MI of 0.8, the pilot acquisitions suggested a lower ALARA MI 80% of the time. Contrast, contrast-to-noise ratio (CNR), Generalized CNR (gCNR), and LOC all followed sigmoidal trends with increasing MI. The R2 of the fit was statistically significantly better for LOC than the other metrics (p < 0.017).
Conclusions:
These results suggest that maximum image quality can be achieved with acoustic output levels lower than the FDA limits in many cases and an automated tool could be employed in real-time to find the ALARA MI for specific imaging conditions. Our results support the feasibility of an automated, LOC-based implementation of the ALARA principle for obstetric ultrasound.
Keywords: fetal ultrasound, acoustic exposure, ALARA, image quality, safety
BACKGROUND
ALARA is an acronym for “As Low As Reasonably Achievable.” This principle is widely used in medical imaging that involves ionizing radiation exposure, such as X-ray and Computed Tomography (CT), and it is codified in the Federal Registrar as part of the Standards for Protection Against Radiation.1 This ALARA safety framework has also been extended to ultrasonic imaging.2
The US Food and Drug Administration (FDA) is the main regulatory body for diagnostic ultrasound in the United States. It provides guidelines for the acoustic output of ultrasound systems through several metrics that quantify acoustic exposure. The FDA initially implemented application-specific guidelines for acoustic exposure limits for ultrasound systems in response to the Medical Device Amendments of 1976.3-5 The values chosen were based on the output levels of scanners available at the time. In their 1993 guidance, the FDA increased some of the guideline values, standardized them for all applications except ophthalmic imaging, and added metrics that related output levels to mechanical and thermal bioeffects, the Mechanical Index (MI) and Thermal Index (TI), respectively.6,7 These changes were related to an ongoing debate in the ultrasound community between supporting hard upper limits for acoustic output or relying on the users’ discretion and a case-by-case risk/benefit analysis. With these changes, a significant portion of the risk assessment was transferred from manufacturers to ultrasound users.4
The MI is an indicator of the risk of mechanical effects, such as cavitation.8 Inertial cavitation happens when small, gas-filled nuclei undergo large changes in size and ultimately collapse, causing local temperatures up to thousands of degrees Celsius and the formation of harmful free-radicals.9-11 The MI is measured in water and calculated according to the following formula12:
where pr,0.3(zsp) refers to peak-rarefactional pressure in MPa attenuated by 0.3 dB/(cm·MHz) at the axial spatial peak (zsp) or point on the beam axis where the attenuated pulse intensity integral is the maximum, and fawf is the acoustic working frequency in MHz. Currently, the FDA limit for MI is 1.9, which is based on the maximum acoustic output of ultrasound devices on the market before 1976.13 The probability of cavitation increases with increasing MI, and it can still occur below this limit.8
Ultrasound is the dominant imaging method used in obstetric care.14,15 On average, a U.S. newborn has been scanned 4.6 times while in utero.16 Diagnostic ultrasound is known for being a safe imaging modality, and no adverse bioeffects have been shown in humans at the output levels of fetal diagnostic imaging.17 A review of the available epidemiologic evidence by Stratmeyer et al.18 does not support a causal relationship between fetal ultrasound examinations and adverse nonthermal effects. However, the epidemiological studies that this conclusion is based on were performed on commercially available scanners before the increase in allowed acoustic output in 1993. The changes implemented in 1993 included raising the fetal limits for Spatial Peak Temporal Average Intensity (ISPTA) from 94 mW/cm2 to 720 mW/cm2.2 A study by Martin19 found that acoustic output has notably increased between 1991 and 2010 and worst-case values for peak negative pressure in B-mode nearly doubled during that time period. Additionally, animal studies have shown that diagnostically-relevant levels of ultrasound exposure can result in impaired memory and learning in mice,20 as well as altered gene expression in rats.21 Neither of these studies identified the mechanism for the observed effects and it is unclear how these results are related to ultrasound scanning of human fetuses, but they suggest that excessive acoustic exposure should be avoided.
However, there is diagnostic benefit to using higher levels of acoustic exposure. Greater acoustic output can increase signal-to-noise ratio (SNR) and depth of penetration in ultrasound images.22 Harmonic imaging generally improves contrast and lateral resolution compared to fundamental imaging, but it is more SNR limited.23,24 This may suggest that greater acoustic output is needed to create high quality images when using harmonic imaging, which has been shown to improve obstetric ultrasound image quality25,26 and is commonly used. In our experience at the Duke Fetal Diagnostic Center, nearly all patients are scanned using harmonic imaging.
Track 3 of the FDA guidelines for 510k approval of ultrasound systems and transducers recognizes both the potential risk for bioeffects of ultrasound as well as the diagnostic benefits of increased acoustic output. It applies to devices that follow the Output Display Standard (IEC 60601-2-37), which requires that, for both MI and TI, if the ultrasound equipment is capable of producing a value of the safety index > 1.0, that index is displayed whenever it is 0.4 or greater, so that the ultrasound user can make informed decisions about acoustic exposure risks and benefits.4,27 The FDA guidelines2 also suggest an ALARA (As Low As Reasonably Achievable) education program for the clinical end-user that includes “a recommendation to use and the need to follow the ALARA principle in all studies and clinical examples of specific applications of the ALARA principle.” Further, obstetric ultrasound guidelines produced by several professional societies recommend that obstetric ultrasound only be used when there is a valid medical reason and that users follow the principle of ALARA.28-30
Research has shown that, in practice, most physicians and sonographers do not consider ALARA when selecting acoustic output settings. One study found that only 3.8% of the ultrasound users surveyed could correctly describe the MI.31 In this same study, only 20.8% knew that acoustic indices are displayed on the ultrasound monitor.31 Another survey-based study32 found that just 10.9% of residents and 22.7% of fellows used these values during their examinations, while an eye tracking analysis33 found that the safety indices were viewed in 4.2% of scans. These reports suggest that higher than necessary output exposure levels may be routinely being used clinically.
A system that automatically adjusts output based on image quality feedback, thereby eliminating the user-dependence of the ALARA principle, has potential to improve image quality while increasing patient safety. This would depend on the image quality metric being precise and reliable in clinical imaging cases that inevitably include motion, various sources of noise, and complex anatomy.
Contrast and Contrast-to-Noise Ratio (CNR) are commonly used to characterize ultrasound image quality. Recently, generalized Contrast-to-Noise Ratio (gCNR) was introduced as a dynamic-range-independent metric that quantifies how well an ideal observer could distinguish two regions.34 However, all of these metrics require two identified homogeneous regions, a background region and an echogenic target, and they depend on the inherent contrast of the target and the background. To overcome these limitations, we instead propose the application of a novel spatial-coherence-derived image quality metric, lag-one coherence (LOC),35 to achieve automated ALARA.
In this paper, we assess the viability of an LOC-based automated ALARA method for obstetric ultrasound. Building off previous work that evaluated LOC in simulation and in vivo liver studies35 and a preliminary fetal study,36 we assess LOC as an image quality metric for fetal imaging. LOC is compared to other image quality metrics, and the MI values determined by the automated ALARA method are compared within and between subjects.
MATERIALS AND METHODS
A. Ultrasound System
A Verasonics Vantage 256 ultrasound system (Verasonics, Kirkland, WA) and a C5-2v transducer were used to collect channel echo data. The Vantage 256 is a research system used in a variety of in vitro and preclinical settings, as well as for some clinical research under Institutional Review Board (IRB) or ethics committee approval. It allows for direct access to raw ultrasound data and provides more flexibility than clinical ultrasound systems.
Pulse-inversion harmonic imaging was used for all acquisitions with a transmit frequency of 2.36 MHz, focal depths between 4 and 9 cm, and an F/2.0 transmit configuration. The difference of the pulse-inversion data was used for the fundamental analysis. Hydrophone measurements were made in a water tank using an Acertara 805 Hydrophone (Acertara, Longmont, CO) in accordance with International Electrotechnical Commission (IEC) Standards 62127-1 and 62359 to calibrate MI settings and to ensure that the acoustic output values were within FDA limits.12,37 The maximum MI of used in this study was 1.2. However, due to system output limitations, an MI of 1.2 was not achievable for the deepest focus of 9 cm and a maximum MI of 1.06 was used when this focal depth was needed.
B. In Vivo Data Acquisition
Thirty-five volunteers with healthy, singleton pregnancies in their second trimester were enrolled in this study in accordance with an approved Duke Health IRB protocol after their regularly scheduled appointments at the Duke University Hospital Fetal Diagnostic Center. The Body Mass Index (BMI) values of the subjects, based on pre-pregnancy weights, ranged from 17.6 to 48.6 with a median of 24.6 and the ages of the subjects were between 19 and 42 with a median of 30. Scanning was performed by an expert sonographer with more than 25 years of experience in fetal sonography. For all acquisitions, the placenta was scanned first, then the transducer was angled to image the fetal abdomen without removing it from contact with the subject’s body and while attempting to maintain the same acoustic window.
1. Pilot Acquisitions:
As shown in figure 1, an ROI that was centered laterally and at the axial transmit focus, was 2 cm tall, and had a 4° span was positioned on the fetal abdomen or placenta. Then the transmit voltage was rapidly and sequentially varied to achieve 16 MI values between 0.15 and 1.20 in 0.23 seconds. Channel data were acquired for five image lines that were equally spaced across the ROI and were repeated twice at each transmit voltage, allowing calculation of both LOC and temporal correlation. The median lag-one coherence (LOC) from within the ROI was extracted for each MI. For all thirty-five subjects, three acquisitions focused on the placenta and three focused on the fetal abdomen.
Figure 1.
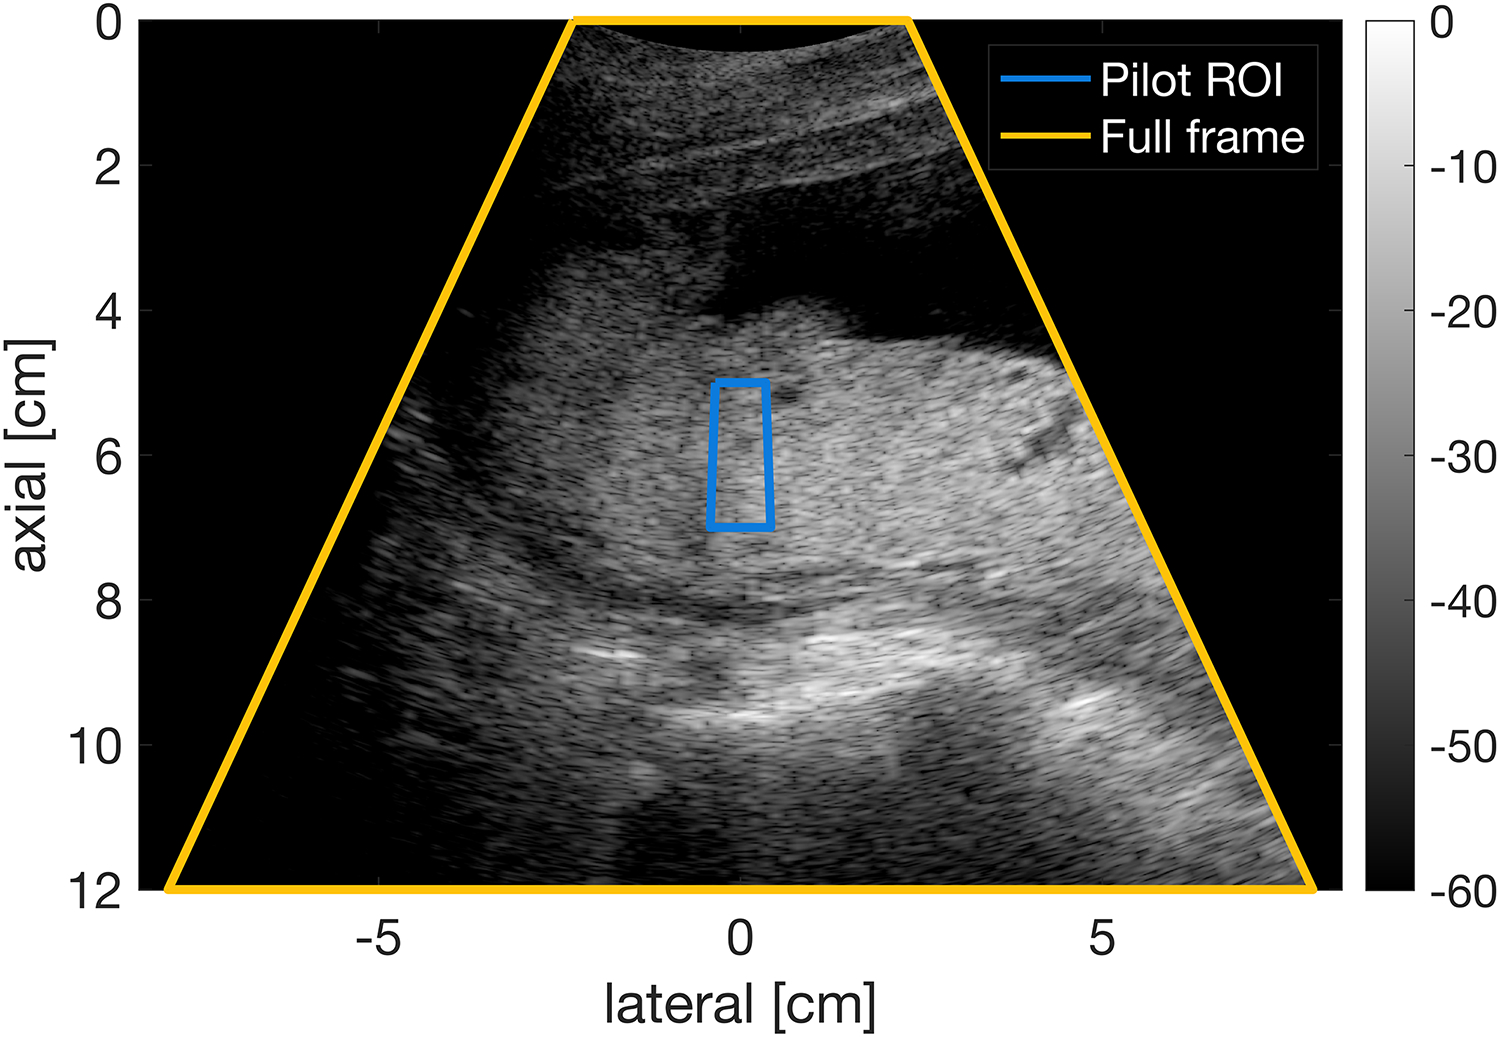
Placenta image from a 24-year-old woman in her second trimester of pregnancy with pilot acquisition ROI displayed. The ROI is 2 cm tall and has a 4° span. The full frame has a span of 50°.
2. Full-Frame Acquisitions:
Immediately following the pilot acquisition, full frames of channel data with a 50° span were acquired at the same 16 MI values that were used in the pilot acquisition followed by 12 frames at a constant MI value of 0.8. This MI value was chosen because it is the default setting for the routine second trimester exam using a GE Voluson E8 scanner and a C1-5-D transducer. The frames were acquired at a rate of 14 frames per second. At the deepest focus of 9 cm, only the first 14 of the 16 swept MI values were achievable (maximum MI of 1.06) as a result of system output limitations, so two additional frames were acquired at the fixed MI of 0.8 for a total of 14 swept MI and 14 constant MI frames (rather than 16 and 12) and an equivalent total acquisition time of 2 seconds.
C. Image Quality Measurements
In this study, we evaluate the use of a novel image quality metric known as LOC to achieve automated ALARA in fetal scanning. LOC is the average spatial coherence calculated from pairs of neighboring (lag one) transducer array elements at each pixel or over a small axial kernel. LOC is sensitive to sources of clutter, such as reverberation, aberration, and off-axis scattering, and also to thermal noise.38-40 A more comprehensive overview of LOC is provided by Long et al.35 In brief, the spatial coherence of ultrasound is derived from the van Cittert-Zernike (VCZ) theorem of statistical optics and was applied to pulse-echo ultrasound by Mallart and Fink.41 Long et al.35 showed that the normalized spatial coherence of signals from two receive channels, each defined as the sum of a signal (S) and uncorrelated channel noise (N), can be represented by the following formula:
where the two channels are channel i and channel i + m and m represents the lag or spatial separation of the channels. Equivalently, the normalized spatial coherence can be represented in terms of the channel signal-to-noise ratio (SNR), or the ratio of the signal power to the noise power.
Mallart and Fink derived that the noise-free spatial coherence is equal to the autocorrelation of the transmit aperture function.41 In the case of a rectangular aperture, this would be a triangle function and would be a triangle plus a delta function (at m = 0) due to the spatially incoherent noise. LOC is the spatial coherence for a lag of one, or , which reflects the loss in SNR from spatially incoherent sources, such as thermal noise, reverberation, and high-frequency aberration.
We compared the in-vivo performance of LOC to commonly used image quality metrics such as contrast and Contrast-to-Noise Ratio (CNR), as well as Generalized Contrast-to-Noise Ratio (gCNR). Contrast42 and CNR43,44 are calculated using the following equations:
where μenv refers to the mean of the envelope-detected signal in either the background (B) or target (T) region, and refers to the variance of the envelope-detected signal in the designated region. In this study, the hypoechoic target regions that were evaluated contained amniotic fluid and the background regions contained either placenta or fetal abdomen. LOC was compared to contrast and CNR by Long et al.35
The Generalized Contrast-to-Noise Ratio (gCNR) is an image quality metric that assesses the separability of two regions’ pixel magnitude distributions.34 It is calculated based on the following equations:
where pB is the distribution of the background region pixels and pT is the distribution of the target region pixels.
As opposed to contrast, CNR, and gCNR, LOC can be measured using a single region of interest (ROI), which is advantageous in realistic imaging conditions. The complex anatomy and motion found in obstetric ultrasound make tracking structures through frames challenging and requiring that only one region remain consistent is a more tractable task.
D. Curve Fitting
The image quality metric versus MI data from the swept voltage acquisitions were normalized to the maximum value and fit with an asymmetric sigmoid defined by a five-parameter logistic function.45 In this study, the ALARA MI was defined as the point at which the sigmoid fit of the image quality metric reached 98% of its maximum. If the metric was never less than 98% of its maximum, the minimum MI used in the sweep was considered the ALARA MI. The sigmoid fits were compared based on the ALARA MI that they suggest, goodness of fit, and monotonicity. Monotonicity was assessed using the Fisher-transformed Spearman’s rank correlation. The LOC, contrast, CNR, and gCNR from the constant-MI channel data were assessed for consistency through consecutively acquired frames by calculating the coefficient of variation, or the ratio of the standard deviation to the mean. For each set of statistical tests, a Bonferroni correction for the three comparisons performed (LOC v. contrast, LOC v. CNR, and LOC v. gCNR) was applied to an initial α of 0.05, yielding a value of 0.017 to be used for comparison.
E. Image Quality Comparison
LOC, contrast, CNR, and gCNR were compared for images made from the full frames of channel echo data. ROIs were manually selected on B-Mode images with one region (background) in the placenta or fetal abdomen and another region (target) in the amniotic fluid. All ROIs had areas between 0.50 and 2.25 cm2 and were located within 2 cm of the transmit focus. Acquisitions that did not have consistent soft tissue and amniotic fluid regions of at least 0.50 cm2 and within 2 cm of the focus because of the position of the structures or excessive motion between frames were excluded from consideration (97 swept MI acquisitions and 105 fixed MI acquisitions). After exclusion criteria were applied, there remained 113 swept MI acquisitions and 105 fixed MI acquisitions that were included in this analysis.
RESULTS
Examples of the asymmetric sigmoid fits used to determine the “optimum” point, representing the ALARA output conditions, are presented in figure 2 for a Model ATS 549 phantom (CIRS, Norfolk, VA) and several in vivo acquisitions. The median LOC within one centimeter of the focus was calculated from the pilot acquisition data at each MI, and these results reliably follow a sigmoidal shape. In figure 3, LOC is compared to contrast, CNR, and gCNR for several examples of placenta and fetal abdomen acquisitions.
Figure 2.
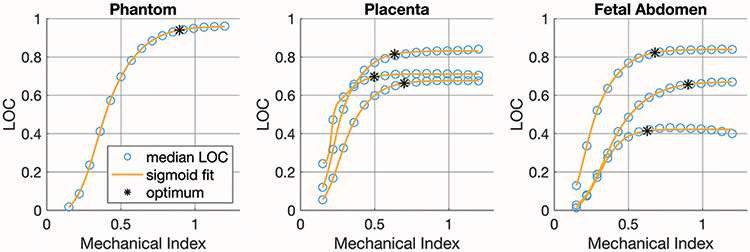
Example plots of LOC v. MI for a phantom acquisition and three examples each of placenta and fetal abdomen pilot acquisitions.
Figure 3.
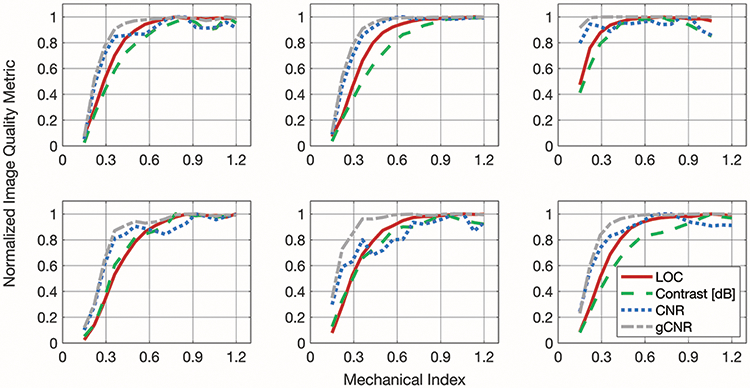
Example matched plots of normalized image quality metrics (LOC, contrast, CNR, and gCNR). The plots in the top row are from placenta acquisitions and the ones in the bottom row are from fetal abdomen acquisitions.
Data like those plotted in figure 3 were fit with an asymmetric sigmoid function that reflects the changes in image quality with MI. The metrics tend to increase markedly with increasing MI at low MI values, and then approach an asymptote at higher MI values. The ALARA MI suggested by these sigmoid fits (the MI at which the image quality metric reaches 98% of its maximum) are shown for 113 acquisitions in figure 4. On average, the ALARA MI suggested by LOC is 0.17 +/− 0.16 below the ALARA MI suggested by contrast, 0.04 +/− 0.24 above the ALARA MI suggested by CNR, and 0.23 +/− 0.08 above the ALARA MI suggested by gCNR. The means of these differences in ALARA MI values are statistically significantly different from zero for contrast and gCNR (p < 0.017), but not for CNR.
Figure 4.

Comparison of the ALARA MI value suggested by LOC compared to the other image quality metrics (contrast, CNR, and gCNR). Data points above the diagonal line represent cases that LOC suggests a higher MI value than the other metric.
The goodness of fit and monotonicity are shown in figures 5 and 6. Figure 5 displays the R2 of the sigmoidal fits of the image quality metric versus MI data. The median R2 values were 0.999, 0.996, 0.959, and 0.996 for LOC, contrast, CNR, and gCNR, respectively. Based on the Wilcoxon signed-rank test, the R2 values for LOC were significantly greater than the R2 values from the other metrics (all p < 0.017). Figure 6 shows the Fisher z-transformed Spearman’s Rank Correlation Coefficients of the fits as a measure of the data’s monotonicity. The monotonicity of LOC was greater than that of contrast, CNR, and gCNR in 57%, 79%, and 76% of the 113 acquisitions assessed. The Fisher z-transform was used to normalize the correlation coefficients before t-tests were performed.46 Four of the 113 data sets were excluded from the t-tests because one of the metrics (LOC for two data sets and contrast for two data sets) had a Spearman’s Rank Correlation Coefficient of 1, and therefore a Fisher z-transformed value of infinity. The mean difference in Fisher-transformed Spearman’s Rank Correlation Coefficients for LOC and contrast was not statistically significant. LOC was statistically significantly more monotonic than CNR and gCNR (p < 0.017).
Figure 5.
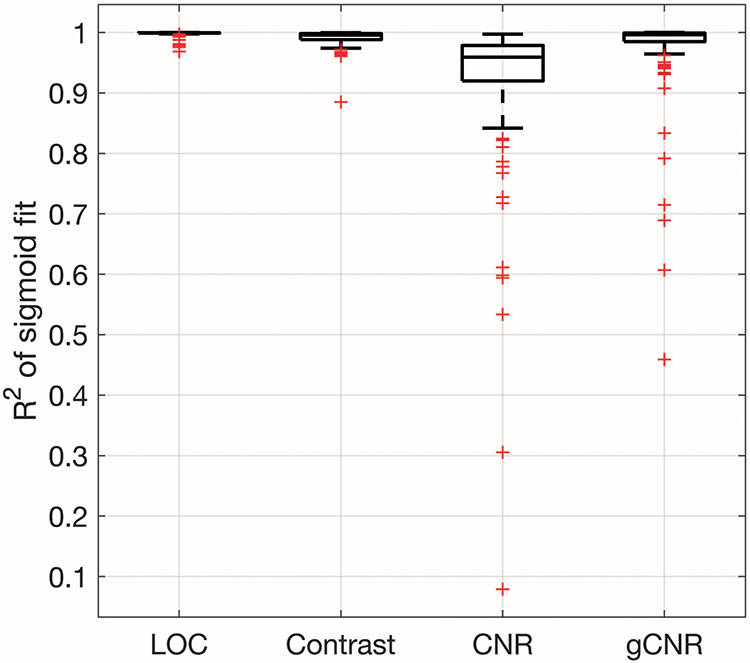
R2 of the sigmoid fits for image quality metric v. MI data. The boxplots were generated from 113 acquisitions. The R2 of the LOC fits are statistically significantly greater than the R2 of the other image quality metric fits.
Figure 6.
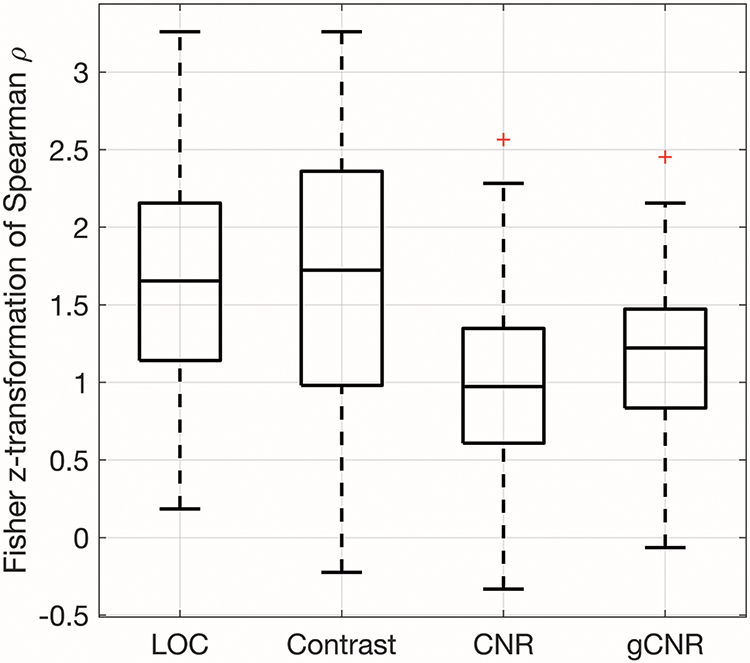
The monotonicity of the image quality metrics as demonstrated by Fisher z-transformed Spearman’s Rank Correlation Coefficients. LOC was statistically significantly more monotonic than CNR and gCNR. The difference between LOC and contrast was not statistically significant.
The stability of the image quality metrics for in vivo fetal imaging was assessed using the coefficient of variation from each constant MI acquisition and these results are shown in figure 7. The median coefficients of variation for LOC, contrast, CNR, and gCNR are 1%, 2%, 4%, and 0.1%. The coefficients of variation for LOC were compared to those of each of the other image quality metrics using a Wilcoxon signed-rank test. The mean coefficient of variation for LOC was significantly smaller than the coefficients of variation for contrast and CNR (both p < 0.017), and the coefficient of variation for LOC was significantly larger than the coefficient of variation for gCNR (p < 0.017 ).
Figure 7.
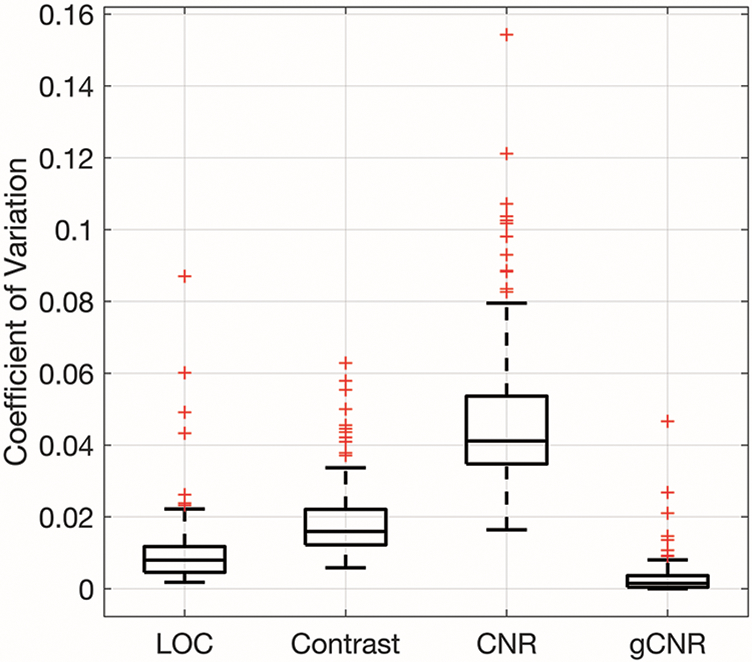
Coefficient of variation for LOC, contrast, CNR, and gCNR of constant-MI data. The boxplots were generated from 105 acquisitions. LOC has a significantly smaller coefficient of variation than contrast and CNR and a significantly larger coefficient of variation than gCNR.
Figure 8 shows the ALARA MI values and the LOC values achieved at those MIs aggregated for all 210 pilot clinical data sets and the mean and standard deviation of pilot phantom data sets. The range of ALARA MIs for the clinical data is 0.35 to 1.03 and the range of LOC values is 0.27 to 0.89. No clear relationship was identified between the ALARA MI values and the LOC values at which they were reached (r = −0.11), but, in general, the fetal abdomen acquisitions had higher ALARA MI values than the placenta acquisitions.
Figure 8.
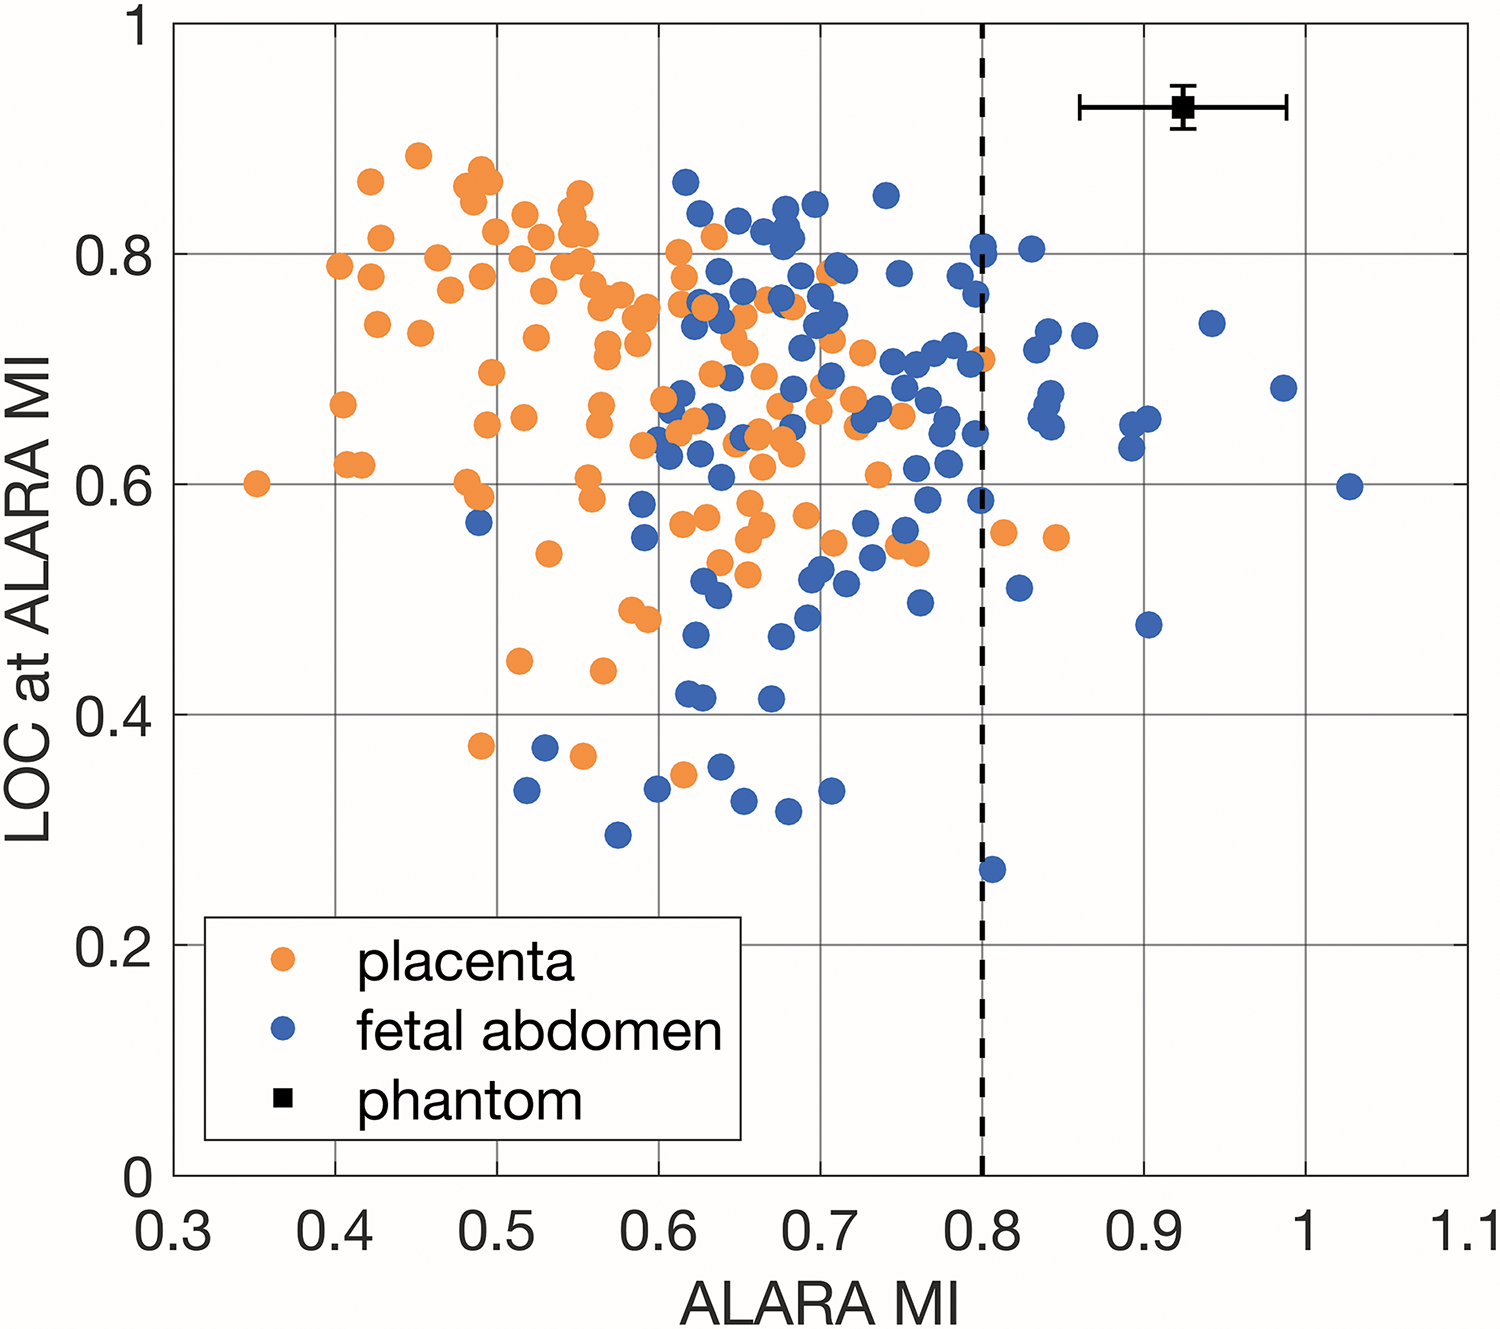
Comparison of ALARA MI and the corresponding LOC value calculated from the pilot acquisition for all 210 image sets and the mean and standard deviation of six phantom acquisitions (one at each focal depth, 4-9cm). A reference MI value of 0.8 is marked with a dashed line.
The automated ALARA method was also considered for the fundamental data from the clinical pilot acquisitions. Of the 210 data sets, 84% of cases suggested using the lowest evaluated MI value (0.15) and 9% failed, either because the fit of the logistic function failed or the resulting fit decreased. These results indicate that, at least for the patients and imaging techniques studied, fetal acoustic exposure can be kept extraordinarily low for fundamental imaging without sacrificing image quality. Different ranges of MI values would need to be considered to compare fundamental and harmonic configurations in future work, since a limitation of this study is 0.15 was the minimum MI used. In this analysis, only harmonic data will be considered going forward.
Figure 9 shows example frames from a single fetal abdomen acquisition. The frames shown correspond to MI values of 0.15, 0.36, 0.64, and 1.2. The mean and variance of each frame’s log-compressed image data were matched.47 Decreased clutter is visible in the amniotic fluid to the left of the fetal abdomen in the second and third frames, but not in the fourth frame. This corroborates the ALARA MI of 0.65 indicated by LOC for this acquisition.
Figure 9.

Example images from a transverse fetal abdomen acquisition (27-year-old patient). Histogram matched images are shown on a 70dB dynamic range. The ALARA MI of this acquisition as indicated by LOC is 0.65.
Though the pilot acquisitions in this study were acquired with a fixed ROI position aligned with the target tissue by the sonographer, LOC creates stable measurements of image quality for soft tissue throughout an image. Figure 10 shows an example of a placenta acquisition and a fetal abdomen acquisition with the corresponding ALARA MI and LOC images from 0.5cm x 0.5cm regions across the full-frame acquisitions. For each region, the LOC from every image frame in the sweep was used to calculate the ALARA MI. Regions were excluded from the figure if the asymmetric sigmoid fit failed (using the MATLAB fit function), the resulting sigmoid function was not monotonically increasing, the R2 of the fit was less than 0.95, or the asymptotic LOC value was in the lowest quartile of the regions in that data set.
Figure 10.
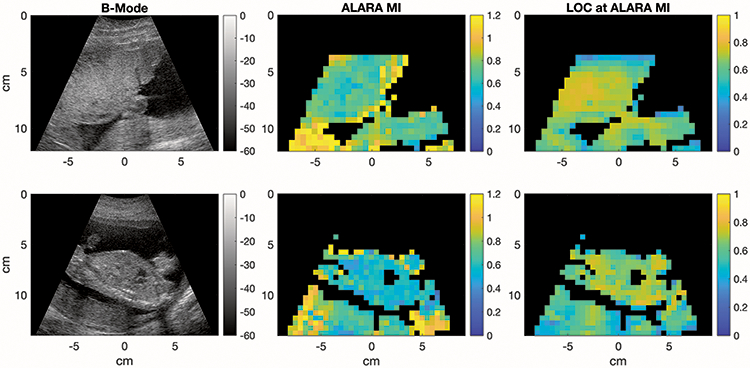
Upper: Placenta image from a 32-year-old woman in her second trimester of pregnancy, Lower: Fetal abdomen with placenta below from a 34-year-old woman in her second trimester of pregnancy. Two examples of a harmonic B-Mode image (left), the corresponding images of ALARA MI values calculated from full-frame acquisitions for 0.5x0.5cm ROIs (center), and the LOCs achieved in each region (right). The ALARA MIs were calculated by fitting sigmoid curves to the LOC values within each ROI through 16 consecutive frames collected at varying MIs. ROIs were excluded if the LOC v. MI curve fit failed or did not produce a monotonically increasing function, the R2 of the fit was less than 0.95, or the asymptotic LOC value was in the lowest quartile.
Notable differences in ALARA MI appear in areas with a lot of shadowing such as in the placenta below the fetal spine image in figure 10 (lower), indicating that it may not be a good region for optimization. The heart is excluded from the ALARA MI and LOC images because motion leads to poor stability across frames and fluid regions often generate low LOC and R2 values. The number of image lines contained within each 0.5cm x 0.5cm region varies depending on depth, but for 4-14 cm, the number of image lines is between 3 and 7 with shallower regions more densely packed with image lines.
As shown in figure 11, there was considerable variability in the calculated ALARA MI between subjects and sometimes within subjects. Some subjects, like Subject 33, had almost the same ALARA MIs for all placenta and fetal abdomen acquisitions, while others, like Subject 26, had a large difference between placenta acquisitions and fetal abdomen acquisitions, but small within-group variability. The smallest standard deviation of ALARA MI values was 0.007 for Subject 27’s fetal abdomen acquisitions, while Subject 15 had a standard deviation of 0.2 for these acquisitions.
Figure 11.
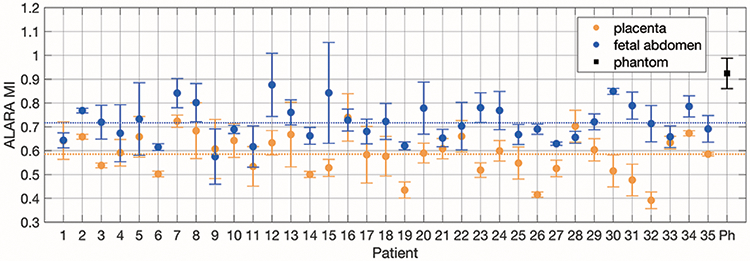
ALARA MI values for placenta and fetal abdomen pilot acquisitions for each subject and phantom acquisitions. Six phantom data sets were used to calculated the mean and standard deviation ALARA MI values. For the clinical acquisitions, mean and standard deviation error bars are shown for three acquisitions each. The global mean ALARA MI values for placenta acquisitions and fetal abdomen acquisitions are shown as dotted lines.
Figure 12 shows the ALARA MI values from the LOC versus MI sweeps for ten representative subjects. For each subject, there are three data sets that focus on the placenta and three that focus on the fetal abdomen. Images were acquired as placenta, fetal abdomen pairs with the transducer left in place after the placenta acquisition and tilted as needed to capture images of the fetal abdomen. The ALARA MIs from these paired acquisitions are connected with a black line. On average, across all thirty-five subjects, the ALARA MI for the matched fetal abdomen acquisition is 0.13 ± 0.13 greater than for the placenta acquisition. Even when we compare placenta and fetal abdomen acquisitions with the same focal depths, the ALARA MI for the fetal abdomen acquisitions tend to be greater.
Figure 12.
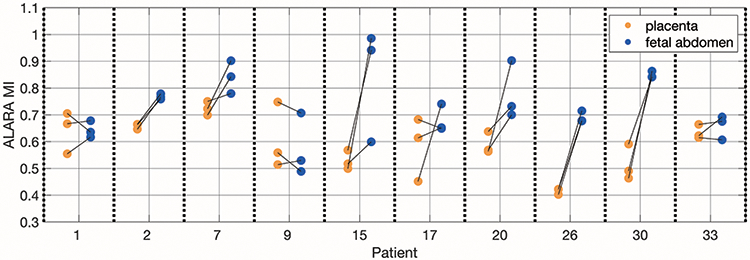
ALARA MI values from placenta and fetal abdomen acquisitions from ten subjects that show a range of ALARA MI values. The lines connecting the placenta acquisitions to the fetal abdomen acquisitions indicate that they came from approximately the same imaging window.
The ALARA MI values and the LOC values reached at the ALARA MI are shown as functions of the patients’ pre-pregnancy BMIs in figure 13. Patient BMI is not a strong predictor of the ALARA MI for that scan, but BMI is more closely correlated with the image quality achieved. The correlation coefficients for the ALARA MI and LOC data as functions of BMI are −0.18 and −0.64, respectively.
Figure 13.
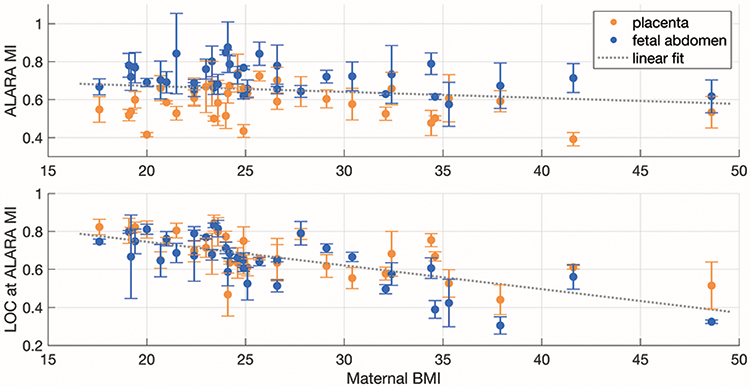
ALARA MI values (upper) and the LOC values reached (lower) as a function of pre-pregnancy BMI. The values are shown for images of the placenta and fetal abdomen as the mean across three acquisitions each with standard deviation error bars. A single linear fit was applied to placenta and fetal abdomen data sets.
DISCUSSION
These results suggest that LOC reflects the increase in fetal ultrasound image quality with increasing MI much like the other image metrics of contrast, CNR, and gCNR. As shown in the examples in figure 3, it often does so in a more stable and reliable way. An automated ALARA implementation based on LOC could help improve adherence to ultrasound safety guidelines and reduce unnecessary risks. Additionally, this technique could improve image quality and decrease the burden on sonographers.
Published studies have shown that a significant number of patients have inadequate image quality, leading to misdiagnoses or an inability to diagnose.48-50 This problem is exacerbated in overweight and obese patients and, in many circumstances, by inappropriate scanner settings or transducer selection.51 By monitoring image quality in real time, this technique would allow for increases in acoustic output when it might be diagnostically beneficial.
The ALARA MI values determined in this study were compared to the default second trimester exam MI of a clinical scanner (GE Voluson E8 with a C1-5-D transducer), which was 0.8. Compared to the ALARA MI values rounded to the nearest tenth, the default MI of 0.8 would represent more acoustic exposure than necessary for 80% of our pilot acquisitions and sub-optimal image quality for 4%. Based on research showing that the vast majority of ultrasound users do not know what MI is or use it during examinations,31-33,52 real-time, automatic updates of the acoustic output could help with the safety and quality of obstetric ultrasound examinations. In this study, MI was used as a measure of ultrasonic exposure, but other safety metrics, such as the Thermal Index (TI), could similarly be used with LOC measurements to calibrate the ultrasound system output. MI was used for the initial implementation because it is the more straightforward of the displayed safety indices to characterize and is a standardized way to compare transmit pressures across different ultrasound imaging platforms. It is not dependent on the pulse repetition frequency, so, unlike TI and ISPTA, it is the same when an imaging configuration is used for the non-scanning pilot pulses as it is for the slower frames of live scanning that follow. This adaptive imaging technique could also be extended to adjust other parameters, like transmit frequency, in response to image quality feedback.
The images in this study were from 35 subjects with a range of image quality (LOC of 0.27-0.89) and ALARA MI values (0.35-1.03). As seen in figure 8, there was not a strong correlation between the asymptotic LOC values and the ALARA MI values, which indicates that the amount of acoustic clutter does not predict the ALARA MI for that view. Additionally, as seen in figure 13, there is not a strong correlation between patient BMI and ALARA MI values.
For all of the 210 pilot acquisitions, the LOC v. MI data were successfully fit with an asymmetric sigmoid curve and an ALARA MI value was determined. For the full-frame acquisitions, 54% of data sets collected at swept MI values were analyzed. This significant decrease in yield for the full-frame acquisitions was due to the lower frame rate (14 frames per second compared to 70 for the pilot acquisition) and the need for a second region of interest for the comparison image quality metrics (contrast, CNR, and gCNR). The full frames represent our attempt to validate the method, not a component of the proposed system.
As shown in figure 4, the ALARA MI values suggested by LOC are generally lower than the ALARA MI suggested by contrast and higher than the ALARA MI values suggested by gCNR. It is not clear what metric best matches user experience. Future studies involving expert evaluation of images will be needed to elucidate this. The ALARA MI values suggested by LOC are most strongly correlated with the ALARA MI values suggested by gCNR. The weaker correlation with contrast and CNR could be due to their sensitivity to native contrast changes and the changes in ROI alignment during these relatively slow full-frame acquisitions. A limitation of the image quality metric comparison performed in this study is that regions of amniotic fluid and fetal or placental tissue were manually selected by a researcher. We do not believe that the region selection was biased, but that possibility exists and would affect the results from the full-frame acquisitions.
Many challenges remain in the real-time implementation of this method for imaging heterogeneous, moving fetal structures on a diagnostic scanner. Automatic gain or brightness compensation would need to be applied after each ALARA optimization and, before wide-spread implementation, the method would need to be fast enough to allow for frequent parameter adjustment so as to be functionally invisible to the sonographer. It is theoretically possible to implement this method, including collecting data at multiple MI values, calculating the ALARA MI, and switching to it, so that the automated ALARA process takes less than a tenth of a second. In addition to the impact on the ultrasound user, the speed of the automated ALARA implementation affects how well it achieves ALARA. As noted by a recent American Institute of Ultrasound in Medicine (AIUM) technical bulletin, time is an important component of acoustic exposure that is not captured by the output display metrics.7 Further, to avoid transmit voltage being set inappropriately high by the system, perhaps because of poor ROI selection, motion between frames, or some other factor, a conservative upper limit for MI could be set, as is currently done by ultrasound manufacturers to ensure that the MI used falls within FDA limits even though there are uncertainties in the acoustic output measurements and variability in manufacturing.19 Additionally, the automated system could evaluate the quality of the optimization. For example, it could ensure that the sigmoid fit has a high enough R2 before changing transmit voltages and if the voltage sweep suggests a new MI that is a substantial change from the previous setting, the optimization could be repeated. Finally, to be clinically relevant, this method must be translated to modern diagnostic scanners utilizing synthetic aperture beamforming and various Doppler modes.
As demonstrated by figures 11 and 12, though the ALARA MI determined from imaging the placenta sometimes aligns well with the ALARA MI determined from the fetal abdomen, it does not do so reliably enough to consider the placenta a good surrogate optimization target. We found that the fetal abdomen acquisitions generally had higher ALARA MI values than the placenta acquisitions. It is not clear what causes this difference, but it could be related to the greater heterogeneity of the fetal abdomen tissue. Some intrinsic variability is expected in the ALARA MI as a function of the tissue’s brightness, uniformity, and attenuation. This suggests that ALARA calibration should be performed often and on the structure that is being imaged, which further emphasizes the need for a fast implementation. Future work will address how to automatically determine where to send pilot pulses, rather than using a fixed ROI in the center of the image as was done in this study. Additionally, it may be possible to use less data without significant impact on the efficacy of the automated ALARA system. Based on images like the ones shown in figure 10, even small regions appear to be viable optimization targets. Sparser sampling of the data could be achieved both with regard to the number of frames (MI values) and the number of lines per frame used to compute the LOC. Even in this initial implementation, pilot data sweeping through 16 voltages were acquired in 0.23 seconds, including two repeats of each imaging line. With no repeats and fewer voltages, the data acquisition could be less than one-tenth of a second. Assuming manufacturer’s software and hardware are compatible, a fast GPU-based implementation of LOC calculations53 could allow this optimization to occur multiple times per minute without interrupting the clinical workflow. Future studies will further explore how to balance the benefits from frequent updates and the cost to frame rate.
In summary, we found that LOC can be used to determine an ALARA MI for ultrasound imaging for a particular patient and imaging window. LOC is well-suited to this task because it follows similar trends to contrast, CNR, and gCNR, but only requires one region of interest. LOC has less variability in vivo than CNR and contrast. LOC has a coefficient of variation that is close to that of gCNR, which is derived from two user-traced ROIs. Additionally, the ALARA MI values suggested by LOC and gCNR are well correlated. Updating the transmit voltage of ultrasound machines with real-time image quality feedback from LOC could automate the ALARA principle for obstetric ultrasound and remove some of the user-dependence of ultrasound safety.
ACKNOWLEDGEMENTS
The authors would like to thank K. Offerdahl for assisting with data collection and W. Long for providing helpful suggestions. This research is supported by the National Institute for Biomedical Imaging and Bioengineering through grants R01EB017711 and R01EB026574 and the National Science Foundation Graduate Research Fellowship Program under grant DGE1644868. Any opinions, findings, and conclusions or recommendations expressed in this material are those of the authors and do not necessarily reflect the views of the National Institutes of Health or the National Science Foundation.
BIBLIOGRAPHY
- 1.Office of the Federal Register, Government Publishing Office. Electronic Code of Federal Regulations: Title 10, Chapter 1, Part 20. https://www.ecfr.gov/cgi-bin/text-idx?SID=1787f54e079968aee24205c6146340c9&mc=true&node=pt10.1.20&rgn=div5. Accessed May 27, 2020. [Google Scholar]
- 2.US Food and Drug Administration. Marketing clearance of diagnostic ultrasound systems and transducers: Guidance for industry and Food and Drug Administration staff. Rockville, MD: Center for Devices and Radiological Health, Food and Drug Administration, US Department of Health and Human Services; 2019. https://www.fda.gov/media/71100/download. Published June 27, 2019. Accessed April 14, 2020. [Google Scholar]
- 3.US Food and Drug Administration. 510 (k) Guide for measuring and reporting acoustic output of diagnostic ultrasound medical devices. Washington, DC: Food and Drug Administration, Department of Health and Human Services; 1985. [Google Scholar]
- 4.O’Brien WD, Abbott JG, Stratmeyer ME, et al. Acoustic output upper limits proposition: Should upper limits be retained? J Ultrasound Med. 2002;21(12):1335–1341. doi: 10.7863/jum.2002.21.12.1335. [DOI] [PubMed] [Google Scholar]
- 5.Nelson TR, Fowlkes JB, Abramowicz JS, Church CC. Ultrasound biosafety considerations for the practicing sonographer and sonologist. J Ultrasound Med. 2009;28(2):139–150. doi: 10.7863/jum.2009.28.2.139. [DOI] [PubMed] [Google Scholar]
- 6.US Food and Drug Administration. Revised 510 (k) diagnostic ultrasound guidance for 1993. Rockville, MD: Center for Devices and Radiological Health, Food and Drug Administration, US Department of Health and Human Services; 1993. [Google Scholar]
- 7.American Institute of Ultrasound in Medicine. How to interpret the ultrasound output display standard for diagnostic ultrasound devices: Version 3. J Ultrasound Med. 2019;38(12):3101–3105. doi: 10.1002/jum.15159. [DOI] [PubMed] [Google Scholar]
- 8.Apfel RE, Holland CK. Gauging the likelihood of cavitation from short-pulse low-duty cycle diagnostic ultrasound. Ultrasound Med Biol. 1991;17(2):179–185. doi: 10.1016/0301-5629(91)90125-G. [DOI] [PubMed] [Google Scholar]
- 9.Flynn HG. Generation of transient cavities in liquids by microsecond pulses of ultrasound. J Acoust Soc Am. 1982;72(6):1926–1932. doi: 10.1121/1.388622. [DOI] [Google Scholar]
- 10.Carmichael AJ, Mossoba MM, Riesz P, Christman CL. Free radical production in aqueous solutions exposed to simulated ultrasonic diagnostic conditions. IEEE Trans Ultrason Ferroelectr Freq Control. 1986;33(2):148–155. doi: 10.1109/T-UFFC.1986.26807. [DOI] [PubMed] [Google Scholar]
- 11.Crum LA, Fowlkes JB. Acoustic cavitation generated by microsecond pulses of ultrasound. Nature. 1986;319(6048):52–54. doi: 10.1038/319052a0. [DOI] [Google Scholar]
- 12.International Electrotechnical Commission. IEC 62359: Ultrasonics – Field characterization – Test methods for the determination of thermal and mechanical indices related to medical diagnostic ultrasonic fields. 2.1 ed. Geneva, Switzerland: International Electrotechnical Commission; 2017. [Google Scholar]
- 13.Nyborg WL. Biological effects of ultrasound: development of safety guidelines: Part I: personal histories. Ultrasound Med Biol. 2000;26(6):911–964. doi: 10.1016/S0301-5629(00)00243-X. [DOI] [PubMed] [Google Scholar]
- 14.Committee on Obstetric Practice. Committee opinion No. 723: Guidelines for diagnostic imaging during pregnancy and lactation. Obstet Gynecol. 2017;130(4):e210–e216. doi: 10.1097/AOG.0000000000002355. [DOI] [PubMed] [Google Scholar]
- 15.Wieseler KM, Bhargava P, Kanal KM, Vaidya S, Stewart BK, Dighe MK. Imaging in pregnant patients: examination appropriateness. Radiographics. 2010;30(5):1215–1229. doi: 10.1148/rg.305105034. [DOI] [PubMed] [Google Scholar]
- 16.O’Keeffe DF, Abuhamad A. Obstetric ultrasound utilization in the United States: data from various health plans. Semin Perinatol. 2013;37(5):292–294. doi: 10.1053/j.semperi.2013.06.003. [DOI] [PubMed] [Google Scholar]
- 17.Torloni MR, Vedmedovska N, Merialdi M, et al. Safety of ultrasonography in pregnancy: WHO systematic review of the literature and meta-analysis. Ultrasound Obstet Gynecol. 2009;33(5):599–608. doi: 10.1002/uog.6328. [DOI] [PubMed] [Google Scholar]
- 18.Stratmeyer ME, Greenleaf JF, Dalecki D, Salvesen KA. Fetal ultrasound: mechanical effects. J Ultrasound Med. 2008;27(4):597–605. doi: 10.7863/jum.2008.27.4.597. [DOI] [PubMed] [Google Scholar]
- 19.Martin K. The acoustic safety of new ultrasound technologies. Ultrasound. 2010;18(3):110–118. doi: 10.1258/ult.2010.010024. [DOI] [Google Scholar]
- 20.Suresh R, Ramesh Rao T, Davis EM, Ovchinnikov N, Mc Rae A. Effect of diagnostic ultrasound during the fetal period on learning and memory in mice. Ann Anat. 2008;190(1):37–45. doi: 10.1016/j.aanat.2007.04.008. [DOI] [PubMed] [Google Scholar]
- 21.Hocevar Z, Rozman J, Paska AV, Frangez R, Vaupotic T, Hudler P. Gene expression profiling of rat fetuses exposed to 2-dimensional ultrasound. J Ultrasound Med. 2012;31(6):923–932. doi: 10.7863/jum.2012.31.6.923. [DOI] [PubMed] [Google Scholar]
- 22.Deng Y, Palmeri ML, Rouze NC, Trahey GE, Haystead CM, Nightingale KR. Quantifying image quality improvement using elevated acoustic output in B-mode harmonic imaging. Ultrasound Med Biol. 2017;43(10):2416–2425. doi: 10.1016/j.ultrasmedbio.2017.06.024. [DOI] [PMC free article] [PubMed] [Google Scholar]
- 23.Christopher T. Finite amplitude distortion-based inhomogeneous pulse echo ultrasonic imaging. IEEE Trans Ultrason Ferroelectr Freq Control. 1997;44(1):125–139. doi: 10.1109/58.585208. [DOI] [PubMed] [Google Scholar]
- 24.Desser TS, Jeffrey RB. Tissue harmonic imaging techniques: physical principles and clinical applications. Semin Ultrasound CT MR. 2001;22(1):1–10. doi: 10.1016/S0887-2171(01)90014-9. [DOI] [PubMed] [Google Scholar]
- 25.Kovalchin JP, Lewin MB, Bezold LI, Altman CA, Ayres NA. Harmonic imaging in fetal echocardiography. J Am Soc Echocardiogr. 2001;14(10):1025–1029. doi: 10.1067/mje.2001.112893. [DOI] [PubMed] [Google Scholar]
- 26.Maxwell C, Glanc P. Imaging and obesity: a perspective during pregnancy. Am J Roentgenol. 2011;196(2):311–319. doi: 10.2214/AJR.10.5849. [DOI] [PubMed] [Google Scholar]
- 27.International Electrotechnical Commission. IEC 60601-2-37: Medical electrical equipment – Part 2-37: Particular requirements for the basic safety and essential performance of ultrasonic medical diagnostic and monitoring equipment. 2.1 ed. Geneva, Switzerland: International Electrotechnical Commission; 2015. [Google Scholar]
- 28.AIUM Clinical Standards Committee. AIUM-ACR-ACOG-SMFM-SRU practice parameter for the performance of standard diagnostic obstetric ultrasound examinations. J Ultrasound Med. 2018;37(11):E13–E24. doi: 10.1002/jum.14831. [DOI] [PubMed] [Google Scholar]
- 29.Bly S, Van den Hof MC, Lewthwaite B, Gagnon R, Morin L, Salem S. Obstetric ultrasound biological effects and safety. J Obstet Gynaecol Canada. 2005;27(6):572–575. doi: 10.1016/S1701-2163(16)30716-2. [DOI] [PubMed] [Google Scholar]
- 30.Safety Group of BMUS. Guidelines for the safe use of diagnostic ultrasound equipment. Ultrasound. 2010;18(2):52–59. doi: 10.1258/ult.2010.100003. [DOI] [Google Scholar]
- 31.Sheiner E, Shoham-Vardi I, Abramowicz JS. What do clinical users know regarding safety of ultrasound during pregnancy? J Ultrasound Med. 2007;26(3):319–325. doi: 10.7863/jum.2007.26.3.319. [DOI] [PubMed] [Google Scholar]
- 32.Houston LE, Allsworth J, Macones GA. Ultrasound is safe… right? Resident and maternal-fetal medicine fellow knowledge regarding obstetric ultrasound safety. J Ultrasound Med. 2011;30(1):21–27. doi: 10.7863/jum.2011.30.1.21. [DOI] [PubMed] [Google Scholar]
- 33.Drukker L, Droste R, Chatelain P, Noble JA, Papageorghiou AT. Safety indices of ultrasound: adherence to recommendations and awareness during routine obstetric ultrasound scanning. Ultraschall der Medizin - Eur J Ultrasound. 2020;41(02):138–145. doi: 10.1055/a-1074-0722. [DOI] [PubMed] [Google Scholar]
- 34.Rodriguez-Molares A, Rindal OMH, D’hooge J, et al. The generalized contrast-to-noise ratio: a formal definition for lesion detectability. IEEE Trans Ultrason Ferroelectr Freq Control. 2020;67(4):745–759. doi: 10.1109/TUFFC.2019.2956855. [DOI] [PMC free article] [PubMed] [Google Scholar]
- 35.Long W, Bottenus N, Trahey GE. Lag-one coherence as a metric for ultrasonic image quality. IEEE Trans Ultrason Ferroelectr Freq Control. 2018;65(10):1768–1780. doi: 10.1109/TUFFC.2018.2855653. [DOI] [PMC free article] [PubMed] [Google Scholar]
- 36.Flint K, Bottenus N, Long W, et al. Implementation and clinical evaluation of a fetal ALARA ultrasound system. In: 2018 IEEE International Ultrasonics Symposium (IUS). Institute of Electrical and Electronics Engineers (IEEE); 2018. doi: 10.1109/ULTSYM.2018.8579734. [DOI] [Google Scholar]
- 37.International Electrotechnical Commission. IEC 62127-1: Ultrasonics – Hydrophones – Part 1: Measurement and characterization of medical ultrasonic fields up to 40 MHz. 1.1 ed. Geneva, Switzerland: International Electrotechnical Commission; 2013. [Google Scholar]
- 38.Pinton G, Trahey G, Dahl J. Spatial coherence in human tissue: implications for imaging and measurement. IEEE Trans Ultrason Ferroelectr Freq Control. 2014;61(12):1976–1987. doi: 10.1109/TUFFC.2014.006362. [DOI] [PMC free article] [PubMed] [Google Scholar]
- 39.Walker WF, Trahey GE. Speckle coherence and implications for adaptive imaging. J Acoust Soc Am. 1997;101(4):1847–1858. doi: 10.1121/1.418235. [DOI] [PubMed] [Google Scholar]
- 40.Bottenus NB, Trahey GE. Equivalence of time and aperture domain additive noise in ultrasound coherence. J Acoust Soc Am. 2015;137(1):132–138. doi: 10.1121/1.4904530. [DOI] [PMC free article] [PubMed] [Google Scholar]
- 41.Mallart R, Fink M. The van Cittert–Zernike theorem in pulse echo measurements. J Acoust Soc Am. 1991;90(5):2718–2727. doi: 10.1121/1.401867. [DOI] [Google Scholar]
- 42.Smith SW, Lopez H, Bodine WJ. Frequency independent ultrasound contrast-detail analysis. Ultrasound Med Biol. 1985;11(3):467–477. doi: 10.1016/0301-5629(85)90158-9. [DOI] [PubMed] [Google Scholar]
- 43.Smith SW, Wagner RF, Sandrik JM, Lopez H. Low contrast detectability and contrast/detail analysis in medical ultrasound. IEEE Trans Sonics Ultrason. 1983;30(3):164–173. doi: 10.1109/T-SU.1983.31405. [DOI] [Google Scholar]
- 44.Patterson MS, Foster FS. The improvement and quantitative assessment of B-mode images produced by an annular array/cone hybrid. Ultrason Imaging. 1983;5(3):195–213. doi: 10.1177/016173468300500301. [DOI] [PubMed] [Google Scholar]
- 45.Ricketts JH, Head GA. A five-parameter logistic equation for investigating asymmetry of curvature in baroreflex studies. Am J Physiol Integr Comp Physiol. 1999;277(2):R441–R454. doi: 10.1152/ajpregu.1999.277.2.R441. [DOI] [PubMed] [Google Scholar]
- 46.Corey DM, Dunlap WP, Burke MJ. Averaging correlations: expected values and bias in combined Pearson rs and Fisher’s z transformations. J Gen Psychol. 1998;125(3):245–261. doi: 10.1080/00221309809595548. [DOI] [Google Scholar]
- 47.Bottenus N, Üstüner KF. Acoustic reciprocity of spatial coherence in ultrasound imaging. IEEE Trans Ultrason Ferroelectr Freq Control. 2015;62(5):852–861. doi: 10.1109/TUFFC.2014.006928. [DOI] [PMC free article] [PubMed] [Google Scholar]
- 48.Grandjean H, Larroque D, Levi S. The performance of routine ultrasonographic screening of pregnancies in the Eurofetus Study. Am J Obstet Gynecol. 1999;181(2):446–454. doi: 10.1016/S0002-9378(99)70577-6. [DOI] [PubMed] [Google Scholar]
- 49.Hendler I, Blackwell SC, Bujold E, et al. Suboptimal second-trimester ultrasonographic visualization of the fetal heart in obese women: should we repeat the examination. J Ultrasound Med. 2005;24(9):1205–1209. doi: 10.7863/jum.2005.24.9.1205. [DOI] [PubMed] [Google Scholar]
- 50.Fuchs F, Houllier M, Voulgaropoulos A, et al. Factors affecting feasibility and quality of second-trimester ultrasound scans in obese pregnant women. Ultrasound Obstet Gynecol. 2013;41(1):40–46. doi: 10.1002/uog.12311. [DOI] [PubMed] [Google Scholar]
- 51.Baker JA, Scott Soo M. Breast US: assessment of technical quality and image interpretation. Radiology. 2002;223(1):229–238. doi: 10.1148/radiol.2231011125. [DOI] [PubMed] [Google Scholar]
- 52.Bagley J, Thomas K, Digiacinto D. Safety practices of sonographers and their knowledge of the biologic effects of sonography. J Diagnostic Med Sonogr. 2011;27(6):252–261. doi: 10.1177/8756479311424431. [DOI] [Google Scholar]
- 53.Hyun D, Trahey GE, Dahl JJ. Real-time high-framerate in vivo cardiac SLSC imaging with a GPU-based beamformer. In: 2015 IEEE International Ultrasonics Symposium (IUS). Institute of Electrical and Electronics Engineers (IEEE); 2015:1–4. doi: 10.1109/ULTSYM.2015.0077. [DOI] [Google Scholar]


