Clark, A. P. , Wei, S. , Kalola, D. , Krogh‐Madsen, T. , & Christini, D. J. (2022). An in silico–in vitro pipeline for drug cardiotoxicity screening identifies ionic pro‐arrhythmia mechanisms. British Journal of Pharmacology, 179(20), 4829–4843. 10.1111/bph.15915
There has been a discrepancy between the methods reported in the above manuscript and the actual experimental implementation. The text below (1) details this discrepancy and (2) demonstrates that this discrepancy would not impact the manuscript conclusions.
The authors discovered that the Ishihara IK1 dynamic clamp module used has an incorrect formulation. The module used in the paper was missing three sets of parentheses within the alpha and beta equations of the model in Table 1.
TABLE 1.
The correct Ishihara model
|
IK1 = GK1 · (V − EK) · (phi·fO·y1 + [1 − phi] · y2) GK1 = 2.5 · ([K+]o/5.4)0.4 High‐affinity channel α = 0.17·exp(−0.07 · ((V − EK) + 8·[Mg2+]i)) / (1 + 0.01·exp(0.12 · ( (V − EK) + 8·[Mg2+]i) ) ) β = [SPM]i·280·exp(0.15 · ( (V − EK) + 8·[Mg2+]i) ) / (1 + 0.01·exp(0.13 · ( (V − EK) + 8·[Mg2+]i) ) ) KdMg = 0.45·exp(−(V − EK) /20) fO = 1/ (1 + [Mg2+]i/KdMg) dy1/dt = α · (1 − y1) – β · (fO)3 · y1 Low‐affinity channel KdSPM_L = 0.04·exp(−(V − EK) /9.1) y2 = 1/ (1 + [SPM]i/KdSPM_L) |
Note: The bolded red parentheses were incorrectly omitted from the dynamic clamp implementation.
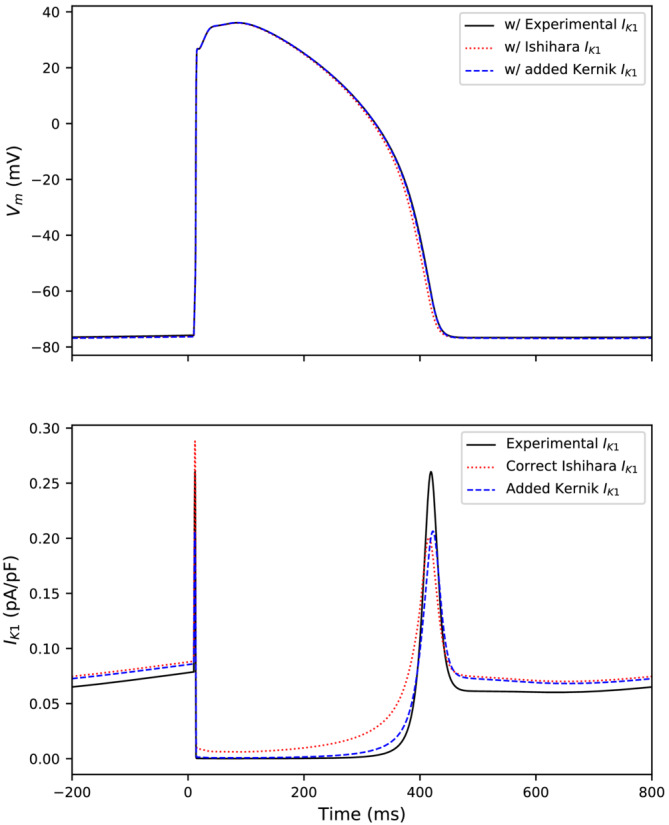
Figure 2 displays the effect of the difference between the implementation in the manuscript and the correct Ishihara implementation. The main difference is that the correct Ishihara implementation (red, dotted) conducts a small outward current over the duration of the action potential, while the formulation used in the experiment (black, solid) does not. The formulation used in the experiment (black) was more like the baseline Kernik–Clancy IK1 current (blue dashed).
FIGURE 2.

Top: Action potentials with IK1 current increased until spontaneous behavior stopped and then paced at 1 Hz. Action potentials from the Kernik–Clancy model with the incorrect dynamically clamped IK1 used in our experiments (black, solid), the correct Ishihara IK1 (red, dotted), and the baseline Kernik‐Clancy model with increased IK1 (blue, dashed). Bottom: The IK1 for each of these models
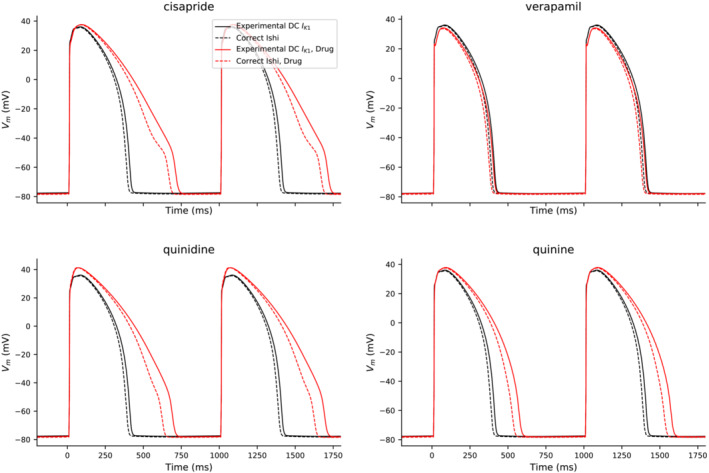
The authors have also simulated Kernik–Clancy drug block experiments with the correct and incorrect IK1 formulations (Figure 3). These experiments show similar results for both formulations.
FIGURE 3.

Effect of each drug (cisapride, verapamil, quinidine, and quinine) on the Kernik–Clancy AP with either the correct (dashed) or incorrect (solid) Ishihara IK1 formulation
The discrepancy between author's implementation and the correct Ishihara model has no effect on the conclusions of this manuscript: An IK1 dynamic clamp was still applied but produced IK1 more like that of the Kernik–Clancy than Ishihara model. With this incorrect formulation, the authors were still able to maintain a resting membrane potential for the iPSC‐CMs during their dynamic clamp experiments, which allowed authors to pace them at 1 Hz and detect AP prolongation in their treatment group. Ultimately, one would have to implement this incorrect formulation of the Ishihara model to fully reproduce the results, but the authors would suggest applying the Ishihara model as originally described in future studies.
The authors apologize for these errors.


