

Si Fang, Kaitlin H. Wade, David A. Hughes, Sophie Fitzgibbon, Vikki Yip, Nicholas J. Timpson, Laura J. Corbin
In the above article [1], Figure 2 was incorrect. The correct figure is below. The publisher regrets this error.
FIGURE 2.
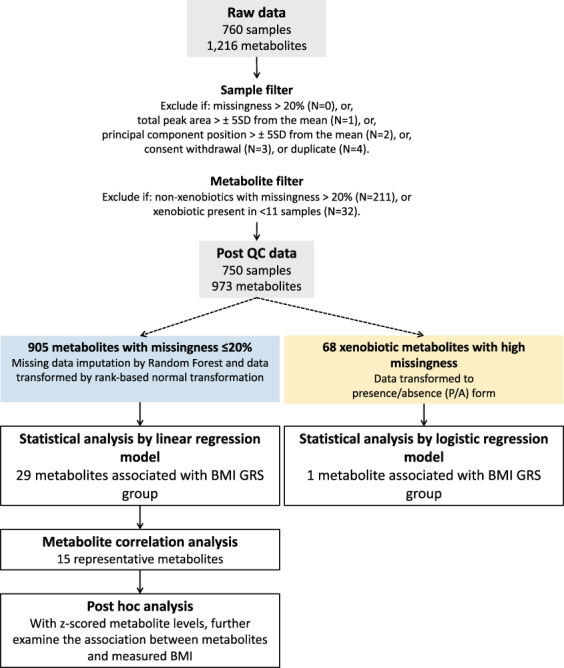
Overview of statistical analysis. “Raw data” is the original scale data normalized in terms of raw area counts (as supplied by Metabolon). Data were prepared for statistical analysis by first filtering samples and metabolites based on a series of quality metrics and then applying imputation and rescaling procedures as appropriate. GRS, genetic risk score; QC, quality control [Color figure can be viewed at wileyonlinelibrary.com]
REFERENCE
- 1. Fang S, Wade KH, Hughes DA, et al. A multivariant recall‐by‐genotype study of the metabolomic signature of BMI. Obesity (Silver Spring). 2022;30:1298‐1310. [DOI] [PMC free article] [PubMed] [Google Scholar]