

Abstract
Background:
An understudied variant of Alzheimer’s disease (AD), the behavioral/dysexecutive variant of AD (bvAD), is associated with progressive personality, behavior, and/or executive dysfunction and frontal atrophy.
Objective:
This study characterizes the neuropsychological and neuroanatomical features associated with bvAD by comparing it to behavioral variant frontotemporal dementia (bvFTD), amnestic AD (aAD), and subjects with normal cognition.
Methods:
Subjects included 16 bvAD, 67 bvFTD, 18 aAD patients, and 26 healthy controls. Neuropsychological assessment and MRI data were compared between these groups.
Results:
Compared to bvFTD, bvAD showed more significant visuospatial impairments (Rey Figure copy and recall), more irritability (Neuropsychological Inventory), and equivalent verbal memory (Philadelphia Verbal Learning Test). Compared to aAD, bvAD indicated more executive dysfunction (F-letter fluency) and better visuospatial performance. Neuroimaging analysis found that bvAD showed cortical thinning relative to bvFTD posteriorly in left temporal-occipital regions; bvFTD had cortical thinning relative to bvAD in left inferior frontal cortex. bvAD had cortical thinning relative to aAD in prefrontal and anterior temporal regions. All patient groups had lower volumes than controls in both anterior and posterior hippocampus. However, bvAD patients had higher average volume than aAD patients in posterior hippocampus and higher volume than bvFTD patients in anterior hippocampus after adjustment for age and intracranial volume.
Conclusion:
Findings demonstrated that underlying pathology mediates disease presentation in bvAD and bvFTD.
Keywords: Alzheimer’s disease, behavioral, behavioral variant frontotemporal dementia, cognitive domains, cortical thinning, frontal variant, fvAD, hippocampal volumes, neuropsychiatric symptoms
INTRODUCTION
Alzheimer’s disease (AD) is defined pathologically by the presence of amyloid plaques and neurofibrillary tangles in the brain, which can be detected at autopsy [1, 2]. This AD pathology can result in different types of clinical presentations in patients—a phenomenon known as phenotypic heterogeneity. The most common clinical phenotype of AD is amnestic (aAD) with deficits in episodic memory, executive functioning, lexical retrieval, and visuospatial function, linked to initial atrophy in medial temporal and parietal lobes that ultimately spreads to neocortical association cortices in lateral temporal, parietal and prefrontal regions [3, 4]. A rare presentation of AD, however, involves personality and/or executive deficits associated with frontal lobe atrophy, and comparatively spared memory in the beginning of disease course [5–9]. Also known as frontal variant AD [10–12], this behavioral/dysexecutive variant of AD (bvAD) is difficult to differentiate from behavioral variant frontotemporal dementia (bvFTD) because the two are phenotypically similar despite their distinct underlying pathologies—a phenomenon known as clinical-anatomical convergence [10, 13, 14]. bvFTD is characterized by progressive deterioration of personality, behavior, social comportment, and executive functioning, related to frontal and anterior temporal lobe atrophy [15]. Although bvFTD is due to frontotemporal lobar degeneration (FTLD) spectrum pathology associated with misfolded tau or TDP-43 [16, 17], up to 25% of patients with a clinical diagnosis of bvFTD are found to have AD pathology at autopsy [18, 19]. Due to its rarity and clinical overlap with bvFTD, bvAD is difficult to detect and is consequently a poorly defined syndrome that has been understudied. Developing accurate and non-invasive methods of identifying bvAD will likely have significant implications for prognosis, caregiver burden, and early intervention [20–24], and may help the advancement of specialized treatments [16, 25].
To date, only a few studies have directly compared the clinical characteristics of bvAD and bvFTD with some mixed conclusions [9, 26–28]. Differences in findings may be explained by differences in study methods (e.g., assessments administered), but also by the challenges specific to the clinical population. First, it is a rare condition, resulting in relatively small research sample sizes that may account for discrepant findings. Second, there is no consensus on the definition of bvAD, and previous studies of bvAD have included patients with traumatic brain injury (TBI) [9], with known co-pathologies [27], or who did not meet bvFTD criteria [9, 26].
On comparisons of neuropsychological tests of executive function, two studies found no differences between bvFTD and a behavioral [28] or dysexecutive [26] AD group, while another found that patients with bvAD performed worse than bvFTD on composite scores of executive function [9]. Another study found that executive performance depended on the task: bvAD patients performed worse than (Trails, Stroop inhibition, design fluency), better than (repetitions in design fluency task), or the same as (D-words, rule violations in design fluency task) bvFTD patients [27]. In terms of visuospatial function and memory, two studies found comparable figure copy and recall performance between behavioral variant groups [26, 28], while two found worse visual memory in bvAD [9, 27]. Three past studies also found no differences between bvAD and bvFTD in tests of verbal memory [26–28] but another study reported worse verbal memory in bvAD [9]. Findings for neuropsychiatric impairments in bvAD have been quite varied as well. In bvAD, some researchers observed more delusions and agitation [28, 29], hallucinations [29], irritability, sensitivity, and emotional lability [12], or depression [27], while others found that bvFTD showed more agitation, anxiety and irritability [9] or apathy, aggression, and lack of insight [27].
In terms of neuroimaging, prior findings have found that bvAD had more occipital, posterior temporal, and parietal lobe atrophy than bvFTD and that bvFTD had more frontal and anterior temporal lobe atrophy than bvAD [9, 26, 27, 30]. One study limited its analysis to prefrontal and medial temporal regions and found that bvFTD patients had more frontal and temporal atrophy than bvAD [26]. There were no areas where bvAD had more atrophy than bvFTD [26]. Comparing bvAD and aAD, they found no areas where aAD had greater atrophy and found more frontal lobe atrophy in bvAD [26]. Researchers in another group observed that bvAD showed a predominantly temporoparietal pattern of atrophy similar to aAD, with additional deterioration in the left orbitofrontal cortex, frontal poles and middle and superior frontal gyri [9]. They also found that bvAD showed less frontal lobe involvement than bvFTD and suggested that bvAD has a more posterior distribution of atrophy than bvFTD [9]. While previous research suggests overall relative sparing of anterior brain areas in bvAD compared to bvFTD, there has been less exploration of specifically anterior versus posterior hippocampus across bvAD, bvFTD, and aAD groups. One study found more posterior hippocampal atrophy in aAD and more anterior hippocampal atrophy in bvFTD [31].
The goal of this study was to build on past work examining the distinct clinical features involved in bvAD by comparing it to other conditions. We first compared the neuropsychological and neuroanatomical profiles associated with bvAD and bvFTD, two clinical syndromes that are similar but that are the result of different diseases (e.g., clinical-anatomical convergence). Second, we aimed to examine differences across bvAD and aAD, distinct phenotypes that arise from the same pathology (e.g., phenotypic heterogeneity). Lastly, we included healthy controls as a reference group in our study. We restricted our bvAD group to patients who met clinical bvFTD criteria [15], and who had likely or known AD pathology based on cerebrospinal fluid (CSF) biomarkers or autopsy assessment. To outline a differential profile of bvAD, we tested cognitive, affective, and neuroimaging measures—including neocortical and hippocampal analyses—in bvAD compared to bvFTD, aAD, and healthy controls.
Based on previous findings, we anticipated that bvAD patients would have a partially unique neuropsychological profile, with significant dysexecutive impairment as seen in bvFTD, combined with moderate visuospatial impairment and relatively mild impairment on memory compared to aAD [9, 26–28]. For psychiatric and social domains, we expected bvAD to have more signs of anxiety and emotional lability, and bvFTD to have more social symptoms, such as apathy and disinhibition [32]. As seen in previous neuroimaging comparisons, we hypothesized that bvAD patients would show more posterior neocortical atrophy, such as in the temporal and inferior parietal lobes, and medial temporal lobe atrophy, compared to more frontal and anterior temporal atrophy in bvFTD [9, 32–34]. Between bvAD and aAD, we expected more frontal atrophy in bvAD [9, 26] and more medial temporal atrophy in aAD [33].
METHODS
Participant selection
We searched the Integrated Neurodegenerative Disease Database [35] for participants who had neuropsychological, magnetic resonance imaging (MRI), and CSF and/or autopsy data. Clinical diagnoses of participants were based on the consensus of a multidisciplinary team using medical history, neurologic examination, and a mental status evaluation. Exclusion criteria included English as a second language and concurrent medical, psychiatric, or neurological (e.g., head trauma, stroke, hydrocephalus) conditions that could alter cognition, behavior, or brain integrity.
Cerebrospinal fluid
Lumbar punctures were performed as previously described [36]. CSF was collected, aliquoted, and frozen at −80°C within an hour. Samples were assayed via Luminex or ELISA for Aß42 and t-tau levels [13]. Seventy subjects had CSF but no autopsy data; of these, 65 had Luminex values, and 5 had ELISA values that were transformed to Luminex equivalents, using an autopsy-confirmed formula [13].
Participant groups
Ninety-six individuals met clinical diagnostic criteria for bvFTD [15], and were divided into bvAD and bvFTD groups. From these subjects, we excluded six who showed mixed AD and FTLD pathology at autopsy, two with secondary or tertiary Lewy body pathology at autopsy, and five with a concurrent diagnosis of amyotrophic lateral sclerosis or corticobasal degeneration. Of the remaining 83 subjects, 21 met definite bvFTD criteria, 38 met probable criteria, and 24 met possible criteria for bvFTD.
Those with AD or FTLD pathology were classified as bvAD or bvFTD, respectively, based on results from autopsy (performed as previously described [19]; n = 13) if available, or based on CSF t-tau/Aβ42 ratio (n = 70). Using a pre-defined CSF t-tau/Aβ42 cut-off [13], individuals with a ratio > 0.34 were classified as bvAD, and those with a ratio < 0.34 were classified as bvFTD. Our final cohort included 16 bvAD and 67 bvFTD participants. As is common in bvFTD [37, 38], three bvAD and seven bvFTD patients had a secondary clinical diagnosis of semantic variant primary progressive aphasia (svPPA). All patients with aAD met the pre-defined CSF threshold (t-tau/Aβ42 ratio > 0.34) [13], confirming likely AD pathology.
In addition, bvAD patients were compared to patients with typical aAD (n = 18) and elderly healthy controls (n = 26) that had no self-reported known neurological or psychiatric disorders. Mini-Mental Status Examination (MMSE) scores, used as a proxy for disease severity, were above 15 for aAD and 27 for healthy control participants.
Neuropsychological assessments
Subsets of neuropsychological data available for each patient were used to profile multiple cognitive and behavioral domains associated with bvFTD: attention and executive function, verbal memory, visuospatial skills and memory, and psychiatric and social symptoms. The first cognitive domain assessed attention and executive function. Forward digit span, requiring repetition of a sequence of digits, measured immediate attention [39]. Executive function was measured with backward digit span, requiring repetition of digit spans in the reverse order (working memory), and number of F-words named in one minute (fluency and inhibition) [40]. Second, the Philadelphia Verbal Learning Test (PVLT) [41] measured verbal memory and recognition by testing subjects’ ability to learn and remember a list of nine words on multiple trials. The long delay recall score represents the number of words retained and correctly recalled after a 10–15-minute delay. The recognition score was the number of correct words recognized from a list of 9 target words and 27 lures. Third, patients were asked to copy and recall the Rey Figure [42, 43], a task involving visuoperceptual, visuoconstructional, and visual memory functions [44, 45]. Finally, we used the Neuropsychiatric Inventory (NPI), an informant-based interview, to evaluate psychiatric and social symptoms [46, 47]. NPI data in the current study combined scores from the NPI and a brief questionnaire form of the NPI (NPI-Q) to measure the presence of 12 symptoms: delusions, hallucinations, agitation/aggression, depression/dysphoria, anxiety, elation/euphoria, apathy/indifference, disinhibition, irritability/emotional lability, motor disturbance (i.e., repetitive movements/activities), nighttime behaviors (i.e., sleep disturbance), and changes in appetite/eating. We compared differences in the presence of NPI symptoms between groups, as well as the total NPI score. While no NPI data were available for controls, the presence of a symptom indicates a deviation from the norm.
Statistical analyses for neuropsychological assessments
Kruskal-Wallis tests performed non-parametric comparisons across groups for age at onset (age at earliest reported symptom), age at test, disease duration (interval from onset to test), and MMSE score.
Neuropsychological data were not normally distributed according to Shapiro-Wilks tests (all p < 0.05). We performed non-parametric comparisons by rank-transforming continuous neuropsychological data among the four groups [48]. One-way analysis of covariance (ANCOVA) tested differences across groups for each rank-transformed cognitive measure. Logistic regressions evaluated the presence or absence of each behavioral disturbance (NPI) in bvAD compared to aAD and bvFTD. To account for effects of age and disease severity, ANCOVAs and logistic regressions included age at test and MMSE score as covariates. We report results from models that included covariates. Because we are evaluating a rare population, we used the liberal detection threshold of α = 0.05 two-tailed for all tests.
Neuroimaging methods
A large subset of bvAD and bvFTD patients (n = 80) had MRI scans within a year of neuropsychological data and/or CSF. Participants completed an axial T1-weighted magnetization-prepared rapid gradient echo (MPRAGE) scan acquired at the Hospital of the University of Pennsylvania on a Siemens 3.0 Tesla scanner with an eight-channel coil using the following parameters: repetition time (TR) = 1,620 ms; echo time (TE) = 3 ms; flip angle =15°; matrix size = 192 × 256; in-plane resolution = 0.9766 mm × 0.9766 mm; and slice thickness = 1 mm. Images were visually inspected, and scans with head motion or other artifacts were excluded. For analysis of whole-brain cortical thickness, image processing was performed with the Advanced Normalization Tools (ANTs) [49, 50] software package. All images were intensity-normalized [51] and spatially normalized to a custom template derived from healthy controls scans from the Open Access Series of Imaging Studies (OASIS) dataset [52] using a symmetric diffeomorphic algorithm [53, 54]. Priors from the template image were used to segment each brain into cortical grey matter, subcortical grey matter, deep white matter, CSF, brainstem, and cerebellum; cortical thickness was then estimated on the basis of this tissue segmentation [50]. Voxelwise group analyses were performed by warping cortical thickness images to the template, spatially smoothing them with a Gaussian kernel of 4 mm full-width half-maximum, and downsampling them to 2 mm isotropic voxels. Because hippocampal grey matter is not well-segmented using standard pipelines for cortical thickness estimation [55–57], we used a segmentation algorithm [58, 59] based on the Automated Segmentation of Hippocampal Subfields (ASHS) method [60] to estimate hippocampal volume from participants’ T1-weighted MRIs. This algorithm uses priors defined from expert manual segmentations to divide the medial temporal lobe in each hemisphere into the anterior and posterior hippocampus, adjacent cortical areas, the collateral and occipitotemporal sulci, and meninges. Two raters (JSP and NGK) visually confirmed segmentation quality by overlaying the ASHS and ANTs segmentations on each participant’s T1-weighted image; mislabeling of ventricular CSF as hippocampus was found in ten images and corrected by manually editing hippocampal segmentations.
Voxelwise differences in cortical thickness were evaluated by two-sample unpaired t-tests between groups, covarying for age, sex, and MMSE score. Statistical significance was assessed non-parametrically using FSL’s randomise for each contrast, based on 5,000 permutations of the input data [61]. Cortical thickness in the bvAD, bvFTD, and aAD groups was assessed relative to controls at a significance level of p < 0.05, after application of FSL’s threshold-free cluster enhancement (TFCE) algorithm [62] and family-wise error correction for multiple comparisons. In a direct contrast of the bvAD and bvFTD groups, no results were observed after multiple comparisons correction; exploratory results are presented at an uncorrected threshold of p < 0.001 without TFCE. All voxelwise results are presented with a minimum cluster volume of 25 voxels (200 (μl). Anterior and posterior hippocampal volumes were contrasted between groups using linear mixed effects models for each region covarying for age, sex, and MMSE score; additionally, we covaried for intracranial volume to account for interindividual differences in head size. A random intercept per participant was included to account for within-participant correlation of hippocampal volume estimates. We used model coefficients to adjust for significant covariate effects, and two-sample t-tests with Welch’s adjustment for unequal variance and false discovery rate (FDR) correction were used to perform pairwise group contrasts of adjusted volumes; a criterion of p < 0.05 was used to determine statistical significance.
Standard protocol approvals, registrations, and patient consents
All procedures, including CSF collection, MRI, neuropsychological testing, and required informed consent were performed in accordance with the Declaration of Helsinki and the rules of the Institutional Review Board at the University of Pennsylvania.
RESULTS
Demographic comparisons
Clinical and demographic information for all groups is summarized and compared in Table 1. Across bvAD, bvFTD, aAD, and healthy control groups, non-parametric Kruskal-Wallis tests compared continuous variables and chi-square tests compared sex, race, and APOE ε4 allele frequency. Groups were not significantly different on education or sex (both p > 0.1), but had significantly different ages at test (H(3) = 8.09, p = 0.04), MMSE scores (H(3) = 47.9, p < 0.001), and race (χ2(9) = 22.75, p = 0.007). Patients (bvFTD, bvAD, and aAD) were not significantly different for disease duration (p > 0.1), but had significantly different ages of onset (H(2) = 6.62, p = 0.04) and APOE ε4 allele frequency (χ2(4) = 24.73, p < 0.001). Number of APOE ε4 alleles did not differ between bvAD and aAD (χ2(2) = 0.45, p = 0.80), but differed between bvAD and bvFTD (χ2(2)= 14.4, p = 0.00075). Post-hoc test indicated that bvAD patients had significantly older age at test (W = 743.5, p = 0.02) and significantly lower MMSE scores (W = 349, p = 0.03) than bvFTD patients. Therefore, comparisons of neuropsychological assessments covary for age at test and MMSE score.
Table 1.
Clinical and demographic summary, showing median (M), interquartile interval (IQI), and sample size (n) for age at MRI, age at onset, education, disease duration, and MMSE score. Sex indicates the number of males (m) and females (f). Race/Ethnicity indicates number of White (W), Black (B), Asian (A), and multi-racial (M) participants; superscripts indicate number of Latinx (L) participants within each racial group. APOE4 indicates the number of participants with 0, 1, 2, or an unknown (UK) number of ε4 alleles
| Demographics | bvAD | bvFTD | aAD | Healthy Control | Comparisons | ||
|---|---|---|---|---|---|---|---|
| χ | p | ||||||
| Age at Test (y) | M | 68 | 62* | 68.5 | 61 | 8.09 | 0.04* |
| IQI | 59.75–72 | 57–67 | 57.5–73 | 57.75–68.75 | |||
| n | 16 | 67 | 18 | 26 | |||
| Age at Onset (y) | M | 63.5 | 59 | 63.5 | – | 6.62 | 0.04* |
| IQI | 55.5–69 | 53.5–65 | 56–70 | ||||
| n | 16 | 67 | 18 | ||||
| Education (y) | M | 17 | 16 | 17 | 16 | 2.24 | 0.53 |
| IQI | 15–18 | 12–18 | 14.5–18.75 | 13.25–18 | |||
| n | 16 | 67 | 18 | 26 | |||
| Disease Duration (y) | M | 3 | 3 | 2.5 | – | 1.32 | 0.52 |
| IQI | 2–5 | 1–4.5 | 1–3.75 | ||||
| n | 16 | 67 | 18 | ||||
| MMSE Score (points out of 30) | M | 23 | 26* | 23 | 30*** | 47.9 | 2e-10*** |
| IQI | 19.75–26 | 23.5–28 | 18.75–25 | 28–30 | |||
| n | 16 | 67 | 18 | 23 | |||
| Sex | m | 12 | 42 | 9 | 11 | 5.61 | 0.13 |
| f | 4 | 25 | 9 | 15 | |||
| Race/Ethnicity | W | 15 | 62 | 16L = 1 | 18 | 22.75 | 0.007** |
| B | 1 | 2 | 0 | 7 | |||
| A | 0 | 3 | 1 | 0 | |||
| M | 0 | 0 | 1L = 1 | 1 | |||
| APOE4 | 0 | 6 | 50 | 5 | – | 24.73 | 6e-5*** |
| 1 | 9 | 11 | 10 | ||||
| 2 | 1 | 0 | 2 | ||||
| UK | 0 | 6 | 1 | ||||
Comparison column summarizes results of Kruskal-Wallis and chi-square tests comparing all groups, with asterisks indicating group differences:
p < 0.05,
p < 0.01,
p < 0.001.
Asterisks by group medians indicate significant difference from bvAD for age at test, age at onset, education, disease duration, and MMSE score.
Neuropsychological testing
Results from ANCOVAs between control and patient groups are outlined in Table 2 and summarized in Fig. 1. We found a main effect of group for all cognitive measures within each domain (all p < 0.05). Planned ANCOVA comparisons directly compared bvAD to bvFTD, aAD, and healthy controls. When compared to controls, bvAD patients performed significantly worse on all tasks (all p < 0.05). Comparing bvAD and bvFTD, we found no statistical differences (all p > 0.1) for attention and executive function tasks (Digit Forward Span, Digit Backward Span, F-words). Regarding memory, bvAD and bvFTD patients did not differ on verbal memory tasks (PVLT delayed recall or recognition) but bvAD patients performed significantly worse than bvFTD patients on visual memory tasks [Rey Figure recall [F(1,57) = 5.73, p = 0.02]. bvAD also had lower scores than bvFTD on the Rey Figure copy [F(1,59) = 5.52, p = 0.02]. When compared to aAD, bvAD patients performed worse on one executive function task [F-words: F(1,22) = 6.63, p = 0.02]. No differences were found between bvAD and aAD on verbal memory (p > 0.1) but bvAD performed better than aAD on visual memory [Rey Figure recall: F(1,20) = 9.11, p = 0.007] and a visuospatial task [Rey Figure copy: F(1,21) = 4.77, p = 0.04].
Table 2.
Median (M), interquartile interval (IQI), and n for all groups on three cognitive domains
| Cognitive Assessment | bvAD | bvFTD | aAD | Healthy Control | Comparisons | ||
|---|---|---|---|---|---|---|---|
| F | p | ||||||
| Attention and Executive Function | |||||||
| Digit Forward Span (number of digits in longest span correct) | M | 6 | 6 | 6 | 7*** | 5.95 | 0.001** |
| IQI | 5–6 | 6–7 | 5–7 | 7–8 | |||
| n | 13 | 43 | 12 | 15 | |||
| Digit Backward Span (number of digits in longest span correct) | M | 4 | 4 | 3 | 5** | 3.83 | 0.01* |
| IQI | 3–4 | 3–5 | 3–4 | 4.5–6.5 | |||
| n | 13 | 42 | 12 | 15 | |||
| F-words (number of words) | M | 8 | 7 | 12* | 16.5** | 10.21 | 1e-05*** |
| IQI | 4–11 | 4–11 | 9–13.5 | 12.5–18 | |||
| n | 14 | 42 | 12 | 14 | |||
| Verbal Memory | |||||||
| PVLT Long Delay Recall (number of words) | M | 3 | 4 | 1 | 7*** | 12.32 | 1e-06*** |
| IQI | 0–4.5 | 1–6 | 0–2 | 7–7.5 | |||
| n | 15 | 47 | 11 | 11 | |||
| PVLT Recognition (number of words) | M | 8 | 8 | 7 | 9* | 3.09 | 0.03* |
| IQI | 6.5–9 | 7–9 | 6–8 | 8.5–9 | |||
| n | 15 | 48 | 11 | 11 | |||
| Visuospatial Skills and Memory | |||||||
| Rey Copy (points out of 36) | M | 25 | 32* | 12.5* | 36** | 11.9 | 2e-06*** |
| IQI | 11.12–33.25 | 27–34 | 5.5–25 | 32.25–36 | |||
| n | 14 | 49 | 11 | 10 | |||
| Rey Recall (points out of 36) | M | 6.75 | 14.5* | 1* | 17.75*** | 13.67 | 3e-07*** |
| IQI | 2.63–11.88 | 5.75–19.5 | 0–1 | 15.62–23.88 | |||
| n | 14 | 47 | 10 | 10 | |||
Comparison column summarizes ANCOVA, with asterisks indicating group differences:
p < 0.05,
p < 0.01,
p < 0.001.
Asterisks by group medians indicate significant difference from bvAD.
Fig. 1.

Boxplots comparing bvAD, bvFTD, aAD, and controls on all continuous neuropsychological measures. Measures of attention and executive function include Digits Forward, Digits Backward, and Fluency (F-words). Verbal memory assessments include Recall and Recognition. Visual skills and memory measures include Rey Copy and Recall. Psychiatric and social symptoms are compared with the NPI total score. No data was collected for controls on the NPI.
To further investigate memory and visuospatial deficits, we compared impaired/unimpaired performances across groups on PVLT retention at delayed recall, Rey Copy, and Rey Recall. Based on previous norms for the PVLT [63] and the Rey [64], we categorized scores 1.5 standard deviations below the mean as impaired and those above this cutoff as unimpaired. Chi-square tests found significant differences between the four groups on PVLT retention, Rey Copy, and Rey Recall (all p < 0.001). When comparing two groups at a time, bvAD did not differ from bvFTD or aAD on rates of impairment for these three measures (all p > 0.05), but bvAD was significantly different from healthy controls (all p < 0.05). Numerically, rates of impairment in patient groups were lowest in bvFTD (43% impaired on PVLT retention; 20% impaired on Rey Copy; 28% impaired on Rey Recall), higher in bvAD (50% impaired on PVLT retention; 50% impaired on Rey Copy; 57% impaired on Rey Recall), and highest in aAD (91% impaired on PVLT retention; 73% impaired on Rey Copy; 90% impaired on Rey Recall).
Logistic regression tested differences in the presence of behavioral disturbances in bvAD compared to bvFTD and aAD. On behavioral NPI measures, caregivers rated bvAD patients as being significantly more likely to exhibit agitated or aggressive behaviors than bvFTD patients (p = 0.03), while no difference was found for delusions, hallucinations, depression, anxiety, euphoria, apathy, disinhibition, irritability, motor disturbance, nighttime behaviors, appetite changes, or NPI total (all p > 0.1; Table 3). When compared to aAD, bvAD patients were rated as having significantly higher rates of disinhibition (p = 0.006) and motor disturbances (p = 0.01), and marginally higher rates of agitation/aggression (p = 0.06). All other NPI measures were not significantly different (all p > 0.1).
Table 3.
Results of logistic regression comparing each NPI symptom across patient groups (bvAD, bvFTD, aAD)
| Neuropsychiatrie Inventory | bvAD | bvFTD | aAD | bvFTD versus bvAD | aAD versus bvAD | |||||||
|---|---|---|---|---|---|---|---|---|---|---|---|---|
| Presence of Symptoms | n = 13 | n = 58 | n=14 | β | SE | z | p | β | SE | z | p | |
| Delusions | n with symptom (% of total) | 5 (38%) | 14 (24%) | 0 (0%) | −0.63 | 0.72 | −0.87 | 0.38 | −18.1 | 1723 | −0.01 | 0.99 |
| Hallucinations | n with symptom (% of total) | 2 (15%) | 7 (12%) | 1 (7%) | −0.23 | 0.94 | −0.25 | 0.81 | −0.88 | 1.29 | −0.68 | 0.5 |
| Agitation/Aggression | n with symptom (% of total) | 12 (92%) | 33 (57%) | 8 (57%) | −2.38 | 1.12 | −2.13 | 0.03* | −2.23 | 1.18 | −1.89 | 0.06 |
| Depression/Dysphoria | n with symptom (% of total) | 7 (54%) | 26 (45%) | 5 (36%) | −0.54 | 0.67 | −0.81 | 0.42 | −0.73 | 0.79 | −0.93 | 0.35 |
| Anxiety | n with symptom (% of total) | 8 (62%) | 33 (57%) | 7 (50%) | −0.12 | 0.67 | −0.18 | 0.86 | −0.47 | 0.78 | −0.61 | 0.55 |
| Euphoria/Elation | n with symptom (% of total) | 5 (38%) | 29 (50%) | 4 (29%) | 0.56 | 0.68 | 0.82 | 0.41 | −0.48 | 0.83 | −0.58 | 0.57 |
| Apathy | n with symptom (% of total) | 11 (85%) | 51 (88%) | 9 (64%) | 0.05 | 0.93 | 0.05 | 0.96 | −1.12 | 0.95 | −1.17 | 0.24 |
| Disinhibition | n with symptom (% of total) | 10 (77%) | 44 (76%) | 3 (21%) | −0.37 | 0.79 | −0.46 | 0.64 | −2.56 | 0.94 | −2.72 | 0.006** |
| Irritability/Emotional Lability | n with symptom (% of total) | 11 (85%) | 34 (59%) | 8 (57%) | −1.29 | 0.85 | −1.52 | 0.13 | −1.42 | 0.94 | −1.51 | 0.13 |
| Motor Disturbance | n with symptom (% of total) | 9 (69%) | 35 (60%) | 3 (21%) | −1.01 | 0.76 | −1.32 | 0.19 | −2.38 | 0.96 | −2.47 | 0.01* |
| Nighttime Behaviors | n with symptom (% of total) | 6 (46%) | 30 (52%) | 4 (29%) | 0.39 | 0.66 | 0.59 | 0.56 | −0.78 | 0.81 | −0.95 | 0.34 |
| Appetite | n with symptom (% of total) | 8 (62%) | 39 (67%) | 8 (57%) | 0.03 | 0.68 | 0.04 | 0.97 | −0.17 | 0.79 | −0.22 | 0.83 |
| n = 13 | n = 57 | n=13 | F | p | F | p | ||||||
| NPI Total | M | 12 | 9 | 4 | 0.24 | 0.63 | 10.41 | 0.004** | ||||
| Severity of Symptoms | IQI | 8–16 | 6–15 | 2–8 | ||||||||
Beta estimate (β), standard error (SE), z-value (z), and p-value (p) are relative to bvAD performance. Asterisks indicate difference from bvAD:
p < 0.05,
p< 0.01.
Neuroimaging
Voxelwise contrasts relative to elderly controls revealed extensive cortical thinning in bvAD, bvFTD, and aAD (Table 4, Fig. 2). After statistical adjustment for age, sex, and MMSE score, patient groups displayed cortical thinning throughout the brain at a significance level of p < 0.05 (family-wise error corrected) with relatively spared primary visual and sensorimotor cortices.
Table 4.
Subpeak voxel locations where patients exhibited greater atrophy (i.e., lower cortical thickness) than healthy controls
| Hemisphere | Region | T. statistic | X | Y | Z |
|---|---|---|---|---|---|
| bvAD versus Healthy Control | |||||
| Left | Anterior cingulate gyrus | 5.415 | −2 | 47 | 22 |
| Gyrus rectus | 5.408 | −8 | 22 | −22 | |
| Middle frontal gyrus | 5.241 | −41 | 45 | 12 | |
| Middle temporal gyrus | 5.213 | −62 | −53 | 1 | |
| Superior frontal gyrus | 5.19 | −22 | 59 | 7 | |
| Amygdala | 4.8 | −29 | −7 | −17 | |
| Anterior insula | 4.756 | −40 | 17 | −3 | |
| Superior frontal gyrus | 4.67 | −11 | 34 | 50 | |
| Middle frontal gyrus | 4.486 | −41 | 16 | 43 | |
| Middle temporal gyrus | 4.453 | −51 | −5 | −29 | |
| Right | Superior temporal gyrus | 5.999 | 57 | −37 | 11 |
| R anterior insula | 5.915 | 41 | −3 | 11 | |
| R middle frontal gyrus | 5.836 | 43 | 47 | 10 | |
| R superior frontal gyrus | 5.433 | 25 | 37 | 40 | |
| R anterior insula | 5.425 | 42 | 19 | −2 | |
| Angular gyrus | 5.353 | 44 | −57 | 28 | |
| Cerebral White Matter | 5.338 | 25 | −6 | −11 | |
| R middle temporal gyrus | 5.126 | 66 | −19 | −18 | |
| R superior frontal gyrus | 5.112 | 23 | 52 | 26 | |
| Posterior orbital gyrus | 5.074 | 34 | 36 | −10 | |
| bvFTD versus Healthy Control | |||||
| Left | Anterior insula | 8.722 | −35 | 23 | −3 |
| Superior frontal gyrus medial segment | 8.554 | −8 | 49 | 22 | |
| Middle frontal gyrus | 8.129 | −34 | 45 | 28 | |
| Middle frontal gyrus | 7.927 | −41 | 46 | 9 | |
| Amygdala | 7.713 | −27 | −8 | −12 | |
| Anterior orbital gyrus | 7.329 | −19 | 63 | −7 | |
| Middle frontal gyrus | 7.121 | −36 | 21 | 47 | |
| Entorhinal area | 6.953 | −26 | −3 | −34 | |
| Superior frontal gyrus | 6.867 | −8 | 49 | 45 | |
| Temporal pole | 6.773 | −36 | 22 | −36 | |
| Right | Anterior insula | 9.353 | 42 | 19 | −2 |
| Middle frontal gyrus | 9.09 | 43 | 47 | 10 | |
| Posterior insula | 9.088 | 44 | −2 | −2 | |
| Posterior orbital gyrus | 8.32 | 27 | 30 | −20 | |
| Amygdala | 7.985 | 25 | −6 | −11 | |
| Middle temporal gyrus | 7.791 | 46 | 0 | −31 | |
| Middle temporal gyrus | 7.777 | 64 | −28 | −1 | |
| Middle frontal gyrus | 7.774 | 44 | 37 | 28 | |
| Superior frontal gyrus | 7.476 | 25 | 60 | 23 | |
| Temporal pole | 7.375 | 23 | 17 | −38 | |
| aAD versus Healthy Control | |||||
| Left | Amygdala | 6.286 | 25 | 10 | −10 |
| Middle temporal gyrus | 5.621 | 66 | 46 | 3 | |
| Middle frontal gyrus | 4.998 | 35 | −47 | 23 | |
| Precentral gyrus | 4.873 | 45 | −4 | 28 | |
| Superior occipital gyrus | 4.727 | 24 | 91 | 16 | |
| Middle frontal gyrus | 4.713 | 36 | −21 | 47 | |
| Posterior insula | 4.468 | 29 | 27 | 16 | |
| Angular gyrus | 4.4 | 38 | 62 | 55 | |
| Supramarginal gyrus | 4.364 | 50 | 55 | 23 | |
| Superior parietal lobule | 4.276 | 30 | 41 | 48 | |
| Right | Middle frontal gyrus | 4.743 | −43 | −47 | 10 |
| Amygdala | 4.592 | −27 | 8 | −10 | |
| Supramarginal gyrus | 4.566 | −48 | 42 | 52 | |
| Postcentral gyrus | 4.524 | −66 | 17 | 22 | |
| Angular gyrus | 4.512 | −54 | 55 | 26 | |
| Posterior insula | 4.425 | −44 | 4 | 1 | |
| Inferior occipital gyrus | 4.277 | −33 | 86 | −4 | |
| Posterior cingulate gyrus | 4.255 | −1 | 42 | 35 | |
| Superior parietal lobule | 4.184 | −24 | 63 | 45 | |
| Superior temporal gyrus | 4.169 | −64 | 36 | 10 | |
Results are based on a statistical threshold of p < 0.05, after application of FSL’s threshold-free cluster enhancement algorithm and family-wise error correction for multiple comparisons. Top ten most significant subpeaks in both hemispheres are reported in MNI coordinates.
Fig. 2.
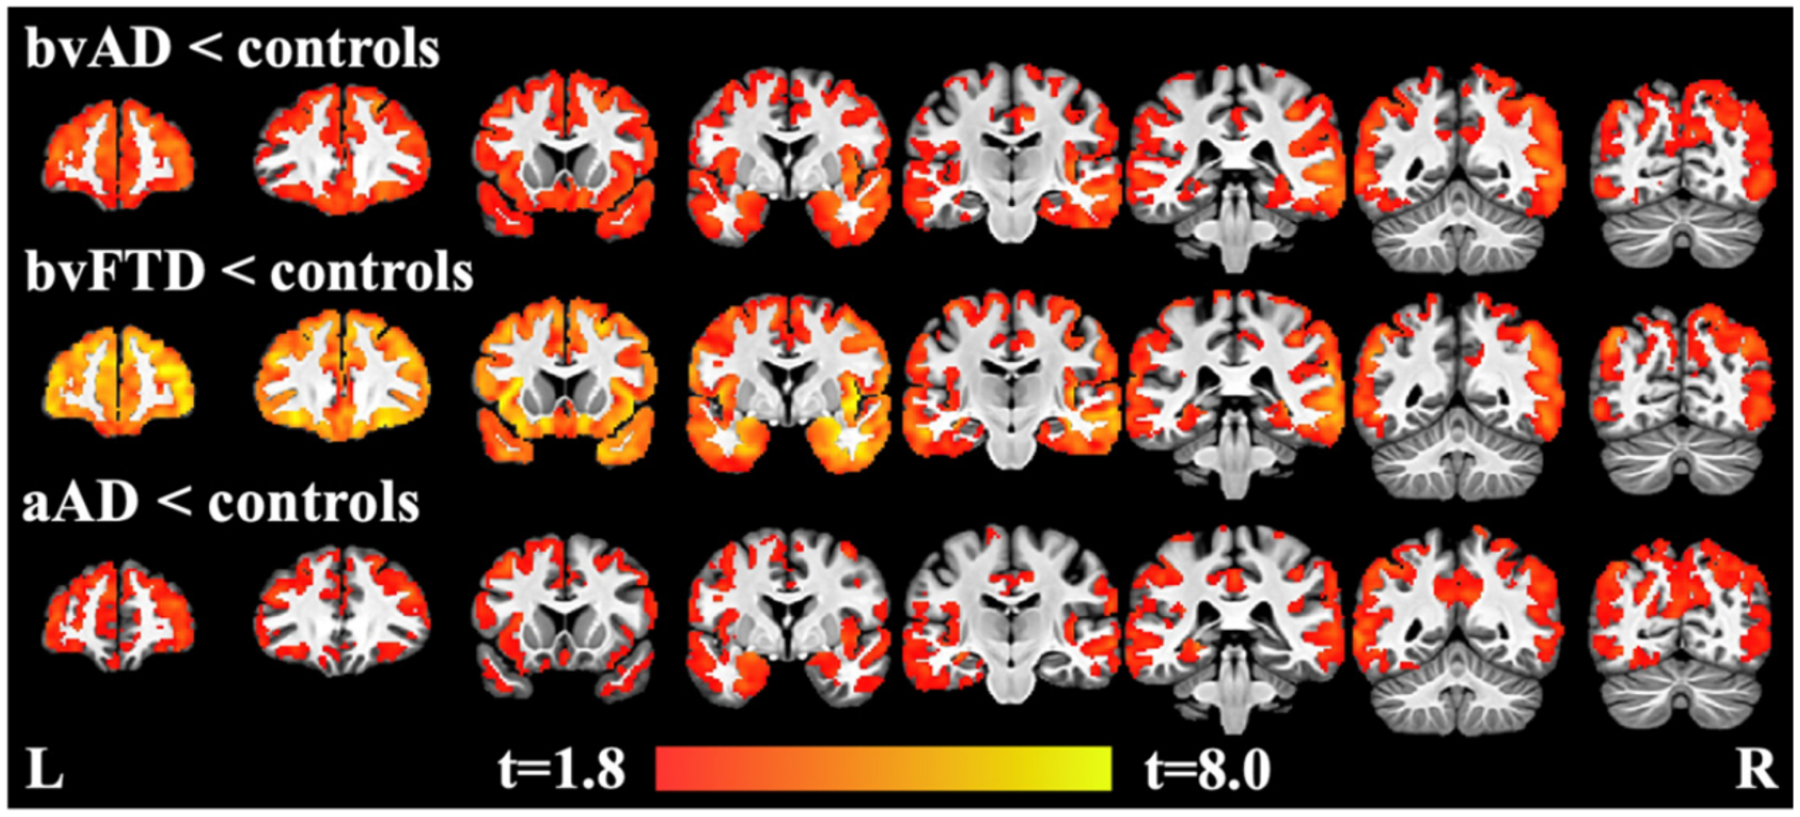
Regions of decreased cortical thickness in bvAD, bvFTD, and aAD compared to controls, covarying for age, sex, and MMSE score, and using family-wise error corrected significance of p < 0.05 and a cluster threshold of 25 voxels (200 μl). Heatmap indicates t-values.
In a direct contrast of bvAD and bvFTD patients, no significant differences in cortical thickness were observed after correction for multiple comparisons. However, at p < 0.001 (uncorrected) with a minimum cluster volume of 200 μl, exploratory analyses showed that the bvAD group had cortical thinning relative to the bvFTD group in right superior temporal cortex, left fusiform gyrus, and left central operculum (Fig. 3; Table 5). Conversely, the bvFTD group had cortical thinning relative to the bvAD group in left inferior frontal gyrus (pars orbitalis).
Fig. 3.
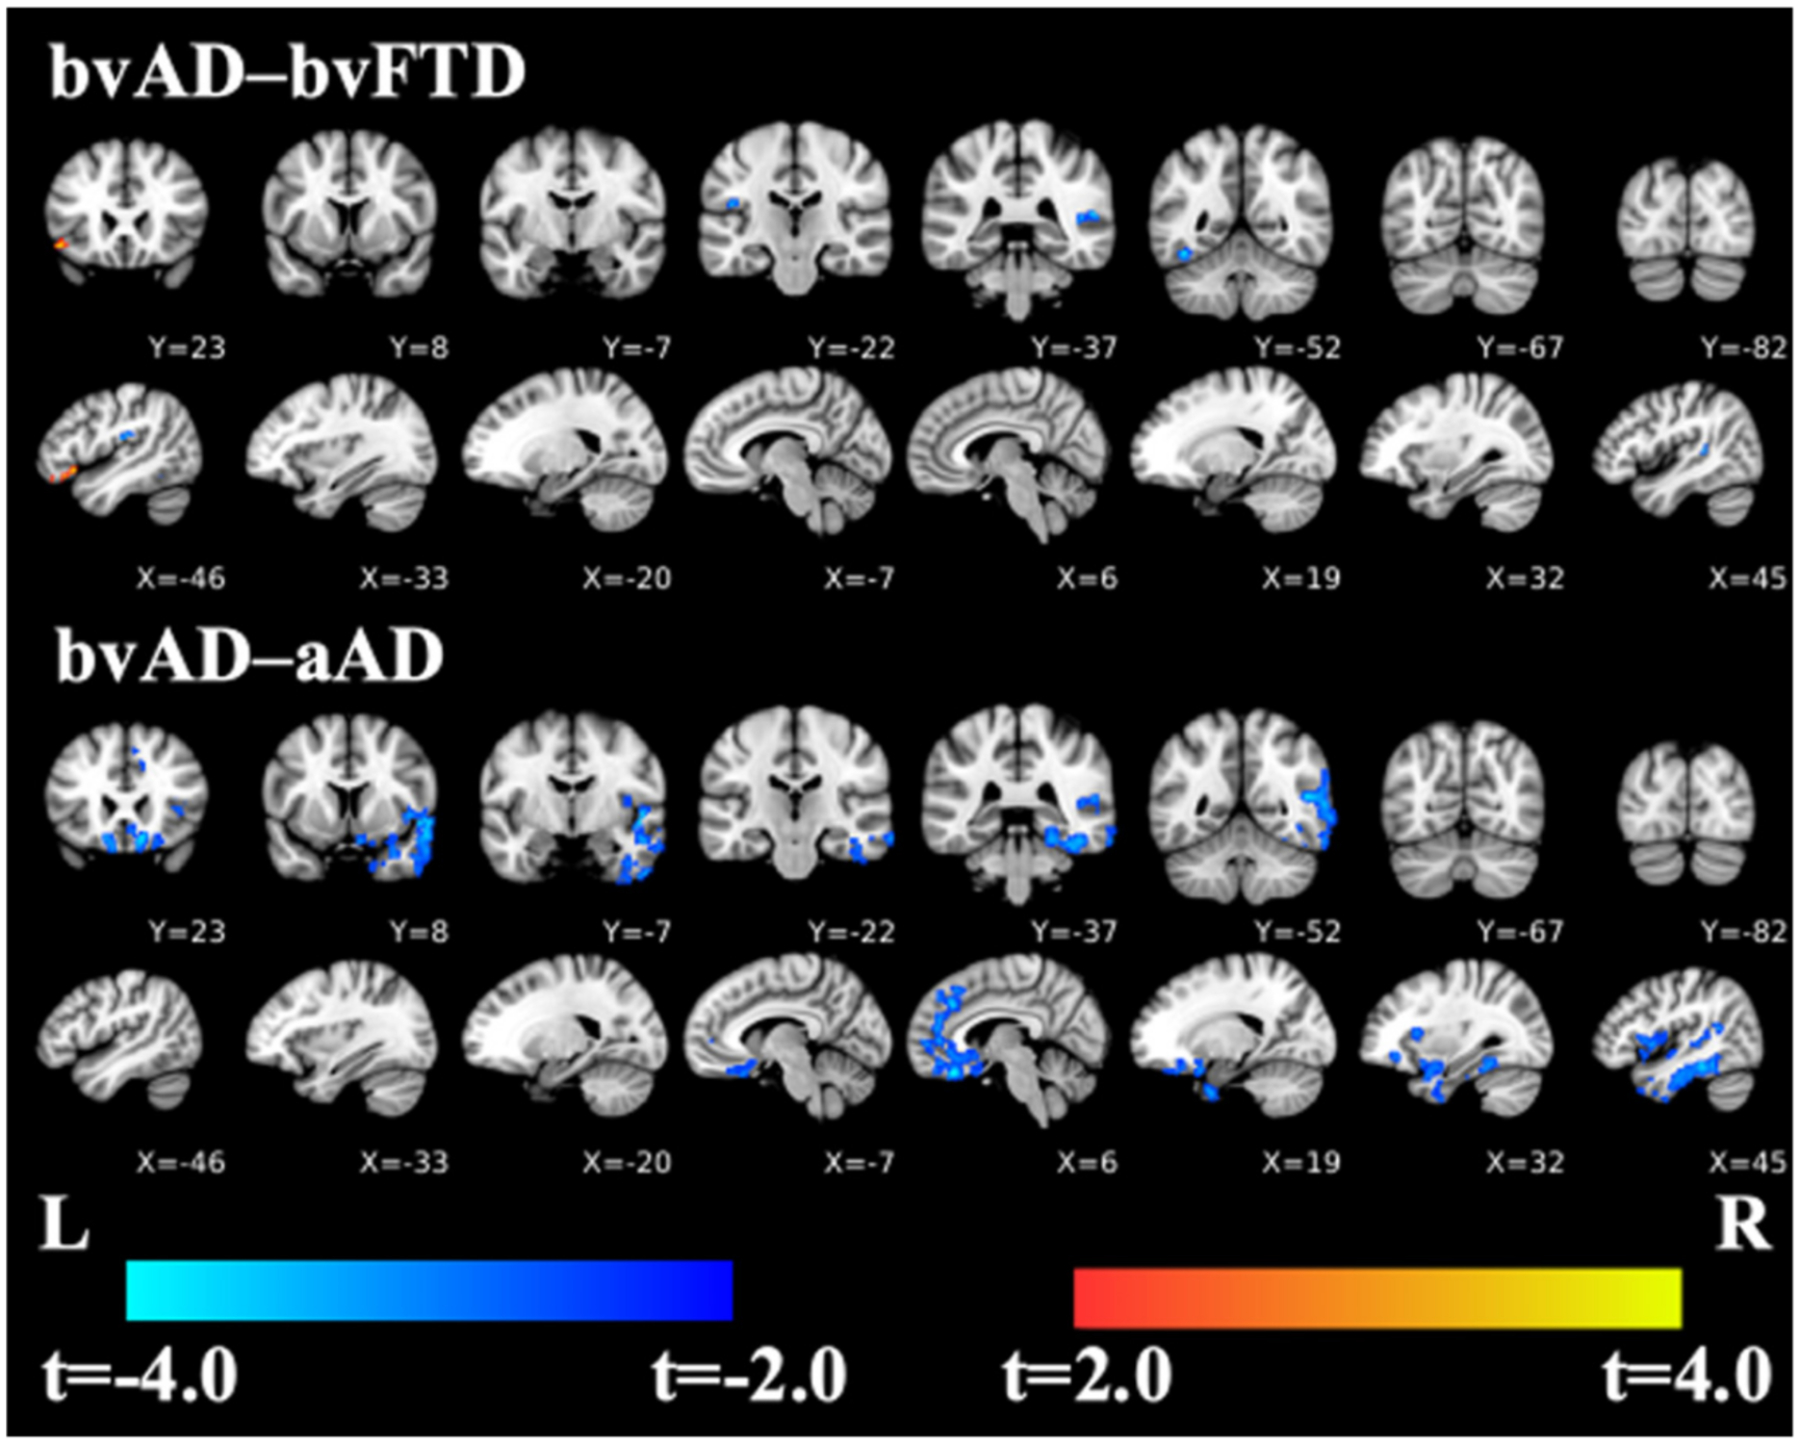
Contrasts of bvAD relative to bvFTD and aAD, covarying for age, sex, and MMSE score, using TFCE with an uncorrected significance of p < 0.001 and a cluster threshold of 25 voxels (200 μl). Cool colors indicate where bvAD has cortical thinning relative to the bvFTD and aAD groups; warm colors indicate where bvFTD group has cortical thinning compared to the bvAD group (left inferior frontal gyrus, first coronal and sagittal slices). There are no such regions where bvAD > aAD.
Table 5.
bvAD compared to bvFTD (using peak clusters) and aAD (using subpeak clusters)
| Hemisphere | Region | T. statistic | X | Y | Z |
|---|---|---|---|---|---|
| bvAD versus bvFTD | |||||
| Left | Orbital part of inferior frontal gyrus | 3.9745 | −50 | 38 | −15 |
| Fusiform gyrus | −3.6424 | −42 | −51 | −18 | |
| Central operculum | −3.6974 | −45 | −20 | 19 | |
| Right | Superior temporal gyrus | −3.6619 | 55 | −36 | 10 |
| bvAD versus aAD | |||||
| Left | Medial orbital gyrus | −3.029 | −14 | 23 | −18 |
| Gyrus rectus | −4.277 | 9 | 30 | −22 | |
| Planum polare | −4.057 | 52 | 3 | −4 | |
| Fusiform gyrus | −3.765 | 38 | −40 | −22 | |
| Superior frontal gyrus medial segment | −3.717 | 7 | 32 | 35 | |
| Right | Middle temporal gyrus | −3.711 | 58 | 1 | −23 |
| Middle temporal gyrus | −3.673 | 48 | −52 | 13 | |
| Middle temporal gyrus | −3.523 | 69 | −45 | 2 | |
| Anterior cingulate gyrus | −3.436 | 3 | 46 | 3 | |
| Inferior temporal gyrus | −3.401 | 55 | −7 | −43 | |
| Middle temporal gyrus | −3.386 | 68 | −26 | −18 | |
Results are based on a voxelwise statistical threshold of p < 0.001, uncorrected for multiple comparisons. Negative T-statistic values indicate regions where bvAD has cortical thinning relative to a comparison group.
The bvAD group had cortical thinning relative to the aAD group in right temporal (planum polare; inferior and middle temporal gyri; and fusiform gyrus) and right prefrontal (gyrus rectus, anterior cingulate gyrus, and medial superior frontal gyrus) cortex as well as the left medial orbital frontal gyrus (Fig. 3; Table 5). aAD patients did not have smaller cortical thickness than bvAD in any brain regions.
Group differences in anterior and posterior hippocampal volumes are visualized in Fig. 4 and Table 6. ANOVAs on linear mixed effects models indicated main effects of group in both anterior [F(3, 107) = 6.03, p = 0.0008] and posterior hippocampus [F(3, 107) = 9.95, p < 0.0001]. Intracranial volume was also associated with volume in both regions [anterior: F(1, 107) = 32.06, p < 0.0001; posterior: F(1, 107) = 29.59, p < 0.0001]; age effects were significant in anterior hippocampus [F(1, 107) = 4.86, p = 0.03] and marginal in posterior hippocampus [F(1,107) = 3.35, p = 0.07]. Associations with sex and MMSE score were non-significant in both regions (all F < 0.8, p > 0.38). Hippocampal volumes were thus adjusted for age and intracranial volume.
Fig. 4.

Group differences in anterior and posterior hippocampal volume, adjusted for age and intracranial volume. Volumes are in microliters, normalized by the number of slices imaged in each participant. Significant between-group differences are marked by lines with asterisks: *p < 0.05; **p < 0.01; ***p < 0.001.
Table 6.
Mean (m), standard deviation (SD), and n for all groups on anterior and posterior hippocampal volume, adjusted for effects of age and intracranial volume
| bvAD n = 13 |
bvFTD n = 64 |
aAD n = 18 |
Healthy Control n = 26 |
||
|---|---|---|---|---|---|
| Anterior Hippocampus | m | 1594.17 | 1465.27* | 1554.47 | 1760.88*** |
| Volume (μl) | SD | 233.36 | 320.92 | 310.75 | 193.49 |
| Posterior Hippocampus | m | 1489.58 | 1482.58 | 1391.59* | 1668.12*** |
| Volume (μl) | SD | 170.00 | 233.81 | 185.10 | 151.34 |
Asterisks by group means indicate significant difference from bvAD based on post-hoc two-sample t-tests with FDR correction:
p < 0.05,
p < 0.01,
p < 0.001.
Additionally, both bvFTD and aAD had significantly smaller volumes compared to controls in both the anterior and posterior hippocampus.
In post-hoc tests, adjusted volumes for the bvAD group were significantly lower than controls’ in both anterior [t(42.7) = −3.14, p = 0.006] and posterior hippocampus [t(45.3) = −4.53, p = 0.0001). In the bvFTD group, volumes were lower than controls’ in both anterior [t(152.3) = −7.57, p < 0.0001] and posterior hippocampus [t(143.6) = −6.30, p < 0.0001]. While bvAD and bvFTD had comparable volumes in the posterior hippocampus [t(46.5) = 0.18, p = 0.86], bvFTD had significantly smaller anterior hippocampal volumes than bvAD [t(46.5) = −2.39, p = 0.031). Furthermore, aAD had significantly smaller volumes compared to controls in both the anterior [t(53.7) = −3.54, p = 0.002] and posterior hippocampus [t(65.3) = −7.41, p < 0.0001]. bvAD patients had significantly higher volumes than aAD patients in posterior hippocampus [t(56.5) = 2.16, p = 0.047] but not in anterior hippocampus [t(59.9) = 0.57, p = 0.62]. Similarly, bvFTD patients had higher volumes than aAD patients in posterior [t(69.6) = 2.45, p = 0.029] but not anterior hippocampus [t(57.7) = −1.51, p = 0.16].
DISCUSSION
This study characterizes bvAD with known or likely AD pathology by comparing its neuropsychological profile and distribution of neocortical and hippocampal atrophy to two diseases. First, we compare bvAD and bvFTD patients, which are clinically similar while pathologically distinct, to identify the clinical and anatomical divergence and convergence of these two groups. Second, we compare bvAD to aAD to characterize the clinical heterogeneity within two syndromes which share a common pathology. Finally, we include healthy elderly controls as a reference group. Patients with bvAD exhibited a blend of features of both bvFTD and aAD, and were significantly worse than controls on all measures. Results confirmed executive impairments in bvAD, showing that bvAD were as impaired on executive function measures as bvFTD patients, and were more impaired than aAD. While tasks of verbal memory did not distinguish bvAD from bvFTD or aAD groups, visual memory tests showed significant differences between groups. Indeed, bvAD patients displayed mild-to-moderate impairments for both visuospatial function and visual memory; they were significantly more impaired on visual copy and recall tasks than bvFTD patients, but significantly less impaired than aAD patients. bvAD patients exhibited significantly higher rates of agitation than bvFTD patients and of disinhibition and motor disturbance than aAD patients. MRI comparisons revealed that bvAD patients had cortical thinning relative to bvFTD patients centered in temporal-occipital regions, and cortical thinning relative to aAD patients mostly in frontal-temporal regions with a bias towards right hemisphere disease. bvFTD patients had cortical thinning relative to bvAD patients in inferior frontal cortex. While both bvAD and bvFTD groups demonstrated hippocampal atrophy relative to controls, posterior hippocampal volume loss was less severe than in aAD for both groups. Furthermore, bvFTD patients had greater anterior hippocampal atrophy than bvAD patients.
In our comparative study, we found a neuropsychological impairment profile in bvAD that includes characteristics of both bvFTD and aAD. We found evidence of executive dysfunction in bvAD equivalent to that of bvFTD, but worse than aAD. Our results align with two past studies that have compared bvAD to bvFTD [26, 28], and with another study that found worse executive function in bvAD than in aAD [65]. This is also consistent with a recent meta-analytic review that found that bvAD executive function was comparable to bvFTD and worse than aAD [30]. Somewhat inconsistent with prior research, we found that bvAD had worse visuospatial function than bvFTD [26–28], but better than aAD. Two previous studies found similar figure copy performance between behavioral variant groups [26, 28], and one study found comparable visuospatial performance between bvAD and aAD [65]. Similar to some but not all previous studies, we found that bvAD visual memory was worse than bvFTD [9, 27] and better than aAD. When comparing verbal memory, we found no differences between bvAD and bvFTD or aAD, consistent with three studies that compared bvAD and bvFTD [26–28]. In contrast to our results, one study reported worse verbal memory in bvAD compared to bvFTD [9] and another study found better verbal memory in bvAD compared to aAD [65]. Our findings suggest that bvAD may have a memory profile that is in between bvFTD and aAD—more impaired than bvFTD and less impaired than aAD. It is possible that bvAD memory performance may not always be distinct enough from either group to find significant differences upon statistical testing. Although visual memory tests revealed differences between our patient groups, our verbal memory results are relatively consistent with the recent meta-analysis that combined verbal and visual memory tests and found that bvAD was not significantly different from bvFTD or aAD [30]. However, authors of the meta-analysis concluded that bvAD had a memory profile similar to aAD and marginally but not significantly worse than bvFTD [30].
The basis for a performance profile showing some visual memory impairment but less verbal memory deficits is unclear. One possibility is that right hemisphere disease tends to be associated more strongly with behavioral changes as well as visuospatial deficits, and as can be seen in Fig. 3, bvAD patients tended to have greater right hemisphere disease than the other patient groups. Nevertheless, it should be kept in mind that conclusions differ for whether visuospatial deficits are a feature of bvAD; the current study found that bvAD have significantly worse performance on the Rey Figure copy and recall than bvFTD, while others report no difference [26–28]. Discrepancies in findings could be due in part to methodological differences, including using the less complex Benson Figure [27, 28], a shorter delay (3 versus 10–15 minutes) [26], or inclusion of patients with co-occurring TBI [9]. Additional work is needed to address this issue, since the relative deficit in visuospatial functioning seems to be an important distinguishing feature in comparisons of bvAD and bvFTD.
Our results showed selectively more frequent psychiatric and social impairment in bvAD compared to both bvFTD and aAD. bvAD patients were rated as agitated/aggressive more often than bvFTD and as having higher rates of disinhibition and motor disturbances than aAD. Previous studies have not only found greater rates of agitation in bvAD compared to bvFTD [28–30], they have also found additional behavioral disturbances, such as delusions [28–30], hallucinations [29, 30], irritability, sensitivity, and emotional lability [12], and depression [27], that were more frequent in their bvAD samples. On the other hand, other researchers have found that bvFTD had greater behavioral impairments than bvAD, including greater agitation, anxiety and irritability [9] or apathy, aggression, and lack of insight [27]. Further work is needed to assess the neuropsychiatric profiles of bvAD and bvFTD patients and other instruments may offer more sensitivity to differences than the NPI.
We measured cortical thickness and hippocampal volume comparatively in bvAD, bvFTD, aAD, and healthy controls. Consistent with prior findings [15], we found that bvAD had more occipital and posterior temporal atrophy than bvFTD, and that bvFTD had more frontal and anterior temporal lobe atrophy than bvAD [9, 26, 27]. We also found that bvAD had more atrophy in prefrontal cortex and temporal cortex, with a bias towards right hemisphere disease, compared to aAD, supported by previous findings [9, 26]. Using a novel algorithm for prior-based segmentation of medial temporal lobe structures from T1-weighted MR images, we found that bvAD and bvFTD patients exhibited posterior hippocampal atrophy that was intermediate between controls and aAD. In anterior hippocampus, bvFTD patients had significantly smaller volumes than bvAD patients and did not differ from the aAD group.
Our neuroimaging findings fit with the overall patterns of atrophy that have emerged from past research. Investigators in one study found that, regardless of neuropathological diagnosis, patients with a possible clinical diagnosis of bvFTD shared atrophy in the anterior cingulate, frontal insula, striatum, and amygdala [27]. This suggests that the degeneration of these regions is closely associated with the behavioral syndrome. It is noteworthy that one area of inferior frontal disease revealed cortical thinning in bvFTD relative to bvAD, and this may have contributed in part to the subtle behavioral differences between these two groups. More importantly, our study revealed areas of significant temporal-occipital atrophy in bvAD compared to bvFTD. While other studies have shown greater precuneus atrophy in bvAD than in bvFTD [27], we did not find this on direct comparison. However, our aAD group had lower cortical thickness than bvFTD, but not bvAD, in the precuneus and posterior cingulate gyrus. This is consistent with studies identifying the precuneus [66] and the posterior cingulate gyrus [67] as hubs of disease in patients with underlying AD pathology. Comparing bvAD and aAD, we found more frontal lobe atrophy in bvAD and found no areas where aAD had greater atrophy, consistent with a prior study that limited its analysis to prefrontal and medial temporal regions [26]. Another study also found more frontal atrophy in bvAD compared to aAD, but they found more posterior involvement in aAD compared to bvAD [9]. They also found that bvAD had less frontal lobe atrophy than bvFTD and suggested that bvAD has a more posterior distribution of atrophy than bvFTD [9]. We find this to be generally true in a direct comparison of bvAD and bvFTD groups. However, relative to aAD, both bvAD and bvFTD patients have more severe frontal atrophy; and relative to healthy controls, both groups have extensive atrophy throughout all lobes of the brain, with some sparing of early visual and sensorimotor cortex. Recently, authors reviewed the bvAD neuroimaging literature and suggested two distinct bvAD neuroanatomical phenotypes: one with more anterior atrophy (“bvFTD-like”) and one with relative frontal sparing (“AD-like”), with the latter being more prevalent [30]. The current bvAD sample (n = 13) is insufficient for investigating possible anatomical subtypes; however, it is likely that this sample reflects a mixture of patients with more anterior, bvFTD-like disease and more posterior AD-like disease.
Taken together with the results of previous studies, the current study lends support to the possible role of degeneration in posterior cortical regions as an anatomical marker to distinguish bvAD and bvFTD. This would also be consistent with the observation of relatively greater visuospatial deficits in bvAD than bvFTD. Although we did not find differences in bvAD and bvFTD in dorsal visual stream regions (e.g., superior occipital or posterior parietal), bvAD had reduced cortical thickness compared to bvFTD in some parts of the ventral visual stream— the left fusiform gyrus. This area, along with other ventral and dorsal stream regions, has been previously associated with Rey figure performance [68]. Furthermore, more anterior hippocampal atrophy in bvFTD and relatively greater posterior hippocampal atrophy in bvAD could also aid in differentiating bvAD from bvFTD, although relatively small samples prevented us from conclusively testing this hypothesis. Additional research comparing these groups’ hippocampal volumes will help clarify this finding’s potential significance.
This study had a number of limitations. First, bvAD is a relatively rare syndrome and we selected cases based on strict criteria for known or likely pathology. Thus, while our bvAD cohort was comparable to that of other studies, its small size likely affected our statistical power to detect neuropsychological (n ranging from 13 to 15 depending on test) and neuroanatomical (n = 13) differences between bvAD and bvFTD. This is a challenge that previous studies have faced as well, since only a fraction of patients with a clinical diagnosis of bvFTD ultimately have AD pathology [18, 19]. Second, only a subset of our patients had autopsy-confirmed pathology, and it is possible that some bvAD patients who were positive for AD using CSF biomarkers could have had both AD and FTLD pathologies since CSF markers to detect secondary FTLD pathology are still lacking. Third, a subset of participants (3 bvAD, 7 bvFTD) had secondary svPPA. Patients who meet bvFTD criteria commonly demonstrate language difficulties, especially in semantic and naming domains [37, 38]. While a minority of participants had secondary svPPA, it is important to note that they may have somewhat unique neuropsychological and neuroanatomical profiles. Fourth, because this is a retrospective study, subsets of subjects completed each neuropsychological task. Fifth, in this exploratory study we compared bvAD to bvFTD and aAD across a battery of neuropsychological evaluations but did not adjust statistical analyses for comparisons across multiple tasks. While this increases the possibility of type I error, it is crucial to be able to identify differences across rare patient groups with similar phenotypes, and we are careful to interpret our results in the context of previous findings. Sixth, the study’s neuropsychological test battery was restricted, with a limited number of executive and visuospatial function measures and no tests examining other relevant features such as apraxia, visual agnosia, aphasia, psychomotor speed, visual attention, unilateral neglect, and semantic processing. Seventh, we note that we did not assess subcortical regions. Lastly, our samples consisted of mostly non-Hispanic White participants, which limits the generalizability of results for diverse racial and ethnic populations. Previous studies have found that non-amnestic [69] and dysexecutive [70] phenotypes, though rare, may be more frequent in African Americans than White Americans. Future work is needed to further clarify these potential differences and test if and how race and ethnicity interact with clinical presentation within the AD spectrum.
These limitations, along with other factors, may have contributed to a final caveat of our findings: there were no cognitive or behavioral assessments that showed greater impairment in bvFTD than bvAD. This is a cross-sectional study, and differences in disease severity may account for some of our findings here. Although groups were matched on disease duration, patients with bvFTD performed better on our measure of disease severity (MMSE). To control for these differences, our analyses covaried for MMSE and age at test. Still, we did not see worse neuropsychological performance in bvFTD compared to bvAD. This is unexpected, given our neuroimaging results, which show decreased anterior hippocampal and inferior frontal volumes in bvFTD compared to bvAD. Perhaps more neuropsychological measures or a larger sample size would reveal relative impairments in bvFTD. Moreover, longitudinal studies are needed to characterize initial domains of impairment in bvAD, and clinical progression as disease spreads.
In summary, our study sought to profile an understudied variant of AD, bvAD, and to improve its discrimination from bvFTD and aAD by outlining the differences in behavioral, cognitive, and neuroanatomical features compared to these syndromes. We found evidence that supports bvAD as a somewhat distinct clinical syndrome, featuring identifiable selection characteristics seen in both bvFTD and aAD. Results revealed that the bvAD group showed more impairment on visuospatial copy and recall and had more agitation than the bvFTD group, and more behavioral and executive impairments with less visuospatial difficulty than aAD. The bvAD group had more posterior temporal-occipital atrophy, while bvFTD patients had more frontal and anterior temporal atrophy. bvAD patients also had more frontotemporal atrophy than aAD. Additionally, there was less anterior hippocampal atrophy in bvAD than bvFTD. Improving our understanding of the associations between pathology and clinical features in these groups will have critical implications for diagnosis, prognosis, caregiver burden, and effective treatment.
ACKNOWLEDGMENTS
The authors would like to give special thanks to the research participants and research specialists at the Penn FTDC and Alzheimer’s Disease Center, who played an instrumental role by contributing to the data collected and analyzed in this study.
This study was funded by National Institute on Aging (R01-AG054519, P01-AG017586, R01-AG066152, P01-AG066597, K01-AG061277), the Alzheimer’s Association (AARF-D-619473, AARF-D-619473-RAPID), and BrightFocus Foundation (A2016244S).
Footnotes
Authors’ disclosures available online (https://www.j-alz.com/manuscript-disclosures/21-5728r1).
REFERENCES
- [1].Alafuzoff I (1992) The pathology of dementias: An overview. Acta Neurol Scand 139, 8–15. [DOI] [PubMed] [Google Scholar]
- [2].Hardy JA, Higgins GA (1992) Alzheimer’s disease: The amyloid cascade hypothesis. Science 256, 184–185. [DOI] [PubMed] [Google Scholar]
- [3].McKhann GM, Knopman DS, Chertkow H, Hyman BT, Jack CR, Kawas CH, Klunk WE, Koroshetz WJ, Manly JJ, Mayeux R, Mohs RC, Morris JC, Rossor MN, Scheltens P, Carrillo MC, Thies B, Weintraub S, Phelps CH (2011) The diagnosis of dementia due to Alzheimer’s disease: Recommendations from the National Institute on Aging-Alzheimer’s Association workgroups on diagnostic guidelines for Alzheimer’s disease. Alzheimers Dement 7, 263–269. [DOI] [PMC free article] [PubMed] [Google Scholar]
- [4].McKhann GM (2011) Changing concepts of Alzheimer disease. JAMA 305, 2458–2459. [DOI] [PubMed] [Google Scholar]
- [5].Binetti G, Magni E, Padovani A, Cappa SF, Bianchetti A, Trabucchi M (1996) Executive dysfunction in early Alzheimer’s disease. J Neurol Neurosur Psychiatry 60, 91–93. [DOI] [PMC free article] [PubMed] [Google Scholar]
- [6].Back-Madruga C, Boone KB, Briere J, Cummings J, McPherson S, Fairbanks L, Thompson E (2002) Functional ability in executive variant Alzheimer’s disease and typical Alzheimer’s disease. Clin Neuropsychol 16, 331–340. [DOI] [PubMed] [Google Scholar]
- [7].Dickerson BC, Wolk DA, Alzheimer’s Disease Neuroimaging Initiative (2011) Dysexecutive versus amnesic phenotypes of very mild Alzheimer’s disease are associated with distinct clinical, genetic and cortical thinning characteristics. J Neurol Neurosurg Psychiatry 82, 45–51. [DOI] [PMC free article] [PubMed] [Google Scholar]
- [8].Mez J, Cosentino S, Brickman AM, Huey ED, Manly JJ, Mayeux R (2013) Faster cognitive and functional decline in dysexecutive versus amnestic Alzheimer’s subgroups: A longitudinal analysis of the National Alzheimer’s Coordinating Center (NACC) Database. PLoS One 8, e65246. [DOI] [PMC free article] [PubMed] [Google Scholar]
- [9].Ossenkoppele R, Pijnenburg YAL, Perry DC, Cohn-Sheehy BI, Scheltens NME, Vogel JW, Kramer JH, Van Der Vlies AE, La Joie R, Rosen HJ, Van Der Flier WM, Grinberg LT, Rozemuller AJ, Huang EJ, Van Berckel BNM, Miller BL, Barkhof F, Jagust WJ, Scheltens P, Seeley WW, Rabinovici GD (2015) The behavioural/dysexecutive variant of Alzheimer’s disease: Clinical, neuroimaging and pathological features. Brain 138, 2732–2749. [DOI] [PMC free article] [PubMed] [Google Scholar]
- [10].Johnson JK, Head E, Kim R, Starr A, Cotman CW (1999) Clinical and pathological evidence for a frontal variant of Alzheimer disease. Arch Neurol 56, 1233–1239. [DOI] [PubMed] [Google Scholar]
- [11].Woodward MC, Jacova C, Black SE, Kertesz A, Mackenzie IR, Feldman H, ACCORD investigator group (2010) Differentiating the frontal variant of Alzheimer’s disease. Int J Geriatr Psychiatry 25, 732–738. [DOI] [PubMed] [Google Scholar]
- [12].Sawyer RP, Rodriguez-Porcel F, Hagen M, Shatz R, Espay AJ (2017) Diagnosing the frontal variant of Alzheimer’s disease: A clinician’s yellow brick road. J Clin Mov Disord 4, 1–9. [DOI] [PMC free article] [PubMed] [Google Scholar]
- [13].Irwin DJ, McMillan CT, Toledo JB, Arnold SE, Shaw LM, Wang L-S, Van Deerlin VM, Lee VMY, Trojanowski JQ, Grossman M (2012) Comparison of cerebrospinal fluid levels of tau and Aβ 1–42 in Alzheimer disease and frontotemporal degeneration using 2 analytical platforms. Arch Neurol 69, 1018–1025. [DOI] [PMC free article] [PubMed] [Google Scholar]
- [14].Craig-Schapiro R, Fagan AM, Holtzman DM (2009) Biomarkers of Alzheimer’s disease. Neurobiol Dis 35, 128–140. [DOI] [PMC free article] [PubMed] [Google Scholar]
- [15].Rascovsky K, Hodges JR, Knopman DS, Mendez MF, Kramer JH, Neuhaus J, Van Swieten JC, Seelaar H, Dopper EGP, Onyike CU, Hillis AE, Josephs KA, Boeve BF, Kertesz A, Seeley WW, Rankin KP, Johnson JK, Gomo-Tempini ML, Rosen HJ, Prioleau-Latham CE, Lee A, Kipps CM, Lillo P, Piguet O, Rohrer JD, Rossor MN, Warren JD, Fox NC, Galasko D, Salmon DP, Black SE, Mesulam M, Weintraub S, Dickerson BC, Diehl-Schmid J, Pasquier F, Deramecourt V, Lebert F, Pijnenburg YAL, Chow TW, Manes F, Grafman J, Cappa SF, Freedman M, Grossman M, Miller BL (2011) Sensitivity of revised diagnostic criteria for the behavioural variant of frontotemporal dementia. Brain 134, 2456–2477. [DOI] [PMC free article] [PubMed] [Google Scholar]
- [16].Drzezga A (2010) Amyloid-plaque imaging in early and differential diagnosis of dementia. Ann Nucl Med 24, 55–66. [DOI] [PubMed] [Google Scholar]
- [17].Shi J, Shaw CL, Du Plessis D, Richardson AMT, Bailey KL, Julien C, Stopford C, Thompson J, Varma A, Craufurd D, Tian J, Pickering-Brown S, Neary D, Snowden JS, Mann DMA (2005) Histopathological changes underlying frontotemporal lobar degeneration with clinicopathological correlation. Acta Neuropathol 110, 501–512. [DOI] [PubMed] [Google Scholar]
- [18].Kertesz A, McMonagle P, Blair M, Davidson W, Munoz DG (2005) The evolution and pathology of frontotemporal dementia. Brain 128, 1996–2005. [DOI] [PubMed] [Google Scholar]
- [19].Forman MS, Farmer J, Johnson JK, Clark CM, Arnold SE, Coslett HB, Chatterjee A, Hurtig HI, Karlawish JH, Rosen HJ, Van Deerlin VM, Lee VMY, Miller BL, Trojanowski JQ, Grossman M (2006) Frontotemporal dementia: Clinicopathological correlations. Ann Neurol 59, 952–962. [DOI] [PMC free article] [PubMed] [Google Scholar]
- [20].de Vugt ME, Verhey FRJ (2013) The impact of early dementia diagnosis and intervention on informal caregivers. Prog Neurobiol 110, 54–62. [DOI] [PubMed] [Google Scholar]
- [21].Pressman PS, Miller BL (2014) Diagnosis and management of behavioral variant frontotemporal dementia. Biol Psychiatry 75, 574–581. [DOI] [PMC free article] [PubMed] [Google Scholar]
- [22].Neary D, Snowden JS, Mann DMA (2000) Classification and description of frontotemporal dementias. Ann N Y Acad Sci 920, 46–51. [DOI] [PubMed] [Google Scholar]
- [23].Peters ME, Schwartz S, Han D, Rabins PV, Steinberg M, Tschanz JT, Lyketsos CG (2015) Neuropsychiatric symptoms as predictors of progression to severe Alzheimer’s dementia and death: The cache county dementia progression study. Am J Psychiatry 172, 460–465. [DOI] [PMC free article] [PubMed] [Google Scholar]
- [24].Adelman RD, Tmanova LL, Delgado D, Dion S, Lachs MS (2014) Caregiver burden: A clinical review. JAMA 311, 1052–1060. [DOI] [PubMed] [Google Scholar]
- [25].Hull M, Berger M, Heneka M (2006) Disease-modifying therapies in Alzheimer’s disease: How far have we come? Drugs 66, 2075–2093. [DOI] [PubMed] [Google Scholar]
- [26].Wong S, Bertoux M, Savage G, Hodges JR, Piguet O, Hornberger M (2016) Comparison of prefrontal atrophy and episodic memory performance in dysexecutive Alzheimer’s disease and behavioral-variant frontotemporal dementia. J Alzheimers Dis 51, 889–903. [DOI] [PubMed] [Google Scholar]
- [27].Perry DC, Brown JA, Possin KL, Datta S, Trujillo A, Radke A, Karydas A, Kornak J, Sias AC, Rabinovici GD, Gorno-Tempini ML, Boxer AL, De May M, Rankin KP, Sturm VE, Lee SE, Matthews BR, Kao AW, Vossel KA, Tartaglia MC, Miller ZA, Seo SW, Sidhu M, Gaus SE, Nana AL, Vargas JNS, Hwang J-HL, Ossenkoppele R, Brown AB, Huang EJ, Coppola G, Rosen HJ, Geschwind D, Trojanowski JQ, Grinberg LT, Kramer JH, Miller BL, Seeley WW (2017) Clinicopathological correlations in behavioural variant frontotemporal dementia. Brain 140, 3329–3345. [DOI] [PMC free article] [PubMed] [Google Scholar]
- [28].Mendez MF, Joshi A, Tassniyom K, Teng E, Shapira JS (2013) Clinicopathologic differences among patients with behavioral variant frontotemporal dementia. Neurology 80, 561–568. [DOI] [PMC free article] [PubMed] [Google Scholar]
- [29].Leger GC, Banks SJ (2014) Neuropsychiatric symptom profile differs based on pathology in patients with clinically diagnosed behavioral variant frontotemporal dementia. Dement Geriatr Cogn Disord 37, 104–112. [DOI] [PMC free article] [PubMed] [Google Scholar]
- [30].Ossenkoppele R, Singleton EH, Groot C, Dijkstra AA, Eikelboom WS, Seeley WW, Miller B, Laforce RJ, Scheltens P, Papma JM, Rabinovici GD, Pijnenburg YAL (2022) Research criteria for the behavioral variant of Alzheimer disease: A systematic review and meta-analysis. JAMA Neurol 79, 48–60. [DOI] [PMC free article] [PubMed] [Google Scholar]
- [31].Pennington C, Hodges JR, Hornberger M (2011) Neural correlates of episodic memory in behavioral variant frontotemporal dementia. J Alzheimers Dis 24, 261–268. [DOI] [PubMed] [Google Scholar]
- [32].Musa G, Slachevsky A, Muñoz-Neira C, Méndez-Orellana C, Villagra R, González-Billault C, Ibáñez A, Hornberger M, Lillo P (2020) Alzheimer’s disease or behavioral variant frontotemporal dementia? Review of key points toward an accurate clinical and neuropsychological diagnosis. J Alzheimers Dis 73, 833–848. [DOI] [PMC free article] [PubMed] [Google Scholar]
- [33].Whitwell JL, Jack CR, Przybelski SA, Parisi JE, Senjem ML, Boeve BF, Knopman DS, Petersen RC, Dickson DW, Josephs KA (2011) Temporoparietal atrophy: A marker of AD pathology independent of clinical diagnosis. Neurobiol Aging 32, 1531–1541. [DOI] [PMC free article] [PubMed] [Google Scholar]
- [34].Irish M, Piguet O, Hodges JR, Hornberger M (2014) Common and unique gray matter correlates of episodic memory dysfunction in frontotemporal dementia and Alzheimer’s disease. Hum Brain Mapp 35, 1422–1435. [DOI] [PMC free article] [PubMed] [Google Scholar]
- [35].Xie SX, Baek Y, Grossman M, Arnold SE, Karlawish JH, Siderowf A, Hurtig HI, Elman L, McCluskey L, Van Deerlin VM, Lee VMY, Trojanowski JQ (2011) Building an integrated neurodegenerative disease database at an academic health center. Alzheimers Dement 7, e84–e93. [DOI] [PMC free article] [PubMed] [Google Scholar]
- [36].Grossman M, Farmer J, Leight S, Work M, Moore P, Van Deerlin V, Pratico D, Clark CM, Coslett HB, Chatterjee A, Gee J, Trojanowski JQ, Lee VMY (2005) Cerebrospinal fluid profile in frontotemporal dementia and Alzheimer’s disease. Ann Neurol 57, 721–729. [DOI] [PubMed] [Google Scholar]
- [37].Geraudie A, Battista P, García AM, Allen IE, Miller ZA, Gorno-Tempini ML, Montembeault M (2021) Speech and language impairments in behavioral variant frontotemporal dementia: A systematic review. Neurosci Biobehav Rev 131, 1076–1095. [DOI] [PMC free article] [PubMed] [Google Scholar]
- [38].Hardy CJD, Buckley AH, Downey LE, Lehmann M, Zimmerer VC, Varley RA, Crutch SJ, Rohrer JD, Warrington EK, Warren JD (2015) The language profile of behavioral variant frontotemporal dementia. J Alzheimers Dis 50, 359–371. [DOI] [PMC free article] [PubMed] [Google Scholar]
- [39].Weintraub S, Besser LM, Dodge HH, Teylan M, Ferris S, Goldstein FC, Giordani B, Kramer JH, Loewenstein D, Marson D, Mungas D, Salmon DP, Welsh-Bohmer K, Zhou X-H, Shirk SD, Atri A, Kukull WA, Phelps CH, Morris JC (2018) Version 3 of the Alzheimer Disease Centers’ Neuropsychological Test Battery in the Uniform Data Set (UDS). Alzheimer Dis Assoc Disord 32, 10–17. [DOI] [PMC free article] [PubMed] [Google Scholar]
- [40].Rabinovici GD, Stephens ML, Possin KL (2015) Executive dysfunction. Contin Lifelong Learn Neurol 21, 646–659. [DOI] [PMC free article] [PubMed] [Google Scholar]
- [41].Price CC, Garrett KD, Jefferson AL, Cosentino S, Tanner JJ, Penney DL, Swenson R, Giovannetti T, Bettcher BM, Libon DJ (2009) Leukoaraiosis severity and list-learning in dementia. Clin Neuropsychol 23, 944–961. [DOI] [PMC free article] [PubMed] [Google Scholar]
- [42].Osterrieth PA (1944) Le test de copie d’une figure complexe; contribution a l’etude de la perception et de la memoire [Test of copying a complex figure; contribution to the study of perception and memory]. Arch Psychol 30, 206–356. [Google Scholar]
- [43].Rey A (1941) L’examen psychologique dans les cas d’encéphalopathie traumatique [The psychological examination in cases of traumatic encepholopathy]. Arch Psychol 28, 215–285. [Google Scholar]
- [44].Lezak MD, Howieson DB, Loring DW, Fischer JS (2004) Neuropsychological assessment, Oxford University Press, USA. [Google Scholar]
- [45].Strauss E, Sherman EMS, Spreen O (2006) A compendium of neuropsychological tests: Administration, norms, and commentary, Oxford University Press, USA. [Google Scholar]
- [46].Cummings JL, Mega M, Gray KF, Rosenberg-Thompson S, Carusi DA, Gornbein J (1994) The Neuropsychiatric Inventory: Comprehensive assessment of psychopathology in dementia. Neurology 44, 2308–2314. [DOI] [PubMed] [Google Scholar]
- [47].Kaufer DI, Cummings JL, Ketchel P, Smith V, MacMillan A, Shelley T, Lopez OL, DeKosky ST (2000) Validation of the NPI-Q, a Brief Clinical Form of the Neuropsychiatric Inventory. J Neuropsychiatry Clin Neurosci 12, 233–239. [DOI] [PubMed] [Google Scholar]
- [48].Conover WJ, Iman RL (1982) Analysis of covariance using the rank transformation. Biometrics 38, 715–724. [PubMed] [Google Scholar]
- [49].Avants BB, Tustison NJ, Stauffer M, Song G, Wu B, Gee JC (2014) The Insight ToolKit image registration framework. Front Neuroinform 8, 1–13. [DOI] [PMC free article] [PubMed] [Google Scholar]
- [50].Tustison NJ, Cook PA, Klein A, Song G, Das SR, Duda JT, Kandel BM, van Strien N, Stone JR, Gee JC, Avants BB (2014) Large-scale evaluation of ANTs and FreeSurfer cortical thickness measurements. Neuroimage 99,166–179. [DOI] [PubMed] [Google Scholar]
- [51].Tustison NJ, Avants BB, Cook PA, Zheng Y, Egan A, Yushkevich PA, Gee JC (2010) N4ITK: Improved N3 Bias Correction Nicholas. IEEE Trans Med Imaging 29, 1310–1320. [DOI] [PMC free article] [PubMed] [Google Scholar]
- [52].Marcus DS, Wang TH, Parker J, Csernansky JC, Morris JC, Buckner RL (2007) Open Access Series of Imaging Studies (OASIS): Longitudinal MRI data in nondemented and demented older adults. J Cogn Neurosci 19, 1498–1507. [DOI] [PubMed] [Google Scholar]
- [53].Avants BB, Tustison NJ, Song G, Cook PA, Klein A, Gee JC (2011) A reproducible evaluation of ANTs similarity metric performance in brain image registration. Neuroimage 54, 2033–2044. [DOI] [PMC free article] [PubMed] [Google Scholar]
- [54].Klein A, Andersson J, Ardekani BA, Ashburner J, Avants BB, Chiang M-C, Christensen GE, Collins DL, Gee JC, Hellier P, Song JH, Jenkinson M, Lepage C, Rueckert D, Thompson P, Vercauteren T, Woods RP, Mann JJ, Parsey RV (2009) Evaluation of 14 nonlinear deformation algorithms applied to human brain MRI registration. Neuroimage 46, 786–802. [DOI] [PMC free article] [PubMed] [Google Scholar]
- [55].Han X, Jovicich J, Salat D, van der Kouwe A, Quinn B, Czanner S, Busa E, Pacheco J, Albert M, Killiany R, Maguire P, Rosas D, Makris N, Dale A, Dickerson BC, Fischl B (2006) Reliability of MRI-derived measurements of human cerebral cortical thickness: The effects of field strength, scanner upgrade and manufacturer. Neuroimage 32, 180–194. [DOI] [PubMed] [Google Scholar]
- [56].Gronenschild EHBM, Habets P, Jacobs HIL, Mengelers R, Rozendaal N, van Os J, Marcelis M (2012) The effects of FreeSurfer version, workstation type, and Macintosh operating system version on anatomical volume and cortical thickness measurements. PLoS One 7, e38234. [DOI] [PMC free article] [PubMed] [Google Scholar]
- [57].Schwarz CG, Gunter JL, Wiste HJ, Przybelski SA, Weigand SD, Ward CP, Senjem ML, Vemuri P, Murray ME, Dickson DW, Parisi JE, Kantarci K, Weiner MW, Petersen RC, Jack CR (2016) A large-scale comparison of cortical thickness and volume methods for measuring Alzheimer’s disease severity. Neuroimage Clin 11, 802–812. [DOI] [PMC free article] [PubMed] [Google Scholar]
- [58].Xie L, Wisse LEM, Das SR, Wang H, Wolk DA, Manjón JV, Yushkevich PA (2016) Accounting for the confound of meninges in segmenting entorhinal and perirhinal cortices in T1-weighted MRI. Med Image Comput Comput Assist Interv 9901, 564–571. [DOI] [PMC free article] [PubMed] [Google Scholar]
- [59].Xie L, Wisse LEM, Pluta J, de Flores R, Piskin V, Manjón JV, Wang H, Das SR, Ding S-L, Wolk DA, Yushkevich PA (2019) Automated segmentation of medial temporal lobe subregions on in vivo T1-weighted MRI in early stages of Alzheimer’s disease. Hum Brain Mapp 40, 3431–3451. [DOI] [PMC free article] [PubMed] [Google Scholar]
- [60].Yushkevich PA, Plutaa JB, Wange H, Xiea L, Ding S-L, Gertjeb EC, Mancuso L, Kliotb D, Das SR, Wolk DA (2015) Automated volumetry and regional thickness analysis of hippocampal subfields and medial temporal cortical structures in mild cognitive impairment. Hum Brain Mapp 36, 258–287. [DOI] [PMC free article] [PubMed] [Google Scholar]
- [61].Winkler AM, Ridgway GR, Webster MA, Smith SM, Nichols TE (2014) Permutation inference for the general linear model. Neuromage 92, 381–397. [DOI] [PMC free article] [PubMed] [Google Scholar]
- [62].Smith SM, Nichols TE (2009) Threshold-free cluster enhancement: Addressing problems of smoothing, threshold dependence and localisation in cluster inference. Neuroimage 44, 83–98. [DOI] [PubMed] [Google Scholar]
- [63].Libon DJ, Bondi MW, Price CC, Melissa Lamar 4 Joel Eppig, Wambach DM, Nieves C, Delano-Wood L, Giovannetti T, Lippa C, Kabasakalian A, Cosentino S, Swenson R, Penney DL (2011) Verbal serial list learning in mild cognitive impairment: A profile analysis of interference, forgetting, and errors. J Int Neuropsychol Soc 17, 905–914. [DOI] [PMC free article] [PubMed] [Google Scholar]
- [64].Fastenau PS, Denburg NL, Hufford BJ (1999) Adult norms for the Rey-Osterrieth Complex Figure Test and for supplemental recognition and matching trials from the Extended Complex Figure Test. Clin Neuropsychol 13, 30–47. [DOI] [PubMed] [Google Scholar]
- [65].Therriault J, Pascoal TA, Savard M, Benedet AL, Chamoun M, Tissot C, Lussier F, Kang MS, Thomas E, Terada T, Rej S, Massarweh G, Nasreddine Z, Vitali P, Soucy JP, Saha-Chaudhuri P, Gauthier S, Rosa-Neto P (2021) Topographic distribution of amyloid-β, tau, and atrophy in patients with behavioral/dysexecutive Alzheimer disease. Neurology 96, e81–e92. [DOI] [PMC free article] [PubMed] [Google Scholar]
- [66].Buckner RL, Sepulcre J, Talukdar T, Krienen FM, Liu H, Hedden T, Andrews-Hanna JR, Sperling RA, Johnson KA (2009) Cortical hubs revealed by intrinsic functional connectivity: Mapping, assessment of stability, and relation to Alzheimer’s disease. J Neurosci 29, 1860–1873. [DOI] [PMC free article] [PubMed] [Google Scholar]
- [67].Lehmann M, Rohrer JD, Clarkson MJ, Ridgway GR, Scahill RI, Modat M, Warren JD, Ourselin S, Barnes J, Rossor MN, Fox NC (2010) Reduced cortical thickness in the posterior cingulate gyrus is characteristic of both typical and atypical Alzheimer’s disease. J Alzheimers Dis 20, 587–598. [DOI] [PubMed] [Google Scholar]
- [68].Förster S, Teipel S, Zach C, Rominger A, Cumming P, la Fougere C, Yakushev I, Haslbeck M, Hampel H, Bartenstein P, Bürger K (2010) FDG-PET mapping the brain substrates of visuo-constructive processing in Alzheimer’s disease. J Psychiatr Res 44, 462–469. [DOI] [PubMed] [Google Scholar]
- [69].He J, Farias S, Martinez O, Reed B, Mungas D, Decarli C (2009) Differences in brain volume, hippocampal volume, cerebrovascular risk factors, and apolipoprotein E4 among mild cognitive impairment subtypes. Arch Neurol 66, 1393–1399. [DOI] [PMC free article] [PubMed] [Google Scholar]
- [70].Mez J, Cosentino S, Brickman A, Huey E, Manly J, Mayeux R (2013) Dysexecutive versus amnestic Alzheimer disease subgroups: Analysis of demographic, genetic, and vascular factors. Alzheimer Dis Assoc Disord 27, 218–225. [DOI] [PMC free article] [PubMed] [Google Scholar]
- [71].Borroni B, Agosti C, Bellelli G, Padovani A (2008) Is early-onset clinically different from late-onset frontotemporal dementia? Eur J Neurol 15, 1412–1415. [DOI] [PubMed] [Google Scholar]
- [72].Ratnavalli E, Brayne C, Dawson K, Hodges JR (2002) The prevalence of frontotemporal dementia. Neurology 58, 1615–1621. [DOI] [PubMed] [Google Scholar]
- [73].Snowden JS, Neary D, Mann DMA (2002) Frontotemporal dementia. Br J Psychiatry 180, 140–143. [DOI] [PubMed] [Google Scholar]
- [74].Vraamark Elberling T, Stokholm J, Høgh P, Waldemar G (2002) Diagnostic profile of young and middle-aged memory clinic patients. Neurology 59, 1259–1262. [DOI] [PubMed] [Google Scholar]