

Abstract
Pharmacokinetic data of gabapentin (GBP) in community-dwelling elderly patients show a significant effect of advanced age on GBP pharmacokinetics due to altered renal function. However, there are no data in elderly nursing home (NH) patients to evaluate gabapentin absorption and elimination. Our objective was to characterize the pharmacokinetics of GBP in elderly nursing home patients maintained on GBP therapy. This was a prospective pharmacokinetic study in elderly nursing home patients (≥ 60 years) receiving GBP for the management of chronic pain or epilepsy from seven nursing homes. Pharmacokinetic parameters were estimated by nonlinear mixed effects modeling. A one-compartment model described the data and clearance (CL) was associated with estimated glomerular filtration rate (eGFR) (p<0.0001). The GBP CL in elderly nursing home patients was 2.93 L/hr. After adjusting for the effect of GFR, GBP CL was not affected by age, sex, body weight or comorbidity scores. No significant effects of body size measures, age and sex were detected on volume of distribution. Dose-dependent bioavailability of GBP was demonstrated, and the saturable absorption profile was described by a nonlinear hyperbolic function. Prediction-corrected visual predictive check (pc-VPC) suggests adequate fixed and random effects models that successfully simulated the mean trend and variability in gabapentin concentration-time profiles. In this analysis the parameters of the hyperbolic nonlinearity appear to be similar between elderly and younger adults.
Keywords: Nursing home, elderly patients, gabapentin, saturable absorption
INTRODUCTION
Approximately 10% of nursing home patients are prescribed anti-seizure medication for both treatments of epilepsy and other indications such as neuropathic pain (1, 2). Chronic pain affects approximately 50% of community-dwelling elderly and over 80% of nursing home residents (3–6). Gabapentin (GBP) has low protein binding, is not significantly metabolized by the liver, and is principally eliminated unchanged by excretion in the urine resulting in very few clinically relevant drug-drug interactions. The lack of clinically relevant drug interactions makes this medication a candidate for use in a complicated patient population who are often taking multiple medications (7). GBP pharmacokinetics has been studied in adult and community-dwelling elderly patients with epilepsy (8–11). However, no information is available to guide the dosing of GBP in elderly nursing home patients, a population that is frailer and has multiple medical problems.
There are several pharmacokinetic considerations that may influence GBP use in elderly patients. GBP has dose-dependent saturable absorption that has been observed across the usual clinical dose range (up to 2400 to 3600 mg/day). Thus, upon increasing dose, steady-state plasma concentration increases in a less-than- dose-proportional manner due to the saturation of the l-amino acid transport system across the gut (8, 12, 13). Age-related changes in gut physiology may alter the absorption profile of GBP in the geriatric population. Consistent with this notion, a decrease in the absorption of other active transporter substrates, such as vitamin B12, iron and glucose have been observed in people of older age (14–16). GBP is also excreted unchanged in the urine leading to the necessity of dosage adjustments in patients with renal impairment. Since renal clearance is thought to decrease by up to 1% per year after the age of 40, (17, 18) reduced GBP clearance would be expected in older people. This is consistent with the findings from a previous study of GBP in healthy subjects (20–78 years) that recommended a reduction in GBP dosage in elderly patients due to reduced renal function (9). In this study, we performed a population analysis of GBP in elderly nursing home patients to characterize the pharmacokinetic and absorption profile of GBP and identify important physiologic determinants of GBP disposition in this population.
MATERIALS AND METHODS
Subjects
The study was approved by the University of Minnesota and University of California, San Francisco institutional review boards. Informed consent was obtained and a consent form signed by participants or their designated agent before enrollment. Nursing home residents who were at least 60 years of age were recruited from seven nursing homes located in Minnesota and California. Included patients were diagnosed with chronic pain, epilepsy or both conditions. Residents who were on the same dose of GBP for at least four weeks (assumed to be at steady state), in the facility for at least 2 months, and on a stable dose of co-medications were enrolled.
Study Design and Collection of Samples
The study was designed to include four visits per subject on a stable dose of GBP at intervals of approximately 4 weeks between visits. If a dose change occurred, the study period was extended in order to obtain four visits at the same dose. At each visit, blood samples (convenience samples) were collected at the time of visit for the measurement of GBP concentration. Demographic, pharmacy related, and medical data were reviewed at 6 months prior to visit one and between each visit. Information about race, ethnicity, sex, height, weight and medical history was collected at the first visit. In addition, a Charlson comorbidity index (CCI) and age-comorbidity index (ACI) were calculated at each visit (19, 20).
Measurement of Gabapentin Concentrations
Plasma concentrations of GBP were analyzed by LC-MS. The assay was validated in our laboratory with 2H4-gabapentin (GBP-d4, Toronto Research Chemicals, North York, Canada) as the internal standard. All samples from an individual were assayed at the same time along with a six-concentration standard curve (linear range 0.27 – 21.35 μg(mL) and low, medium, and high concentrations of quality control samples. The assay had precisions of <5% and <10% at the upper and lower limits of quantification, respectively.
Pharmacokinetic Analysis
The population pharmacokinetic analysis consisted of nonlinear mixed effects modeling with NONMEM (version 7.3, ICON Development Solutions, Ellicot City, MD, U.S.A.). A one-compartment model was tested. The model was parameterized in terms of clearance (CL), volume of distribution (V) and a first- order absorption rate constant (Ka). The between-subject variability was estimated through an exponential error model and expressed as coefficient of variation (CV). Different error models were tested to account for the residual unexplained variability including an exponential, proportional, additive, and combined proportional and additive model.
After establishing the base pharmacokinetic model, covariate models were developed. Covariates were tested in a univariate manner for their effect on GBP CL and included race, creatinine clearance based on the Cockroft-Gault equation (CLcr) and estimated glomerular filtration rate (eGFR). The eGFR was calculated according to the Modification of Diet in Renal Disease (MDRD) equation (21, 22). Body weight, BSA, age and sex were tested for their effect on the volume of distribution. Continuous covariates were evaluated using the power model while the covariate was standardized to its median value in the NH subjects. Categorical covariates were examined through a multiplicative model in order to obtain the associated fractional change in the pharmacokinetic parameter.
Bioavailability (F) has been reported to be nonlinear (8, 13, 23). In these models, bioavailability was calculated as a function of dose (D) or total daily dose (TDD). We were interested in comparing Dose and TDD on bioavailability; and if the elderly have different saturable absorption parameters compared to literature reported values in younger adults. The hyperbolic function for TDD is shown in equation 1 (8, 13).
Where Dmax (mg/day) is the maximum amount absorbed in 24 hours and D50 (mg/day) is the total daily dose at which the absorption process is half-saturated. Alternatively, TDD is replaced by the individual doses and Dmax (mg) is the maximum amount absorbed and the D50 (mg) is the individual dose at which the absorption process is half-saturated.
Covariate modeling was guided by visual examination of the plots of variability in the pharmacokinetic parameters versus covariate values, improvement in the model diagnostic plots (observed versus predicted GBP concentration and conditional weighted residuals versus time) after inclusion of the covariate, plausibility of the parameter estimates, and the statistical significance using a likelihood ratio test for nested models (LRT; forward inclusion, χ2, p≤0.05, df = 1; backward elimination, χ2, p≤0.01, df = 1). The Akaike Information Criterion (AIC) was used to compare non-nested models.
Evaluation of the Pharmacokinetic Model
The pharmacokinetic model was qualified by means of prediction-corrected visual predictive check (pc-VPC) (24). Moreover, the precision of the parameter estimates from the final model was determined using bootstrap analysis.
RESULTS
A total of 263 plasma concentrations obtained from 75 patients were included in this analysis. A majority of the study subjects were diagnosed with chronic pain conditions (77%) with 17% having both pain and epilepsy. One subject (2%) was diagnosed with epilepsy only and 3 subjects (5%) had missing diagnoses. Pain conditions included neck and shoulder pain, multiple joint pain, polymyalgia rheumatica, and neuropathic pain. Each resident was followed for a period of approximately 4 months (mean 4.2 months, SD 1.2). Analgesic co-medications included acetaminophen, aspirin, and opioids (hydromorphone, oxycodone, methadone, tramadol and fentanyl patches). Patient characteristics are shown in Table I.
Table I.
Summary of the subject characteristics and variables included in the model development dataset
| Characteristic | Median (range) Number |
|---|---|
| Number of subjects | 75 |
| 76.4 (39.1- | 76.4 (39.1 – 168.6) |
| Height (cm) | 162.6 (142.2 – 190.5) |
| BSA (m2) | 1.83 (1.38 – 2.60) |
| Body Mass Index (kg/m2) | 27.5 (14.2 – 60.0) |
| Age (years) | 79.0 (61.0 – 98.0) |
| Sex (Men/Women) | 20/55 |
| Race (Caucasian/African American or Black/more than one race/unknown) | 65/8/1/1 |
| Daily Dose of GBP (mg) | 600 (50 – 3000) |
| Doses per day | 3 (1 – 4) |
| eGFR (ml/min/1.73 m2)a | 65.5 (13.7 – 262.1) |
| eGFR (ml/min)b | 68.6 (16.4 – 296.6) |
| CLcr (ml/min)c | 56.6 (16.3 – 285.9) |
| Charlson Comorbidity Indexd | 2 (0 – 9) |
| Age-comorbidity Indexe | 6 (2 – 14) |
BSA= body surface area calculated using DuBois, et al’s formula, (31).
eGFR= the estimated glomerular filtration rate calculated using the abbreviated MDRD study equation (21, 22).
eGFR (ml/min)= the individualized GFR estimate calculated by multiplying the eGFR by the individual’s BSA and dividing by 1.73 m2.
CLcr= creatinine clearance based on the Cockrauft Gault equation (31).
Calculated using the method described by Charlson ME, et al.
Calculated using the methodology described by Charlson ME, et al.
Pharmacokinetic and Covariate Models
The pharmacokinetic model was a one-compartment model with first-order absorption and elimination. Residual unexplained variability was best described by a proportional error model. Due to the limited observations in the absorption phase, estimation of Ka resulted in a highly unstable model and failure of convergence with unreasonable parameter estimates during step-wise covariate model development. Thus, Ka was fixed to a previously reported value (0.778 h−1) (13).
A scatter plot of ETAs of CL versus GFR (mL/min) showed a strong non-linear relationship between GFR and GBP CL (data not shown). A similar type and pattern of relationship between the random effects of GBP CL and the CG-based CLcr were observed (results not shown). When modeled, the effect on GBP CL using GFR resulted in much lower AIC values compared to the model using CG-CLcr. Therefore, the MDRD-based GFR was used for further model development. Accounting for the effect of GFR (ml/min) on the GBP CL resulted in a significant drop in the objective function value, reduced the between-subject variability on CL, and significantly improved the model fit diagnostics.
After adjusting for the effect of GFR, GBP CL was not affected by age, sex, body weight or other body size measures. Gabapentin clearance tended to decrease with increasing comorbidity scores, however, the trend was weak and the effect did not reach statistical significance; thus, comorbidity measures were not included in the CL model. Body size measures, age and sex were further tested for their potential effect on volume of distribution, but no significant effects were detected. Table II provides the final parameter estimates.
Table II.
Pharmacokinetic Model Equations, Parameter Estimates and Bootstrap Confidence Intervals (C.I.)
| Parameter | NONMEM analysis | Boostrap Analysis | |
|---|---|---|---|
| Estimate (%RSE) | Median | 95% CI | |
| CL (L/h) | (4.1) | 2.92 | |
| θeGFR | 0.893 (7.9) | 0.887 | 0.740–1.03 |
| Vc (L) | 71.2 (28.8) | 70.4 | 44.5–143 |
| Ka (hr−1) | 0.778 FIXED | -- | -- |
| BSV1* of CL (%CV) | 28.7 (9.8); Shrinkage=14.8 | 28.4 | 22.4–34.6 |
| BSV of Vc (%CV) | 126.8 (20.6); Shrinkage=47.2 | 123 | 45.0–279 |
%RSE, percent relative standard error; CL, clearance; Vc, central volume of distribution; Ka, first order absorption rate constant; BSV, between subject variability; RUV, residual unexplained variance.
Reported as %CV, calculated using the equation:
Reported as %CV, calculated using the equation:
Across the tested models, total daily dose as shown in equation 1 was found to better describe bioavailability in this population compared to individualized dose based on AIC. We compared published bioavailability parameters versus estimating these values in our dataset. Models that estimated Dmax and D50 resulted in a high condition number (>10,000) and high correlations from the covariance matrix in several parameters indicating model instability. Therefore, we fixed Dmax and D50 to literature values from Gidal et al (Dmax and D50 of 2720 and 4080, respectively). There was no difference in model fits when both parameters were fixed to the estimates from the younger adult subjects or when estimated in our elderly patients and indications of model instability were no longer present. Hence our bioavailability model used TDD with the Dmax and D50 fixed to the literature values of Gidal et al.
Pharmacokinetic Model Evaluations
Final model equations, parameter estimates, bootstrap confidence intervals and goodness-of-fit (GOF) plots are shown in Table II and Figure 1, respectively. The model parameters were precisely estimated with minimal bias as shown by the median and 95 percentile bootstrap confidence intervals compared to NONMEM estimates. Prediction-corrected VPC suggests adequate fixed and random effects models that successfully simulated the mean trend and variability in gabapentin concentration-time profiles (Figure 2).
Fig 1.
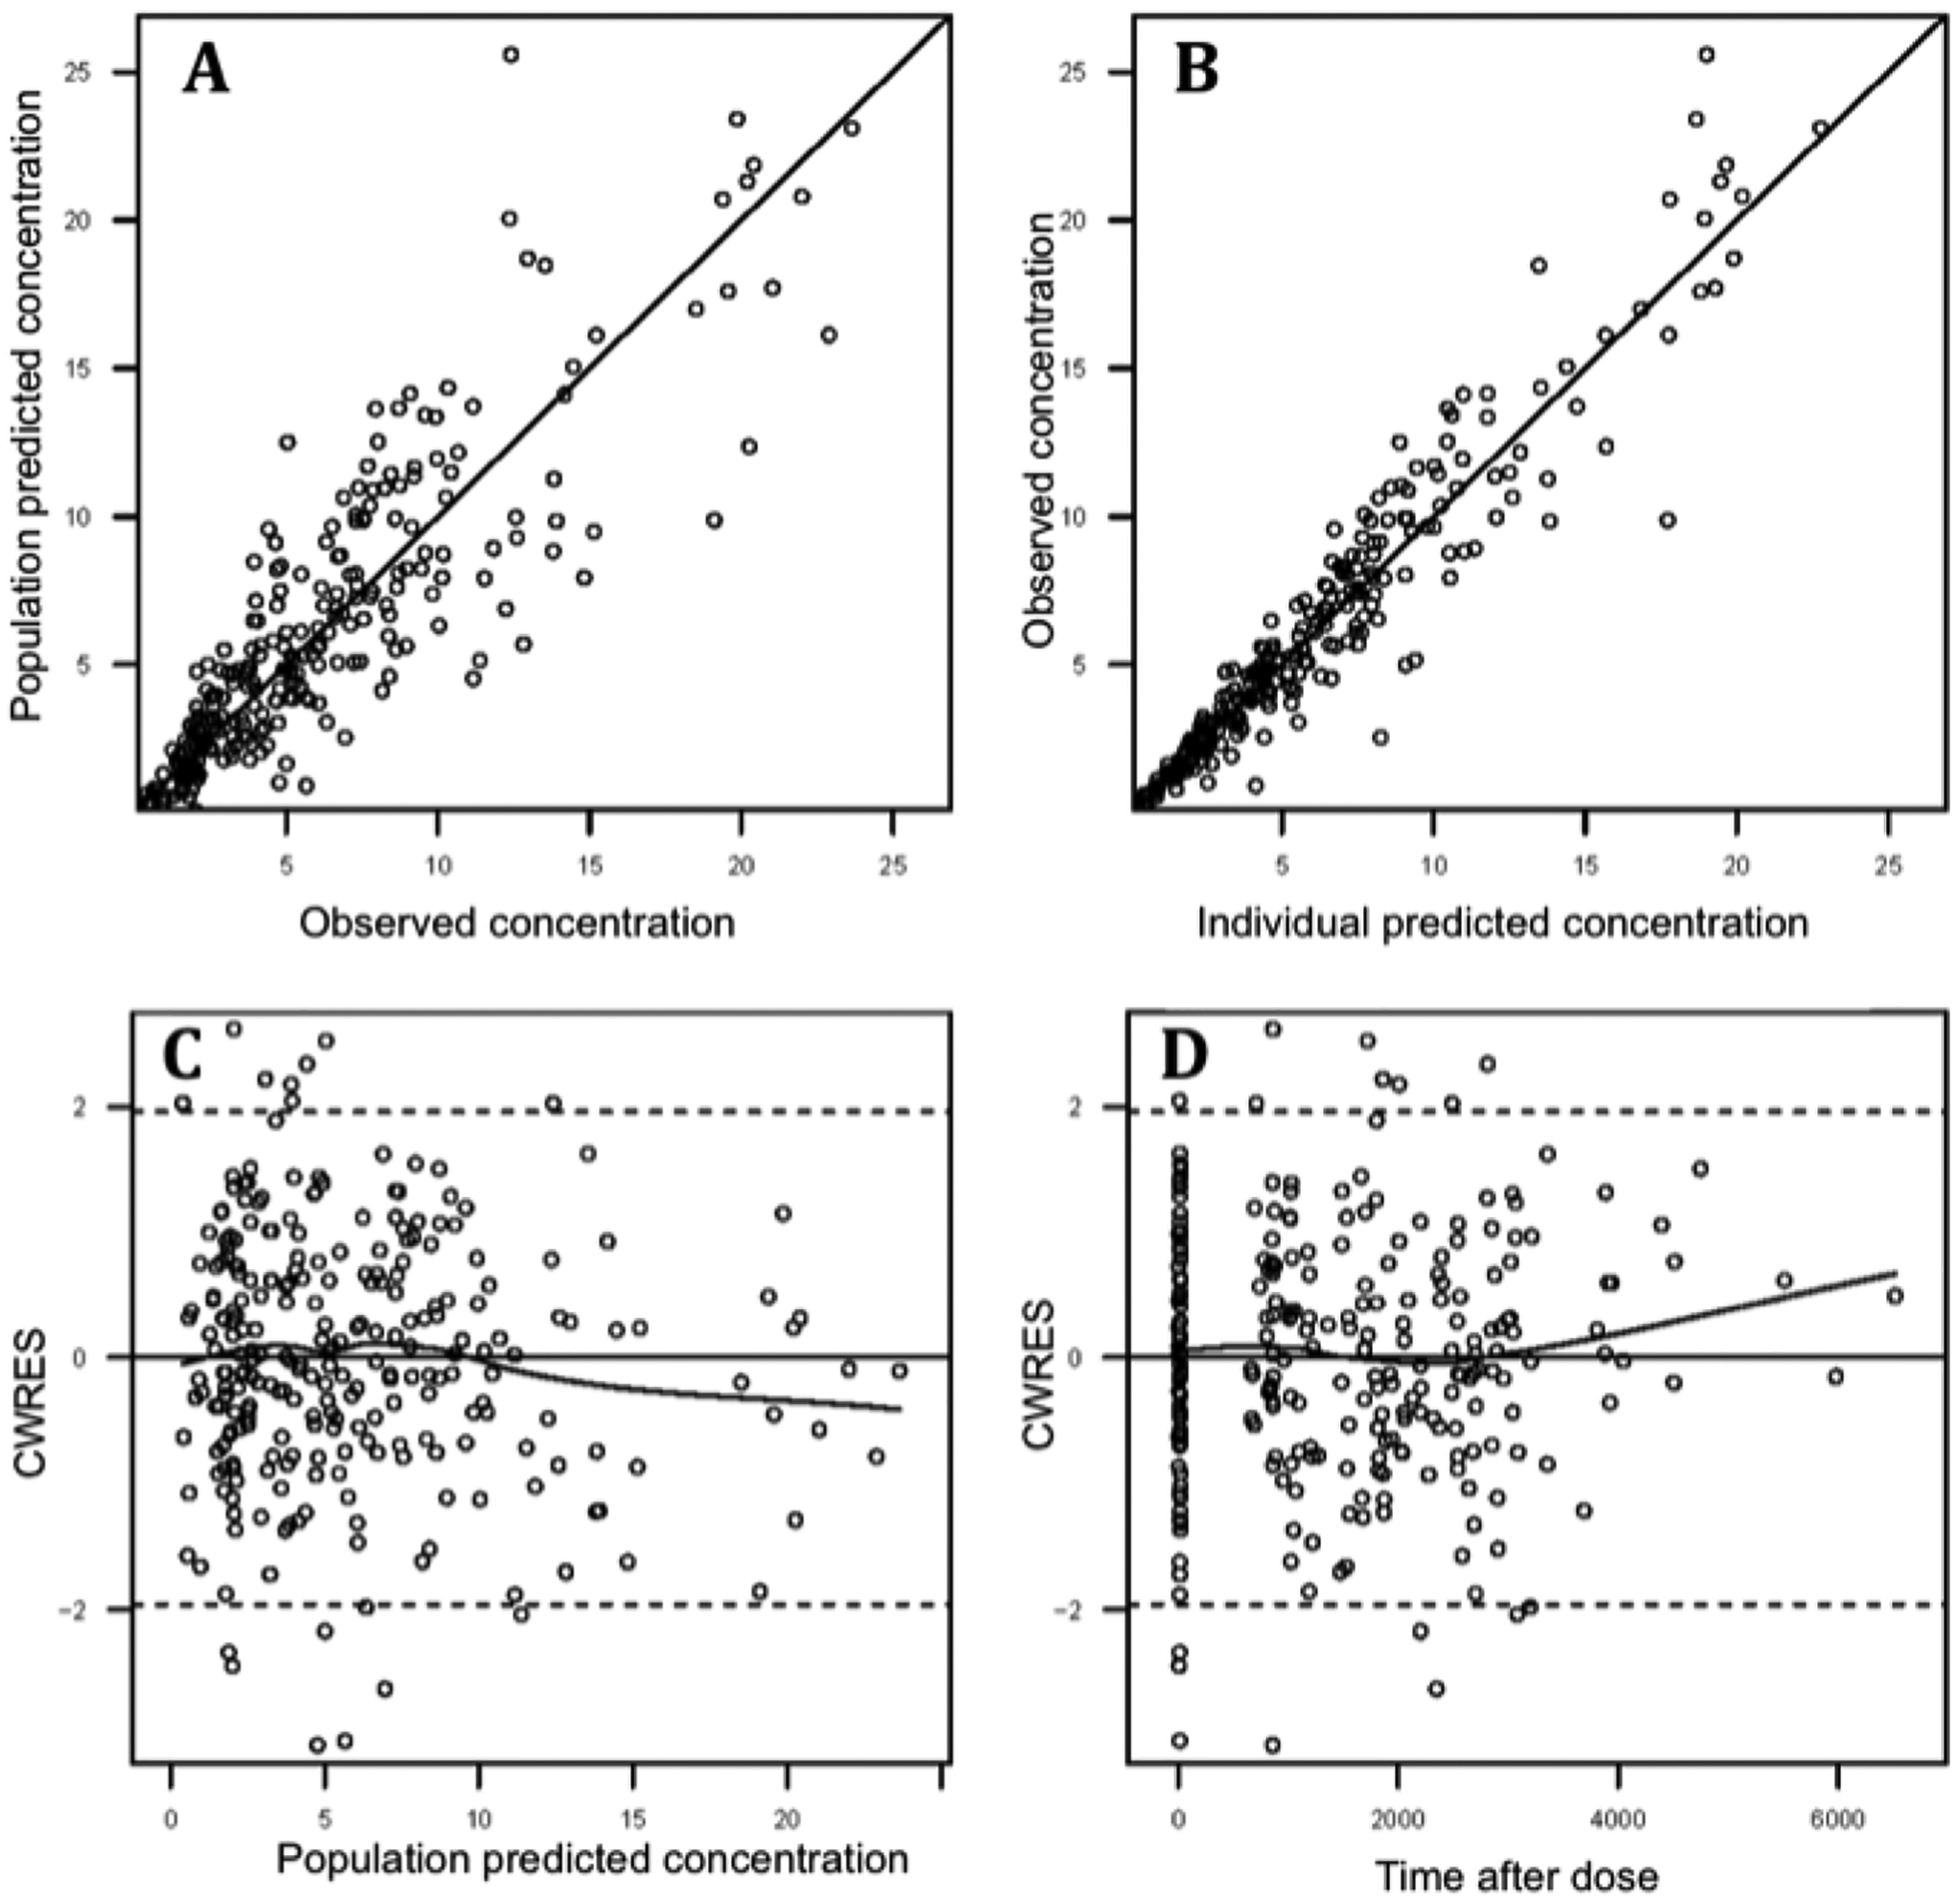
Goodness-of-fit plots for the final population pharmacokinetic model. (A) Observed versus population-predicted GBP concentration. (B) Observed versus individual-predicted GBP concentration. (C) Scatter plot of conditional weighted residuals (CWRES) versus population-predicted GBP concentration. (D) Scatter plot of CWRES versus time.
Fig 2.
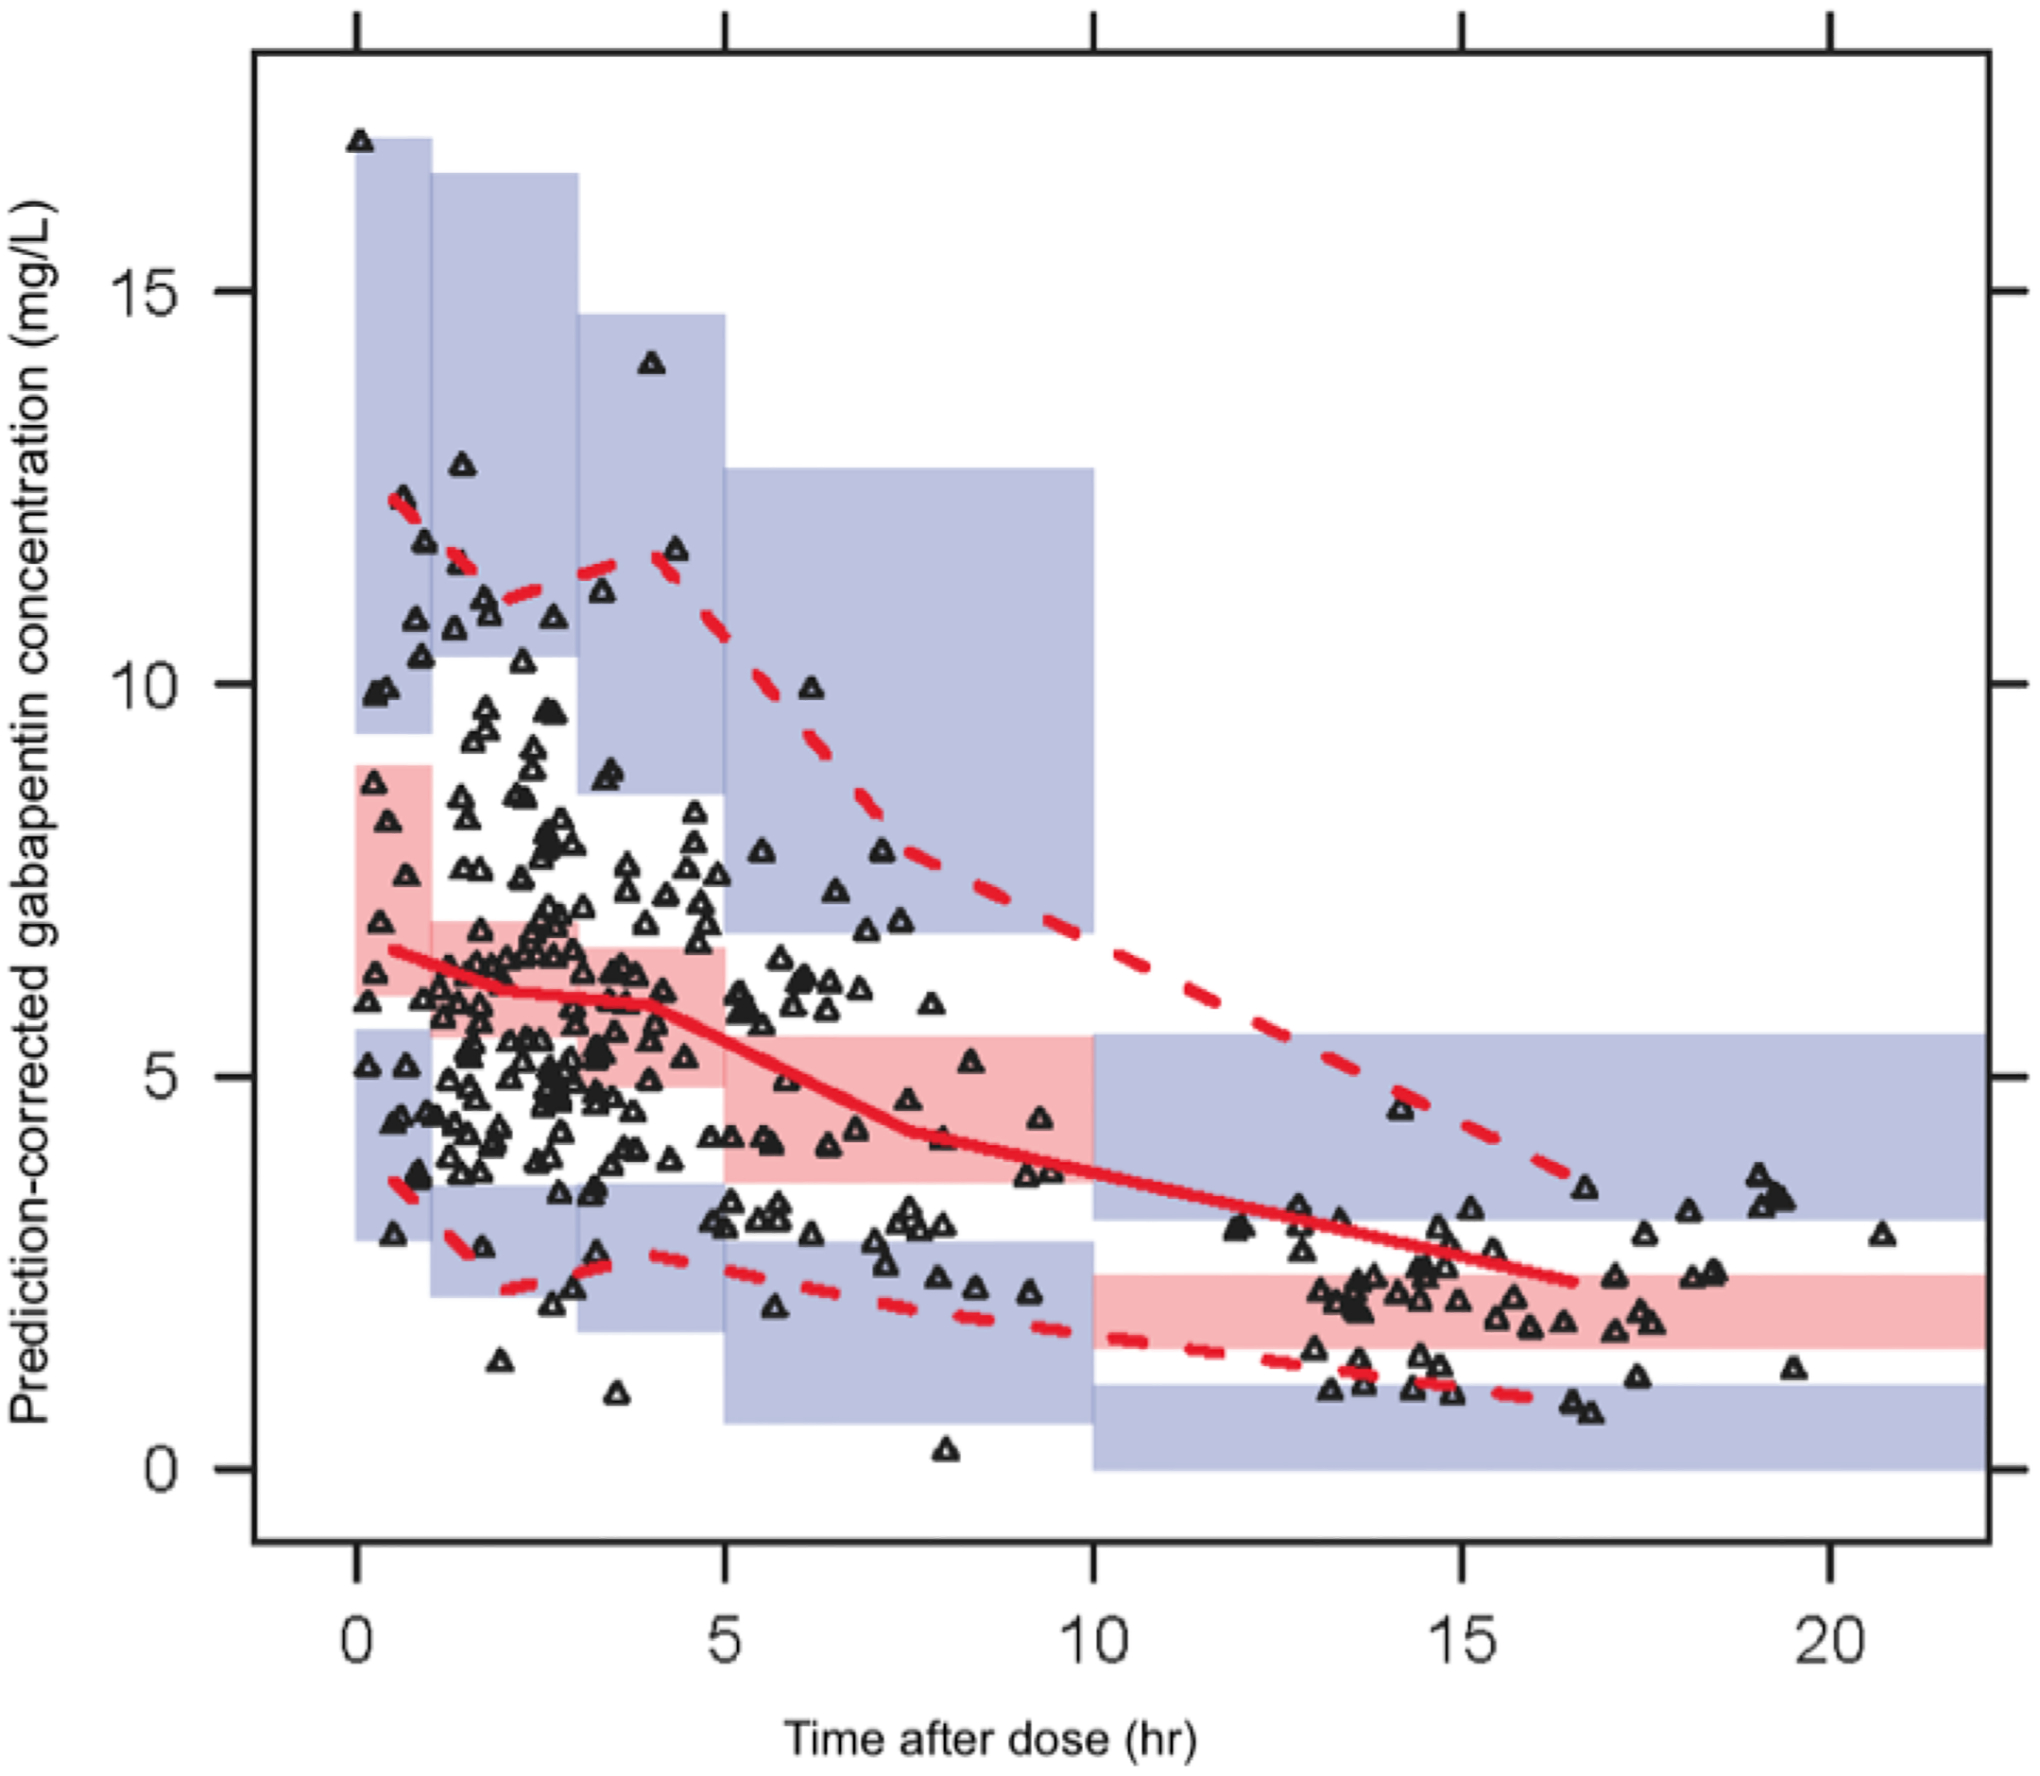
Prediction-corrected visual predictive check plot of observed GBP concentration versus time. Graph presenting the prediction corrected visual predictive check. The solid line represents the median and the dotted line the observed 5th and 95th percentile. the shaded red area the 95% CI around the median and the shaded blue the 95% CI for the 5gh and 95th percentile
DISCUSSION
The major results from this study of GBP pharmacokinetics in elderly nursing home patients are that the clearance of GBP is correlated with kidney function with no additional statistically significant effect of age, sex, body weight or comorbidity scores after accounting for the effect of GFR. Dose-dependent bioavailability of GBP was demonstrated, and the saturable absorption profile was described by a nonlinear hyperbolic function. In this analysis the parameters of the hyperbolic nonlinearity appear to be similar between elderly and younger adults.
The GBP clearance in our population was 2.93 L/hr. Similarly our GBP clearance value is considerably lower than the GBP clearance values of 6.3 and 9.2 L/hr reported in healthy volunteers and younger patients with neuropathic pain and normal renal function, respectively (8, 13). As expected for a drug cleared primarily by renal excretion, a strong association between GBP CL and estimated GFR was demonstrated. Estimated GFR using the MDRD equation was found to better explain inter-subject variability in GBP CL than the CG-based CLcr. This could possibly be attributed to the MDRD method accounting for the effect of race on eGFR (approximately 20% higher in African American/Black) - a missing factor from the CG equation. Indeed, a previous analysis of GBP pharmacokinetics in community- dwelling elderly patients found both CG-based CLcr and race to have a significant effect on GBP CL (11). GBP CL was 28% higher in African American/Black compared to Caucasian elderly subjects and people of other races; an effect which is consistent with the increase in eGFR due to American/Black race. Therefore, we chose to account for the effect of renal function through MDRD-based GFR, since it was likely that any effect of race on GBP CL is mediated through its correlation to renal function. The estimated volume of distribution in the nursing home elderly patients (71.2 L) was larger to reported estimates in younger adults (45.4 L) (13). A GBP clearance that is proportionately lower (32–46%) than the volume of distribution (63%) results in a longer half-life of GBP in the NH elderly compared to the younger populations. Based on the pharmacokinetic model, the calculated half-life of GBP in a normal renal function nursing home subject is 13.3 hours which is approximately two-fold higher than reported half-lives of 5 and 7 hours in younger healthy subjects. Advanced age and prevalent comorbidities in nursing home elderly patients may contribute to decreased drug clearance and prolonged half-life even in patients with comparable renal function to healthy younger adults. We tested for a potentially independent effect of age and comorbidity scores on GBP CL and found a trend of lower GBP CL in subjects with higher comorbidity scores; however, the association was not statistically significant. The limited age range (61 to 98 years) in this population could have resulted in decreased power to detect a residual age effect on CL. A retrospective study of GBP trough concentrations collected from 66 subjects with wider age range than our study (5–84 years) found elderly patients (>65 years) to have a two-fold higher GBP concentration-to-dose-ratio than that of younger adults, and recommended that GBP dose be reduced by half to achieve similar concentration (25). However, measures of renal function were not available in this study and the conclusion was mainly driven by differences in exposure without reference to efficacy or safety implications in the two populations. In a pooled analysis of two placebo-controlled phase 3 studies, elderly patients (≥75 years; n = 192) with postherpetic neuralgia were found to have similar efficacy (reduction in baseline-adjusted average daily pain score in ≥75 /<75: −34.2 %/−38.3 %) to younger patients (<75 years; n = 527) after a once-daily GBP dose of 1800 mg (26). In this study, the mean (SD) CLcr in the elderly and younger adult subjects were 65.4 (13.7) and 95.6 (48) mL/min, respectively These differences in renal function would predict higher GBP concentration in the elderly patients compared to younger adults; however, the study also reported similar occurrence and pattern of adverse events in the two populations. Thus, despite the expected difference in exposure, the safety and efficacy of GBP were not affected by age of the patient.
Gabapentin is absorbed from the gut by a saturable l-amino acid transporter that is hypothesized to be responsible for the dose-dependent bioavailability of GBP (12, 27). Other mechanisms of absorption could be involved at higher doses (up to 6000 mg/day) as both the area under the plasma concentration-time curve (AUC) and serum concentration continue to linearly increase at such high doses (28, 29). In agreement with a saturable absorption process, we found the bioavailability of GBP to decrease in a nonlinear manner with increasing dose. It is of interest that we see a significant difference with either individual dose or TDD. It is intuitive that individual dose would contribute to the saturation of a transporter more than a daily dose; however, when we compared our model with both single and total daily doses TDD was a stronger predictor of GBP F than dose. This may reflect that TDD is a surrogate of GBP dosing regimen (dose and frequency of administration) and therefore, cumulative doses. With the reported longer gastric transit time in the elderly as compared to younger adults (30), a variable that accounts for the cumulative amount of the drug in the gut, such as TDD, would explain why it better predicts F in the nursing home population than individual dose.
CONCLUSION
This analysis characterized the pharmacokinetics of GBP in elderly nursing home patients. Similar to previous findings in other populations, GBP CL was strongly correlated with glomerular filtration rate. The bioavailability of GBP decreased in a nonlinear manner with increasing GBP daily doses. These data suggest that there may be a carryover dose effect in this population. Therefore, an increase in drug exposure (i.e., increasing the TDD) is achieved just as well by increasing individual doses as increasing the number of dose administrations. Results from this study indicate that GFR be measured as a marker of renal function and then used to assess the initial target dosage of GBP. However, since measuring GFR in special populations may not be accurate with the conventional methods used in the clinic, measurement of periodic concentrations to verify drug exposure after reaching steady state dosing is still recommended.
Future studies of a wider age range population should be considered to investigate the potential for an independent age-related effect beyond the known age-related decrease in eGFR on CL and investigate potential co-morbidity influences on GBP exposure. Ultimately, the impact of higher exposure on safety and efficacy of GBP would be required to assess if a dose reduction is warranted in the elderly population.
ACKNOWLEDGEMENTS:
This project was supported by grant number 5R01AG026390 from the National Institute on Aging. The content is solely the responsibility of the authors and does not necessarily represent the official views of NIA or the National Institutes of Health.
REFERENCES
- 1.Lackner TE, Cloyd JC, Thomas LW, Leppik IE. Antiepileptic drug use in nursing home residents: Effect of age, gender, and comedication on patterns of use. Epilepsia. 1998. Oct;39(10):1083–7. [DOI] [PubMed] [Google Scholar]
- 2.Garrard J, Cloyd J, Gross C, Hardie N, Thomas L, Lackner T, Graves N, Leppik I. Factors associated with antiepileptic drug use among elderly nursing home residents. J Gerontol A Biol Sci Med Sci. 2000. Jul;55(7):M384–92. [DOI] [PubMed] [Google Scholar]
- 3.Tsai YF, Liu LL, Chung SC. Pain Prevalence, Experiences, and Self-Care Management Strategies Among the Community-Dwelling Elderly in Taiwan. Journal of Pain and Symptom Management. 2010. Oct;40(4):575–81. [DOI] [PubMed] [Google Scholar]
- 4.Roy R, Thomas M. A survey of chronic pain in an elderly population. Can Fam Physician. 1986. Mar;32:513–6. [PMC free article] [PubMed] [Google Scholar]
- 5.Ferrell BA. Pain evaluation and management in the nursing home. Ann Intern Med. 1995. Nov 1;123(9):681–7. [DOI] [PubMed] [Google Scholar]
- 6.Helme RD, Gibson SJ. The epidemiology of pain in elderly people. Clin Geriatr Med. 2001. Aug;17(3):417–31, v. [DOI] [PubMed] [Google Scholar]
- 7.Elwes RD, Binnie CD. Clinical pharmacokinetics of newer antiepileptic drugs. Lamotrigine, vigabatrin, gabapentin and oxcarbazepine. Clin Pharmacokinet. 1996. Jun;30(6):403–15. [DOI] [PubMed] [Google Scholar]
- 8.Carlsson KC, van de Schootbrugge M, Eriksen HO, Moberg ER, Karlsson MO, Hoem NO. A population pharmacokinetic model of gabapentin developed in nonparametric adaptive grid and nonlinear mixed effects modeling. Ther Drug Monit. 2009. Feb;31(1):86–94. [DOI] [PubMed] [Google Scholar]
- 9.Boyd RA, Turck D, Abel RB, Sedman AJ, Bockbrader HN. Effects of age and gender on single- dose pharmacokinetics of gabapentin. Epilepsia. 1999. Apr;40(4):474–9. [DOI] [PubMed] [Google Scholar]
- 10.Blum RA, Comstock TJ, Sica DA, Schultz RW, Keller E, Reetze P, Bockbrader H, Tuerck D, Busch JA, Reece PA, Sedman AJ. Pharmacokinetics of Gabapentin in Subjects with Various Degrees of Renal-Function. Clinical Pharmacology & Therapeutics. 1994. Aug;56(2):154–9. [DOI] [PubMed] [Google Scholar]
- 11.Lamba M. Pharmacometric analyses of anti-epileptic drugs in special populations (Order No. 3325296). Available from ProQuest Dissertations & Theses A&I: Health & Medicine. (304583377. Retrieved from http://login.ezproxy.lib.umn.edu/login?url=http://search.proquest.com.ezp1.lib.umn.edu/docview/304583377?accountid=14586 2008.
- 12.Stewart BH, Kugler AR, Thompson PR, Bockbrader HN. A Saturable Transport Mechanism in the Intestinal-Absorption of Gabapentin Is the Underlying Cause of the Lack of Proportionality between Increasing Dose and Drug Levels in Plasma. Pharmaceutical Research. 1993. Feb;10(2):276–81. [DOI] [PubMed] [Google Scholar]
- 13.Gidal BE, DeCerce J, Bockbrader HN, Gonzalez J, Kruger S, Pitterle ME, Rutecki P, Ramsay RE. Gabapentin bioavailability: effect of dose and frequency of administration in adult patients with epilepsy. Epilepsy Res. 1998. Jul;31(2):91–9. [DOI] [PubMed] [Google Scholar]
- 14.Yuasa H, Soga N, Kimura Y, Watanabe J. Effect of aging on the intestinal transport of hydrophilic drugs in the rat small intestine. Biol Pharm Bull. 1997. Nov;20(11):1188–92. [DOI] [PubMed] [Google Scholar]
- 15.Armbrecht HJ, Boltz MA, Kumar VB. Intestinal plasma membrane calcium pump protein and its induction by 1,25(OH)(2)D(3) decrease with age. Am J Physiol. 1999. Jul;277(1 Pt 1):G41–7. [DOI] [PubMed] [Google Scholar]
- 16.Toyoshima M, Inada M, Kameyama M. Effects of aging on intracellular transport of vitamin B12 (B12) in rat enterocytes. J Nutr Sci Vitaminol (Tokyo). 1983. Feb;29(1):1–10. [DOI] [PubMed] [Google Scholar]
- 17.Lindeman RD, Tobin J, Shock NW. Longitudinal studies on the rate of decline in renal function with age. J Am Geriatr Soc. 1985. Apr;33(4):278–85. [DOI] [PubMed] [Google Scholar]
- 18.Rowe JW, Andres R, Tobin JD, Norris AH, Shock NW. The effect of age on creatinine clearance in men: a cross-sectional and longitudinal study. J Gerontol. 1976. Mar;31(2):155–63. [DOI] [PubMed] [Google Scholar]
- 19.Charlson ME, Pompei P, Ales KL, MacKenzie CR. A new method of classifying prognostic comorbidity in longitudinal studies: development and validation. J Chronic Dis. 1987;40(5):373–83. Charlson M, Szatrowski TP, Peterson J, Gold J. Validation of a combined comorbidity index. J Clin Epidemiol. 1994 Nov;47(11):1245–51. [DOI] [PubMed] [Google Scholar]
- 20.Gill J, Malyuk R, Djurdjev O, Levin A. Use of GFR equations to adjust drug doses in an elderly multi-ethnic group - a cautionary tale. Nephrology Dialysis Transplantation. 2007. Oct;22(10):2894–9. [DOI] [PubMed] [Google Scholar]
- 21.Stevens LA, Coresh J, Feldman HI, Greene T, Lash JP, Nelson RG, Rahman M, Deysher AE, Zhang YL, Schmid CH, Levey AS. Evaluation of the modification of diet in renal disease study equation in a large diverse population. J Am Soc Nephrol. 2007. Oct;18(10):2749–57. [DOI] [PubMed] [Google Scholar]
- 22.Lockwood PA, Cook JA, Ewy WE, Mandema JW. The use of clinical trial simulation to support dose selection: application to development of a new treatment for chronic neuropathic pain. Pharm Res. 2003. Nov;20(11):1752–9. [DOI] [PubMed] [Google Scholar]
- 23.Bergstrand M, Hooker AC, Wallin JE, Karlsson MO. Prediction-corrected visual predictive checks for diagnosing nonlinear mixed-effects models. AAPS J. 2011. Jun;13(2):143–51. [DOI] [PMC free article] [PubMed] [Google Scholar]
- 24.Armijo JA, Pena MA, Adin J, Vega-Gil N. Association between patient age and gabapentin serum concentration-to-dose ratio - A preliminary multivariate analysis. Therapeutic Drug Monitoring. 2004. Dec;26(6):633–7. [DOI] [PubMed] [Google Scholar]
- 25.Gupta A, Li S. Safety and efficacy of once-daily gastroretentive gabapentin in patients with postherpetic neuralgia aged 75 years and over. Drugs Aging. 2013. Dec;30(12):999–1008. [DOI] [PMC free article] [PubMed] [Google Scholar]
- 26.McLean MJ. Clinical pharmacokinetics of gabapentin. Neurology. 1994. Jun;44(6 Suppl 5):S17–22; discussion S31–2. [PubMed] [Google Scholar]
- 27.Berry DJ, Beran RG, Plunkeft MJ, Clarke LA, Hung WT. The absorption of gabapentin following high dose escalation. Seizure. 2003. Jan;12(1):28–36. [DOI] [PubMed] [Google Scholar]
- 28.Wilson EA, Sills GJ, Forrest G, Brodie MJ. High dose gabapentin in refractory partial epilepsy: clinical observations in 50 patients. Epilepsy Res. 1998. Jan;29(2):161–6. [DOI] [PubMed] [Google Scholar]
- 29.Clarkston WK, Pantano MM, Morley JE, Horowitz M, Littlefield JM, Burton FR. Evidence for the anorexia of aging: gastrointestinal transit and hunger in healthy elderly vs. young adults. Am J Physiol. 1997. Jan;272(1 Pt 2):R243–8. [DOI] [PubMed] [Google Scholar]
- 30.Dubois D, Dubois EF. Nutrition Metabolism Classic - a Formula to Estimate the Approximate Surface-Area If Height and Weight Be Known (Reprinted from Archives Internal Medicine, Vol 17, Pg 863, 1916). Nutrition. 1989. Sep-Oct;5(5):303–11. [PubMed] [Google Scholar]
- 31.Cockcroft DW, Gault MH. Prediction of creatinine clearance from serum creatinine. Nephron. 1976;16(1):31–41. [DOI] [PubMed] [Google Scholar]