Abstract
During neural tube closure, neural ectoderm cells constrict their apical surfaces to bend and fold the tissue into a tube that will become the central nervous system. Recent data from mice and humans with neural tube defects suggest that key genes required for neural tube closure can exert non-cell autonomous effects on cell behavior, but the nature of these effects remains obscure. Here, we coupled tissue-scale, high-resolution time-lapse imaging of the closing neural tube of Xenopus to multivariate regression modeling, and we show that medial actin accumulation drives apical constriction non-autonomously in neighborhoods of cells, rather than solely in individual cells. To further explore this effect, we examined mosaic crispant embryos and identified both autonomous and non-autonomous effects of the apical constriction protein Shroom3.
Graphical Absrtract:
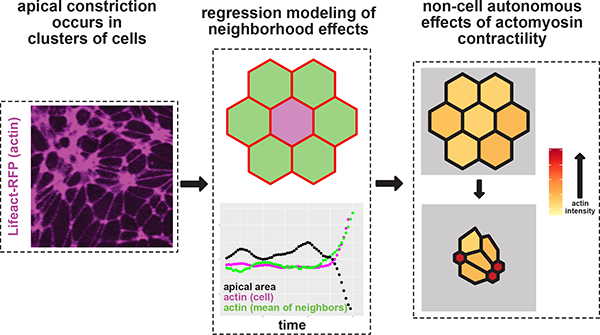
Introduction:
Embryonic morphogenesis involves a variety of cellular processes and behaviors that interact to shape a simple cluster of cells into an adult organism. In vertebrate embryos, neural tube closure is the process by which the dorsal neural ectoderm folds itself into a tube that will form the central nervous system. Failure of neural tube closure results in birth defects known as neural tube defects, and outcomes range from serious to deadly (Wallingford et al., 2013). While we possess a wealth of knowledge of genetic factors necessary for neural tube closure (Harris and Juriloff, 2007, 2010), we have a relatively poor understanding of the interplay between various cell behaviors that cooperate to effect successful neural tube closure.
A primary mechanism by which the neural ectoderm folds itself is by apical constriction, where apicobasal polarized cells reduce their apical surface area (Martin and Goldstein, 2014). When neural ectoderm cells fail to apically constrict, neural tube defects such as anencephaly result (Haigo et al., 2003; Hildebrand and Soriano, 1999; McGreevy et al., 2015). While models of apical constriction typically try to explain the mechanism of constriction within individual cells (Martin and Goldstein, 2014), an epithelium such as the neural ectoderm is composed of numerous cells that are all physically linked to each other by the cadherin/catenin junctional protein complex. Apical constriction depends on actomyosin contractility (Baldwin et al., 2022a; Christodoulou and Skourides, 2015; Martin et al., 2009; Roh-Johnson et al., 2012), and apical actomyosin interacts with the cadherin/catenin complex (Lecuit and Yap, 2015), meaning that actomyosin contractility can be transmitted across entire fields of epithelial cells.
The actin-binding protein Shroom3 is necessary for neural apical constriction and is sufficient to induce apical constriction in apicobasal polarized cells (Haigo et al., 2003; Hildebrand, 2005; Hildebrand and Soriano, 1999). shroom3 genetically interacts with N-cadherin (Plageman et al., 2011), the neural cadherin, and we recently showed that shroom3 crispant cells are less capable of enriching N-cadherin at both the medial apical surface and apical junctions of neural ectoderm cells (Baldwin et al., 2022a). As a classical cadherin, N-cadherin is likely involved in mediating and propagating actomyosin-generated constriction forces across individual apical junctions and subsequently across tissues (Lecuit and Yap, 2015; Nandadasa et al., 2009).
These results suggest the possibility of non-cell autonomous effects, which may impact our understanding of human neural tube defects. Indeed, recent work has found that somatic mutations in several different genes are associated with human NTDs (Tian et al., 2021; Tian et al., 2020) and mosaic alteration of gene function is linked to tissue-wide failure of neural tube closure in both mice and humans (Galea et al., 2021; Kennedy et al., 1998; Rocha et al., 2010). Specifically, mosaic loss of Vangl2 in mice demonstrates that neural tube defects can form in the presence of relatively small numbers of mutant/defective cells (Galea et al., 2021). Because Vangl2 genetically interacts with Shroom3 in the successful completion of neural tube closure/apical constriction (McGreevy et al., 2015), we hypothesize that mosaic loss of shroom3 may also cause non-autonomous cell behavior defects in the neural ectoderm.
Here, we used our new paradigm of tissue-scale quantification of cell behaviors and protein localization to assess the effect of mosaic loss of shroom3 in Xenopus neural tube closure. Using multivariate regression modeling, we show that medial actin accumulation drives apical constriction non-autonomously in neighborhoods of cells, rather than solely in individual cells. We further show that this neighborhood effect of medial actomyosin contractility on apical surface area is dependent on the function of shroom3, both autonomously and non-autonomously. Together these results provide subcellular insights into how contractile behaviors within the cells of the neural ectoderm are coordinated and propagated by Shroom3 during neural tube closure.
Materials and Methods
Animals
Wild-type Xenopus tropicalis frogs were obtained from the National Xenopus Resource, Woods Hole, MA (Horb et al., 2019).
Injections
Wild-type X. tropicalis eggs were fertilized in vitro using sperm from wild-type X. tropicalis males using standard methods (Wlizla et al., 2018).
X. tropicalis embryos were moved to 1/9x MMR + 2% Ficoll, then injected in both dorsal blastomeres at the 4-cell stage with 50pg LifeAct-RFP mRNA and 45pg Xenopus N-cadherin-GFP mRNA. In CRISPR-injected embryos, after the next division to reach 8-cell stage, one dorsal blastomere was injected with 1ng Cas9 protein (PNA Bio), 250pg shroom3-targeted sgRNA (target sequence GUAGCCGGAGAGAUCACUUG, Synthego), and 60pg membrane(CAAX)-BFP mRNA. CRISPR validation demonstrated that the shroom3 locus is strongly disrupted in vivo by this sgRNA and is described in more detail in (Baldwin et al., 2022a).
Imaging and Cell Segmentation
Injected embryos were held at 25C until they reached Nieuwkoop and Faber (NF) stage 12.5. At NF stage 12.5, vitelline envelopes were removed from embryos and embryos were allowed to “relax” for 30 minutes. Embryos were then mounted in Invitrogen Attofluor cell chambers (catalog no. A7816) and positioned for imaging of the anterior neural ectoderm (Baldwin et al., 2022b). Embryos were imaged on a Nikon A1R confocal microscope using the resonant scanner. Image quality, Z-stacking, and XY tiling were optimized to generate optimal 3D images of the neural plate at a rate of 1 frame per minute. Ultimately, movies of the anterior neural ectoderm of 5 embryos were of sufficient length and quality for analysis; tissue geometry of the initial frame of each of these embryos is shown in Figure S2.
Beginning at Nieuwkoop & Faber stages 11–12 (Nieuwkoop and Faber, 1994), the anterior neural ectoderm of the injected embryos was subjected to time-lapse confocal microscopy through the process of neural tube closure. Apical cell junctions in each confocal movie were segmented using a combination of Tissue Analyzer, CSML, and EPySeg (Aigouy et al., 2020; Aigouy et al., 2016; Ota et al., 2018). Initial segmentations were hand-corrected using Tissue Analyzer, and then Tissue Analyzer was again used to track cells through each movie.
Image analysis
Raw 3D images were projected to 2D via maximum intensity and underwent initial segmentation of cell boundaries using the FIJI plugin Tissue Analyzer (Aigouy et al., 2010; Aigouy et al., 2016). The segmentation of an initial frame was hand-corrected, and this hand-corrected segmentation was used to train a classifier using the programs CSML and EPySEG (Aigouy et al., 2020; Ota et al., 2021). CSML and EPySEG were used to generate segmentation for subsequent frames, which were then further hand-corrected in Tissue Analyzer.
After hand-correction, Tissue Analyzer was used to track both cell surfaces and cell junctions, then generate a database of measurements of size and fluorescent intensities for each cell and junction over time. Values for medial and junctional localization of imaged markers in cells were calculated as average pixel fluorescence intensity across the entirety of each respective domain (i.e., total fluorescence of a region divided by the area of the region). Similarly, localization of imaged markers to individual junctions was calculated as an average across the entire junction. The cell shape parameter of “stretch” was calculated using Tissue Analyzer and describes the elongation of a cell’s surface independent of its surface area (Aigouy et al., 2010). Cell orientation was calculated based on the angle of the major axis of the fit ellipsis of the cell (Schindelin et al., 2012) relative to the anteroposterior axis; 0° is aligned with the mediolateral axis, and 90° is aligned with the anteroposterior axis of the embryo.
Data analysis
Cell tracks shorter than 30 frames and junction tracks shorter than 15 frames were discarded.
For individual junctions, errors in junction length caused by Z-displacement and projection were corrected in Matlab.
Cells were determined to be control versus shroom3 crispant by a membrane-BFP localization threshold specific to each embryo. Cells along the mosaic interface were then subjected to manual correction to ensure proper annotation of control vs. shroom3 crispant cells.
Individual junctions were designated to be control when situated between two control cells, shroom3 crispant junctions are situated between two shroom3 crispant cells, and mosaic interface junctions are situated between a wild-type and a shroom3 crispant cell.
Individual cell and junction tracks were smoothed by averaging over a 7 frame (7 minute) window. Individual cell tracks were further mean-centered and standardized so that variables are measured in standard deviations rather than fluorescence or size units. This standardization allows us to analyze dynamics of cell size and protein localization across a population of cells while controlling for initial size and fluorescence of cells, and was essential for performing partial least squares regression analysis.
Tissue Analyzer databases were imported to R and further analyzed and manipulated primarily using the tidyverse package (R Core Team, 2020; Wickham et al., 2019).
More details on data analysis are included in (Baldwin et al., 2022a). In the course of the analysis presented in this manuscript, a small number of errors in cell tracking and shroom3 crispant calling in (Baldwin et al., 2022a) were identified and corrected, and these changes are reflected in the updated dataset posted at https://datadryad.org/stash/dataset/doi:10.5061/dryad.zw3r2289b.
Partial least squares regression models were generated using the R package “pls” (Mevik and Wehrens, 2007), using the SIMPLS algorithm (de Jong, 1993). Prior to inclusion in regression models, each variable was mean-centered to zero and scaled by standard deviations within each cell track (Baldwin et al., 2022a). The data for each model was resampled using the jackknife variance estimator included in the pls package. The jack.test function was then used to calculate p-values for each regression coefficient via approximate t-tests using the jackknife variance estimates.
Results:
Heterogeneous apical actin dynamics in the Xenopus neural tube
Previously, we performed live imaging and segmentation to capture and quantify cell behavior across large swaths of cells in the closing neural tube. Using this dataset, we described correlations between actin localization and apical surface area in the anterior neural ectoderm. A major conclusion of that study was that apical constriction requires two distinct actin populations, one at the cell-cell junctions and another across the medial apical surface of cells (Fig. 1A) (Baldwin et al., 2022a). A similar mechanism has been reported in invertebrates (Martin et al., 2009; Roh-Johnson et al., 2012).
Figure 1:
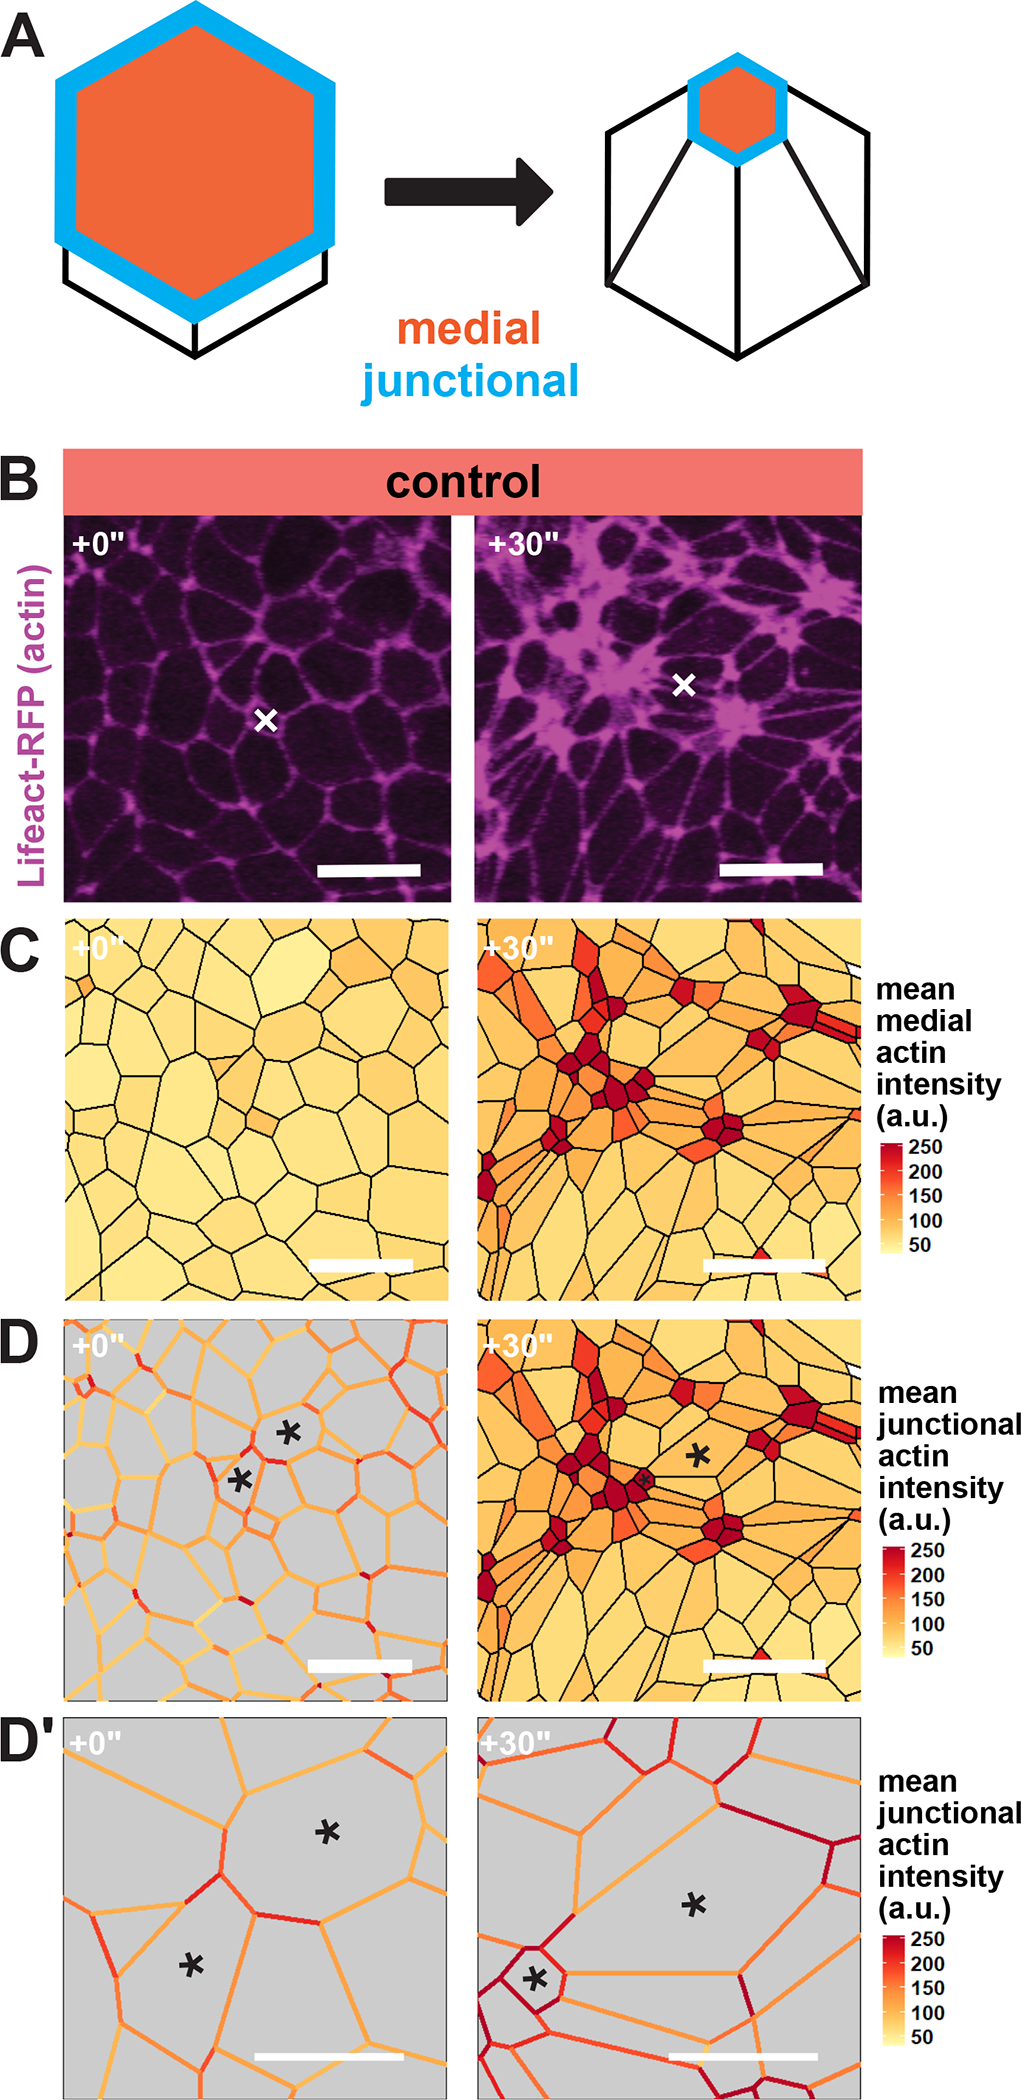
Apical actin accumulation is heterogenous in the Xenopus neural ectoderm. A, Diagram of medial and junctional quantification domains on the apical surface of apically constricting cells. B, Lifeact-RFP localization in the anterior neural ectoderm of apically constricting cells. White “X” marks the same cell in each panel. Scale bar = 25μm. C, mean actin accumulation at the medial domain of neural ectoderm cells is heterogeneous. Actin intensity is measured in arbitrary units. Scale bar = 25μm. D, mean actin accumulation at individual cell-cell junctions is also heterogeneous. Actin intensity is measured in arbitrary units. Black asterisks mark the same cells in each frame. Scale bar = 25μm. D’, insets of cells from D. Scale bar = 12.5μm.
Interestingly, however, when observing changes in actin localization over groups of cells, we noted that cells did not constrict nor accumulate apical actin uniformly (Figure 1B). Rather, it appeared that medial actin contractility was enriched in scattered clusters of cells over time (Figure 1B, C). Additionally, as cells constricted and the tissue deformed, we observed that actin assembly at individual junctions was also quite heterogeneous. Indeed, the several cell-cell junctions that bounded each individual cell displayed highly variable actin intensities. (Figure 1D, D’ asterisks). This result is consistent with the idea that each junction’s actin dynamics are the result of input from both cells forming the junction, which in terms suggests the possibility of non-cell autonomous control of junction behaviors.
Regression analysis of apical constriction variables reveals non-autonomous effects
Given that actomyosin at the apical junctions of epithelial cells is physically linked from cell to cell by cadherins, we reasoned that our dataset could be used to assess local feedback within groups of cells by calculating the average behavior of both a cell and all of its neighbors side-by-side (Figure 2A, 2B). However, this analysis pipeline (Baldwin et al., 2022a) collects a number of measurements of cell size and shape as well as protein localization for each observation, and coupling quantification of each cell’s behavior to the mean of all of that cell’s neighbors introduces tremendous complexity.
Figure 2:
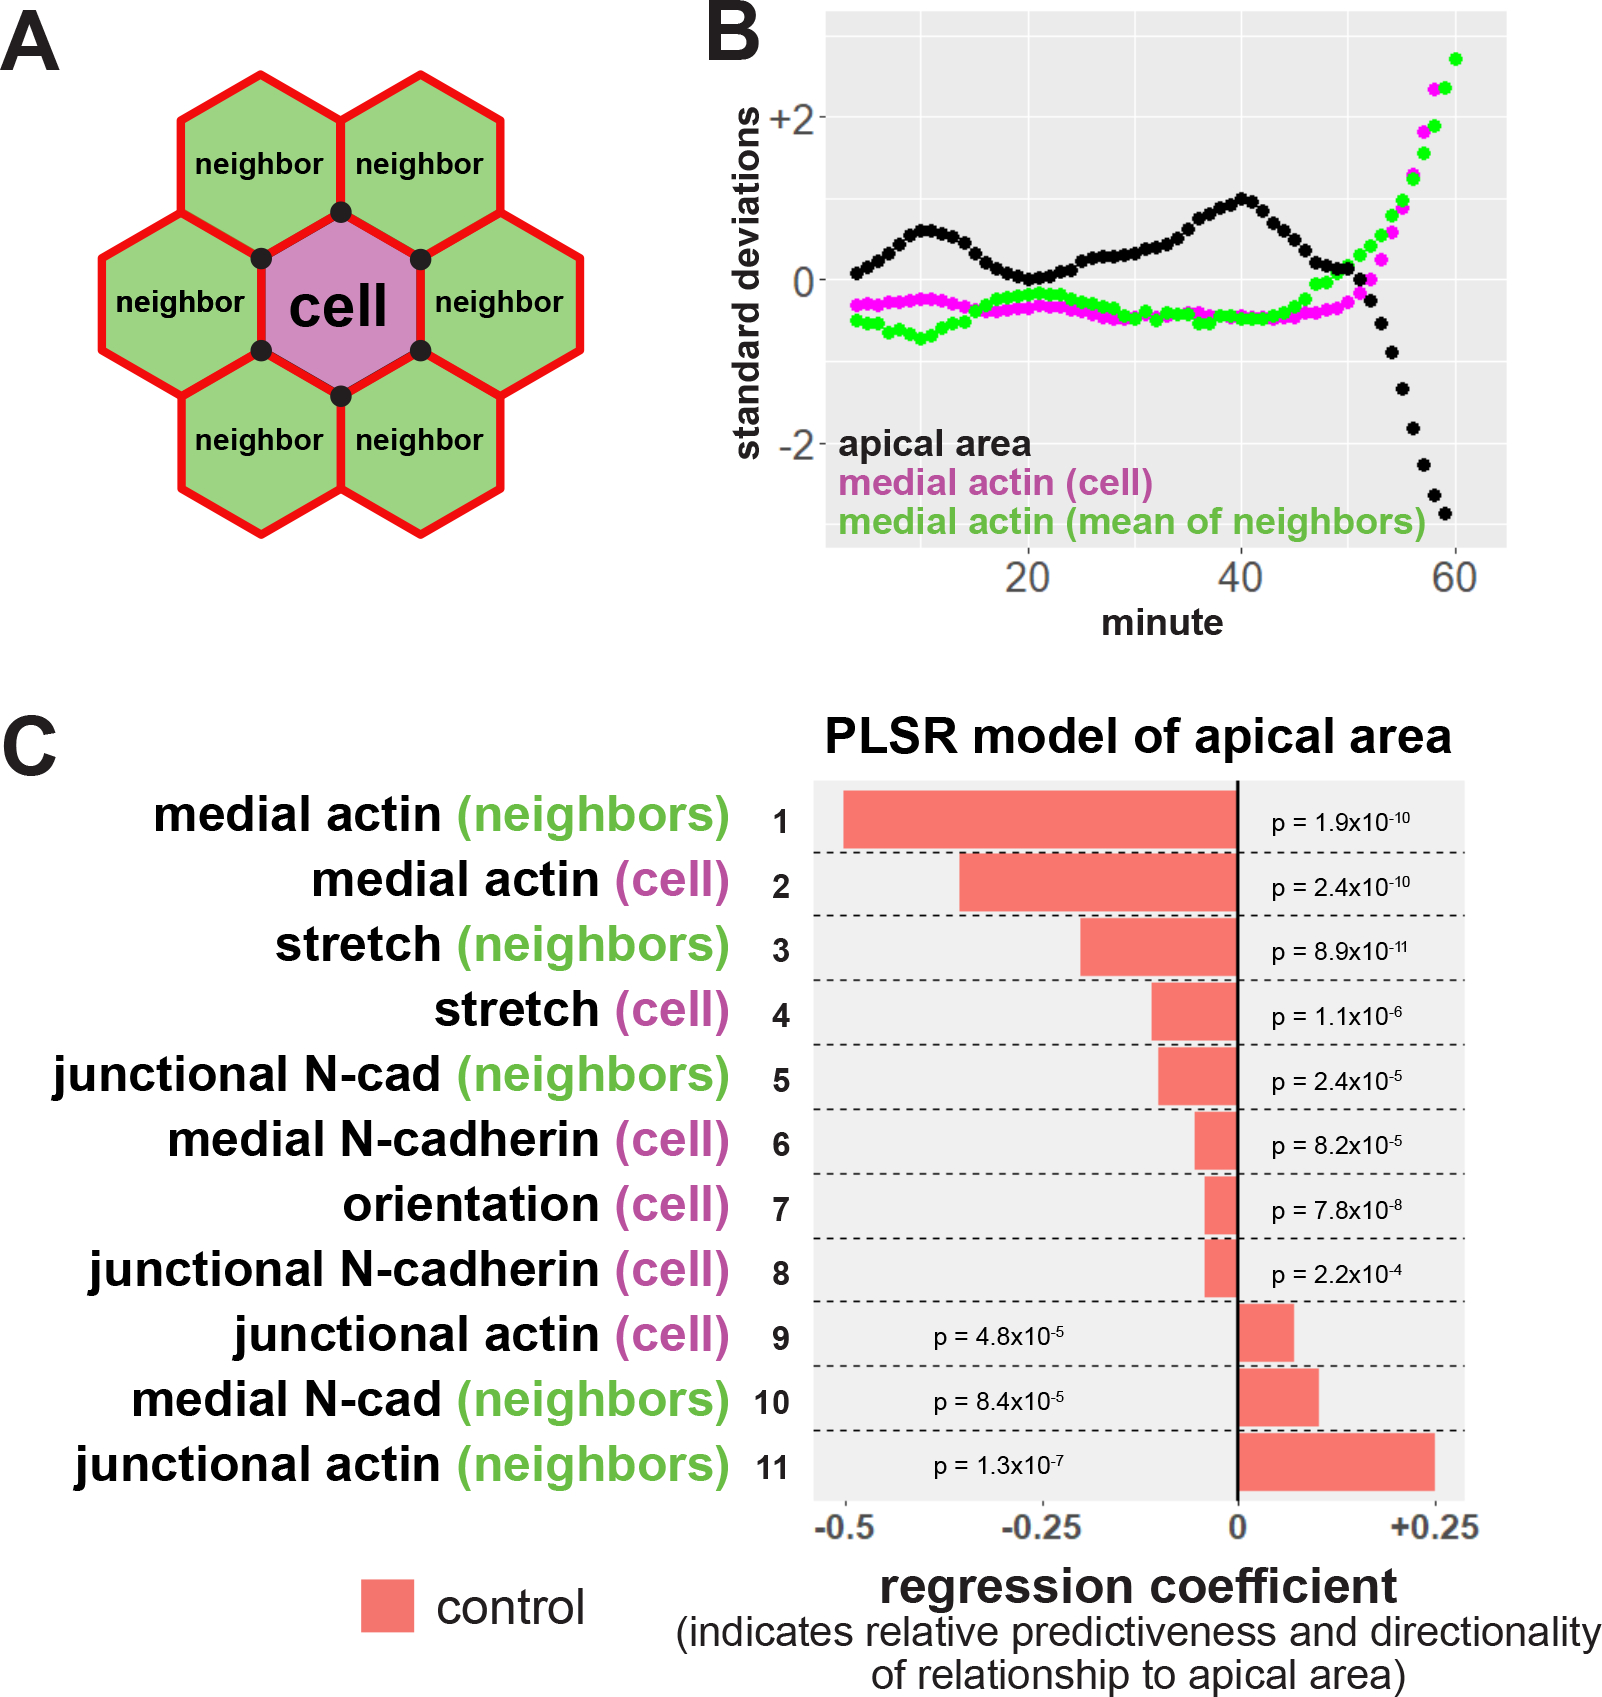
Neighbor analysis and partial least squares regression reveal multiple modes of non-cell autonomous feedback on apical constriction. A, diagram of neighbor analyses. Neighbor relationships in each frame are determined by sharing of at least one cell vertex, represented by black circles. Average values for the neighbors of each cell were then calculated. B, sample track of a cell and its neighbors. Apical area is shown in black, mean medial actin localization within the cell in magenta, and mean medial actin of neighboring cells shown in green. s.d. = standard deviations. C, partial least squares regression (PLSR) of apical area in control cells in the anterior neural ectoderm indicates non-cell autonomous control of apical constriction. Regression coefficients represent the independent effect of each variable on apical surface area. P-values for each regression component were calculated via jackknife resampling included in the R pls package.
To address this high complexity in an unbiased way, we examined relationships between variables using Partial Least Squares Regression (PLSR). This multivariate regression technique predicts the behavior of a single response variable based on the behavior of multiple other, potentially-covarying test variables in a dataset (e.g., (Janes et al., 2005; Janes and Yaffe, 2006). PLSR models provide regression coefficients that reflect the relative magnitude of the independent effect of each test variable on the response variable (Mevik and Wehrens, 2007; Palermo et al., 2009). Accordingly, we used PLSR modeling to ask how the change in a cell’s apical area (response variable) was predicted by the dynamics of cell shape, orientation, actin localization and N-cadherin localization for each cell in our dataset and for that cell’s neighbors (test variables).
An initial regression model was generated from ~65,000 observations of ~1,100 control cells (from 5 embryos), and immediately yielded interesting results (Figure 2C). First, and to our surprise, by far the strongest predictor of apical constriction was increasing intensity of medial actin in neighboring cells (Figure 2C, row 1). This result contrasts with the simple expectation that the amount of constriction would be dictated mainly by the amount of medial actin within that cell. Increasing medial actin within the cell was the second most predictive factor for apical constriction but was less predictive than increasing medial actin in neighbors (Figure 2C, row 2). These results agree with our previous data demonstrating that medial actin localization is better correlated with apical constriction than is junctional actin (Baldwin et al., 2022a) and moreover suggest that the medial actin network exerts non-autonomous effects on apical constriction in the neural epithelium.
The second interesting result from our PLSR model was that another very strong predictor of apical constriction of a cell was a reduction of junctional actin intensity in that cell’s neighbors (Figure 2C, row 11). This result suggests that reduced junctional actomyosin in a cell’s neighbors reduces mechanical resistance around a cell, allowing it to apically constrict more efficiently, and vice versa. Conversely, we found that N-cadherin localization was not strongly predictive of apical constriction relative to other variables in our model (Figure 2C, rows 5, 6, 8 & 10). In fact, recalculating the model without measures of N-cadherin localization did not result in any major changes in the other regression coefficients (Figure S1).
Because polarization of cell behaviors is a common feature of morphogenetic processes, we examined parameters of cell shape and orientation, and these provided mixed results. Increased stretch within cells and their neighbors was moderately predictive for apical constriction (Figure 2C, rows 3 & 4), indicating that cells tended to take on more elongated shapes as they constrict, similar to that observed in Drosophila gastrulation (Chanet et al., 2017). Conversely, changes in cell orientation were only very weakly predictive of constriction (Figure 2C, row 7), suggesting that anterior neural ectoderm cells are not reorienting themselves due to constriction. Overall, multiple influential components in our PLSR model paint a picture of a key role for cell non-autonomous effects in apical constriction in the closing Xenopus neural tube.
Mosaic junctions linking control and shroom3 crispant cells display a distinct phenotype
To explore the non-cell autonomous effects suggested by our PLSR, we examined embryos with mosaic loss-of-function of the gene shroom3 via CRISPR/Cas9 microinjection (Figure 3A). We described such mosaics in a previous paper that focused its analysis only on cells and junctions fully within control or crispant clones (i.e. considering only cells surrounded by like cells) (Baldwin et al., 2022a). Those datasets also contained many cells situated at the interface between those clones (Figure 3A), and our tracking and analysis methodology allowed us to automatically identify junctions along the mosaic interface between clones and analyze them as a distinct category (Figure 3A’).
Figure 3:
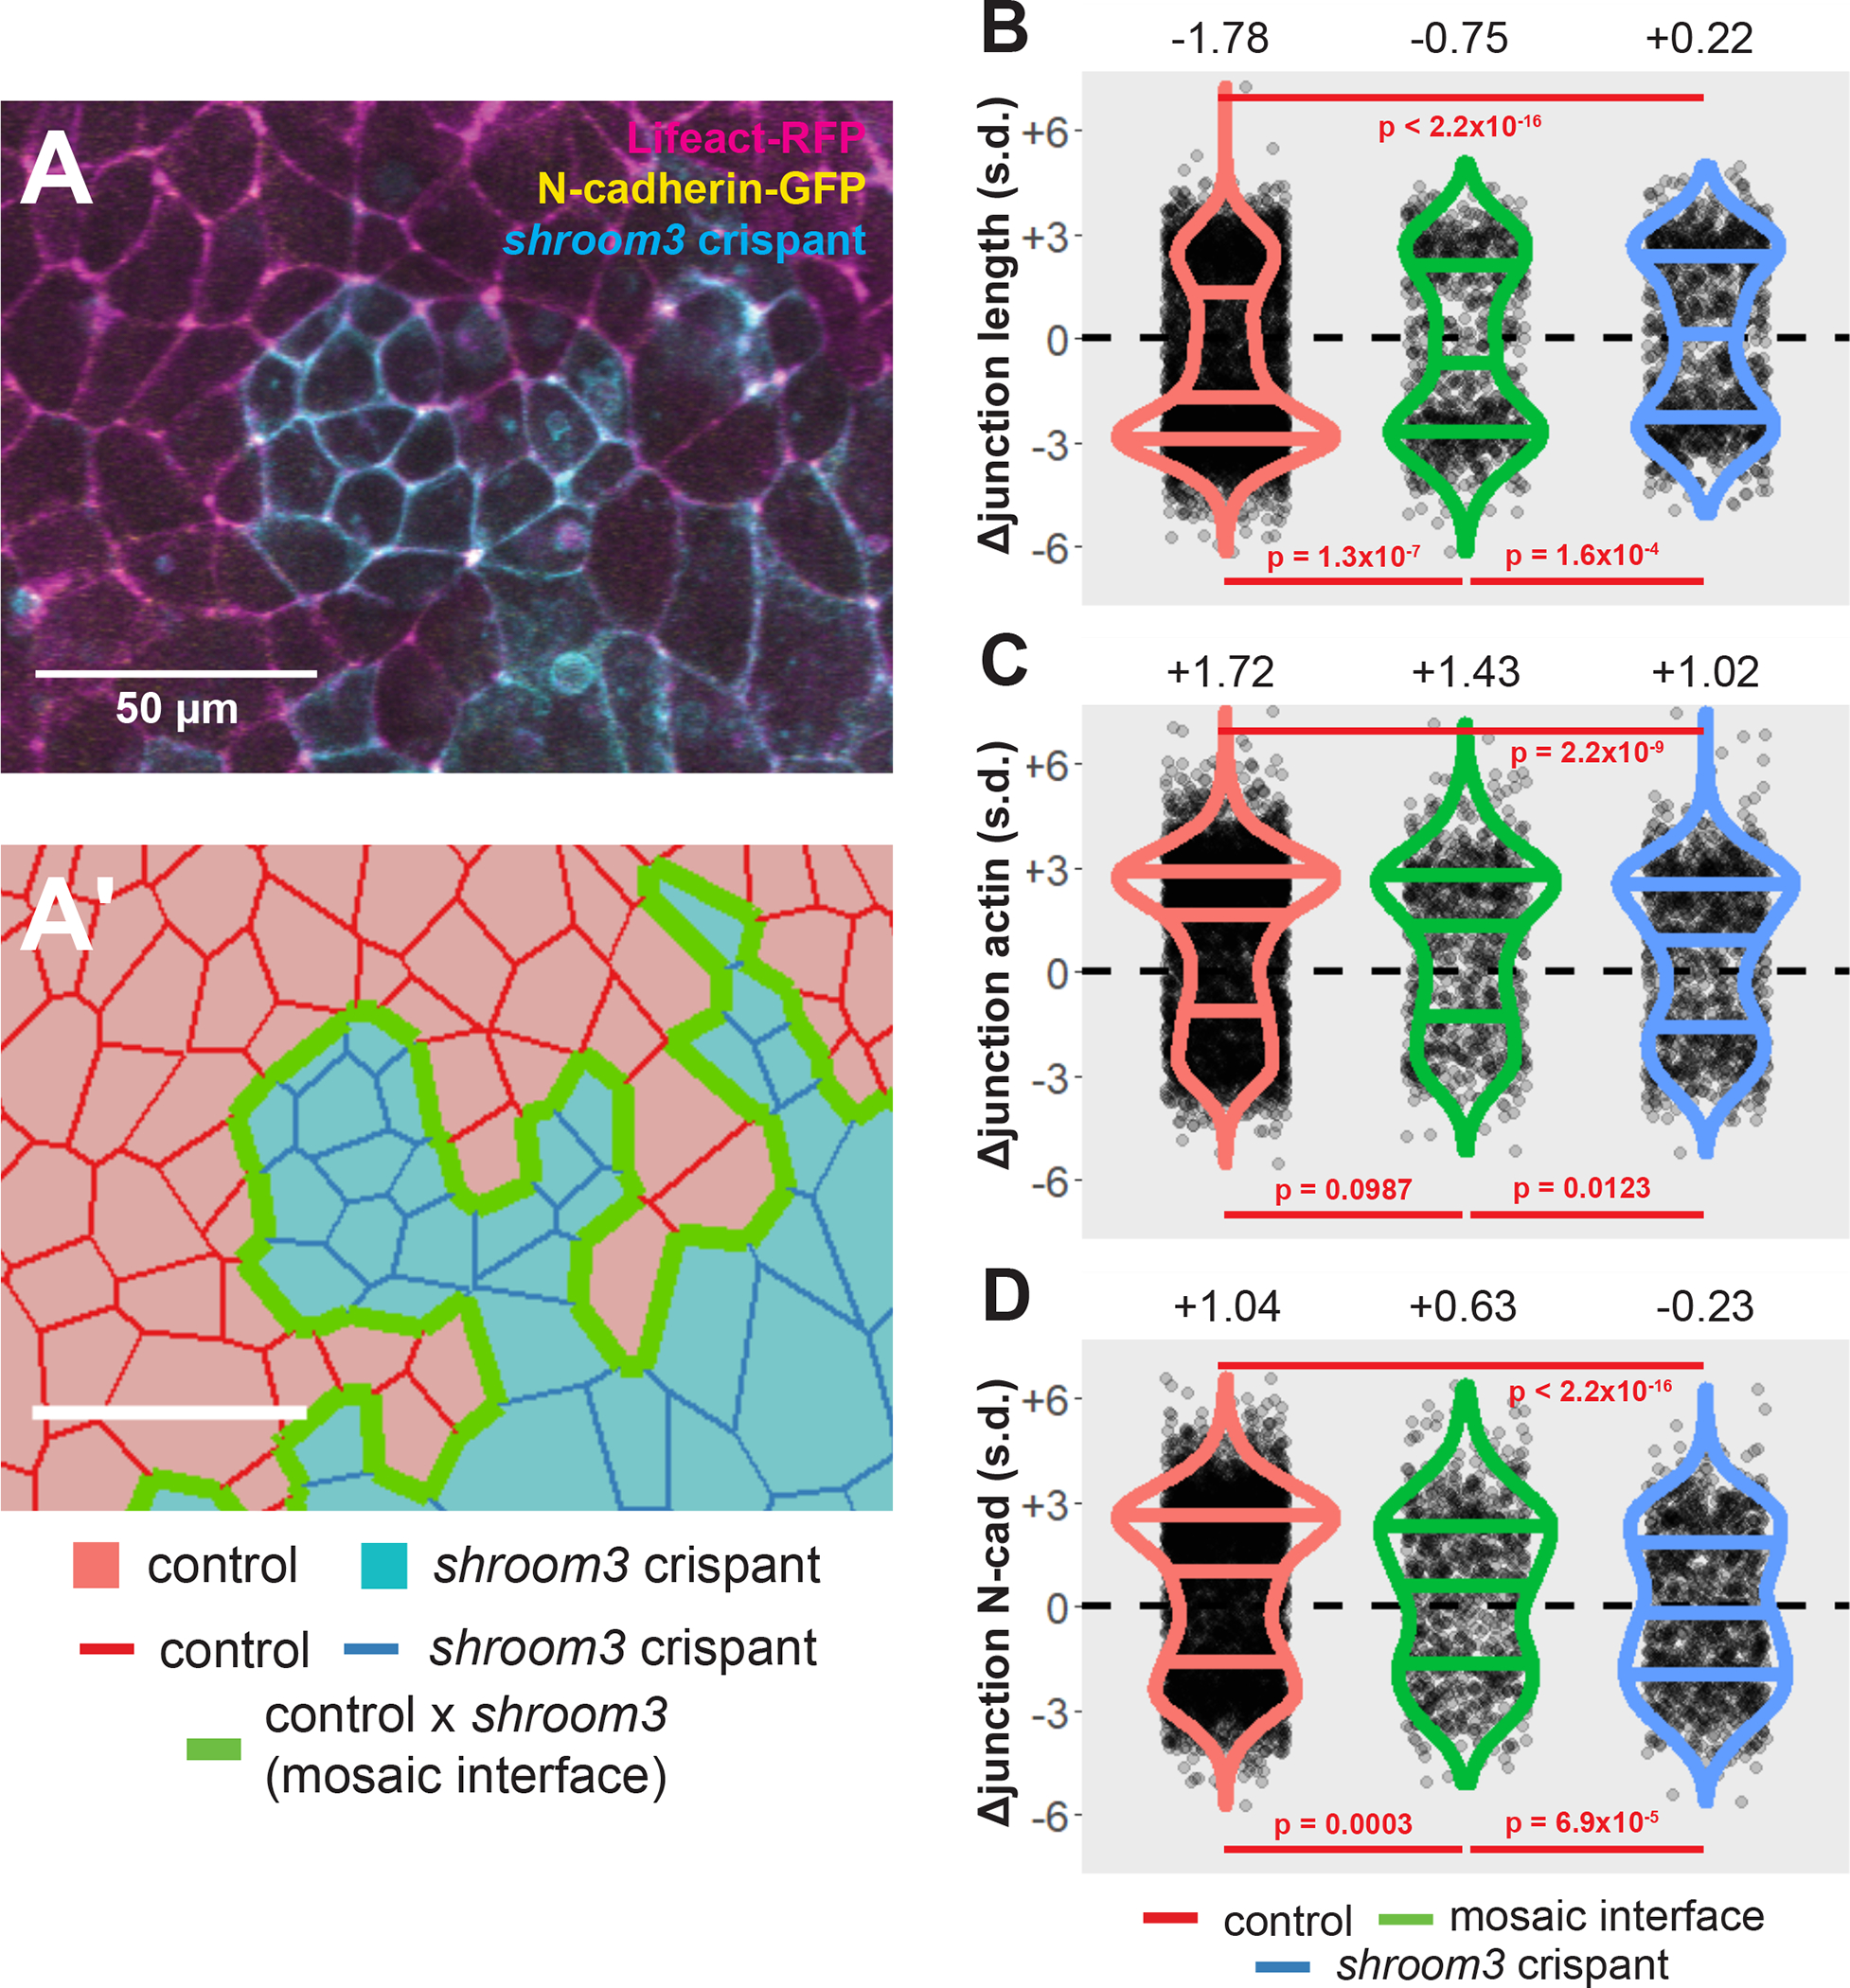
Loss of Shroom3 disrupts junction behaviors along the mosaic interface. A, control and shroom3 crispant cells meet at the mosaic interface. Magenta = Lifeact-RFP/actin, green = N-cadherin-GFP, cyan = membrane(CAAX)-BFP + Cas9 protein (PNA Bio) + shroom3-targeted sgRNA. Scale bar = 50μm. A’, cell tracking can automatically identify cell junctions at the mosaic interface. Red cells = control cells, blue cells = shroom3 crispant cells. Red junctions = control x control interaction, green junctions = control x shroom3 crispant interaction (mosaic interface), blue junctions = shroom3 crispant x shroom3 crispant interactions. Scale bar = 50μm. B, C, D, overall change in junction length, mean junctional actin, and mean junctional N-cadherin in control, mosaic interface, and shroom3 crispant junctions. Both constriction and N-cadherin accumulation are significantly disrupted in interface junctions. Each dot is an individual junction. Horizontal lines within each violin delineate quartiles along each distribution. s.d. = standard deviations. Median value in each group is listed at the top of the panel. P-values were calculated via KS test.
Using this approach, we found that junctions at the mosaic interface (i.e. linking one control and one crispant cell) constricted significantly less than junctions linking two control cells (Figure 3B). At the same time, these interface junctions were also significantly more constrictive than junctions linking two shroom3 crispant cells. Thus, junctions at the mosaic interface represent an intermediate constriction phenotype between control and shroom3 crispants (Figure 3B).
To understand the basis for this phenotype, we examined the dynamics of actin and N-cadherin, both of which increase significantly at control cell-cell junctions (Fig. 3C, D, red violins; see also (Baldwin et al., 2022a). Despite despite their highly significant defect in constriction, we found no difference in actin accumulation between control interfaces and mosaic interfaces (Fig. 3C, green violin), (Fig. 3B, green violin). By contrast, accumulation of N-cadherin along mosaic interface junctions was significantly disrupted compared to control junctions (Fig. 3D, green violin). Thus, defective constriction at interface junctions joining control and shroom3 crispant cells does not arise from a failure of actin assembly at the junction but may reflect a defect in junctional N-cadherin.
Control cells at the interface of shroom3 crispant clones display non-autonomous apical constriction defects
In addition to identifying junctions between control and shroom3 crispant cells, our analysis platform allows us to track the apical surface behavior of cells located at the mosaic interface. For brevity, we will refer to cells located completely within a clone as “clone” cells (i.e. control cells apposed only to control cells, or shroom3 cells apposed only to shroom3 cells), and cells located at the mosaic interface as “interface” cells (i.e. control cells apposed to shroom3 crispant cells) (Figure 4A, Figure S2). As previously reported in (Baldwin et al., 2022a), shroom3 crispant clone cells display significantly reduced apical constriction compared to control clone cells, and most shroom3 clone cells actually dilate their apical surfaces over time (Figure 4B, left; see Fig. S3 for raw values of apical area). Interestingly, however, control cells at the interface also display a significant apical constriction defect as compared to control clone cells (Figure 4B, Figure S3). Conversely, shroom3 crispant cells at the interface constrict significantly more than do shroom3 crispant clone cells (Figure 4B, Figure S3). Thus, both control and shroom3 crispant cells display non-autonomous alterations to apical constriction when present at a mosaic interface.
Figure 4:
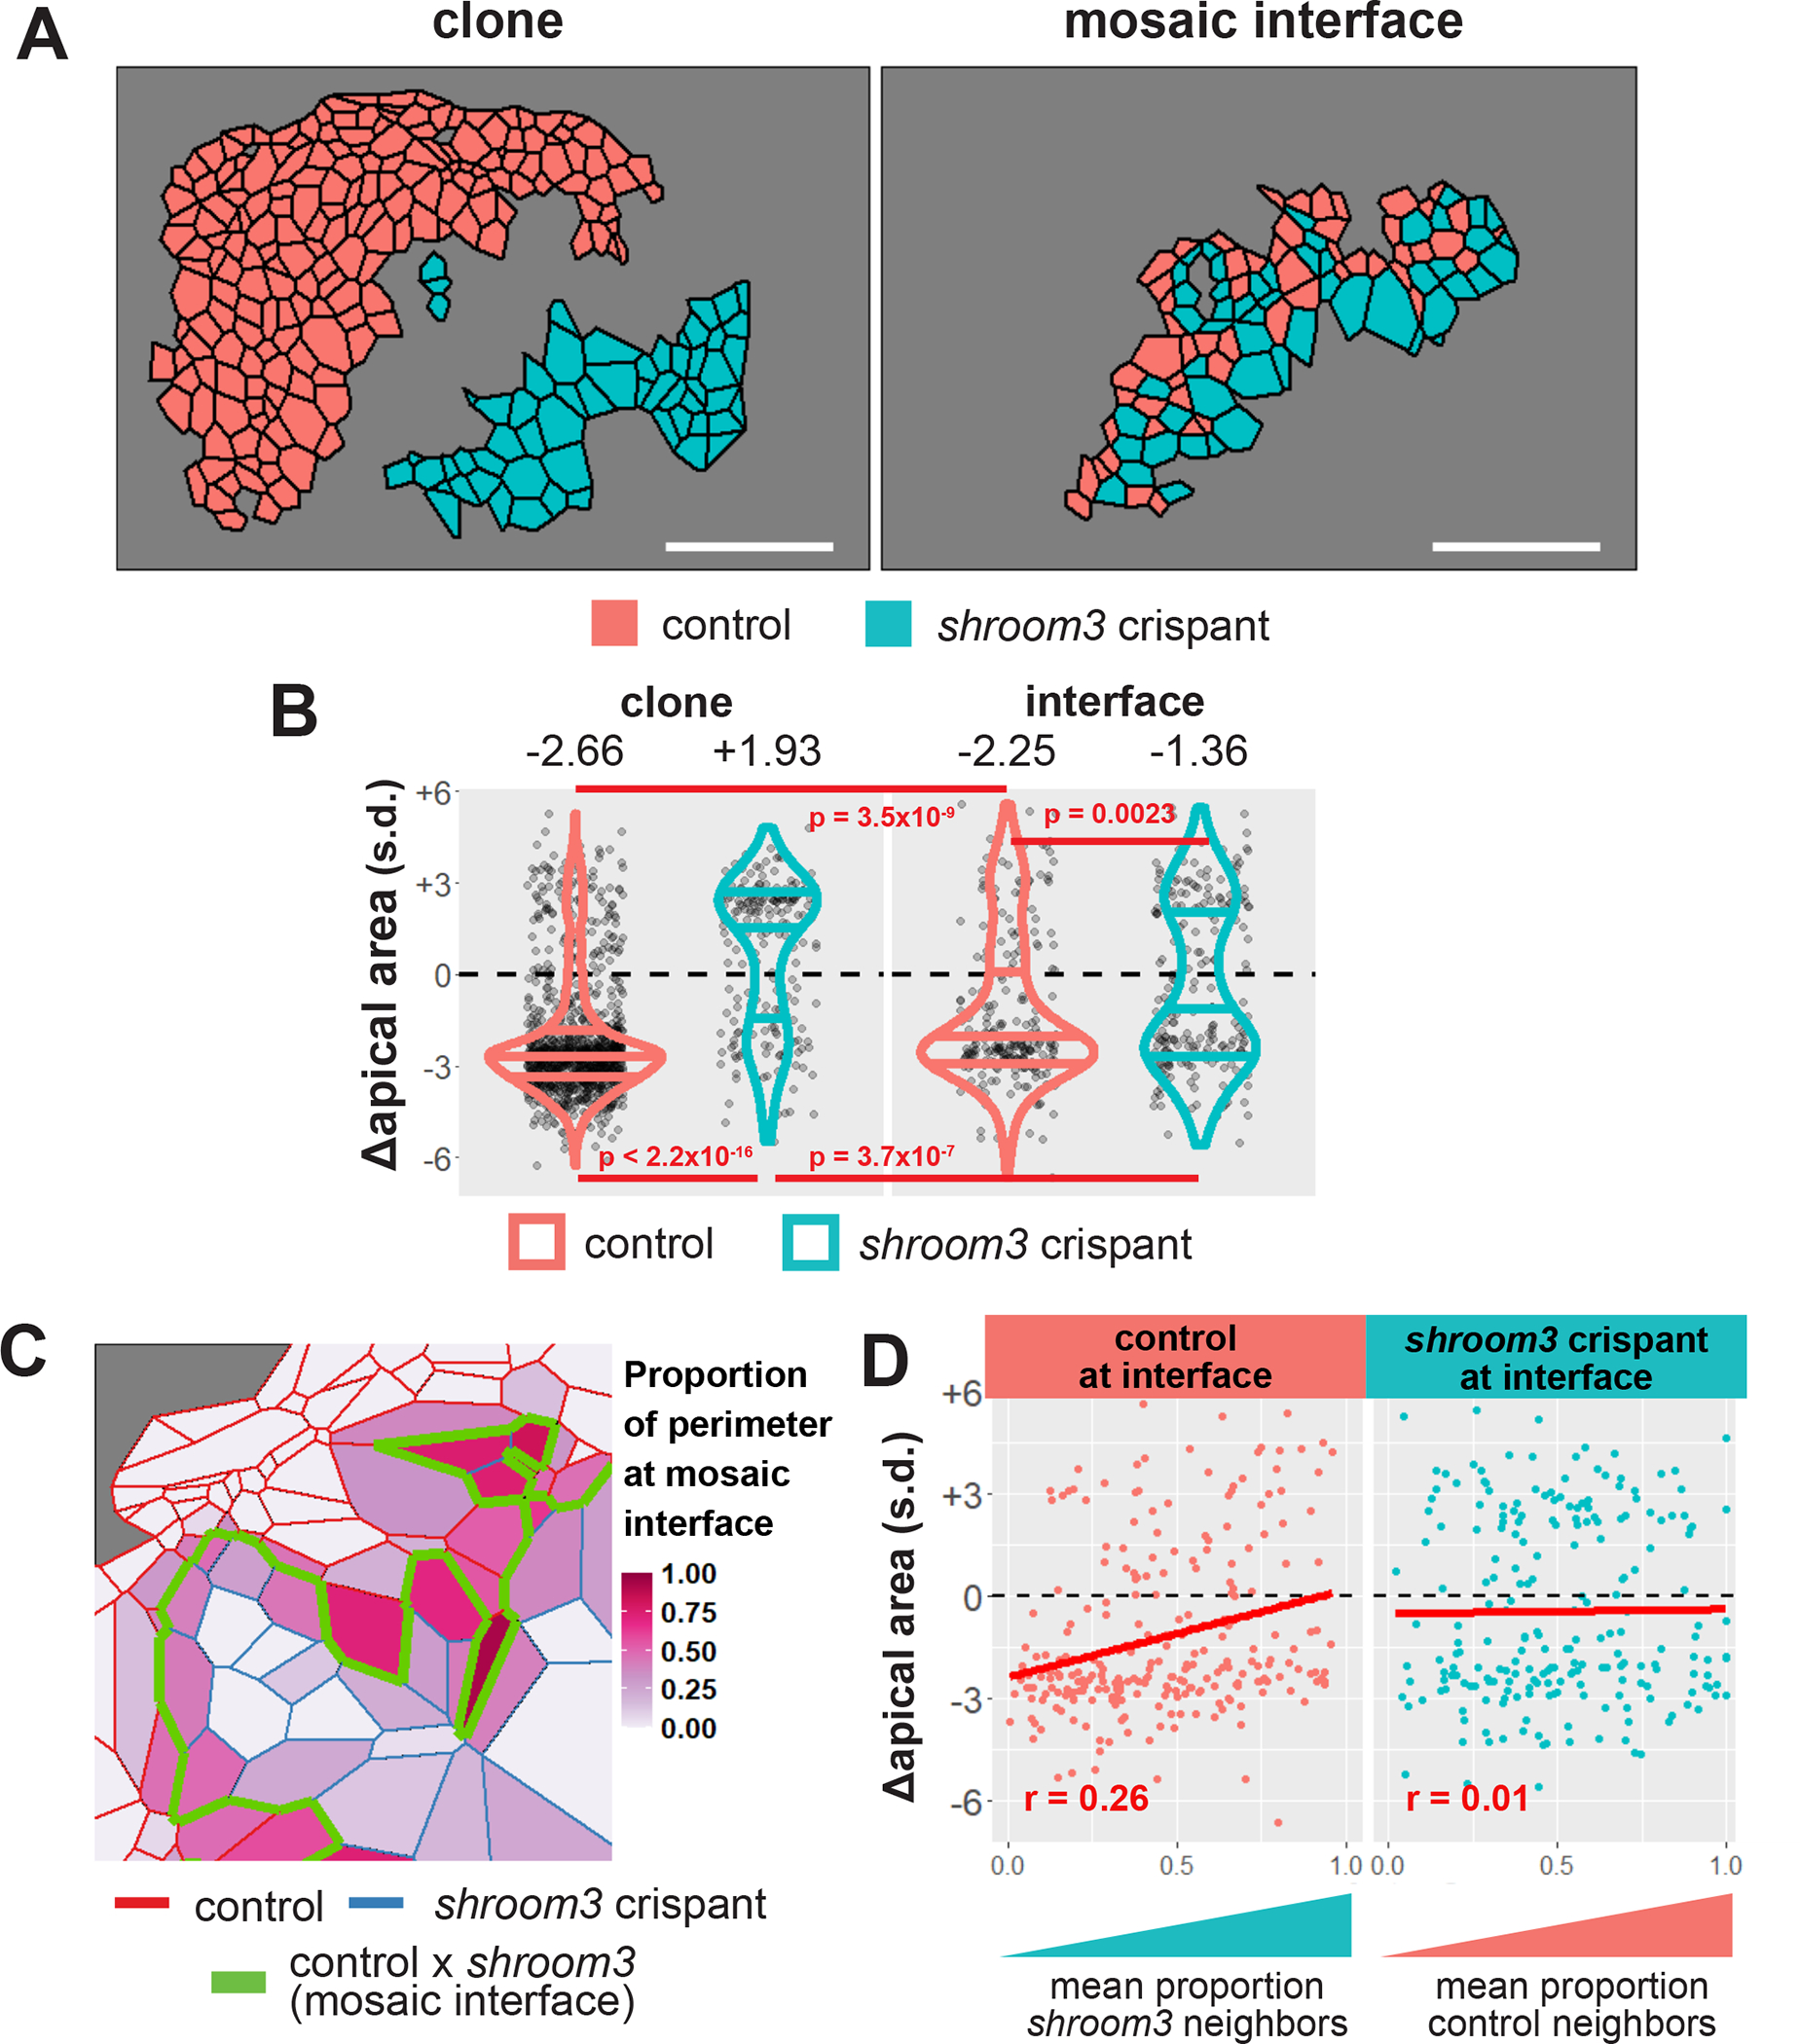
Loss of Shroom3 causes non-cell autonomous apical constriction defects along the mosaic interface. A, sample embryo showing cells within control and shroom3 crispant clones (left panel) and cells located at the mosaic interface (right panel). Red = control cells, blue = shroom3 crispant cells. B, change in apical area among control and shroom3 crispant cells both within clones (left) and at the mosaic interface (right). shroom3 crispant cells situated next to control cells at the mosaic interface are significantly more constrictive then crispant cells within clones. Red violins = control cells, blue violins = shroom3 crispant cells. Each dot is an individual cell. Horizontal lines within each violin delineate quartiles along each distribution. s.d. = standard deviations. Median value in each group is listed at the top of the panel. P-values were calculated via KS test. C, schematic of calculation of proportion of neighbors at mosaic interface. D, change in apical area versus proportion of cell boundary with unlike neighbors (i.e. at mosaic interface) for both control and shroom3 crispant cells at the mosaic interface. s.d. = standard deviations. R-values calculated by Pearson’s correlation.
To explore this effect further, we calculated the proportion of the perimeter of each interface cell that lies along the mosaic interface (i.e. the proportion of perimeter that a control cell shares with shroom3 crispant cells, or vice versa) (Figure 4C). For each cell, we calculated the average proportion of the cell’s perimeter present at the interface over the tracked period and compared that to the amount of apical constriction that cell achieved.
In control cells at the interface, we found that increasing amounts of mosaic interface correlated with increasingly defective apical constriction (r = 0.26, Pearson’s correlation), such that control cells were less able to reduce apical area as they became more surrounded by shroom3 cells (Figure 4D, left panel). This result suggests that the normal non-cell autonomous effect of actin on apical constriction predicted by our PLSR model (Figure 2C, Line 1) requires functional Shroom3 in the neighboring cell. Conversely, shroom3 crispant cells at the interface showed essentially no correlation between their proportion of control neighbors and the amount of apical constriction they achieved (Figure 4D, right panel). This result, in turn, suggests that Shroom3 is also required in a constricting cell to receive or respond to the non-autonomous effect exerted by neighboring control cells.
The non-autonomous effect of medial actin accumulation on apical constriction is disrupted at the interface between control and shroom3 crispant cells
Our data thus far suggest that Shroom3 is required both in apically constricting cells and in their neighbors to effect normal apical constriction, so we turned again to PLSR for insight. As we did for control cells in Figure 2, we calculated neighbor mean values for interface cells, but we separately calculated averages of control neighbors and shroom3 crispant neighbors for each cell (Figure 5A, B). This dataset was then used to calculate two independent PLSR models, one for apical area in control cells at the mosaic interface and another for apical area of shroom3 crispant cells at the mosaic interface. To reduce the already-high complexity of these models (and because other test variables were less predictive), we opted to include only measures of actin and N-cadherin localization, omitting cell shape and orientation.
Figure 5:
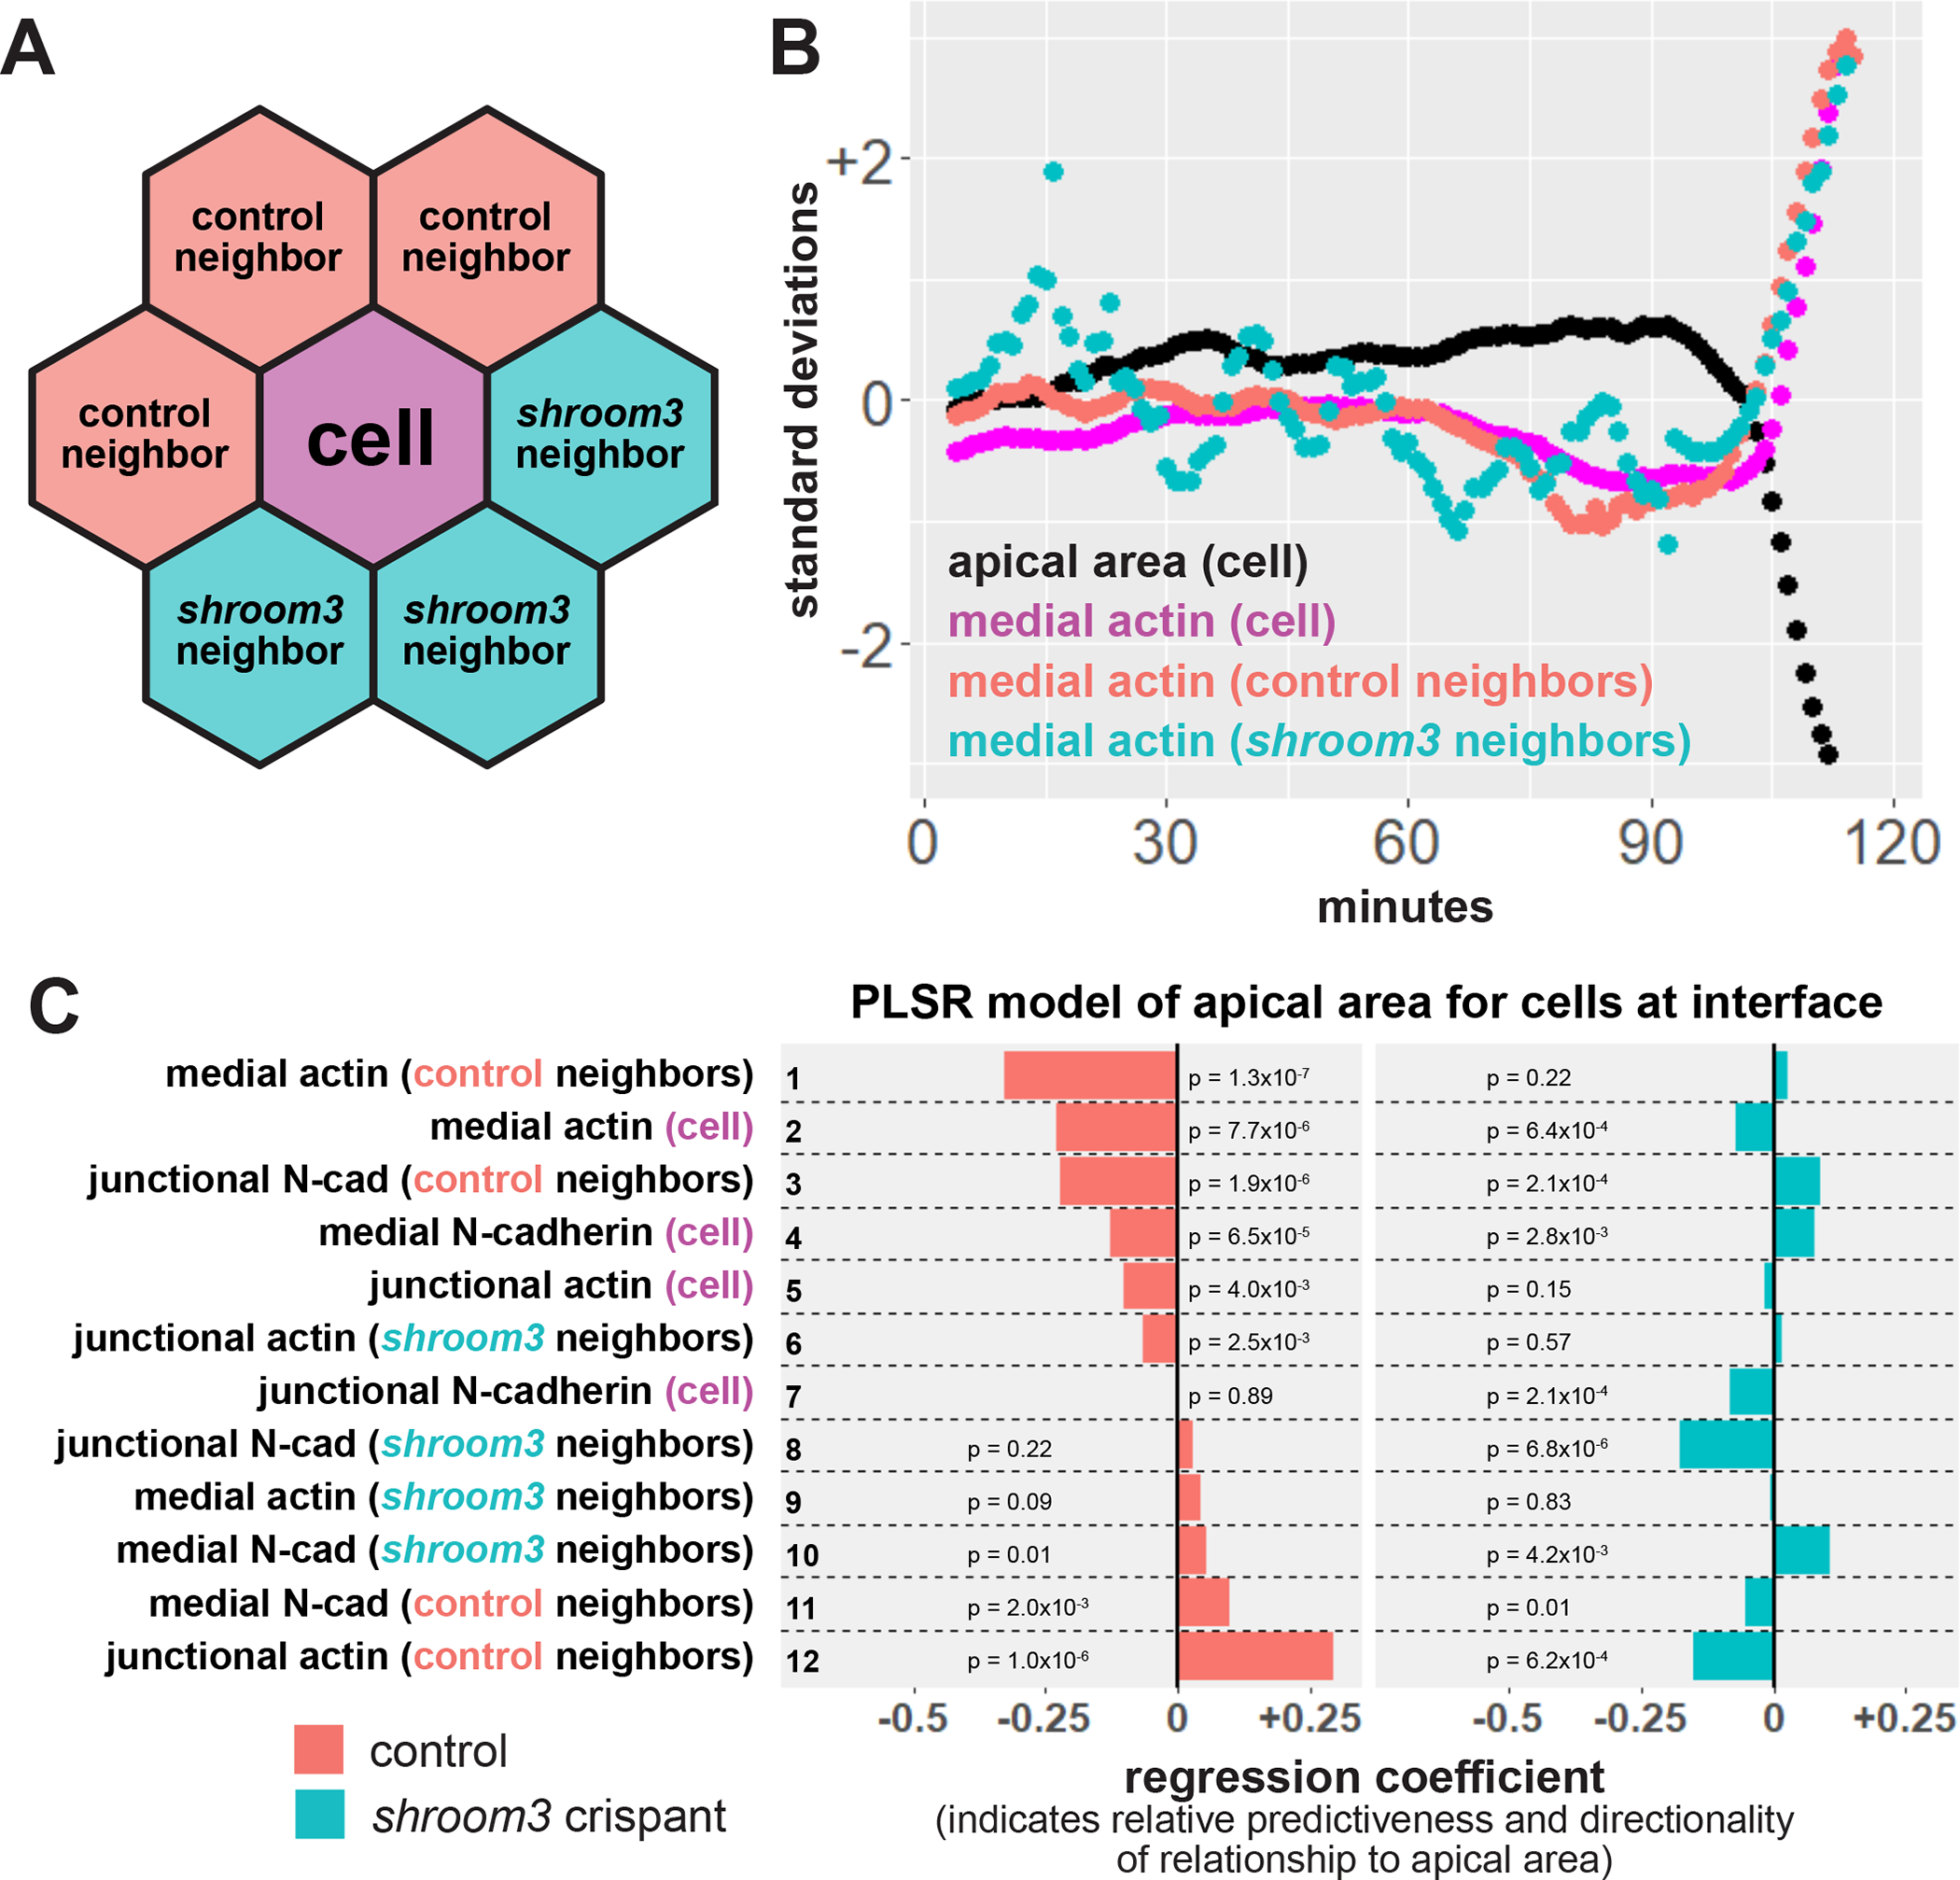
Loss of Shroom3 disrupts non-cell autonomous effects of actin localization. A, schematic of neighbor analysis of cells along the mosaic interface. Mean behaviors of both control and shroom3 crispant neighbors can be calculated separately. B, sample cell track showing the behavior of one control cell at the mosaic interface and its neighbors. Black = apical area of cell, magenta = mean medial actin of cell, red = mean medial actin of control neighbors, blue = mean medial actin of shroom3 crispant neighbors. C, partial least squares regression (PLSR) of apical area in both control and shroom3 crispant cells along the mosaic interface. Protein localization variables on the right indicate whether the resulting coefficient was generated based on influence of the variable within a cell, from a cell’s control neighbors, or a cell’s shroom3 crispant neighbors. Regression coefficients show the influence of each variable on apical area in both control cells (red bars) and shroom3 crispant cells (blue bars). P-values for each regression component were calculated via jackknife resampling included in the R pls package.
For control interface cells, we found that the strongest predictors of apical constriction were again increasing medial actin localization in neighbors and within the cell itself (Figure 5C, red bars, rows 1 & 2), a similar if somewhat weaker result than that observed in clone control cells (see Figure 2C, rows 1 & 2). Strikingly, for shroom3 crispant interface cells, medial actin in neither neighbors nor in the cell itself was predictive of apical constriction (Figure 5C, blue bars, rows 1 & 2). The latter result is consistent with our previous finding that medial actin localization is poorly correlated with apical area in shroom3 cells (Baldwin et al., 2022a), and both results are consistent with the pattern of non-cell autonomous constriction shown in Figure 4. Altogether, our data suggest that loss of shroom3 in neighboring cells bidirectionally disrupts the normal non-cell autonomous effect of medial actin accumulation exerts on apical constriction.
Conclusions
Several reports in mice and human suggest that mosaic loss of specific genes is sufficient to disrupt neural tube closure. Recently, a paper by Galea et al. (Galea et al., 2021) analyzed non-autonomous defects of apical constriction using mosaic loss-of-function of the Planar Cell Polarity (PCP) gene Vangl2, a result that is consistent with the fact that Vangl2 is a transmembrane protein and with the evolutionarily conserved non-autonomy of PCP signaling (Adler et al., 2000; Phillips et al., 2008). Indeed, mosaic disruption of a variety of transmembrane proteins exerts non-autonomous effects on morphogenetic cell behaviors (Chan et al., 2017; Franke et al., 2005; James et al., 2002; Laplante and Nilson, 2006). In fact, N-cadherin is required for neural tube closure (Nandadasa et al., 2009) and mosaic loss of N-cadherin is sufficient to disrupt tissue structure in both Drosophila and zebrafish (Chan et al., 2017; McMillen et al., 2016). (Galea et al., 2021)(Adler et al., 2000; Phillips et al., 2008)On the other hand, Shroom3 is a cytoplasmic protein that is both necessary and sufficient to induce apical constriction (Haigo et al., 2003). To date there has been little evidence to suggest Shroom3 may act non-autonomously, though other cytoplasmic proteins have been shown to exert non-autonomous effects on morphogenesis (Franke et al., 2005; James et al., 2002).
Here, we use tissue scale imaging of cell behaviors, unbiased regression analysis of the data, and mosaic knockdown to show that shroom3 exerts both cell-autonomous and non-cell-autonomous effects on apical constriction in the closing Xenopus neural tube. We have diagrammed a model of these results in Figure 6, which suggests that Shroom3-based medial actomyosin contractility facilitates apical constriction among groups of cells, while junctional actomyosin contractility can inhibit apical constriction. Our data suggest the presence of an as yet undefined, Shroom3-dependent positive feedback loop that links medial actin dynamics and apical constriction. The necessity of N-cadherin for apical constriction in the neural ectoderm (Nandadasa et al., 2009) as well as our own previous study of its dynamic localization during neurulation (Baldwin et al., 2022a) suggest that N-cadherin also plays a key role in apical constriction, though one that is not well reflected in our current PLSR models. Future work should focus on higher image and time resolution observations of the interactions between control and shroom3 loss-of-function cells, and detailed analysis of the non-autonomous functions of other neural tube closure genes will also be of great interest.
Figure 6:
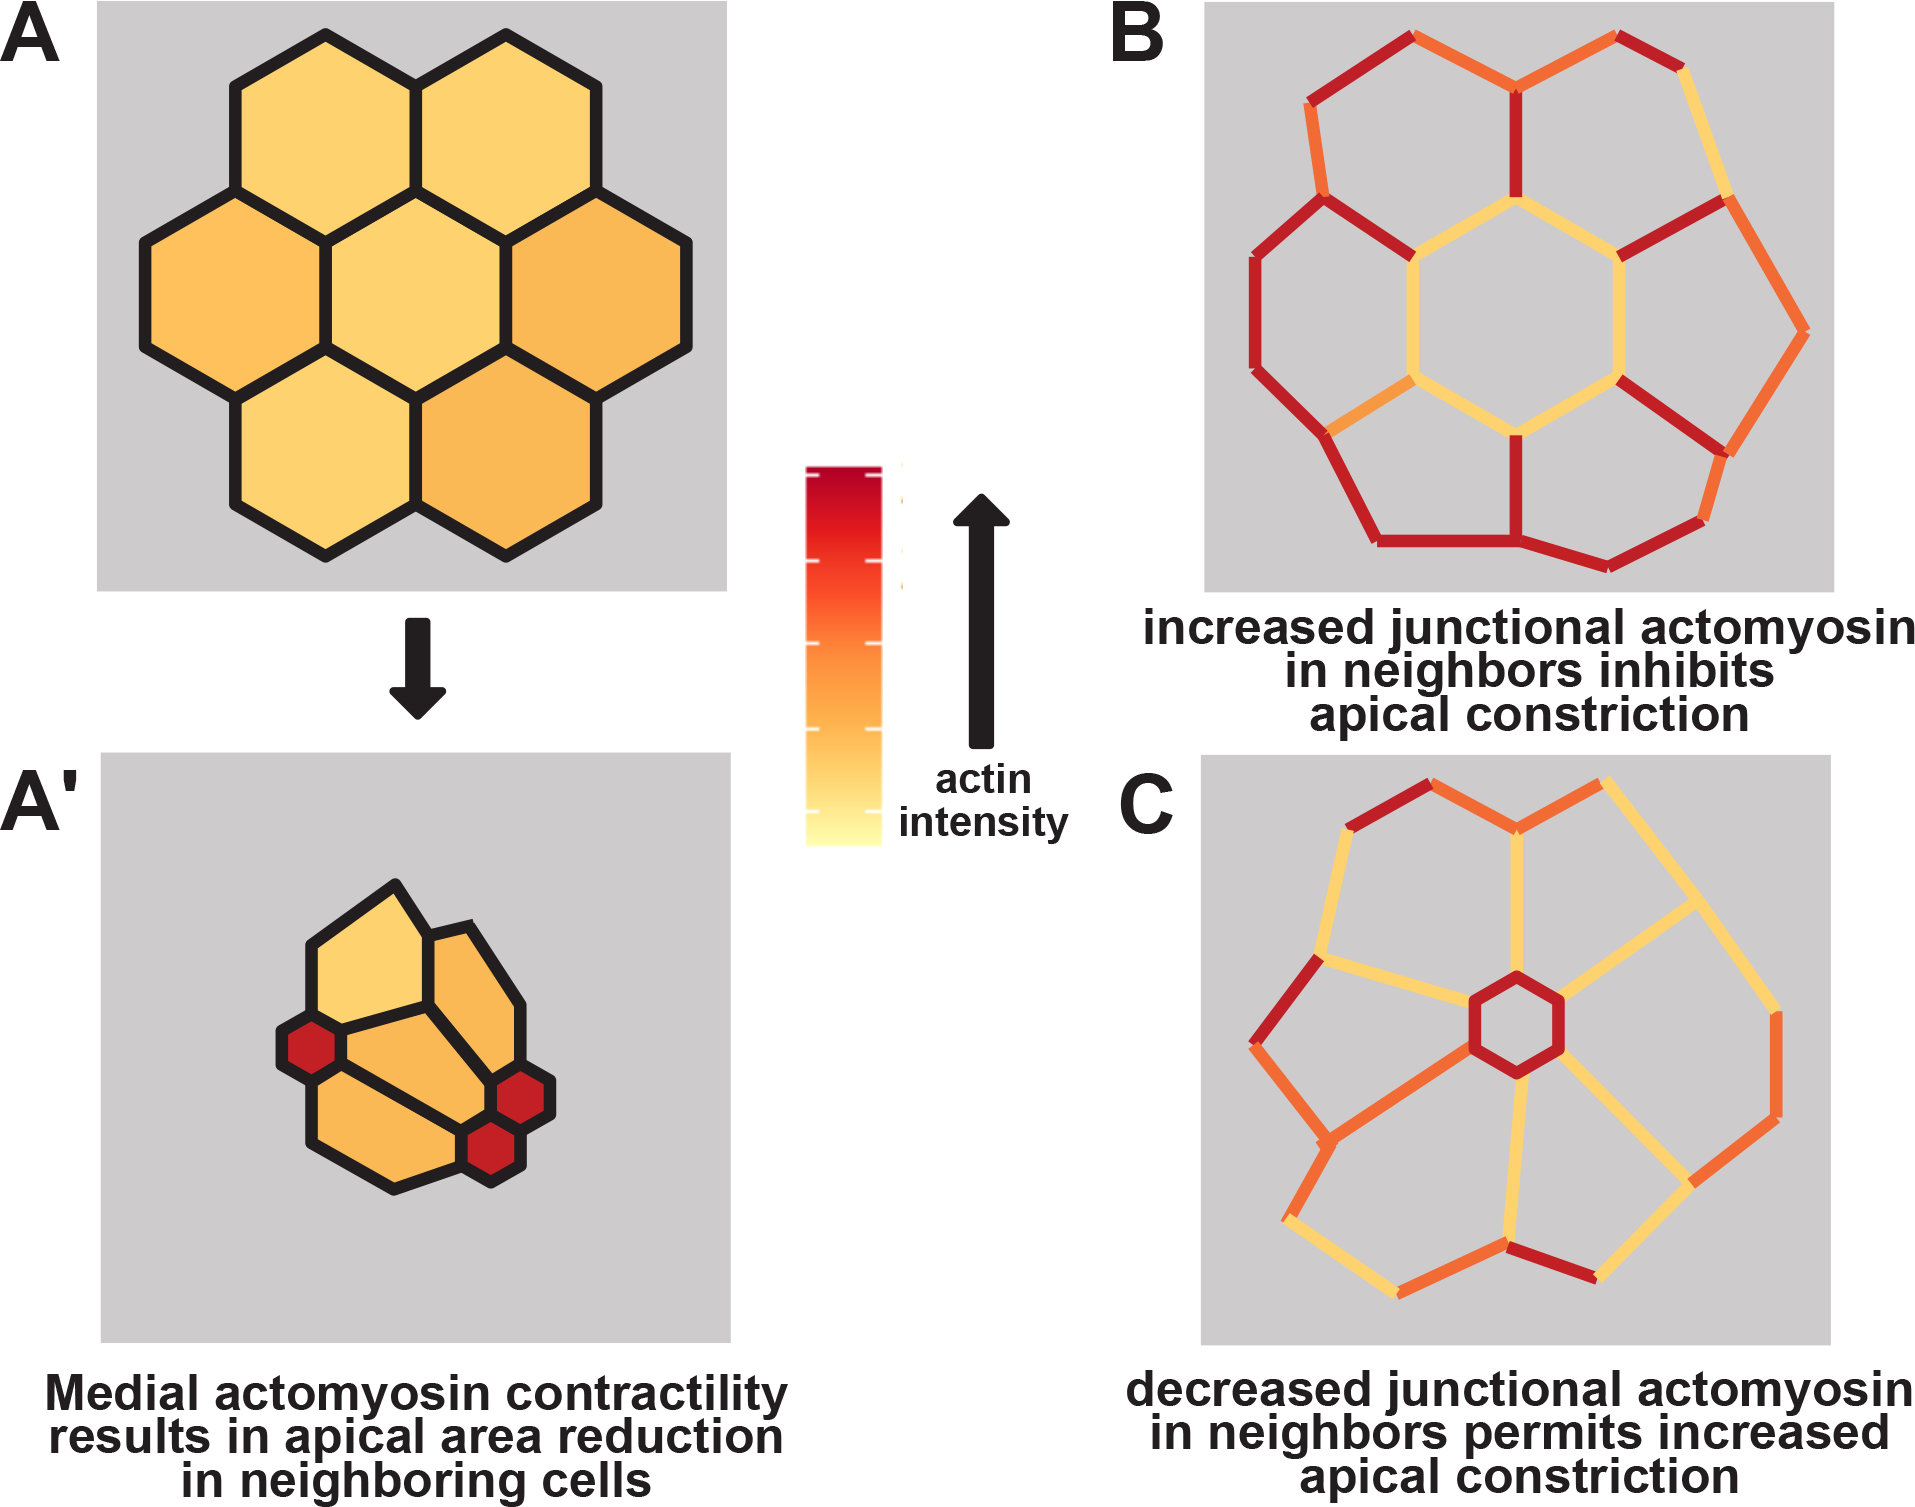
schematic of non-cell autonomous effects of actomyosin contractility. A&A’, strong medial actomyosin contractility in a subset of cells results in apical constriction across a group of cells. B, strong junctional actomyosin contractility in neighboring cells inhibits apical constriction in a central cell. C, weak junctional actomyosin contractility in neighboring cells permits apical constriction in a central cell.
Supplementary Material
Figure S1: Additional PLSR models. A, partial least squares regression (PLSR) of apical area in control cells in the anterior neural ectoderm, including cell orientation. Regression coefficients represent the independent effect of each variable on apical surface area. P-values for each regression component were calculated via jackknife resampling. B, partial least squares regression (PLSR) of apical area in control cells in the anterior neural ectoderm, excluding N-cadherin localization. Regression coefficients represent the independent effect of each variable on apical surface area. P-values for each regression component were calculated via jackknife resampling.
Figure S2: Mosaic patterns of shroom3 loss and corresponding apical constriction phenotypes. Red = control cells, blue = shroom3 crispant cells Left panels, tissue geometry of shroom3 crispant cells in each embryo in this study. Vertical white lines represent approximate location of the embryonic midline in each embryo. Right panels, change in apical area among control and shroom3 crispant cells both within clones (left) and at the mosaic interface (right) in each embryo in this study. Red violins = control cells, blue violins = shroom3 crispant cells. Each dot is an individual cell. Horizontal lines within each violin delineate quartiles along each distribution. s.d. = standard deviations.
Figure S3: Relative sizes and orientations of control vs shroom3 crispant cell cells. A & B, initial and final sizes of cells in square microns. Red violins = control cells, blue violins = shroom3 crispant cells. Each dot is an individual cell. Horizontal lines within each violin delineate quartiles along each distribution. Median value in each group is listed at the top of the panel. P-values were calculated via KS test.
Acknowledgements:
We thank Robert Huebner, Elle Roberson, Caitlin Devitt, and Haleigh Mendiola for critical reading. This work was supported by the NICHD, including R01HD099191 to JBW and F32HD094521 to A.B.
References:
- Adler PN, Taylor J, Charlton J, 2000. The domineering non-autonomy of frizzled and van Gogh clones in the Drosophila wing is a consequence of a disruption in local signaling. Mech Dev 96, 197–207. [DOI] [PubMed] [Google Scholar]
- Aigouy B, Cortes C, Liu S, Prud’Homme B, 2020. EPySeg: a coding-free solution for automated segmentation of epithelia using deep learning. Development 147. [DOI] [PMC free article] [PubMed] [Google Scholar]
- Aigouy B, Farhadifar R, Staple DB, Sagner A, Roper JC, Julicher F, Eaton S, 2010. Cell flow reorients the axis of planar polarity in the wing epithelium of Drosophila. Cell 142, 773–786. [DOI] [PubMed] [Google Scholar]
- Aigouy B, Umetsu D, Eaton S, 2016. Segmentation and Quantitative Analysis of Epithelial Tissues. Methods Mol Biol 1478, 227–239. [DOI] [PubMed] [Google Scholar]
- Baldwin AT, Kim J, Seo H, Wallingford JB, 2022a. Global analysis of cell behavior and protein localization dynamics reveals region-specific functions for Shroom3 and N-cadherin during neural tube closure. Elife (Cambridge) 11, e66704. [DOI] [PMC free article] [PubMed] [Google Scholar]
- Baldwin AT, Popov IK, Wallingford JB, Chang C, 2022b. Assays for Apical ConstrictionApicalconstriction Using the Xenopus Model, in: Chang C., Wang J. (Eds.), Cell Polarity Signaling: Methods and Protocols. Springer US, New York, NY, pp. 415–437. [Google Scholar]
- Chan EH, Chavadimane Shivakumar P, Clément R, Laugier E, Lenne P-F, 2017. Patterned cortical tension mediated by N-cadherin controls cell geometric order in the Drosophila eye. Elife (Cambridge) 6, e22796. [DOI] [PMC free article] [PubMed] [Google Scholar]
- Chanet S, Miller CJ, Vaishnav ED, Ermentrout B, Davidson LA, Martin AC, 2017. Actomyosin meshwork mechanosensing enables tissue shape to orient cell force. Nat Commun 8, 15014. [DOI] [PMC free article] [PubMed] [Google Scholar]
- Christodoulou N, Skourides PA, 2015. Cell-Autonomous Ca(2+) Flashes Elicit Pulsed Contractions of an Apical Actin Network to Drive Apical Constriction during Neural Tube Closure. Cell Rep 13, 2189–2202. [DOI] [PubMed] [Google Scholar]
- de Jong S, 1993. SIMPLS: An alternative approach to partial least squares regression. Chemometrics and Intelligent Laboratory Systems 18, 251–263. [Google Scholar]
- Franke JD, Montague RA, Kiehart DP, 2005. Nonmuscle myosin II generates forces that transmit tension and drive contraction in multiple tissues during dorsal closure. Curr Biol 15, 2208–2221. [DOI] [PubMed] [Google Scholar]
- Galea GL, Maniou E, Edwards TJ, Marshall AR, Ampartzidis I, Greene NDE, Copp AJ, 2021. Cell non-autonomy amplifies disruption of neurulation by mosaic Vangl2 deletion in mice. Nat Commun 12, 1159. [DOI] [PMC free article] [PubMed] [Google Scholar]
- Haigo SL, Hildebrand JD, Harland RM, Wallingford JB, 2003. Shroom induces apical constriction and is required for hingepoint formation during neural tube closure. Curr Biol 13, 2125–2137. [DOI] [PubMed] [Google Scholar]
- Harris MJ, Juriloff DM, 2007. Mouse mutants with neural tube closure defects and their role in understanding human neural tube defects. Birth Defects Res A Clin Mol Teratol 79, 187–210. [DOI] [PubMed] [Google Scholar]
- Harris MJ, Juriloff DM, 2010. An update to the list of mouse mutants with neural tube closure defects and advances toward a complete genetic perspective of neural tube closure. Birth Defects Res A Clin Mol Teratol 88, 653–669. [DOI] [PubMed] [Google Scholar]
- Hildebrand JD, 2005. Shroom regulates epithelial cell shape via the apical positioning of an actomyosin network. J Cell Sci 118, 5191–5203. [DOI] [PubMed] [Google Scholar]
- Hildebrand JD, Soriano P, 1999. Shroom, a PDZ domain-containing actin-binding protein, is required for neural tube morphogenesis in mice. Cell 99, 485–497. [DOI] [PubMed] [Google Scholar]
- Horb M, Wlizla M, Abu-Daya A, McNamara S, Gajdasik D, Igawa T, Suzuki A, Ogino H, Noble A, Robert J, James-Zorn C, Guille M, 2019. Xenopus Resources: Transgenic, Inbred and Mutant Animals, Training Opportunities, and Web-Based Support. Frontiers in physiology 10, 387. [DOI] [PMC free article] [PubMed] [Google Scholar]
- James KE, Dorman JB, Berg CA, 2002. Mosaic analyses reveal the function of Drosophila Ras in embryonic dorsoventral patterning and dorsal follicle cell morphogenesis. Development 129, 2209–2222. [DOI] [PubMed] [Google Scholar]
- Janes KA, Albeck JG, Gaudet S, Sorger PK, Lauffenburger DA, Yaffe MB, 2005. A systems model of signaling identifies a molecular basis set for cytokine-induced apoptosis. Science 310, 1646–1653. [DOI] [PubMed] [Google Scholar]
- Janes KA, Yaffe MB, 2006. Data-driven modelling of signal-transduction networks. Nat Rev Mol Cell Biol 7, 820–828. [DOI] [PubMed] [Google Scholar]
- Kennedy D, Chitayat D, Winsor EJ, Silver M, Toi A, 1998. Prenatally diagnosed neural tube defects: ultrasound, chromosome, and autopsy or postnatal findings in 212 cases. American journal of medical genetics 77, 317–321. [DOI] [PubMed] [Google Scholar]
- Laplante C, Nilson LA, 2006. Differential expression of the adhesion molecule Echinoid drives epithelial morphogenesis in <em>Drosophila</em>. Development 133, 3255. [DOI] [PubMed] [Google Scholar]
- Lecuit T, Yap AS, 2015. E-cadherin junctions as active mechanical integrators in tissue dynamics. Nat Cell Biol 17, 533–539. [DOI] [PubMed] [Google Scholar]
- Martin AC, Goldstein B, 2014. Apical constriction: themes and variations on a cellular mechanism driving morphogenesis. Development 141, 1987–1998. [DOI] [PMC free article] [PubMed] [Google Scholar]
- Martin AC, Kaschube M, Wieschaus EF, 2009. Pulsed contractions of an actin-myosin network drive apical constriction. Nature 457, 495–499. [DOI] [PMC free article] [PubMed] [Google Scholar]
- McGreevy EM, Vijayraghavan D, Davidson LA, Hildebrand JD, 2015. Shroom3 functions downstream of planar cell polarity to regulate myosin II distribution and cellular organization during neural tube closure. Biol Open 4, 186–196. [DOI] [PMC free article] [PubMed] [Google Scholar]
- McMillen P, Chatti V, Jülich D, Holley SA, 2016. A Sawtooth Pattern of Cadherin 2 Stability Mechanically Regulates Somite Morphogenesis. Curr Biol 26, 542–549. [DOI] [PMC free article] [PubMed] [Google Scholar]
- Mevik B-H, Wehrens R, 2007. The pls Package: Principal Component and Partial Least Squares Regression in R. 2007 18, 23. [Google Scholar]
- Nandadasa S, Tao Q, Menon NR, Heasman J, Wylie C, 2009. N- and E-cadherins in Xenopus are specifically required in the neural and non-neural ectoderm, respectively, for F-actin assembly and morphogenetic movements. Development 136, 1327–1338. [DOI] [PMC free article] [PubMed] [Google Scholar]
- Nieuwkoop PD, Faber J, 1994. Normal table of Xenopus laevis (Daudin): A systematical and chronological survey of the development from the fertilized egg till the end of metamorphosis. Garland Pub, New York. [Google Scholar]
- Ota R, Ide T, Michiue T, 2018. A novel cell segmentation method for developing embryos using machine learning. bioRxiv, 288720. [DOI] [PubMed] [Google Scholar]
- Ota R, Ide T, Michiue T, 2021. A rapid segmentation method of cell boundary for developing embryos using machine learning with a personal computer. Development, Growth & Differentiation 63, 406–416. [DOI] [PubMed] [Google Scholar]
- Palermo G, Piraino P, Zucht H-D, 2009. Performance of PLS regression coefficients in selecting variables for each response of a multivariate PLS for omics-type data. Adv Appl Bioinform Chem 2, 57–70. [DOI] [PMC free article] [PubMed] [Google Scholar]
- Phillips HM, Hildreth V, Peat JD, Murdoch JN, Kobayashi K, Chaudhry B, Henderson DJ, 2008. Non-cell-autonomous roles for the planar cell polarity gene Vangl2 in development of the coronary circulation. Circ Res 102, 615–623. [DOI] [PubMed] [Google Scholar]
- Plageman TF Jr., Zacharias AL, Gage PJ, Lang RA, 2011. Shroom3 and a Pitx2-N-cadherin pathway function cooperatively to generate asymmetric cell shape changes during gut morphogenesis. Dev Biol 357, 227–234. [DOI] [PMC free article] [PubMed] [Google Scholar]
- R Core Team, 2020. R: A Language and Environment for Statistical Computing. R Foundation for Statistical Computing, Vienna, Austria. [Google Scholar]
- Rocha PP, Bleiss W, Schrewe H, 2010. Mosaic expression of Med12 in female mice leads to exencephaly, spina bifida, and craniorachischisis. Birth Defects Res A Clin Mol Teratol 88, 626–632. [DOI] [PubMed] [Google Scholar]
- Roh-Johnson M, Shemer G, Higgins CD, McClellan JH, Werts AD, Tulu US, Gao L, Betzig E, Kiehart DP, Goldstein B, 2012. Triggering a cell shape change by exploiting preexisting actomyosin contractions. Science 335, 1232–1235. [DOI] [PMC free article] [PubMed] [Google Scholar]
- Schindelin J, Arganda-Carreras I, Frise E, Kaynig V, Longair M, Pietzsch T, Preibisch S, Rueden C, Saalfeld S, Schmid B, Tinevez JY, White DJ, Hartenstein V, Eliceiri K, Tomancak P, Cardona A, 2012. Fiji: an open-source platform for biological-image analysis. Nat Methods 9, 676–682. [DOI] [PMC free article] [PubMed] [Google Scholar]
- Tian T, Cao X, Chen Y, Jin L, Li Z, Han X, Lin Y, Wlodarczyk BJ, Finnell RH, Yuan Z, Wang L, Ren A, Lei Y, 2021. Somatic and de novo Germline Variants of MEDs in Human Neural Tube Defects. Frontiers in cell and developmental biology 9, 641831. [DOI] [PMC free article] [PubMed] [Google Scholar]
- Tian T, Lei Y, Chen Y, Karki M, Jin L, Finnell RH, Wang L, Ren A, 2020. Somatic mutations in planar cell polarity genes in neural tissue from human fetuses with neural tube defects. Hum Genet 139, 1299–1314. [DOI] [PMC free article] [PubMed] [Google Scholar]
- Wallingford JB, Niswander LA, Shaw GM, Finnell RH, 2013. The continuing challenge of understanding, preventing, and treating neural tube defects. Science 339, 1222002. [DOI] [PMC free article] [PubMed] [Google Scholar]
- Wickham H, Averick M, Bryan J, Chang W, D’Agostino McGowan L, François R, Grolemund G, Hayes A, Henry L, Hester J, Kuhn M, Pedersen TL, Miller E, Bache SM, Müller K, Robinson D, Seidel DP, Spinu V, Takahashi K, Vaughan D, Wilke C, Woo K, Yutani H, 2019. Welcome to the Tidyverse. Journal of Open Source Software. [Google Scholar]
- Wlizla M, McNamara S, Horb ME, 2018. Generation and Care of Xenopus laevis and Xenopus tropicalis Embryos. Methods Mol Biol 1865, 19–32. [DOI] [PMC free article] [PubMed] [Google Scholar]
Associated Data
This section collects any data citations, data availability statements, or supplementary materials included in this article.
Supplementary Materials
Figure S1: Additional PLSR models. A, partial least squares regression (PLSR) of apical area in control cells in the anterior neural ectoderm, including cell orientation. Regression coefficients represent the independent effect of each variable on apical surface area. P-values for each regression component were calculated via jackknife resampling. B, partial least squares regression (PLSR) of apical area in control cells in the anterior neural ectoderm, excluding N-cadherin localization. Regression coefficients represent the independent effect of each variable on apical surface area. P-values for each regression component were calculated via jackknife resampling.
Figure S2: Mosaic patterns of shroom3 loss and corresponding apical constriction phenotypes. Red = control cells, blue = shroom3 crispant cells Left panels, tissue geometry of shroom3 crispant cells in each embryo in this study. Vertical white lines represent approximate location of the embryonic midline in each embryo. Right panels, change in apical area among control and shroom3 crispant cells both within clones (left) and at the mosaic interface (right) in each embryo in this study. Red violins = control cells, blue violins = shroom3 crispant cells. Each dot is an individual cell. Horizontal lines within each violin delineate quartiles along each distribution. s.d. = standard deviations.
Figure S3: Relative sizes and orientations of control vs shroom3 crispant cell cells. A & B, initial and final sizes of cells in square microns. Red violins = control cells, blue violins = shroom3 crispant cells. Each dot is an individual cell. Horizontal lines within each violin delineate quartiles along each distribution. Median value in each group is listed at the top of the panel. P-values were calculated via KS test.


